Terapias psicológicas para pacientes con trastorno límite de la personalidad
Appendices
Appendix 1. DSM diagnostic criteria for BPD (301.83)
| DSM ‐ Third Edition (DSM‐III;APA 1980) | DSM ‐ Fourth Edition ‐ Text Revision (DSM‐IV‐TR;APA 2000) | DSM ‐ Fifth Edition (DSM‐5;APA 2013) |
|---|---|---|
| 301.83 BPD | 301.83 BPD | 301.83 BPD |
| Diagnostic criterion A | ||
| 5 of the following are required
| A pervasive pattern of instability of interpersonal relationships, self‐image, and affects, and marked impulsivity beginning by early adulthood and present in a variety of contexts, as indicated by 5 (or more) of the following
| A pervasive pattern of instability of interpersonal relationships, self‐image, and affects and marked impulsivity, beginning by early adulthood and present in a variety of contexts, as indicated by 5 (or more) of the following
|
| Diagnostic criterion B | ||
| If under 18, does not meet the criteria for identity disorder | ‐ | ‐ |
| BPD: Borderline personality disorder; DSM: Diagnostic and Statistical Manual of Mental Disorders | ||
Appendix 2. ICD‐10 research criteria for emotionally unstable personality disorder (F60.3)
| F60.30: Emotionally unstable personality disorder, impulsive type | F60.31: Emotionally unstable personality disorder, borderline type |
|---|---|
| Diagnostic criterion A | |
| The general criteria of personality disorder (F60) must be met | The general criteria of personality disorder (F60) must be met |
| Diagnostic criterion B | |
| At least 3 of the following must be present, 1 of which is 2 1. Marked tendency to act unexpectedly and without consideration of the consequences 2. Marked tendency to quarrelsome behaviour and to conflicts with others, especially when impulsive acts are thwarted or criticised 3. Liability of outbursts of anger or violence, with inability to control the resulting behavioural explosions 4. Difficulty in maintaining any course of action that offers no immediate reward 5. Unstable and capricious mood | At least 3 of the symptoms mentioned above in criterion B (F60.30) must be present, and, in addition, at least 2 of the following 6. Disturbances in, and uncertainty about, self‐image, aims and internal preferences (including sexual) 7. Liability to become involved in intense and unstable relationships, often leading to emotional crises 8. Excessive efforts to avoid abandonment 9. Recurrent threats or acts of self‐harm 10. Chronic feelings of emptiness |
| ICD‐10: International Classification of Diseases, Tenth Edition | |
Appendix 3. Search strategies
Cochrane Central Register of Controlled Trials, in the Cochrane Library
#1 MeSH descriptor: [Borderline Personality Disorder] explode all trees
#2 borderline next state*
#3 borderline next personalit*
#4 "axis II" or "cluster B"
#5 idealization next devaluation
#6 (vulnerable or hyperbolic) next temper*
#7 (((unstab* or instab* or poor or disturb* or fail* or weak* or dysregulat*) next (self* or impuls* or interperson* or identit* or relation* or emotion* or affect*)) and (person* or character or PD))
#8 impulsiv* near personalit*
#9 (self next (injur* or damag* or destruct* or harm* or hurt* or mutilat*))
#10 suicidal next behavio?r
#11 (feel* next (empt* or bored*))
#12 (anger next control*)
#13 (risk‐taking next (behavior or behaviour))
#14 #1 or #2 or #3 or #4 or #5 or #6 or #7 or #8 or #9 or #10 or #11 or #12 or #13
Medline Ovid
1 Borderline Personality Disorder/
2 ((borderline or border‐line) adj3 (state* or personalit*)).kf,tw.
3 ("Axis II" or "Cluster B" or flamboyant or "F60.3" or "F60.30" or "F60.31").kf,tw.
4 (idealization adj5 devaluation).kf,tw.
5 ((vulnerable or hyperbolic) adj3 temperament).kf,tw.
6 (((unstab* or instab* or poor or disturb* or fail* or weak or dysregulat*) adj3 (self* or impuls* or interperson* or identit* or relationship* or emotion* or affect*)) and (personality or character or PD)).kf,tw.
7 (impulsiv* adj5 (behavio?r or character or personalit*)).kf,tw.
8 (self adj3 (injur* or damag* or destruct* or harm* or hurt* or mutilat*)).kf,tw.
9 (suicidal adj3 behavio?r).kf,tw.
10 (feel* adj3 (empt* or bored*)).kf,tw.
11 (anger adj5 control*).kf,tw.
12 (risk‐taking adj3 behavio?r).kf,tw.
13 or/1‐12
14 randomised controlled trial.pt.
15 controlled clinical trial.pt.
16 randomi#ed.ab.
17 placebo.ab.
18 randomly.ab.
19 trial.ab.
20 groups.ab.
21 drug therapy.fs.
22 or/14‐21
23 exp Animals/ not Humans/
24 22 not 23
25 13 and 24
Embase Ovid
1 borderline state/
2 ((borderline or border‐line) adj3 (personalit* or state*)).kw,tw.
3 ("Axis II" or "Cluster B" or flamboyant or "F60.3" or "F60.30" or "F60.31").kw,tw.)
4 (idealization adj5 devaluation).kw,tw.
5 ((vulnerable or hyberbolic) adj3 temperament).kw,tw.
6 (((unstab* or instab* or poor or disturb* or fail* or weak or dysregulat*) adj3 (self* or impuls* or interperson* or identit* or relationship* or emotion* or affect*)) and (personality or character or PD)).kw,tw.
7 (impulsiv* adj5 (behavio?r or character or personalit*)).kw,tw.
8 (self adj3 (injur* or damag* or destruct* or harm* or hurt* or mutilat*)).kw,tw.
9 (suicidal adj3 (behavior or behaviour)).kw,tw.
10 (feel* adj3 (empt* or bored*)).kw,tw.
11 "anger adj5 control*".kw,tw.
12 (risk‐taking adj3 (behavior or behaviour)).kw,tw.
13 or/1‐12
14 randomised controlled trial/
15 double blind procedure/
16 crossover procedure/
17 single blind procedure/
18 (random* or factorial* or crossover* or cross‐over* or placebo* or double‐blind* or doubleblind* or single‐blind* or singleblind* or assign* or allocat* or volunteer*).ab,pt,sh,de,ti.
19 or/14‐18
20 13 and 19
CINAHL EBSCOhost (Cumulative Index to Nursing and Allied Health Literature
S1 (MH "Borderline Personality Disorder")
S2 TX borderline N3 (state* or personalit*)
S3 TX "Axis II" OR "Cluster B"
S4 TX idealization N3 devaluation
S5 TX ((vulnerable OR hyperbolic) N3 temperament)
S6 TX (((unstab* or instab* or poor or disturb* or fail* or weak or dysregulat*) N3 (self or impuls* or interperson* or identit* or relationship* or emotion* or affect*)) AND (person* or character or PD))
S7 TX (impulsiv* N3 (behavio?r OR character or personalit*))
S8 TX (feel* N3 (empt* OR bored*))
S9 S1 OR S2 OR S3 OR S4 OR S5 OR S6 OR S7 OR S8
S10 (MH "randomised Controlled Trials") OR (MH "Random Assignment") OR (MH "Random Sample+")
S11 TX random* N4 (trial* OR study OR studies)
S12 TX random* N4 (allocat* OR allot* OR assign* OR basis OR divid* OR order)
S13 AB placebo*
S14 AB trial
S15 (MH "Drug Therapy+")
S16 S10 OR S11 OR S12 OR S13 OR S14 OR S15
S17 S9 AND S16
PsycINFO Ovid
1 exp Borderline Personality Disorder/
2 borderline adj3 (personalit* or state*).id,ti,ab.
3 ("Axis II" or "Cluster B").id,ti,ab.
4 (idealization adj5 devaluation).ab,id,ti.
5 ((vulnerable or hyperbolic) adj3 temperament).id,ab,ti.
6 (((unstab* or instab* or poor or disturb* or fail* or weak or dysregulat*) adj3 (self* or impuls* or interperson* or identit* or relationship* or emotion* or affect*)) and (personality or character or PD)).id,ab,ti.
7 (impulsiv* adj5 (behavio?r or character or personalit*)).id,ab,ti.
8 (self adj3 (injur* or damag* or destruct* or harm* or hurt* or mutilat*)).id,ab,ti.
9 (suicidal adj3 behavio?r).id,ab,ti.
10 (feel* adj3 (empt* or bored*)).ab,id,ti.
11 "anger adj5 control*".ab,id,ti.
12 (risk‐taking adj3 behavio?r).id,ab,ti.
13 or/1‐12
14 exp Clinical Trials/ (
15 (random* adj allocat*).ab.
16 randomi?ed.ab.
17 placebo.ab.
18 randomly.ab.
19 trial.ab.
20 groups.ab.
21 drug therapy.sh.
22 exp Animals/ not Humans/
23 or/14‐21
24 23 not 22
25 13 and 24
ERIC EBSCOhost (Education Resources Information Center)
S23 S11 OR S12 OR S13 OR S14 OR S15 OR S16 OR S17 OR S18 OR S19 OR S20 OR S21 OR S22
S22 TX risk‐taking N5 behaviour
S21 TX anger N5 control*
S20 TX feel* N3 (empt* or bored*)
S19 TX suicidal N3 behavior
S18 TX ( (unstab* or instab* or poor or disturb* or fail* or weak or dysregulat*) N3 TX (self or impuls* or interperson* or identit* or relationship* or emotion* or affect*)) AND TX ( personality OR character OR PD )
S17 AB (self AND (injur* or damag* or destruct* or harm or hurt* or mutilat*))
S16 AB impulsivity
S15 TI impulsivity
S14 TX impulsiv* N3 person*
S13 TX "Axis II" OR "Cluster B"
S12 TX borderline N3 state
S11 TX borderline personality
S10 S1 OR S2 OR S3 OR S4 OR S5 OR S6 OR S7 OR S8 OR S9
S9 AB drug
S8 AB trial
S7 AB randomly
S6 AB placebo
S5 AB randomi?ed
S4 AB controlled clinical trial*
S3 SU controlled clinical trial
S2 TX controlled clinical trial
S1 DE "randomised Controlled Trials"
BIOSIS Previews Web of Science Clarivate Analytics (1969 to 20 March 2019)
#1 TOPIC: (borderline personality disorder)
#2 TOPIC: ((borderline NEAR/3 (state))
#3 TOPIC: ((borderline NEAR/3 personalit*))
#4 TOPIC: (("Axis II" OR "Cluster B"))
#5 TOPIC: (idealization NEAR/5 devaluation)
#6 TOPIC: ((vulnerable OR hyperbolic) NEAR/3 temperament*)
#7 TOPIC: (impulsiv* NEAR/5 personalit*)
#8 TOPIC: ((self NEAR/3 (injur* OR damag* OR destruct* OR harm* OR hurt* OR mutilat*)))
#9 TOPIC: ((((unstab* OR instab* OR poor OR disturb* OR fail* OR weak OR dysregulat*) NEAR/3 (self* OR impuls* OR interperson* OR identit* OR relationship* OR emotion* OR affect*)) AND (personality OR character OR PD)))
#10 TOPIC: (suicidal NEAR/3 behavio?r)
#11 TOPIC: (((feel* NEAR/3 (empt* OR bored*))))
#12 TOPIC: ((anger NEAR/5 control*))
#13 TOPIC: (risk‐taking NEAR/3 behavio?r)
#14 #13 OR #12 OR #11 OR #10 OR #9 OR #8 OR #7 OR #6 OR #5 OR #4 OR #3 OR #2 OR #1
#15 TOPIC: (controlled clinical trial)
#16 TOPIC: (randomised controlled trial)
#17 #16 OR #15
#18 #17 AND #14
Web of Science Core Collection Clarivate Analytics
#18 #17 AND #14
#17 #16 OR #15
#16 TOPIC: (controlled clinical trial)
#15 TOPIC: (randomised controlled trial)
#14 #13 OR #12 OR #11 OR #10 OR #9 OR #8 OR #7 OR #6 OR #5 OR #4 OR #3 OR #2 OR #1
#13 TITLE: ((risk‐taking NEAR/3 behavio?r))
#12 TOPIC: ((risk‐taking NEAR/3 behavio?r))
#11 TITLE: ((anger NEAR/5 control*))
#10 TOPIC: ((feel* NEAR/3 (empt* OR bored*)))
#9 TITLE: ((feel* NEAR/3 (empt* OR bored*)))
#8 TITLE: (suicidal NEAR/3 behavio?r)
#7 TITLE: (impulsivity)
#6 TOPIC: ((((unstab* OR instab* OR poor OR disturb* OR fail* OR weak OR dysregulat*) NEAR/3 (self* OR impuls* OR interperson* OR identit* OR relationship* OR emotion* OR affect*)) AND (personality OR character OR PD)))
#5 TOPIC: ((vulnerable or hyperbolic) NEAR/3 temperament)
#4 TOPIC: ((idealization NEAR/5 devaluation))
#3 TOPIC: ("axis II" OR "Cluster B")
#2 TOPIC: (borderline NEAR/3 state)
#1 TOPIC: (borderline personality disorder)
Sociological Abstracts ProQuest
(((randomised controlled trial) OR (controlled clinical trial) OR SU.exact("CLINICAL TRIALS")) OR AB(randomi?ed) OR AB(randomly) OR AB(placebo) OR AB(trial)) AND ((borderline personality) OR "axis II" OR "Cluster B" OR (idealization AND devaluation) OR ((vulnerable OR hyperbolic) AND temperament) OR (((unstab* OR instab* or poor or disturb* or fail* or weak or dysregulat*) AND (self* or impuls* or interperson* or identit* or relationship* or emotion* or affect*)) AND (personality OR character OR PD)) OR (self AND (injur* OR damag* OR destruct* OR harm OR hurt* OR mutilat*)) OR "suicidal behavio?r" OR "self destructive behavio?r" OR (feel* AND (empt* OR bored*)))
LILACS (Latin American and Caribbean Health Science Information Database)
“Borderline personality disorder”, limits: Controlled clinical study
ProQuest Dissertations A&I
(SU(borderline personality disorder) OR AB("Axis II") OR AB("Cluster B")) AND (("randomised controlled study" OR "controlled clinical study") OR AB(randomi?ed) OR AB(placebo) OR AB(randomly))
OpenGrey:
“Borderline personality disorder”
NDLTD
“Borderline personality disorder”
DART Europe E‐theses portal
“Borderline personality disorder”
ANZCTR
“Borderline personality disorder”
ClinicalTrials.gov
“Borderline personality disorder”
ISRCTN
“Borderline personality disorder”
WHO ICTRP:
“Borderline personality disorder”
UK Clinical Trials Gateway
“Borderline personality disorder”
EU Clinical Trials Register
“Borderline personality disorder”
Library HubDiscover (previously COPAC)
“Borderline personality disorder”
Appendix 4. Table of outcomes
Primary outcomes
1. BPD symptom severity
| Name of scale/means of assessment | Abbreviation | Clinician‐rated (CR)/self‐rated (SR) | Study |
|---|---|---|---|
| Borderline Personality Disorder Checklist ‐ 40 | BDP‐40 | SR | |
| Borderline Evaluation of Severity over Time | BEST | SR | Blum 2008 (12‐month follow‐up data); Gratz 2006; Gratz 2014; Gregory 2008b; Morton 2012 |
| Borderline Personality Disorder Features Scale | BPDFS | SR | |
| Borderline Personality Features Scale for Children | BPFS‐C | SR | |
| Borderline Personality Inventory | BPI | SR | |
| Borderline Personality Disorder Severity Index ‐ 4th Edition | BPDSI‐IV | CR | Bellino 2010; Giesen‐Bloo 2006; Kamalabadi 2012; Laurenssen 2018; Leppänen 2016; Nadort 2009; Philips 2018; Sinnaeve 2018 |
| Borderline Personality Disorder Severity Index ‐ 4th Edition for adolescents | BPDSI‐IV‐adol | CR | |
| Borderline Syndrome Index | BSI | SR | |
| Borderline Symptom List ‐ 23 items | BSL‐23 | SR | Carmona í Farrés 2019; Elices 2016; Feliu‐Soler 2017; McMain 2017; Kramer 2014; Pascual 2015; Schilling 2018 |
| Clinical Global Impression scale for Borderline Personality Disorder patients | CGI‐BPD | CR | |
| International Personality Disorder Examination ‐ Borderline Personality Disorder criteria | IPDE‐BPD | CR | |
| Millon Adolescent Clinical Inventory | MACI | CR | |
| Personality Assessment Inventory ‐ Borderline Scale | PAI‐BOR | SR | |
| Structured Clinical Interview for DSM‐IV Axis II Personality Disorders, Number of borderline criteria met | SCID‐II, Number of borderline criteria met | CR | Doering 2010; Jørgensen 2013; Koons 2001a; Kredlow 2017a; Kredlow 2017b |
| Structured Clinical Interview for DSM‐IV Axis II Personality Disorders, Still meeting borderline criteria | SCID‐II, Still meeting borderline criteria | CR | |
| Zanarini Rating Scale for Borderline Personality Disorder | ZAN‐BPD | CR | Bateman 1999; Blum 2008 (post‐treatment data); Gratz 2014; McMain 2009; Priebe 2012; Reneses 2013; Robinson 2016; Zanarini 2018 |
2. Self‐harm
| Name of scale/means of assessment | Abbreviation | Clinician‐rated (CR)/self‐rated (SR) | Study |
|---|---|---|---|
| Borderline Personality Disorder Severity Index ‐ 4th Edition, Parasuicidal Behaviour | BPDSI‐IV, parasuicidal behaviour | CR | |
| Cornell Interview for Suicidal and Self‐Harming Behavior‐Self‐Report | CISSB | SR | |
| Days of self‐harm and type of deliberate self‐harm were recorded in an interview on a structured form | None | None | |
| Deliberate Self‐Harm Inventory | DSHI | SR | |
| Deliberate Self‐Harm Inventory ‐ Short Form | DSHI‐SF | SR | |
| Deliberate Self‐Harm Inventory ‐ participants with self‐harm during previous 12 months | DSHI ‐ participants with self‐harm | SR | |
| Lifetime Parasuicide Count ‐ Self‐Mutilative Accts | LPC | CR | |
| Number of self‐harming incidents during previous 12‐month period | Unclear | Unclear | |
| Number of self‐harming acts during previous three‐month period | Unclear | Unclear | |
| Suicide and Self‐Harm Inventory ‐ number of patients with self‐harming behaviour during previous six‐month period | SSHI ‐ patients with self‐harm | CR | |
| Personality Assessment Inventory, Borderline Features Scale ‐ Self‐Harm | PAI‐BOR‐S | SR | |
| Parasuicide History Interview ‐ deliberate self‐harm frequency | PHI ‐ deliberate self‐harm frequency | CR | |
| Parasuicide History Interview ‐ patients with self‐harming behaviour during previous 12‐month period | PHI ‐ patients with self‐harm | CR | |
| Risk‐Taking and Self‐Harm Inventory ‐ participants with self‐harming behaviour | RTSHI ‐ patients with self‐harm | SR | |
| Suicide Attempt and Self‐Injury Interview, Non‐Suicidal Self‐Injury scale | SASII ‐ NSSI/self‐harm | CR | |
| Suicide Attempt and Self‐Injury Interview ‐ number of suicidal and self‐injurious episodes | SASII ‐ suicidal and self‐injurious episodes | CR | |
| Self‐Harming Behaviours Checklist | SHBCL | CR | |
| Self‐Harm Questionnaire ‐ number of suicidal and self‐injurious episodes | SHQ ‐ suicidal and self‐injurious episodes | SR | |
| Target Behaviour Rating ‐ frequency of parasuicide | TBR ‐ frequency of parasuicide | CR |
3. Suicide‐related outcomes
| Name of scale/means of assessment | Abbreviation | Clinician‐rated (CR)/self‐rated (SR) | Study |
|---|---|---|---|
| The 12‐item Adult Suicidal Ideation Questionnaire— Shortened Version | ASIQ‐S | SR | |
| Beck Hopelessness Scale | BHS | SR | |
| Beck Scale for Suicidal Ideation | BSS | SR | |
| Clinical Global Impression scale for Borderline Personality Disorder patients, suicidality | CGI‐BPD, Suicidality | CR | |
| Deliberate Self‐Harm Inventory, suicide attempts (cumulative average) | DSHI, Suicide Attempts (cumulative average) | CR | |
| Lifetime Suicide Attempt Self‐Injury Interview | LSASI | CR | |
| Number of participants with suicide attempt (recorded via direct contact with patients and health care staff, as well as from reviewing the case records) | None | CR | |
| Number of suicide attempts | None | None | |
| Personality Assessment Inventory ‐ suicidal ideation | PAI‐SI | SR | |
| Borderline Personality Disorder Severity Index ‐ 4th Edition, parasuicidality, suicide plans and attempts | BPDSI‐IV, parasuicidality, suicide plans and attempts | CR | |
| Suicidal Behaviours Questionnaire | SBQ | SR | |
| Suicidal Ideation Questionnaire ‐ Junior | SIQ‐JR | SR | |
| Suicide attempt and self‐injury interview, suicide attempts | SASII, suicide attempts | CR | |
| Self‐Harm Inventory (number of participants with life‐threatening suicide attempts in the last 6 months) | SSHI | CR | |
| Overt Aggression Scale ‐ Modified for outpatients, suicidality | OAS‐M, suicidality | CR | |
| Borderline Personality Disorder Severity Index, parasuicidal | BPDSI, parasuicidal | CR |
4. Psychosocial functioning
| Name of scale/means of assessment | Abbreviation | Clinician‐rated (CR)/self‐rated (SR) | Study |
|---|---|---|---|
| Brief Disability Questionnaire, days out of role | BDQ, days out of role | SR | |
| Children's Global Assessment Scalea | C‐GAS | CR | |
| Clinical Global Impressions scale ‐ severity of illness | CGI‐S | CR | |
| Clinical Global Impressions scale ‐ improvement ‐ self‐rated | CGI‐I‐SR | SR | |
| Dutch version of the Health of the Nations Outcome Scales | HoNOS | CR | |
| Clinical Outcomes in Routine Evaluation – outcome measure, Functioning subscale | CORE‐OM, Functioning subscale | SR | |
| Global Assessment of Functioning scalea | GAF | CR | Amianto 2011; Antonsen 2017; Bohus 2013; Doering 2010; Farrell 2009; Kredlow 2017b; Robinson 2016; Salzer 2014 |
| Global Assessment Scalea | GAS | CR | |
| General Health Questionnaire, functioning | GHQ, functioning | CR | |
| Outcome Questionnaire—45.2, social role | OQ45, social role | SR | |
| Social Functioning Questionnaire | SFQ | SR | |
| Sheehan Disability Scale | SDS | SR | |
| Social Adjustment Scale ‐ self‐rating | SAS‐SR | SR | Bateman 1999; Bateman 2009; Jørgensen 2013; McMain 2017; Reneses 2013 |
| Satisfaction Profile, social functioning | None | SR | |
| Social and Occupational Functioning Assessment Scalea | SOFAS | CR | |
| Social Provisions Scale ‐ "How many days were you paid for working in the past 30 days?"a | SPS ‐ days paid for working | SR | |
| Total Outcome Questionnaire 45 | OQ45 | SR | |
| Work and Social Adjustment Scale | WSAS | SR |
aFor these scales, higher scores indicate better functioning, as opposed to most other clinical outcome scales (where higher scores indicate higher burden). Scores were multiplied by ( −1) before entering for effect size calculation, to ensure that a negative direction of effect indicates a beneficial effect (like for most other clinical outcomes).
Secondary outcomes
1. Anger
| Name of scale/means of assessment | Abbreviation | Clinician‐rated (CR)/self‐rated (SR) | Study |
|---|---|---|---|
| Anger Irritability and Assault Questionnaire, Labile Anger subscale | AIAQ, Labile Anger subscale | SR | |
| Borderline Personality Disorder Severity Index ‐ 4th Edition, anger | BPDSI‐IV, anger | CR | |
| Clinical Global Impression scale for Borderline Personality Disorder patients, anger | CGI‐BPD, anger | CR | |
| Overt Aggression Scale ‐ Modified, labile anger | OAS‐M, labile anger | CR | |
| Spielberger Anger Expression Scale, anger out | STAXI, anger out | SR | |
| Spielberger Anger Expression Scale, trait anger | STAXI, trait anger | SR | |
| Target Behaviour Rating, anger | TBR, anger | CR |
2. Affective instability
| Name of scale/means of assessment | Abbreviation | Clinician‐rated (CR)/self‐rated (SR) | Study |
|---|---|---|---|
| Borderline Personality Disorder Severity Index ‐ 4th Edition, affective instability | BPDSI‐IV, affective instability | CR | |
| Borderline Personality Disorder Severity Index ‐ 4th Edition for adolescents, affective instability | BPDSI‐IV‐adol, affective instability | CR | |
| Clinical Global Impression scale for Borderline Personality Disorder patients, affective instability | CGI‐BPD, affective instability | CR | |
| Revised Diagnostic Interview for Borderlines, Affect subscale | DIB‐R, Affect subscale | CR | |
| Difficulties in Emotion Regulation Scale, Total score | DERS, Total score | SR | Bianchini 2019; Gratz 2006; Gratz 2014; McMain 2017; Morton 2012 |
| Personality Assessment Inventory, affective instability | PAI‐BOR‐A, affective instability | SR | |
| Strengths and Difficulties Questionnaire, emotional problems | SDQ, emotional problems | SR | |
| Zanarini Rating Scale for Borderline Personality Disorder, affective instability | ZAN‐BPD, affective instability | CR |
3. Chronic feeling of emptiness
| Name of scale/means of assessment | Abbreviation | Clinician‐rated (CR)/self‐rated (SR) | Study |
|---|---|---|---|
| Borderline Personality Disorder Severity Index ‐ 4th Edition, emptiness | BPDSI‐IV, emptiness | CR | |
| Clinical Global Impression scale for Borderline Personality Disorder patients, emptiness | CGI‐BPD, emptiness | CR | |
| Zanarini Rating Scale for Borderline Personality Disorder, feeling of emptiness | Zan‐BPDf, feeling of emptiness | CR |
4. Impulsivity
| Name of scale/means of assessment | Abbreviation | Clinician‐rated (CR)/self‐rated (SR) | Study |
|---|---|---|---|
| Barrett Impulsiveness Scale | BIS | SR | |
| Barrett Impulsiveness Scale ‐ 11, non‐planning | BIS‐11, non‐planning | SR | |
| Borderline Personality Disorder Severity Index ‐ 4th Edition, impulsivity | BPDSI‐IV, impulsivity | CR | Bellino 2010; Kamalabadi 2012; Leppänen 2016; Van den Bosch 2005 |
| Clinical Global Impression scale for Borderline Personality Disorder patients, impulsivity | CGI‐BPD, impulsivity | CR | |
| Diagnostic Interview for Borderline Personality Disorder ‐ Revised, impulsive | DIB‐R, impulsive | CR | |
| Difficulties in Emotion Regulation Scale, impulsive dyscontrol | DERS, impulse dyscontrol | SR | |
| Eysenck Impulsivity Venturesomeness Empathy Questionnaire, impulsivity | IVE, impulsivity | SR | |
| Target Behaviour Rating, impulsiveness | TBR, impulsiveness | CR | |
| Zanarini Rating Scale for Borderline Personality Disorder, impulsivity | ZAN‐BPD, impulsivity | CR, SR |
5. Interpersonal problems
| Name of scale/means of assessment | Abbreviation | Clinician‐rated (CR)/self‐rated (SR) | Study |
|---|---|---|---|
| Borderline Personality Disorder Severity Index ‐ 4th Edition, interpersonal relationships | BPDSI‐IV, interpersonal relationships | CR | |
| Borderline Personality Disorder Severity Index ‐ 4th Edition, unstable relationships | BPDSI‐IV, unstable relationships | CR | |
| Clinical Global Impression scale for Borderline Personality Disorder patients, unstable relations | CGI‐BPD, unstable relations | CR | |
| Circumplex of Interpersonal Problems | CIP | SR | |
| Revised Diagnostic Interview for Borderlines, Interpersonal subscale | DIB‐R, Interpersonal subscale | CR | |
| EQ‐5D Health‐Related Quality of Life | EQ‐5D, social relationships | SR | |
| Inventory of Interpersonal Problems ‐ Borderline Personality Disorder, Related composite | IIP‐BPD, Related composite | SR | |
| Inventory of Interpersonal Problems ‐ Circumflex version/64‐item version | IIP‐C/IIP‐64 | SR | Bateman 1999; Bateman 2009; Jørgensen 2013; Laurenssen 2018; Leichsenring 2016; McMain 2009; Philips 2018 |
| Inventory of Interpersonal Problems ‐ 25‐item version | IIP‐25 | SR | |
| Inventory of Interpersonal Problems Short Circumplex ‐ 32‐item version | IIP‐SC/IIP‐32 | SR | |
| Outcome Questionnaire 45, interpersonal relations | OQ45, interpersonal relations | SR | |
| Personality Assessment Inventory ‐ Borderline Features Scale ‐ negative relationships | PAI‐BOR‐N | SR | |
| Strengths and Difficulties Questionnaire, problems in relationships | SDQ, problems in relationships | SR | |
| Abbreviated World Health Organization Quality of Life Questionnaire, Social relationships score | WHOQOL‐Bref, Social relationships score | SR | |
| Zanarini Rating Scale for Borderline Personality Disorder, disturbed relationships | ZAN‐BPD, disturbed relationships | CR |
6. Abandonment
| Name of scale/means of assessment | Abbreviation | Clinician‐rated (CR)/self‐rated (SR) | Study |
|---|---|---|---|
| Borderline Personality Disorder Severity Index ‐ 4th Edition, abandonment | BPDSI‐IV, abandonment | CR | |
| Clinical Global Impression scale for Borderline Personality Disorder patients, fear of abandonment | CGI‐BPD, fear of abandonment | CR |
7. Identity disturbance
| Name of scale/means of assessment | Abbreviation | Clinician‐rated (CR)/self‐rated (SR) | Study |
|---|---|---|---|
| Borderline Personality Disorder Severity Index ‐ 4th Edition, identity disturbance | BPDSI‐IV, identity disturbance | CR | |
| Borderline Personality Inventory, identity diffusion | BPI, identity diffusion | SR | |
| Clinical Global Impression scale for Borderline Personality Disorder patients, identity distortion | CGI‐BPD, identity distortion | CR | |
| Personality Assessment Inventory ‐ Borderline Features Scale ‐ identity disturbance | PAI‐BOR‐I | SR | |
| Severity Indices of Personality Problems | SIPP | SR | |
| Zanarini Rating Scale for Borderline Personality Disorder, Identity subscale | Zan‐BPD, Identity subscale | CR |
8. Dissociation and psychotic‐like symptoms
| Name of scale/means of assessment | Abbreviation | Clinician‐rated (CR)/self‐rated (SR) | Study |
|---|---|---|---|
| Borderline Personality Disorder Severity Index ‐ 4th Edition, paranoid ideation | BPDSI‐IV, paranoid ideation | CR | |
| Borderline Personality Disorder Severity Index ‐ 4th Edition, dissociation | BPDSI‐IV, dissociation | CR | |
| Brief Psychiatric Rating Scale | BPRS | CR | |
| Clinical Global Impression scale for Borderline Personality Disorder patients, dissociative symptoms | CGI‐BPD, dissociative symptoms | CR | |
| Revised Diagnostic Interview for Borderlines, Cognitive subscale | DIB‐R, Cognitive subscale | CR | |
| Dissociative Experiences Scale | DES | SR | |
| Dissociative Experiences Scale ‐ Taxon | DES‐T | SR | |
| Zanarini Rating Scale for Borderline Personality Disorder, cognitive | Zan‐BPD, cognitive | CR |
9. Depression
| Name of scale/means of assessment | Abbreviation | Clinician‐rated (CR)/self‐rated (SR) | Study |
|---|---|---|---|
| Beck Depression Inventory | BDI | SR | Antonsen 2017; Bateman 1999; Bateman 2009; Blum 2008; Cottraux 2009; Doering 2010; Gregory 2008b; Koons 2001a; Laurenssen 2018; Leichsenring 2016; McMain 2009; Schilling 2018; Turner 2000 |
| Beck Depression Inventory‐II | BDI‐II | SR | Bohus 2013; Davidson 2006; Feigenbaum 2012; Jørgensen 2013; Kredlow 2017a; Kredlow 2017b; McMain 2017; Mohamadizadeh 2017 |
| Depression Anxiety Stress Scales | DASS | SR | |
| Depression Anxiety Stress Scale ‐ 21 | DASS‐21 | SR | |
| Diagnostic Interview Schedule for Children – Predictive Scales | DISC ‐ PS | SR | |
| General Health Questionnaire, Depression subscale | GHQ, Depression subscale | SR | |
| Hamilton Depression Inventory | Ham‐D | CR | |
| Hamilton Depression Inventory ‐ 17‐item | Ham‐D‐17 | SR, CR | |
| Hamilton Depression Rating Scale | HDRS | SR | |
| Hamilton Depression and Anxiety Scale | HADS | SR | |
| Ko’s Depression Inventory | None | SR | |
| Montgomery Åsberg Depression Rating Scale | MADRS | CR | |
| Mood and Feelings Questionnaire ‐ participants scoring higher than cut‐off for depression | MFQ ‐ above cut‐off | SR | |
| Clinically Useful Depression Outcome Scale, total score | None | SR |
10. Adverse effects
| Name of scale/means of assessment | Abbreviation | Clinician‐rated (CR)/self‐rated (SR) | Study |
|---|---|---|---|
| Spontaneous reporting | ‐ | ‐ | Andreoli 2016; Davidson 2014; Haeyen 2018; Leichsenring 2016; McMurran 2016; Pascual 2015; Robinson 2016; Stanley 2017 The remaining trials did not report adverse effects |
Appendix 5. 'Risk of bias' components and criteria for assigning judgements
Selection bias
Random sequence generation
-
Low risk of bias: The method used was adequate (e.g. computer‐generated random numbers, table of random numbers) or was unlikely to introduce selection bias.
-
Unclear risk of bias: The information was insufficient for the assessment of whether the method used could introduce selection bias.
-
High risk of bias: The method used was likely to introduce bias.
Allocation concealment
-
Low risk of bias: The method used (e.g. central allocation) was unlikely to bias allocation to groups.
-
Unclear risk of bias: The information was insufficient for assessment of whether the method used could bias allocation to groups.
-
High risk of bias: The method used (e.g. open random allocation schedule) could bias allocation to groups.
Detection bias: blinding of outcome assessment
-
Low risk of bias: The method of blinding was described and blinding was conducted in a satisfactory way.
-
Unclear risk of bias: The information was insufficient for assessment of whether the type of blinding used was likely to bias the estimate of effect.
-
High risk of bias: There was no blinding or incomplete blinding.
Attrition bias: incomplete outcome data
-
Low risk of bias: The underlying reasons for missing data probably would not affect outcome measurement, as all missing data can be considered as missing at random or all data were reported.
-
Unclear risk of bias: The information was insufficient for the assessment of whether the missing data or the method used to handle missing data was likely to bias the estimate of effect.
-
High risk of bias: The crude estimate of effects could be biased given the reasons for the missing data, or the methods used to handle missing data are unsatisfactory.
Reporting bias: selective outcome reporting
-
Low risk of bias: The trial protocol was available and all prespecified outcomes of interest were reported.
-
Unclear risk of bias: The information was insufficient for the assessment of whether selective outcome reporting could have occurred.
-
High risk of bias: Not all of the primary outcomes specified beforehand were reported or participants were excluded after randomisation.
Other potential sources of bias
Treatment adherence bias
-
Low risk of bias: Measures were undertaken to assure adequate treatment adherence; for example, by regular supervision or use of adherence ratings of videotaped or audio‐taped therapy sessions.
-
Unclear risk of bias: There was insufficient information to assess the extent of adequate treatment adherence.
-
High risk of bias: There was inadequate treatment adherence. Steps/measures were undertaken to assure adequate treatment adherence.
Attention bias
-
Low risk of bias: The treatment conditions were sufficiently similar in duration and intensity.
-
Unclear risk of bias: There was insufficient information in regards to treatment duration and intensity.
-
High risk of bias: One treatment condition was markedly more intense or was of longer duration than (a)nother condition(s).
Affiliation bias
-
Low risk of bias: The principal investigator was not the developer of the treatment under investigation (if compared to a control condition), or both treatment developers were involved if two treatments were directly compared.
-
Unclear risk of bias: There was insufficient information to assess affiliation bias.
-
High risk of bias: The principal investigator was the developer of the treatment under investigation (if compared to a control condition), or only one of the treatment developers was involved if two treatments were directly compared.
Other sources of bias
-
Low risk of bias: The trial appeared to be free of other sources of bias.
-
Unclear risk of bias: The information was inadequate for the assessment of other possible sources of bias.
-
High risk of bias: Other sources of bias were identified.
Appendix 6. Trial Sequential Analysis (TSA) and funnel plots figures
Psychotherapy versus TAU
Primary outcomes
BPD symptom severity
We performed a TSA on the primary outcome of borderline symptom severity at end of treatment. The analysis shows that the required information size was reached. See Figure 4 below.

Trial Sequential Analysis on primary outcome: Psychotherapy ‐ borderline symptom severity at end of treatment
We drew a funnel plot for the comparison between psychotherapy and TAU for the primary outcome of BPD symptom severity. The funnel plot shows a small asymmetry. See Figure 5 below.

Funnel plot of comparison 1: Psychotherapy versus TAU, outcome: 1.1 Primary outcome: BPD symptom severity.
Self‐harm
We performed a TSA on the primary outcome of self‐harm at end of treatment. The analysis shows that the required information size was reached. See Figure 6 below.

Trial Sequential Analysis on primary outcome: Psychotherapy ‐ self‐harm at end of treatment
We drew a funnel plot for the comparison between psychotherapy and TAU for the outcome of self‐harm. The funnel plot shows symmetry. See Figure 7 below.

Funnel plot of comparison: 1 Psychotherapy versus TAU, outcome: 1.3 Primary outcome: self‐harm.
Suicide‐related outcomes
We performed a TSA on the primary outcome of suicide‐related outcomes at end of treatment. The analysis shows that the required information size was reached. See Figure 8 below.

Trial Sequential Analysis on primary outcome: Psychotherapy ‐ suicide‐related outcomes at end of treatment
We drew a funnel plot for the comparison between psychotherapy and TAU for suicide‐related outcomes. The funnel plot shows symmetry. See Figure 9 below.

Funnel plot of comparison: 1 Psychotherapy compared with TAU, outcome: 1.5 Primary outcome: suicide‐related outcomes.
Psychosocial functioning
We performed a TSA on the primary outcome of psychosocial functioning at end of treatment. The analysis shows that the required information size was reached. See Figure 10 below.

Trial Sequential Analysis on primary outcome: Psychotherapy ‐ psychosocial functioning at end of treatment
We drew a funnel plot for the comparison between psychotherapy and TAU for the outcome of psychosocial functioning. The funnel plot shows symmetry. See Figure 11 below.

Funnel plot of comparison: 1 Psychotherapy compared with TAU, outcome: 1.7 Primary outcome: psychosocial functioning.
Secondary outcome: depression
We performed a TSA on the secondary outcome of depression at end of treatment. The analysis shows that the required information size was not reached. See Figure 12 below.

Trial Sequential Analysis on secondary outcome: Psychotherapy ‐ depression at end of treatment
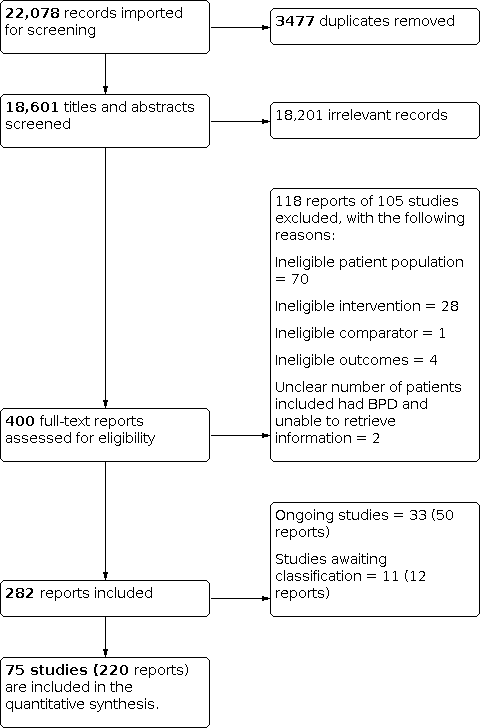
Study flow diagram

Risk of bias graph: review authors' judgements about each risk of bias item presented as percentages across all included studies.

Risk of bias summary: review authors' judgements about each risk of bias item for each included study.

Trial Sequential Analysis on primary outcome: Psychotherapy ‐ borderline symptom severity at end of treatment

Funnel plot of comparison 1: Psychotherapy versus TAU, outcome: 1.1 Primary outcome: BPD symptom severity.

Trial Sequential Analysis on primary outcome: Psychotherapy ‐ self‐harm at end of treatment

Funnel plot of comparison: 1 Psychotherapy versus TAU, outcome: 1.3 Primary outcome: self‐harm.
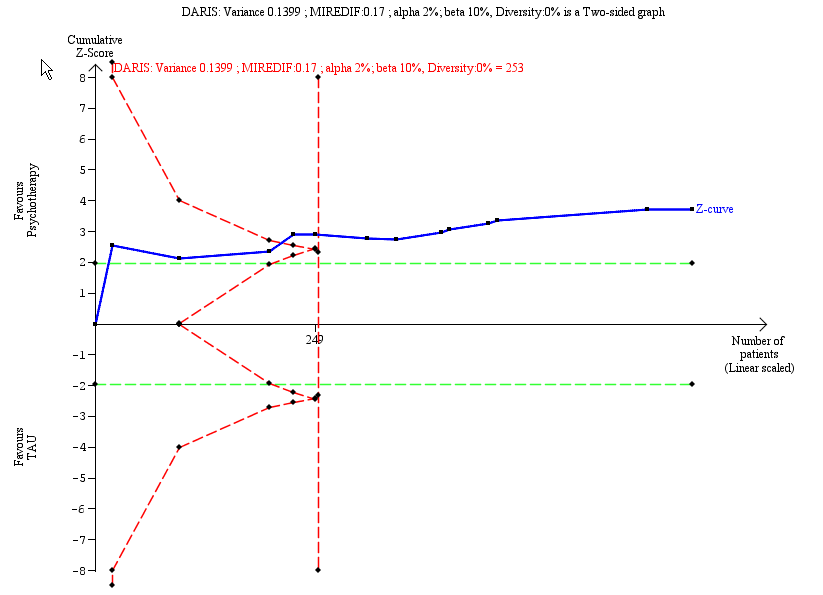
Trial Sequential Analysis on primary outcome: Psychotherapy ‐ suicide‐related outcomes at end of treatment

Funnel plot of comparison: 1 Psychotherapy compared with TAU, outcome: 1.5 Primary outcome: suicide‐related outcomes.

Trial Sequential Analysis on primary outcome: Psychotherapy ‐ psychosocial functioning at end of treatment

Funnel plot of comparison: 1 Psychotherapy compared with TAU, outcome: 1.7 Primary outcome: psychosocial functioning.
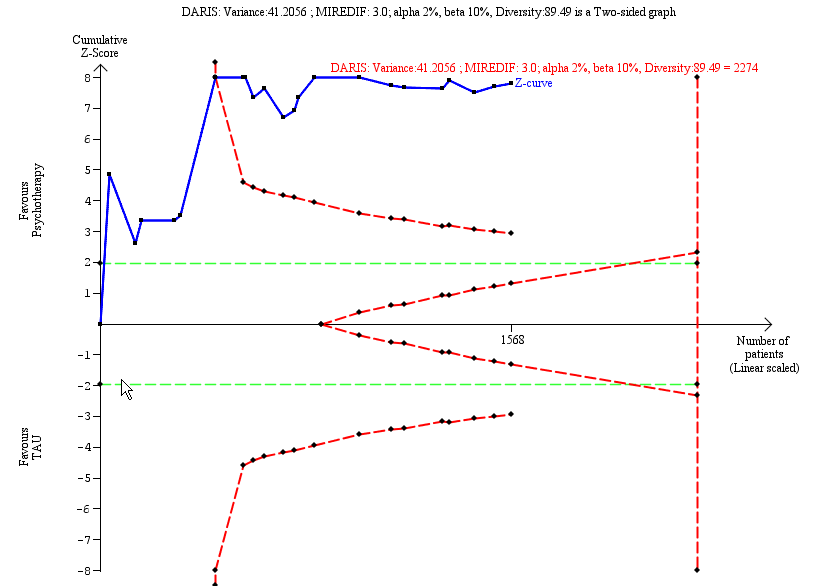
Trial Sequential Analysis on secondary outcome: Psychotherapy ‐ depression at end of treatment

Comparison 1: Psychotherapy vs TAU, Outcome 1: Primary: BPD symptom severity (continuous)

Comparison 1: Psychotherapy vs TAU, Outcome 2: Primary: BPD symptom severity (dichotomous), at above 12 months follow‐up

Comparison 1: Psychotherapy vs TAU, Outcome 3: Primary: self‐harm (continuous)

Comparison 1: Psychotherapy vs TAU, Outcome 4: Primary: self‐harm (dichotomous)

Comparison 1: Psychotherapy vs TAU, Outcome 5: Primary: suicide‐related outcomes (continuous)

Comparison 1: Psychotherapy vs TAU, Outcome 6: Primary: suicide‐related outcomes (dichotomous)

Comparison 1: Psychotherapy vs TAU, Outcome 7: Primary: psychosocial functioning (continuous)

Comparison 1: Psychotherapy vs TAU, Outcome 8: Secondary: anger (continuous)

Comparison 1: Psychotherapy vs TAU, Outcome 9: Secondary: affective instability (continuous)

Comparison 1: Psychotherapy vs TAU, Outcome 10: Secondary: chronic feelings of emptiness (continuous)

Comparison 1: Psychotherapy vs TAU, Outcome 11: Secondary: impulsivity (continuous)

Comparison 1: Psychotherapy vs TAU, Outcome 12: Secondary: impulsivity (dichotomous), at end of treatment

Comparison 1: Psychotherapy vs TAU, Outcome 13: Secondary: interpersonal problems (continuous)

Comparison 1: Psychotherapy vs TAU, Outcome 14: Secondary: abandonment (continuous)

Comparison 1: Psychotherapy vs TAU, Outcome 15: Secondary: identity disturbance (continuous)

Comparison 1: Psychotherapy vs TAU, Outcome 16: Secondary: dissociation and psychotic‐like symptoms (continuous)

Comparison 1: Psychotherapy vs TAU, Outcome 17: Secondary: depression (continuous)

Comparison 1: Psychotherapy vs TAU, Outcome 18: Secondary: depression (dichotomous), at end of treatment

Comparison 1: Psychotherapy vs TAU, Outcome 19: Secondary: attrition (dichotomous)

Comparison 1: Psychotherapy vs TAU, Outcome 20: Secondary: non‐serious adverse effects (dichotomous), at end of treatment

Comparison 1: Psychotherapy vs TAU, Outcome 21: Secondary: serious adverse effects (dichotomous), at end of treatment

Comparison 2: Acceptance and commitment therapy (ACT) vs TAU, Outcome 1: Primary: BPD symptom severity (continuous), at end of treatment

Comparison 2: Acceptance and commitment therapy (ACT) vs TAU, Outcome 2: Secondary: affective instability (continuous), at end of treatment

Comparison 2: Acceptance and commitment therapy (ACT) vs TAU, Outcome 3: Secondary: depression (continuous), at end of treatment

Comparison 2: Acceptance and commitment therapy (ACT) vs TAU, Outcome 4: Secondary: attrition (dichotomous), at end of treatment

Comparison 3: Dialectical behavior therapy (DBT) vs TAU, Outcome 1: Primary: BPD symptom severity (continuous), at end of treatment

Comparison 3: Dialectical behavior therapy (DBT) vs TAU, Outcome 2: Primary, self‐harm (continuous)

Comparison 3: Dialectical behavior therapy (DBT) vs TAU, Outcome 3: Primary: suicide‐related outcomes (continuous), at end of treatment

Comparison 3: Dialectical behavior therapy (DBT) vs TAU, Outcome 4: Primary: suicide‐related outcomes, attempts (dichotomous), at end of treatment

Comparison 3: Dialectical behavior therapy (DBT) vs TAU, Outcome 5: Primary: psychosocial functioning (continuous), at end of treatment

Comparison 3: Dialectical behavior therapy (DBT) vs TAU, Outcome 6: Secondary: anger (continuous)

Comparison 3: Dialectical behavior therapy (DBT) vs TAU, Outcome 7: Secondary: affective instability (continuous), at end of treatment

Comparison 3: Dialectical behavior therapy (DBT) vs TAU, Outcome 8: Secondary: chronic feelings of emptiness (continuous), at end of treatment

Comparison 3: Dialectical behavior therapy (DBT) vs TAU, Outcome 9: Secondary: impulsivity (continuous)

Comparison 3: Dialectical behavior therapy (DBT) vs TAU, Outcome 10: Secondary: interpersonal problems (continuous), at end of treatment

Comparison 3: Dialectical behavior therapy (DBT) vs TAU, Outcome 11: Secondary: dissociation and psychotic‐like symptoms (continuous), at end of treatment

Comparison 3: Dialectical behavior therapy (DBT) vs TAU, Outcome 12: Secondary: depression (continuous)

Comparison 3: Dialectical behavior therapy (DBT) vs TAU, Outcome 13: Secondary: attrition (dichotomous)

Comparison 3: Dialectical behavior therapy (DBT) vs TAU, Outcome 14: Secondary: adverse effects (dichotomous), at end of treatment

Comparison 3: Dialectical behavior therapy (DBT) vs TAU, Outcome 15: Secondary: serious adverse effects (dichotomous), at end of treatment

Comparison 4: Mentalisation based therapy (MBT) vs TAU, Outcome 1: Primary: BPD symptom severity (continuous)

Comparison 4: Mentalisation based therapy (MBT) vs TAU, Outcome 2: Primary: self‐harm (continuous), at end of treatment

Comparison 4: Mentalisation based therapy (MBT) vs TAU, Outcome 3: Primary: self‐harm (dichotomous)

Comparison 4: Mentalisation based therapy (MBT) vs TAU, Outcome 4: Primary: suicide‐related outcomes (dichotomous)

Comparison 4: Mentalisation based therapy (MBT) vs TAU, Outcome 5: Primary: psychosocial functioning (continuous)

Comparison 4: Mentalisation based therapy (MBT) vs TAU, Outcome 6: Secondary: interpersonal problems (continuous)

Comparison 4: Mentalisation based therapy (MBT) vs TAU, Outcome 7: Secondary: depression (continuous)

Comparison 4: Mentalisation based therapy (MBT) vs TAU, Outcome 8: Secondary: depression (dichotomous), at end of treatment

Comparison 4: Mentalisation based therapy (MBT) vs TAU, Outcome 9: Secondary: attrition (dichotomous), at end of treatment

Comparison 4: Mentalisation based therapy (MBT) vs TAU, Outcome 10: Secondary: adverse effects (dichotomous), at end of treatment

Comparison 4: Mentalisation based therapy (MBT) vs TAU, Outcome 11: Mentalisation‐based treatment for eating disorders (MBT‐ED) versus specialist supportive clinical management (SSCM‐ED) (generic inverse variance)

Comparison 5: Cognitive behavioural therapy (CBT) and related treatments vs TAU, Outcome 1: Primary: BPD symptom severity (continuous)

Comparison 5: Cognitive behavioural therapy (CBT) and related treatments vs TAU, Outcome 2: Primary: BPD symptom severity (dichotomous), at above 12 months follow‐up

Comparison 5: Cognitive behavioural therapy (CBT) and related treatments vs TAU, Outcome 3: Primary: self‐harm (continuous)

Comparison 5: Cognitive behavioural therapy (CBT) and related treatments vs TAU, Outcome 4: Primary: self‐harm (dichotomous), at end of treatment

Comparison 5: Cognitive behavioural therapy (CBT) and related treatments vs TAU, Outcome 5: Primary: suicide‐related outcomes (continuous)

Comparison 5: Cognitive behavioural therapy (CBT) and related treatments vs TAU, Outcome 6: Primary: psychosocial functioning (continuous)

Comparison 5: Cognitive behavioural therapy (CBT) and related treatments vs TAU, Outcome 7: Secondary: interpersonal problems (continuous)

Comparison 5: Cognitive behavioural therapy (CBT) and related treatments vs TAU, Outcome 8: Secondary: dissociation and psychotic‐like symptoms (continuous)

Comparison 5: Cognitive behavioural therapy (CBT) and related treatments vs TAU, Outcome 9: Secondary: depression (continuous)

Comparison 5: Cognitive behavioural therapy (CBT) and related treatments vs TAU, Outcome 10: Secondary: attrition (dichotomous), at end of treatment

Comparison 5: Cognitive behavioural therapy (CBT) and related treatments vs TAU, Outcome 11: Secondary: adverse effects (dichotomous), at end of treatment

Comparison 6: Psychodynamic psychotherapy vs TAU, Outcome 1: Primary: BPD symptom severity (continuous)

Comparison 6: Psychodynamic psychotherapy vs TAU, Outcome 2: Primary: self‐harm (continuous)

Comparison 6: Psychodynamic psychotherapy vs TAU, Outcome 3: Primary: suicide‐related outcomes (continuous)

Comparison 6: Psychodynamic psychotherapy vs TAU, Outcome 4: Primary: psychosocial functioning (continuous)

Comparison 6: Psychodynamic psychotherapy vs TAU, Outcome 5: Secondary: anger (continuous)

Comparison 6: Psychodynamic psychotherapy vs TAU, Outcome 6: Secondary: affective instability (continuous)

Comparison 6: Psychodynamic psychotherapy vs TAU, Outcome 7: Secondary: chronic feelings of emptiness (continuous)

Comparison 6: Psychodynamic psychotherapy vs TAU, Outcome 8: Secondary: impulsivity (continuous)

Comparison 6: Psychodynamic psychotherapy vs TAU, Outcome 9: Secondary: interpersonal problems (continuous)

Comparison 6: Psychodynamic psychotherapy vs TAU, Outcome 10: Secondary: abandonment (continuous)

Comparison 6: Psychodynamic psychotherapy vs TAU, Outcome 11: Secondary: identity disturbance (continuous)

Comparison 6: Psychodynamic psychotherapy vs TAU, Outcome 12: Secondary: dissociation and psychotic‐like symptoms (continuous)

Comparison 6: Psychodynamic psychotherapy vs TAU, Outcome 13: Secondary: depression (continuous)

Comparison 6: Psychodynamic psychotherapy vs TAU, Outcome 14: Secondary: attrition (dichotomous), at end of treatment

Comparison 7: Schema‐focused therapy (SFT) vs TAU, Outcome 1: Primary: BPD symptom severity (continuous), at end of treatment

Comparison 7: Schema‐focused therapy (SFT) vs TAU, Outcome 2: Primary: psychosocial functioning (continuous), at end of treatment

Comparison 7: Schema‐focused therapy (SFT) vs TAU, Outcome 3: Secondary: affective instability (continuous), at end of treatment

Comparison 7: Schema‐focused therapy (SFT) vs TAU, Outcome 4: Secondary: impulsivity (continuous), at end of treatment

Comparison 7: Schema‐focused therapy (SFT) vs TAU, Outcome 5: Secondary: interpersonal problems (continuous), at end of treatment

Comparison 7: Schema‐focused therapy (SFT) vs TAU, Outcome 6: Secondary: dissociation and psychotic‐like symptoms (continuous), at end of treatment

Comparison 7: Schema‐focused therapy (SFT) vs TAU, Outcome 7: Secondary: attrition (dichotomous), at end of treatment

Comparison 8: Systems training for emotional predictability and problem solving (STEPPS) vs TAU, Outcome 1: Primary: BPD symptom severity (continuous), at end of treatment

Comparison 8: Systems training for emotional predictability and problem solving (STEPPS) vs TAU, Outcome 2: Primary: self‐harm (dichtomous), at end of treatment

Comparison 8: Systems training for emotional predictability and problem solving (STEPPS) vs TAU, Outcome 3: Primary: psychosocial functioning (continuous)

Comparison 8: Systems training for emotional predictability and problem solving (STEPPS) vs TAU, Outcome 4: Secondary: affective instability (continuous), at end of treatment

Comparison 8: Systems training for emotional predictability and problem solving (STEPPS) vs TAU, Outcome 5: Secondary: impulsivity (continuous), at end of treatment

Comparison 8: Systems training for emotional predictability and problem solving (STEPPS) vs TAU, Outcome 6: Secondary: impulsivity (dichotomous), at end of treatment

Comparison 8: Systems training for emotional predictability and problem solving (STEPPS) vs TAU, Outcome 7: Secondary: interpersonal problems (continuous), at end of treatment

Comparison 8: Systems training for emotional predictability and problem solving (STEPPS) vs TAU, Outcome 8: Secondary: dissociation and psychotic‐like symptoms (continuous), at end of treatment

Comparison 8: Systems training for emotional predictability and problem solving (STEPPS) vs TAU, Outcome 9: Secondary: depression (continuous), at end of treatment

Comparison 8: Systems training for emotional predictability and problem solving (STEPPS) vs TAU, Outcome 10: Secondary: attrition (dichotomous), at end of treatment

Comparison 9: Cognitive analytic therapy (CAT) vs TAU, Outcome 1: Primary: suicide‐related outcomes (continuous)

Comparison 9: Cognitive analytic therapy (CAT) vs TAU, Outcome 2: Primary: psychosocial functioning (continuous)

Comparison 9: Cognitive analytic therapy (CAT) vs TAU, Outcome 3: Secondary: anger (continuous)

Comparison 9: Cognitive analytic therapy (CAT) vs TAU, Outcome 4: Secondary: dissociation and psychotic‐like symptoms (continuous)

Comparison 9: Cognitive analytic therapy (CAT) vs TAU, Outcome 5: Secondary: depression (continuous)

Comparison 9: Cognitive analytic therapy (CAT) vs TAU, Outcome 6: Secondary: attrition (dichotomous), at end of treatment

Comparison 10: Motivation feedback (MF) vs TAU, Outcome 1: Primary: psychosocial functioning, at end of treatment

Comparison 11: Psychoeducation vs TAU, Outcome 1: Secondary: depression (continuous), at end of treatment

Comparison 11: Psychoeducation vs TAU, Outcome 2: Secondary: attrition (dichotomous), at end of treatment

Comparison 12: Transference‐focused psychotherapy (TFP) vs TAU, Outcome 1: Primary: BPD symptom severity (continuous), at end of treatment

Comparison 12: Transference‐focused psychotherapy (TFP) vs TAU, Outcome 2: Primary: self‐harm (dichotomous), at end of treatment

Comparison 12: Transference‐focused psychotherapy (TFP) vs TAU, Outcome 3: Primary: suicide‐related outcomes (dichotomous), at end of treatment

Comparison 12: Transference‐focused psychotherapy (TFP) vs TAU, Outcome 4: Primary: psychosocial functioning (continuous), at end of treatment

Comparison 12: Transference‐focused psychotherapy (TFP) vs TAU, Outcome 5: Secondary: depression (continuous), at end of treatment

Comparison 12: Transference‐focused psychotherapy (TFP) vs TAU, Outcome 6: Secondary: attrition (dichotomous), at end of treatment

Comparison 13: Once‐only interventions (individual setting) vs TAU, Outcome 1: Primary: self‐harm (continuous), at end of treatment

Comparison 13: Once‐only interventions (individual setting) vs TAU, Outcome 2: Primary: psychosocial functioning (continuous), at end of treatment

Comparison 13: Once‐only interventions (individual setting) vs TAU, Outcome 3: Secondary: depression (continuous), at end of treatment

Comparison 13: Once‐only interventions (individual setting) vs TAU, Outcome 4: Secondary: attrition (dichotomous), at end of treatment

Comparison 14: Eclectic treatments vs TAU, Outcome 1: Primary: BPD symptom severity (continuous), at end of treatment

Comparison 14: Eclectic treatments vs TAU, Outcome 2: Primary: self‐harm (continuous), at end of treatment

Comparison 14: Eclectic treatments vs TAU, Outcome 3: Primary: suicide‐related outcomes (continuous), at end of treatment

Comparison 14: Eclectic treatments vs TAU, Outcome 4: Primary: psychosocial functioning (continuous)

Comparison 14: Eclectic treatments vs TAU, Outcome 5: Secondary: anger (continuous), at end of treatment

Comparison 14: Eclectic treatments vs TAU, Outcome 6: Secondary: affective instability (continuous), at end of treatment

Comparison 14: Eclectic treatments vs TAU, Outcome 7: Secondary: chronic feelings of emptiness (continuous), at end of treatment

Comparison 14: Eclectic treatments vs TAU, Outcome 8: Secondary: impulsivity (continuous), at end of treatment

Comparison 14: Eclectic treatments vs TAU, Outcome 9: Secondary: interpersonal problems (continuous), at end of treatment

Comparison 14: Eclectic treatments vs TAU, Outcome 10: Secondary: abandonment (continuous), at end of treatment

Comparison 14: Eclectic treatments vs TAU, Outcome 11: Secondary: identity disturbance (continuous), at end of treatment

Comparison 14: Eclectic treatments vs TAU, Outcome 12: Secondary: depression (continuous), at end of treatment

Comparison 14: Eclectic treatments vs TAU, Outcome 13: Secondary: attrition (dichotomuous), at end of treatment

Comparison 14: Eclectic treatments vs TAU, Outcome 14: Secondary: adverse effects (dichotomous), at end of treatment

Comparison 15: Psychotherapy vs waiting list or no treatment, Outcome 1: Primary: BPD symptom severity (continuous), at end of treatment

Comparison 15: Psychotherapy vs waiting list or no treatment, Outcome 2: Primary: self‐harm (continuous), at end of treatment

Comparison 15: Psychotherapy vs waiting list or no treatment, Outcome 3: Primary: suicide‐related outcomes (continuous), at end of treatment

Comparison 15: Psychotherapy vs waiting list or no treatment, Outcome 4: Primary: psychosocial functioning (continuous)

Comparison 15: Psychotherapy vs waiting list or no treatment, Outcome 5: Secondary: anger (continuous), at end of treatment

Comparison 15: Psychotherapy vs waiting list or no treatment, Outcome 6: Secondary: affective instability (continuous)

Comparison 15: Psychotherapy vs waiting list or no treatment, Outcome 7: Secondary: chronic feelings of emptiness (continuous), at end of treatment

Comparison 15: Psychotherapy vs waiting list or no treatment, Outcome 8: Secondary: impulsivity (continuous)

Comparison 15: Psychotherapy vs waiting list or no treatment, Outcome 9: Secondary: interpersonal problems (continuous)

Comparison 15: Psychotherapy vs waiting list or no treatment, Outcome 10: Secondary: abandonment (continuous), at end of treatment

Comparison 15: Psychotherapy vs waiting list or no treatment, Outcome 11: Secondary: identity disturbance (continuous), at end of treatment

Comparison 15: Psychotherapy vs waiting list or no treatment, Outcome 12: Secondary: dissociation and psychotic‐like symptoms (continuous), at end of treatment

Comparison 15: Psychotherapy vs waiting list or no treatment, Outcome 13: Secondary: depression (continuous), at end of treatment

Comparison 15: Psychotherapy vs waiting list or no treatment, Outcome 14: Secondary: attrition (dichotomous), at end of treatment

Comparison 16: Dialectical behavior therapy (DBT) vs waiting list or no treatment, Outcome 1: Primary: BPD symptom severity (continuous), at end of treatment

Comparison 16: Dialectical behavior therapy (DBT) vs waiting list or no treatment, Outcome 2: Primary: self‐harm (continuous), at end of treatment

Comparison 16: Dialectical behavior therapy (DBT) vs waiting list or no treatment, Outcome 3: Primary: suicide‐related outcomes (continuous), at end of treatment

Comparison 16: Dialectical behavior therapy (DBT) vs waiting list or no treatment, Outcome 4: Primary: psychosocial functioning (continuous), at end of treatment

Comparison 16: Dialectical behavior therapy (DBT) vs waiting list or no treatment, Outcome 5: Secondary: anger (continuous), at end of treatment

Comparison 16: Dialectical behavior therapy (DBT) vs waiting list or no treatment, Outcome 6: Secondary: affective instability (continuous), at end of treatment

Comparison 16: Dialectical behavior therapy (DBT) vs waiting list or no treatment, Outcome 7: Secondary: impulsivity (continuous), at end of treatment

Comparison 16: Dialectical behavior therapy (DBT) vs waiting list or no treatment, Outcome 8: Secondary: dissociation and psychotic‐like symptoms (continuous), at end of treatment

Comparison 16: Dialectical behavior therapy (DBT) vs waiting list or no treatment, Outcome 9: Secondary: depression (continuous), at end of treatment

Comparison 16: Dialectical behavior therapy (DBT) vs waiting list or no treatment, Outcome 10: DBT‐couple therapy (CDBT) vs waiting list (generic inverse variance)

Comparison 17: Schema‐focused therapy (SFT) vs no treatment, Outcome 1: Primary: suicide‐related outcomes (continuous), at end of treatment

Comparison 17: Schema‐focused therapy (SFT) vs no treatment, Outcome 2: Secondary: depression (continuous), at end of treatment

Comparison 18: Interpersonal psychotherapy (IPT) vs waiting list, Outcome 1: Primary: BPD symptom severity (continuous), at end of treatment

Comparison 18: Interpersonal psychotherapy (IPT) vs waiting list, Outcome 2: Primary: self‐harm (continuous), at end of treatment

Comparison 18: Interpersonal psychotherapy (IPT) vs waiting list, Outcome 3: Primary: psychosocial functioning (continuous)

Comparison 18: Interpersonal psychotherapy (IPT) vs waiting list, Outcome 4: Secondary: anger (continuous), at end of treatment

Comparison 18: Interpersonal psychotherapy (IPT) vs waiting list, Outcome 5: Secondary: affective instability (continuous)

Comparison 18: Interpersonal psychotherapy (IPT) vs waiting list, Outcome 6: Secondary: chronic feelings of emptiness (continuous), at end of treatment

Comparison 18: Interpersonal psychotherapy (IPT) vs waiting list, Outcome 7: Secondary: impulsivity (continuous)

Comparison 18: Interpersonal psychotherapy (IPT) vs waiting list, Outcome 8: Secondary: interpersonal problems (continuous)

Comparison 18: Interpersonal psychotherapy (IPT) vs waiting list, Outcome 9: Secondary: abandonment (continuous), at end of treatment

Comparison 18: Interpersonal psychotherapy (IPT) vs waiting list, Outcome 10: Secondary: identity disturbance (continuous), at end of treatment

Comparison 18: Interpersonal psychotherapy (IPT) vs waiting list, Outcome 11: Secondary: dissociation and psychotic‐like symptoms (continuous), at end of treatment

Comparison 18: Interpersonal psychotherapy (IPT) vs waiting list, Outcome 12: Secondary outcome: depression (continuous), at end of treatment

Comparison 18: Interpersonal psychotherapy (IPT) vs waiting list, Outcome 13: Secondary outcome: attrition (dichotomous), at end of treatment

Comparison 19: Once‐only interventions (individual setting) vs waiting list, Outcome 1: Secondary: impulsivity (continuous), at end of treatment

Comparison 19: Once‐only interventions (individual setting) vs waiting list, Outcome 2: Secondary: interpersonal problems (continuous), at end of treatment

Comparison 19: Once‐only interventions (individual setting) vs waiting list, Outcome 3: Secondary: attrition (dichotomous), at end of treatment

Comparison 20: Eclectic treatments vs waiting list, Outcome 1: Primary outcome: psychosocial functioning (continuous), at end of treatment

Comparison 20: Eclectic treatments vs waiting list, Outcome 2: Secondary outcome: interpersonal problems (continuous), at end of treatment

Comparison 21: Dialectical behavior therapy (DBT) and related treatments vs active treatment, Outcome 1: Standard DBT (DBT) vs client‐centred therapy (CCT) (continuous)

Comparison 21: Dialectical behavior therapy (DBT) and related treatments vs active treatment, Outcome 2: DBT vs CCT, secondary: attrition (dichotomous), at end of treatment

Comparison 21: Dialectical behavior therapy (DBT) and related treatments vs active treatment, Outcome 3: Standard DBT (DBT) vs good psychiatric management (GPM) (continuous)

Comparison 21: Dialectical behavior therapy (DBT) and related treatments vs active treatment, Outcome 4: DBT vs GPM, secondary: attrition (dichotomous), at end of treatment

Comparison 21: Dialectical behavior therapy (DBT) and related treatments vs active treatment, Outcome 5: Standard DBT (DBT) vs individual DBT therapy + activities group (DBT‐I) (continuous)

Comparison 21: Dialectical behavior therapy (DBT) and related treatments vs active treatment, Outcome 6: DBT vs DBT‐I, secondary: attrition (dichotomous), at end of treatment

Comparison 21: Dialectical behavior therapy (DBT) and related treatments vs active treatment, Outcome 7: Standard DBT (DBT) vs skills training group + individual case management (DBT‐S) (continuous)

Comparison 21: Dialectical behavior therapy (DBT) and related treatments vs active treatment, Outcome 8: DBT vs DBT‐S, secondary: attrition (dichotomous), at 6‐12 months follow‐up

Comparison 21: Dialectical behavior therapy (DBT) and related treatments vs active treatment, Outcome 9: Standard DBT (DBT) vs step‐down DBT (DBT‐SD) (continuous)

Comparison 21: Dialectical behavior therapy (DBT) and related treatments vs active treatment, Outcome 10: DBT vs DBT‐SD, secondary: attrition (dichotomous), at end of treatment

Comparison 21: Dialectical behavior therapy (DBT) and related treatments vs active treatment, Outcome 11: Standard DBT (DBT) vs DBT Prolonged Exposure (PE) (continuous)

Comparison 21: Dialectical behavior therapy (DBT) and related treatments vs active treatment, Outcome 12: DBT vs DBT‐PE, secondary: attrition (dichotomous), at 0‐6 months follow‐up

Comparison 21: Dialectical behavior therapy (DBT) and related treatments vs active treatment, Outcome 13: DBT skills group + case management (DBT‐S) vs DBT individual therapy + activity group (DBT‐I) (continuous)

Comparison 21: Dialectical behavior therapy (DBT) and related treatments vs active treatment, Outcome 14: DBT‐S vs DBT‐I, secondary: attrition (dichotomous), at 6‐12 months follow‐up

Comparison 21: Dialectical behavior therapy (DBT) and related treatments vs active treatment, Outcome 15: DBT skills group (DBT‐S) vs cognitive therapy group (CT‐G) (continuous)

Comparison 21: Dialectical behavior therapy (DBT) and related treatments vs active treatment, Outcome 16: DBT‐S vs CT‐G, secondary: attrition (dichotomous), at end of treatment

Comparison 21: Dialectical behavior therapy (DBT) and related treatments vs active treatment, Outcome 17: DBT skills group (DBT‐S) vs schema‐focused therapy group (SFT‐G)

Comparison 21: Dialectical behavior therapy (DBT) and related treatments vs active treatment, Outcome 18: DBT mindfulness group (DBT‐M) vs DBT interpersonal effectiveness group (DBT‐IE) (continuous)

Comparison 21: Dialectical behavior therapy (DBT) and related treatments vs active treatment, Outcome 19: DBT‐M vs DBT‐IE, secondary: attrition (dichotomous), at end of treatment

Comparison 21: Dialectical behavior therapy (DBT) and related treatments vs active treatment, Outcome 20: DBT mindfulness group (DBT‐M) vs loving‐kindness and compassion meditation (LK/CM), primary: BPD symptom severity (continuous), at end of treatment

Comparison 22: Cognitive behavioural therapy (CBT) and related treatments vs active treatment, Outcome 1: CBT vs trauma‐ and anxiety‐related group psychoeducation (continuous)

Comparison 22: Cognitive behavioural therapy (CBT) and related treatments vs active treatment, Outcome 2: CBT vs trauma‐ and anxiety‐related group psychoeducation, secondary: attrition (dichotomous), at end of treatment

Comparison 22: Cognitive behavioural therapy (CBT) and related treatments vs active treatment, Outcome 3: CBT vs interpersonal psychotherapy (IPT) (continuous)

Comparison 22: Cognitive behavioural therapy (CBT) and related treatments vs active treatment, Outcome 4: CBT vs IPT, secondary: attrition (dichotomous), at end of treatment

Comparison 22: Cognitive behavioural therapy (CBT) and related treatments vs active treatment, Outcome 5: CBT vs Rogerian supportive therapy (continuous)

Comparison 22: Cognitive behavioural therapy (CBT) and related treatments vs active treatment, Outcome 6: CBT vs Rogerian supportive therapy, secondary: attrition (dichotomous), end of treatment

Comparison 22: Cognitive behavioural therapy (CBT) and related treatments vs active treatment, Outcome 7: MACT (Manual‐assisted Cognitive Therapy) vs MACT + therapeutic assessment (MACT + TA) (continuous)

Comparison 22: Cognitive behavioural therapy (CBT) and related treatments vs active treatment, Outcome 8: MACT vs MACT + TA, secondary: attrition (dichotomous), at end of treatment

Comparison 22: Cognitive behavioural therapy (CBT) and related treatments vs active treatment, Outcome 9: Meta‐Cognitive training for BPD (B‐MCT) vs progressive muscle relaxation training (PMR)

Comparison 22: Cognitive behavioural therapy (CBT) and related treatments vs active treatment, Outcome 10: B‐MCT vs progressive muscle relaxation (PMR) training + TAU (dichotomous). Secondary: attrition (dichotomous), at end of treatment

Comparison 22: Cognitive behavioural therapy (CBT) and related treatments vs active treatment, Outcome 11: MOTR (Motive‐Oriented Therapeutic Relationship) vs Good Psychiatric Management (GPM) (continuous)

Comparison 22: Cognitive behavioural therapy (CBT) and related treatments vs active treatment, Outcome 12: MOTR vs (GPM), secondary: attrition (dichotomous), at end of treatment

Comparison 23: Schema‐focused therapy (SFT) vs active treatment, Outcome 1: SFT vs TFP. Primary: BPD symptom severity (continuous), at end of treatment

Comparison 23: Schema‐focused therapy (SFT) vs active treatment, Outcome 2: SFT vs TFP. Secondary: attrition (dichotomous), at 0‐6 months follow‐up

Comparison 23: Schema‐focused therapy (SFT) vs active treatment, Outcome 3: SFT vs SFT + therapist availability (TA). Primary: BPD symptom severity (continuous), at end of treatment

Comparison 23: Schema‐focused therapy (SFT) vs active treatment, Outcome 4: SFT vs SFT + TA. Secondary: attrition (dichotomous), 0‐6 months follow‐up

Comparison 24: Systems training for emotional predictability and problem solving‐based psychoeducation (STEPPS‐PE) vs cognitive rehabilitation (CR), Outcome 1: STEPPS‐PE vs CR

Comparison 24: Systems training for emotional predictability and problem solving‐based psychoeducation (STEPPS‐PE) vs cognitive rehabilitation (CR), Outcome 2: STEPPS‐PE vs CR. Secondary: attrition (dichotomous), at end of treatment

Comparison 25: Eclectic treatments vs active treatment, Outcome 1: Combined inpatient and outpatient psychotherapy versus outpatient psychotherapy

Comparison 25: Eclectic treatments vs active treatment, Outcome 2: Combined inpatient and outpatient psychotherapy versus outpatient psychotherapy. Secondary: attrition (dichotomous), at end of treatment

Comparison 25: Eclectic treatments vs active treatment, Outcome 3: integrative BPD‐oriented adolescent family therapy (I‐BAFT) vs individual drug counselling (IDC)

Comparison 26: Subgroup analysis: therapeutic approaches, Outcome 1: BPD symptom severity

Comparison 26: Subgroup analysis: therapeutic approaches, Outcome 2: Psychosocial functioning

Comparison 27: Subgroup analysis: age, Outcome 1: BPD symptom severity

Comparison 28: Subgroup analysis: duration, Outcome 1: BPD symptom severity

Comparison 28: Subgroup analysis: duration, Outcome 2: Psychosocial functioning

Comparison 29: Subgroup analysis: mode of therapy, Outcome 1: BPD symptom severity

Comparison 29: Subgroup analysis: mode of therapy, Outcome 2: Psychosocial functioning

Comparison 30: Subgroup analysis: setting, Outcome 1: BPD symptom severity

Comparison 30: Subgroup analysis: setting, Outcome 2: Psychosocial functioning

Comparison 31: Subgroup analysis: types of raters, Outcome 1: BPD symptom severity

Comparison 31: Subgroup analysis: types of raters, Outcome 2: Psychosocial functioning

Comparison 32: Subgroup analysis: types of TAU, Outcome 1: BPD symptom severity

Comparison 32: Subgroup analysis: types of TAU, Outcome 2: Psychosocial functioning

Comparison 33: Subgroup analysis: type of comparison group, Outcome 1: BPD symptom severity

Comparison 33: Subgroup analysis: type of comparison group, Outcome 2: Psychosocial functioning

Comparison 34: Subgroup analysis: types of scales, Outcome 1: BPD symptom severity

Comparison 34: Subgroup analysis: types of scales, Outcome 2: Psychosocial functioning

Comparison 35: TSA sensitivity analyses: psychotherapy versus TAU, Outcome 1: Primary: BPD symptom severity, at end of treatment

Comparison 35: TSA sensitivity analyses: psychotherapy versus TAU, Outcome 2: Primary: self‐harm

Comparison 35: TSA sensitivity analyses: psychotherapy versus TAU, Outcome 3: Primary: suicide‐related outcomes

Comparison 35: TSA sensitivity analyses: psychotherapy versus TAU, Outcome 4: Primary: psychosocial functioning, at end of treatment

Comparison 35: TSA sensitivity analyses: psychotherapy versus TAU, Outcome 5: Secondary: depression
| Psychotherapy versus treatment‐as‐usual | ||||||
| Patient or population: borderline personality disorder Settings: inpatient and outpatient Intervention: psychotherapy Comparison: treatment‐as‐usual (TAU) | ||||||
| Outcomes | Illustrative comparative risks* (95% CI) | Relative effect(95% CI) | Number of participants (RCTs) | Quality of the evidence (GRADE) | Comments | |
|---|---|---|---|---|---|---|
| Assumed risk | Corresponding risk | |||||
| TAU | Psychotherapy | |||||
| BPD symptom severity Measured by: clinicians and self‐rated Timing of outcome assessment: end of treatment | ‐ | The mean score in the intervention groups was 0.52 SD lower (0.70 lower to 0.33 lower) | ‐ | 1244 (22 RCTs) | ⊕⊕⊕⊝ Moderatea | The SMD of −0.52 corresponds to −3.6 on the Zanarini BPD scale. The MIREDIF on this scale is 3.0 points TSA adjusted Cl = −5.49 to −1.90 on the Zanarini BPD scale TSA RIS = 901 |
| Self‐harm (frequency) Measured by: clinicians and self‐rated Timing of outcome assessment: end of treatment | ‐ | The mean score in the intervention groups was 0.32 SD lower (0.49 lower to 0.14 lower) | ‐ | 616 (13 RCTs) | ⊕⊕⊝⊝ | The SMD of −0. 32 corresponds to −0.82 on the DSHI. The MIREDIF on this scale is −1.25 points (½ SD) TSA adjusted CI = −0.59 to −0.08 on the DSHI TSA RIS = 97 |
| Suicide‐related outcomes (suicidality) Measured by: clinicians and self‐rated Timing of outcome assessment: end of treatment | ‐ | The mean score in the intervention groups was 0.34 SD lower (0.57 lower to 0.11 lower) | ‐ | 666 (13 RCTs) | ⊕⊕⊝⊝ Lowa,b | The SMD of −0. 34 corresponds to −0.11 on the SASII. The MIREDIF on this scale is −0.17 points (½ SD) TSA adjusted CI = −0.18 to −0.04 on the SASII TSA RIS = 253 |
| Psychosocial functioning Measured by: clinicians and self‐rated Timing of outcome assessment: end of treatment | ‐ | The mean score in the intervention groups was 0.45 SD lower (0.68 lower to 0.22 lower) | ‐ | 1314 (22 RCTs) | ⊕⊕⊝⊝ | The SMD of −0.45 corresponds to −2.8 on the GAF. The MIREDIF on this scale is −4.0 points TSA adjusted CI = −3.97 to −1.94 on the GAF TSA RIS = 947 |
| Depression Measured by: clinicians and self‐rated Timing of outcome assessment: end of treatment | ‐ | The mean score in the intervention groups was 0.39 SD lower (0.61 lower to 0.17 lower) | ‐ | 1568 (22 RCTs) | ⊕⊝⊝⊝ | The SMD of ‐0.45 corresponds to −2.45 on the Hamilton Depression Scale. The MIREDIF on this scale is 3.0 points TSA adjusted CI = −3.34 to −1.72 on the Hamilton Depression Scale TSA RIS = 2274 |
| Attrition Timing of outcome assessment: end of treatment | 328 per 1000 | 328 per 1000 (95% CI 56 fewer to 66 higher) | RR 1.00 (95% CI 0.83 to 1.20) | 2225 (32 RCTs) | ⊕⊕⊝⊝ | ‐ |
| Adverse effects Timing of outcome assessment: end of treatment | 74 per 1000 | 6 per 1000 (95% CI 41 fewer to 65 higher) | RR 0.92 (95% CI 0.45 to 1.88) | 381 (2 RCTs) | ⊕⊕⊝⊝ | ‐ |
| *The basis for the assumed risk (e.g. the median control group risk across studies) is provided in footnotes. The corresponding risk (and its 95% CI) is based on the assumed risk in the comparison group and the relative effect of the intervention (and its 95% CI). CI: Confidence interval; DSHI: Deliberate Self‐Harm Inventory; GAF: Global Assessment of Functioning scale; MIREDIF: Minimum relevant difference; RCTs: Randomised controlled trials; RIS: Required information size; RR: Risk Ratio; SASII: Suicide Attempt Self‐Injury Interview; SD: Standard deviation; SMD: Standardised mean difference; TAU: treatment‐as‐usual; TSA: Trial Sequential Analysis | ||||||
| GRADE Working Group grades of evidence | ||||||
| aWe downgraded the quality of this evidence by one level due to risk of bias (other bias). | ||||||
| Psychotherapy versus waiting list or no treatment | ||||||
| Patient or population: borderline personality disorder Settings: inpatient and outpatient Intervention: psychotherapy Comparison: waiting list or no treatment | ||||||
| Outcomes | Illustrative comparative risks* (95% CI) | Relative effect (95% CI) | Number of participants (RCTs) | Quality of the evidence (GRADE) | Comments | |
|---|---|---|---|---|---|---|
| Assumed risk | Corresponding risk | |||||
| Waiting list or no treatment | Psychotherapy | |||||
| BPD symptom severity Measured by: clinicians and self‐rated Timing of outcome assessment: end of treatment | ‐ | The mean score in the intervention groups was 0.49 SD lower (0.93 lower to 0.05 lower) | ‐ | 161 (3 RCTs) | ⊕⊕⊝⊝ | An SMD of 0.49 represents a moderate effect. |
| Self‐harm Measured by: clinicians and self‐rated Timing of outcome assessment: end of treatment | ‐ | The mean score in the intervention groups was0.17 SD lower (0.52 lower to 0.18 higher) | ‐ | 128 (2 RCTs) | ⊕⊕⊝⊝ | An SMD of 0.17 represents a small effect. |
| Suicide‐related outcomes Measured by: self‐rated Timing of outcome assessment: end of treatment | ‐ | The mean score in the intervention groups was 5.62 SD lower (16.39 lower to 5.16 higher) | ‐ | 108 (2 RCTs) | ⊕⊝⊝⊝ Verylowa,b,c | An SMD of 5.62 represents a large effect. |
| Psychosocial functioning Measured by: clinicians and self‐rated Timing of outcome assessment: end of treatment | ‐ | The mean score in the intervention groups was 0.56 SD lower (1.01 lower to 0.11 lower) | ‐ | 219 (5 RCTs) | ⊕⊕⊝⊝ | An SMD of 0.56 represents a moderate effect. |
| Depression Measured by: clinicians and self‐rated Timing of outcome assessment: end of treatment | ‐ | The mean score in the intervention groups was 1.28 SD lower (2.21 lower to 0.34 lower) | ‐ | 239 (6 RCTs) | ⊕⊕⊝⊝ | An effect size of 1.28 represents a large effect. |
| Attrition Timing of outcome assessment: end of treatment | 81 per 1000 | 147 per 1000 (95% CI 118 fewer to 74 higher) | RR 0.55 (95% CI 0.20 to 1.50) | 144 (3 RCTs) | ⊕⊝⊝⊝ | ‐ |
| Adverse effects (not measured | See comments | See comments | ‐ | ‐ | ‐ | No studies were found that assessed this outcome |
| *The basis for the assumed risk (e.g. the median control group risk across studies) is provided in footnotes. The corresponding risk (and its 95% CI) is based on the assumed risk in the comparison group and the relative effect of the intervention (and its 95% CI). CI: Confidence interval; RCTs: Randomised controlled trials; RR: Risk ratio; SMD: Standardized mean difference | ||||||
| GRADE Working Group grades of evidence | ||||||
| aWe downgraded the quality of this evidence by one level due to risk of bias. | ||||||
| Dialectical behavioural therapy or mentalisation‐based therapy versus treatment‐as‐usual | ||||||
| Patient or population: borderline personality disorder Settings: inpatient and outpatient Intervention: dialectical behavioural therapy (DBT) or mentalisation‐based therapy (MBT) Comparison: treatment‐as‐usual (TAU) | ||||||
| Outcomes | Illustrative comparative risks* (95% CI) | Relative effect (95% CI) | Number of participants (RCTs) | Quality of the evidence (GRADE) | Comments | |
|---|---|---|---|---|---|---|
| Assumed risk | Corresponding risk | |||||
| TAU | DBT or MBT | |||||
| DBT | ||||||
| BPD severity Measured by: clinicians Timing of outcome assessment: end of treatment | ‐ | The mean score in the intervention groups was 0.60 SD lower (1.05 lower to 0.14 lower) | ‐ | 149 (3 RCTs) | ⊕⊕⊝⊝ | An SMD of 0.60 represents a moderate effect. |
| Self‐harm Measured by: clinicians Timing of outcome assessment: end of treatment | ‐ | The mean score in the intervention groups was | ‐ | 376 (7 RCTs) | ⊕⊕⊝⊝ | An SMD of 0.28 represents a small effect. |
| Psychosocial functioning Measured by: clinicians and self‐rated Timing of outcome assessment: end of treatment | ‐ | The mean score in the intervention groups was 0.36 SD lower (0.69 lower to 0.03 lower) | ‐ | 225 (6 RCTs) | ⊕⊕⊝⊝ | An SMD of 0.36 represents a small effect. |
| MBT | ||||||
| Self‐harm Measured by: clinicians Timing of outcome assessment: end of treatment | 631 per 1000 | 240 per 1000 (95% CI 334 fewer to 126 fewer) | RR 0.62 (95% CI 0.49 to 0.80) | 252 (3 RCTs) | ⊕⊕⊝⊝ | ‐ |
| Suicide‐related outcomes Measured by: clinicians Timing of outcome assessment: end of treatment | 298 per 1000 | 268 per 1000 (95% CI 286 fewer to 209 fewer) | RR 0.10 (95% CI 0.04 to 0.30) | 218 (3 RCTs) | ⊕⊕⊝⊝ | ‐ |
| *The basis for the assumed risk (e.g. the median control group risk across studies) is provided in footnotes. The corresponding risk (and its 95% CI) is based on the assumed risk in the comparison group and the relative effect of the intervention (and its 95% CI). CI: Confidence interval; DBT: Dialectical behavioural therapy; MBT: Mentalisation‐based therapy; RCTs: Randomised controlled trials; RR: Risk ratio; SMD: Standardized mean difference; TAU: Treatment‐as‐usual | ||||||
| GRADE Working Group grades of evidence | ||||||
| aWe downgraded the quality of this evidence by one level due to risk of bias. | ||||||
| Section | Protocol (Storebø 2018) | Review |
|---|---|---|
| Unit of analysis issues | Cross‐over trials We would have included cross‐over trials. We planned to include data up to the point of first cross‐over (first period only; Curtin 2002). We did not intend to use data from subsequent periods due to the likelihood of carry‐over effects from the preceding treatment(s). We planned not to combine repeated participant interventions in one meta‐analysis. | We did not include any cross‐over trial. |
| Cluster‐randomised trials Had trials used cluster randomisation, we would have anticipated that investigators would have presented their results after appropriately controlling for clustering effects (robust standard errors or hierarchical linear models). If it had been unclear whether a cluster‐randomised trial had used appropriate controls for clustering, we would have contacted the investigators for further information. We would have requested and re‐analysed individual patient data using multilevel models that controlled for clustering, if appropriate controls had not been used. Following this, we would have analysed effect sizes and standard errors in RevMan 5 (Review Manager 2014), using the generic inverse method (Higgins 2011). If there had been insufficient information to control for clustering, we would have entered outcome data using individuals as the units of analysis, and then conducted a sensitivity analysis to assess the potential biasing effects of inadequately controlled cluster‐randomised trials (Donner 2002). If individual participant data had not been available, we would have looked for information on intra‐class correlation coefficients to adjust for the potential clustering effects. | We did not include any cluster‐randomised trial. | |
| Adjustment for multiplicity We planned to adjust the P values and CIs for multiplicity due to the many secondary outcome comparisons following the method described by Jakobsen 2014. | We only adjusted the primary outcomes and one secondary outcomes for multiplicity, i.e. those outcomes presented in the SoF table. | |
| Dealing with missing data | Had dichotomous data not been presented on the basis of ITT data, we would have added the number of participants lost in each group to the participants with unfavourable results, acting on the assumption that most people with BPD do not get lost at random. | We were unable to perform this analysis due to insufficient information |
| Subgroup analysis and investigation of heterogeneity | We intended to conduct subgroup analyses to make hypotheses about the subgroups mentioned below.
| We did not conduct these preplanned analyses because of lack of data. |
| Sensitivity analysis | We intended to assess the impact of heterogeneity on the overall pooled effect estimate by removing studies ('outliers') that contributed to heterogeneity. We intended to remove outliers one by one and assess the impact on the overall outcome.
| We were not able to perform these analyses, due to a lack of sufficient data. |
| TSA | We intended to calculate post hoc, low bias, risk diversity‐adjusted required information size TSA analyses for the primary outcomes. | We were not able to perform these analyses with low risk of bias trials. |
| BPD: borderline personality disorder; CI: confidence interval;ITT: intention to treat; TAU: treatment‐as‐usual | ||
| Outcome or subgroup title | No. of studies | No. of participants | Statistical method | Effect size |
| 1.1 Primary: BPD symptom severity (continuous) Show forest plot | 23 | Std. Mean Difference (IV, Random, 95% CI) | Subtotals only | |
| 1.1.1 End of treatment | 22 | 1244 | Std. Mean Difference (IV, Random, 95% CI) | ‐0.52 [‐0.70, ‐0.33] |
| 1.1.2 0‐6 months follow‐up | 2 | 41 | Std. Mean Difference (IV, Random, 95% CI) | ‐0.59 [‐1.23, 0.05] |
| 1.1.3 6‐12 months follow‐up | 2 | 157 | Std. Mean Difference (IV, Random, 95% CI) | ‐0.04 [‐0.36, 0.27] |
| 1.1.4 12 months and over follow‐up | 2 | 97 | Std. Mean Difference (IV, Random, 95% CI) | ‐0.94 [‐2.58, 0.70] |
| 1.2 Primary: BPD symptom severity (dichotomous), at above 12 months follow‐up Show forest plot | 1 | Risk Ratio (IV, Fixed, 95% CI) | Subtotals only | |
| 1.3 Primary: self‐harm (continuous) Show forest plot | 13 | Std. Mean Difference (IV, Random, 95% CI) | Subtotals only | |
| 1.3.1 End of treatment | 13 | 616 | Std. Mean Difference (IV, Random, 95% CI) | ‐0.32 [‐0.49, ‐0.14] |
| 1.3.2 0‐6 months follow‐up | 1 | 28 | Std. Mean Difference (IV, Random, 95% CI) | ‐0.52 [‐1.28, 0.23] |
| 1.3.3 6‐12 months follow‐up | 3 | 174 | Std. Mean Difference (IV, Random, 95% CI) | ‐0.18 [‐0.48, 0.12] |
| 1.4 Primary: self‐harm (dichotomous) Show forest plot | 6 | Risk Ratio (IV, Random, 95% CI) | Subtotals only | |
| 1.4.1 End of treatment | 6 | 513 | Risk Ratio (IV, Random, 95% CI) | 0.85 [0.63, 1.14] |
| 1.4.2 0‐6 months follow‐up | 1 | 41 | Risk Ratio (IV, Random, 95% CI) | 0.14 [0.04, 0.56] |
| 1.4.3 6‐12 months follow‐up | 1 | 41 | Risk Ratio (IV, Random, 95% CI) | 0.27 [0.10, 0.68] |
| 1.4.4 12 months and over follow‐up | 1 | 41 | Risk Ratio (IV, Random, 95% CI) | 0.33 [0.15, 0.76] |
| 1.5 Primary: suicide‐related outcomes (continuous) Show forest plot | 13 | Std. Mean Difference (IV, Random, 95% CI) | Subtotals only | |
| 1.5.1 End of treatment | 13 | 666 | Std. Mean Difference (IV, Random, 95% CI) | ‐0.34 [‐0.57, ‐0.11] |
| 1.5.2 0‐6 months follow‐up | 2 | 36 | Std. Mean Difference (IV, Random, 95% CI) | ‐0.43 [‐1.10, 0.23] |
| 1.5.3 6‐12 months follow‐up | 2 | 109 | Std. Mean Difference (IV, Random, 95% CI) | ‐0.42 [‐0.80, ‐0.04] |
| 1.5.4 Above 12 months follow‐up | 1 | 76 | Std. Mean Difference (IV, Random, 95% CI) | ‐0.31 [‐0.77, 0.14] |
| 1.6 Primary: suicide‐related outcomes (dichotomous) Show forest plot | 5 | Risk Ratio (IV, Random, 95% CI) | Subtotals only | |
| 1.6.1 End of treatment | 5 | 396 | Risk Ratio (IV, Random, 95% CI) | 0.27 [0.11, 0.67] |
| 1.6.2 0‐6 months follow‐up | 1 | 41 | Risk Ratio (IV, Random, 95% CI) | 0.25 [0.06, 1.05] |
| 1.6.3 Above 12 months follow‐up | 1 | 41 | Risk Ratio (IV, Random, 95% CI) | 0.29 [0.11, 0.74] |
| 1.7 Primary: psychosocial functioning (continuous) Show forest plot | 23 | Std. Mean Difference (IV, Random, 95% CI) | Subtotals only | |
| 1.7.1 End of treatment | 22 | 1314 | Std. Mean Difference (IV, Random, 95% CI) | ‐0.45 [‐0.68, ‐0.22] |
| 1.7.2 0‐6 months follow‐up | 1 | 9 | Std. Mean Difference (IV, Random, 95% CI) | ‐1.23 [‐2.74, 0.29] |
| 1.7.3 6‐12 months follow‐up | 3 | 247 | Std. Mean Difference (IV, Random, 95% CI) | ‐0.09 [‐0.40, 0.23] |
| 1.7.4 Above 12 months follow‐up | 6 | 499 | Std. Mean Difference (IV, Random, 95% CI) | ‐0.27 [‐0.60, 0.05] |
| 1.8 Secondary: anger (continuous) Show forest plot | 8 | Std. Mean Difference (IV, Random, 95% CI) | Subtotals only | |
| 1.8.1 End of treatment | 8 | 323 | Std. Mean Difference (IV, Random, 95% CI) | ‐0.38 [‐0.64, ‐0.12] |
| 1.8.2 0‐6 months follow‐up | 1 | 8 | Std. Mean Difference (IV, Random, 95% CI) | ‐1.20 [‐2.82, 0.41] |
| 1.8.3 6‐12 months follow‐up | 2 | 111 | Std. Mean Difference (IV, Random, 95% CI) | ‐0.12 [‐0.50, 0.25] |
| 1.8.4 Above 12 months follow‐up | 1 | 80 | Std. Mean Difference (IV, Random, 95% CI) | 0.02 [‐0.42, 0.46] |
| 1.9 Secondary: affective instability (continuous) Show forest plot | 12 | Std. Mean Difference (IV, Random, 95% CI) | Subtotals only | |
| 1.9.1 End of treatment | 12 | 620 | Std. Mean Difference (IV, Random, 95% CI) | ‐0.68 [‐0.98, ‐0.39] |
| 1.9.2 6‐12 months follow‐up | 1 | 33 | Std. Mean Difference (IV, Random, 95% CI) | ‐0.52 [‐1.21, 0.18] |
| 1.10 Secondary: chronic feelings of emptiness (continuous) Show forest plot | 4 | Std. Mean Difference (IV, Random, 95% CI) | Subtotals only | |
| 1.10.1 End of treatment | 4 | 187 | Std. Mean Difference (IV, Random, 95% CI) | ‐0.39 [‐0.69, ‐0.10] |
| 1.10.2 6‐12 months follow‐up | 1 | 33 | Std. Mean Difference (IV, Random, 95% CI) | ‐0.58 [‐1.28, 0.11] |
| 1.11 Secondary: impulsivity (continuous) Show forest plot | 10 | Std. Mean Difference (IV, Random, 95% CI) | Subtotals only | |
| 1.11.1 End of treatment | 10 | 491 | Std. Mean Difference (IV, Random, 95% CI) | ‐0.54 [‐0.84, ‐0.25] |
| 1.11.2 6‐12 months follow‐up | 2 | 77 | Std. Mean Difference (IV, Random, 95% CI) | 0.32 [‐0.13, 0.77] |
| 1.12 Secondary: impulsivity (dichotomous), at end of treatment Show forest plot | 1 | Risk Ratio (IV, Fixed, 95% CI) | Subtotals only | |
| 1.13 Secondary: interpersonal problems (continuous) Show forest plot | 18 | Std. Mean Difference (IV, Random, 95% CI) | Subtotals only | |
| 1.13.1 End of treatment | 18 | 1159 | Std. Mean Difference (IV, Random, 95% CI) | ‐0.42 [‐0.68, ‐0.16] |
| 1.13.2 0‐6 months follow‐up | 1 | 53 | Std. Mean Difference (IV, Random, 95% CI) | ‐0.41 [‐1.01, 0.20] |
| 1.13.3 6‐12 months follow‐up | 2 | 132 | Std. Mean Difference (IV, Random, 95% CI) | ‐0.17 [‐0.65, 0.32] |
| 1.13.4 Above 12 months follow‐up | 3 | 172 | Std. Mean Difference (IV, Random, 95% CI) | 0.00 [‐0.54, 0.54] |
| 1.14 Secondary: abandonment (continuous) Show forest plot | 2 | Std. Mean Difference (IV, Random, 95% CI) | Subtotals only | |
| 1.14.1 End of treatment | 2 | 84 | Std. Mean Difference (IV, Random, 95% CI) | ‐0.22 [‐0.66, 0.21] |
| 1.14.2 6‐12 months follow‐up | 1 | 33 | Std. Mean Difference (IV, Random, 95% CI) | ‐0.39 [‐1.08, 0.30] |
| 1.15 Secondary: identity disturbance (continuous) Show forest plot | 4 | Std. Mean Difference (IV, Random, 95% CI) | Subtotals only | |
| 1.15.1 End of treatment | 4 | 250 | Std. Mean Difference (IV, Random, 95% CI) | ‐0.37 [‐0.84, 0.10] |
| 1.15.2 6‐12 months follow‐up | 1 | 33 | Std. Mean Difference (IV, Random, 95% CI) | ‐1.09 [‐1.83, ‐0.35] |
| 1.16 Secondary: dissociation and psychotic‐like symptoms (continuous) Show forest plot | 6 | Std. Mean Difference (IV, Random, 95% CI) | Subtotals only | |
| 1.16.1 End of treatment | 6 | 244 | Std. Mean Difference (IV, Random, 95% CI) | ‐0.47 [‐0.85, ‐0.10] |
| 1.16.2 0‐6 months follow‐up | 2 | 35 | Std. Mean Difference (IV, Random, 95% CI) | ‐0.97 [‐1.69, ‐0.26] |
| 1.16.3 6‐12 months follow‐up | 1 | 33 | Std. Mean Difference (IV, Random, 95% CI) | ‐0.59 [‐1.29, 0.11] |
| 1.16.4 12 months and over follow‐up | 1 | 24 | Std. Mean Difference (IV, Random, 95% CI) | ‐0.01 [‐0.81, 0.79] |
| 1.17 Secondary: depression (continuous) Show forest plot | 22 | Std. Mean Difference (IV, Random, 95% CI) | Subtotals only | |
| 1.17.1 End of treatment | 22 | 1568 | Std. Mean Difference (IV, Random, 95% CI) | ‐0.39 [‐0.61, ‐0.17] |
| 1.17.2 0‐6 months follow‐up | 4 | 125 | Std. Mean Difference (IV, Random, 95% CI) | ‐0.80 [‐1.26, ‐0.34] |
| 1.17.3 6‐12 months follow‐up | 3 | 260 | Std. Mean Difference (IV, Random, 95% CI) | ‐0.40 [‐0.95, 0.16] |
| 1.17.4 12 months and over follow‐up | 5 | 311 | Std. Mean Difference (IV, Random, 95% CI) | ‐0.40 [‐0.74, ‐0.06] |
| 1.18 Secondary: depression (dichotomous), at end of treatment Show forest plot | 1 | Risk Ratio (IV, Fixed, 95% CI) | Subtotals only | |
| 1.19 Secondary: attrition (dichotomous) Show forest plot | 33 | Risk Ratio (M‐H, Random, 95% CI) | Subtotals only | |
| 1.19.1 End of treatment | 32 | 2225 | Risk Ratio (M‐H, Random, 95% CI) | 1.00 [0.83, 1.20] |
| 1.19.2 0‐6 months follow‐up | 1 | 60 | Risk Ratio (M‐H, Random, 95% CI) | 0.58 [0.34, 1.00] |
| 1.20 Secondary: non‐serious adverse effects (dichotomous), at end of treatment Show forest plot | 2 | 381 | Risk Ratio (M‐H, Random, 95% CI) | 0.92 [0.45, 1.88] |
| 1.21 Secondary: serious adverse effects (dichotomous), at end of treatment Show forest plot | 4 | 571 | Risk Ratio (IV, Fixed, 95% CI) | 0.86 [0.14, 5.09] |
| Outcome or subgroup title | No. of studies | No. of participants | Statistical method | Effect size |
| 2.1 Primary: BPD symptom severity (continuous), at end of treatment Show forest plot | 1 | Mean Difference (IV, Fixed, 95% CI) | Subtotals only | |
| 2.2 Secondary: affective instability (continuous), at end of treatment Show forest plot | 1 | Mean Difference (IV, Fixed, 95% CI) | Subtotals only | |
| 2.3 Secondary: depression (continuous), at end of treatment Show forest plot | 1 | Mean Difference (IV, Fixed, 95% CI) | Subtotals only | |
| 2.4 Secondary: attrition (dichotomous), at end of treatment Show forest plot | 1 | Risk Ratio (M‐H, Fixed, 95% CI) | Subtotals only | |
| Outcome or subgroup title | No. of studies | No. of participants | Statistical method | Effect size |
| 3.1 Primary: BPD symptom severity (continuous), at end of treatment Show forest plot | 3 | 149 | Std. Mean Difference (IV, Random, 95% CI) | ‐0.60 [‐1.05, ‐0.14] |
| 3.2 Primary, self‐harm (continuous) Show forest plot | 7 | Std. Mean Difference (IV, Random, 95% CI) | Subtotals only | |
| 3.2.1 End of treatment | 7 | 376 | Std. Mean Difference (IV, Random, 95% CI) | ‐0.28 [‐0.48, ‐0.07] |
| 3.2.2 6‐12 months follow‐up | 2 | 141 | Std. Mean Difference (IV, Random, 95% CI) | ‐0.26 [‐0.59, 0.07] |
| 3.3 Primary: suicide‐related outcomes (continuous), at end of treatment Show forest plot | 5 | 231 | Std. Mean Difference (IV, Random, 95% CI) | ‐0.23 [‐0.68, 0.23] |
| 3.4 Primary: suicide‐related outcomes, attempts (dichotomous), at end of treatment Show forest plot | 1 | Risk Ratio (M‐H, Fixed, 95% CI) | Subtotals only | |
| 3.5 Primary: psychosocial functioning (continuous), at end of treatment Show forest plot | 6 | 225 | Std. Mean Difference (IV, Random, 95% CI) | ‐0.36 [‐0.69, ‐0.03] |
| 3.6 Secondary: anger (continuous) Show forest plot | 5 | Std. Mean Difference (IV, Random, 95% CI) | Subtotals only | |
| 3.6.1 End of treatment | 5 | 230 | Std. Mean Difference (IV, Random, 95% CI) | ‐0.47 [‐0.86, ‐0.09] |
| 3.6.2 6‐12 months follow‐up | 1 | 78 | Std. Mean Difference (IV, Random, 95% CI) | ‐0.17 [‐0.62, 0.27] |
| 3.6.3 Above 12 months follow‐up | 1 | 80 | Std. Mean Difference (IV, Random, 95% CI) | 0.02 [‐0.42, 0.46] |
| 3.7 Secondary: affective instability (continuous), at end of treatment Show forest plot | 2 | 80 | Std. Mean Difference (IV, Random, 95% CI) | ‐0.57 [‐1.64, 0.51] |
| 3.8 Secondary: chronic feelings of emptiness (continuous), at end of treatment Show forest plot | 1 | Mean Difference (IV, Fixed, 95% CI) | Subtotals only | |
| 3.9 Secondary: impulsivity (continuous) Show forest plot | 3 | Std. Mean Difference (IV, Random, 95% CI) | Subtotals only | |
| 3.9.1 End of treatment | 3 | 128 | Std. Mean Difference (IV, Random, 95% CI) | ‐0.35 [‐0.71, ‐0.00] |
| 3.9.2 6‐12 months follow‐up | 1 | 44 | Std. Mean Difference (IV, Random, 95% CI) | 0.30 [‐0.30, 0.90] |
| 3.10 Secondary: interpersonal problems (continuous), at end of treatment Show forest plot | 3 | 148 | Std. Mean Difference (IV, Random, 95% CI) | ‐0.12 [‐0.45, 0.20] |
| 3.11 Secondary: dissociation and psychotic‐like symptoms (continuous), at end of treatment Show forest plot | 4 | 194 | Std. Mean Difference (IV, Random, 95% CI) | ‐0.45 [‐0.73, ‐0.16] |
| 3.12 Secondary: depression (continuous) Show forest plot | 5 | Std. Mean Difference (IV, Random, 95% CI) | Subtotals only | |
| 3.12.1 End of treatment | 5 | 219 | Std. Mean Difference (IV, Random, 95% CI) | ‐0.47 [‐0.98, 0.03] |
| 3.12.2 6‐12 months follow‐up | 1 | 81 | Std. Mean Difference (IV, Random, 95% CI) | ‐0.23 [‐0.67, 0.21] |
| 3.13 Secondary: attrition (dichotomous) Show forest plot | 11 | Risk Ratio (M‐H, Random, 95% CI) | Subtotals only | |
| 3.13.1 End of treatment | 10 | 591 | Risk Ratio (M‐H, Random, 95% CI) | 1.27 [0.70, 2.31] |
| 3.13.2 0‐6 months follow‐up | 1 | 60 | Risk Ratio (M‐H, Random, 95% CI) | 0.58 [0.34, 1.00] |
| 3.14 Secondary: adverse effects (dichotomous), at end of treatment Show forest plot | 1 | Risk Ratio (M‐H, Fixed, 95% CI) | Subtotals only | |
| 3.15 Secondary: serious adverse effects (dichotomous), at end of treatment Show forest plot | 1 | Risk Ratio (M‐H, Fixed, 95% CI) | Subtotals only | |
| Outcome or subgroup title | No. of studies | No. of participants | Statistical method | Effect size |
| 4.1 Primary: BPD symptom severity (continuous) Show forest plot | 6 | Std. Mean Difference (IV, Random, 95% CI) | Subtotals only | |
| 4.1.1 End of treatment | 5 | 267 | Std. Mean Difference (IV, Random, 95% CI) | ‐0.13 [‐0.38, 0.11] |
| 4.1.2 0‐6 months follow‐up | 1 | 15 | Std. Mean Difference (IV, Random, 95% CI) | ‐0.40 [‐1.49, 0.68] |
| 4.1.3 Above 12 months follow‐up | 2 | 97 | Std. Mean Difference (IV, Random, 95% CI) | ‐0.94 [‐2.58, 0.70] |
| 4.2 Primary: self‐harm (continuous), at end of treatment Show forest plot | 1 | Mean Difference (IV, Fixed, 95% CI) | Subtotals only | |
| 4.3 Primary: self‐harm (dichotomous) Show forest plot | 3 | Risk Ratio (IV, Random, 95% CI) | Subtotals only | |
| 4.3.1 End of treatment | 3 | 252 | Risk Ratio (IV, Random, 95% CI) | 0.62 [0.49, 0.80] |
| 4.3.2 0‐6 months follow‐up | 1 | 41 | Risk Ratio (IV, Random, 95% CI) | 0.14 [0.04, 0.56] |
| 4.3.3 6‐12 months follow‐up | 1 | 41 | Risk Ratio (IV, Random, 95% CI) | 0.27 [0.10, 0.68] |
| 4.3.4 Above 12 months follow‐up | 1 | 41 | Risk Ratio (IV, Random, 95% CI) | 0.33 [0.15, 0.76] |
| 4.4 Primary: suicide‐related outcomes (dichotomous) Show forest plot | 3 | Risk Ratio (M‐H, Random, 95% CI) | Subtotals only | |
| 4.4.1 End of treatment | 3 | 218 | Risk Ratio (M‐H, Random, 95% CI) | 0.10 [0.04, 0.30] |
| 4.4.2 0‐6 months follow‐up | 1 | 41 | Risk Ratio (M‐H, Random, 95% CI) | 0.25 [0.06, 1.05] |
| 4.4.3 Above 12 months follow‐up | 1 | 41 | Risk Ratio (M‐H, Random, 95% CI) | 0.29 [0.11, 0.74] |
| 4.5 Primary: psychosocial functioning (continuous) Show forest plot | 3 | Std. Mean Difference (IV, Random, 95% CI) | Subtotals only | |
| 4.5.1 End of treatment | 3 | 239 | Std. Mean Difference (IV, Random, 95% CI) | ‐0.54 [‐1.24, 0.16] |
| 4.5.2 Above 12 months follow‐up | 2 | 104 | Std. Mean Difference (IV, Random, 95% CI) | ‐0.41 [‐0.97, 0.15] |
| 4.6 Secondary: interpersonal problems (continuous) Show forest plot | 5 | Std. Mean Difference (IV, Random, 95% CI) | Subtotals only | |
| 4.6.1 End of treatment | 5 | 357 | Std. Mean Difference (IV, Random, 95% CI) | ‐0.68 [‐1.33, ‐0.02] |
| 4.6.2 0‐6 months follow‐up | 1 | 53 | Std. Mean Difference (IV, Random, 95% CI) | ‐0.41 [‐1.01, 0.20] |
| 4.6.3 Above 12 months follow‐up | 2 | 96 | Std. Mean Difference (IV, Random, 95% CI) | ‐0.28 [‐0.71, 0.14] |
| 4.7 Secondary: depression (continuous) Show forest plot | 4 | Std. Mean Difference (IV, Random, 95% CI) | Subtotals only | |
| 4.7.1 End of treatment | 4 | 333 | Std. Mean Difference (IV, Random, 95% CI) | ‐0.58 [‐1.22, 0.05] |
| 4.7.2 0‐6 months follow‐up | 2 | 91 | Std. Mean Difference (IV, Random, 95% CI) | ‐0.81 [‐1.69, 0.07] |
| 4.7.3 6‐12 months follow‐up | 1 | 37 | Std. Mean Difference (IV, Random, 95% CI) | ‐1.17 [‐1.88, ‐0.45] |
| 4.7.4 Above 12 months follow‐up | 2 | 90 | Std. Mean Difference (IV, Random, 95% CI) | ‐0.72 [‐1.55, 0.10] |
| 4.8 Secondary: depression (dichotomous), at end of treatment Show forest plot | 1 | Risk Ratio (IV, Fixed, 95% CI) | Subtotals only | |
| 4.9 Secondary: attrition (dichotomous), at end of treatment Show forest plot | 7 | 552 | Risk Ratio (M‐H, Random, 95% CI) | 0.99 [0.79, 1.25] |
| 4.10 Secondary: adverse effects (dichotomous), at end of treatment Show forest plot | 1 | Risk Ratio (M‐H, Fixed, 95% CI) | Subtotals only | |
| 4.11 Mentalisation‐based treatment for eating disorders (MBT‐ED) versus specialist supportive clinical management (SSCM‐ED) (generic inverse variance) Show forest plot | 1 | Mean Difference (IV, Fixed, 95% CI) | Subtotals only | |
| 4.11.1 Primary: psychosocial functioning (continuous), at end of treatment | 1 | Mean Difference (IV, Fixed, 95% CI) | ‐0.07 [‐0.86, 0.72] | |
| 4.11.2 Primary: psychosocial functioning (dichotomous), at 0‐6 months follow‐up | 1 | Mean Difference (IV, Fixed, 95% CI) | ‐0.44 [‐1.52, 0.64] | |
| 4.11.3 Secondary: interpersonal problems (continuous), at end of treatment | 1 | Mean Difference (IV, Fixed, 95% CI) | ‐0.10 [‐0.89, 0.69] | |
| 4.11.4 Secondary: interpersonal problems (continuous), at 0‐6 months follow‐up | 1 | Mean Difference (IV, Fixed, 95% CI) | ‐0.06 [‐1.15, 1.03] | |
| 4.11.5 Secondary: depression (continuous), at end of treatment | 1 | Mean Difference (IV, Fixed, 95% CI) | 0.19 [‐0.60, 0.98] | |
| 4.11.6 Secondary: depression (continuous), at 0‐6 months follow‐up | 1 | Mean Difference (IV, Fixed, 95% CI) | 0.51 [‐0.62, 1.64] | |
| Outcome or subgroup title | No. of studies | No. of participants | Statistical method | Effect size |
| 5.1 Primary: BPD symptom severity (continuous) Show forest plot | 1 | Mean Difference (IV, Fixed, 95% CI) | Subtotals only | |
| 5.1.1 End of treatment | 1 | 26 | Mean Difference (IV, Fixed, 95% CI) | ‐3.08 [‐4.99, ‐1.17] |
| 5.1.2 0‐6 months follow‐up | 1 | 26 | Mean Difference (IV, Fixed, 95% CI) | ‐2.02 [‐4.23, 0.19] |
| 5.2 Primary: BPD symptom severity (dichotomous), at above 12 months follow‐up Show forest plot | 1 | 76 | Risk Ratio (IV, Fixed, 95% CI) | 0.91 [0.56, 1.48] |
| 5.3 Primary: self‐harm (continuous) Show forest plot | 1 | Mean Difference (IV, Fixed, 95% CI) | Subtotals only | |
| 5.3.1 End of treatment | 1 | 28 | Mean Difference (IV, Fixed, 95% CI) | ‐3.03 [‐5.68, ‐0.38] |
| 5.3.2 0‐6 months follow‐up | 1 | 28 | Mean Difference (IV, Fixed, 95% CI) | ‐4.71 [‐11.60, 2.18] |
| 5.4 Primary: self‐harm (dichotomous), at end of treatment Show forest plot | 1 | Risk Ratio (IV, Fixed, 95% CI) | Subtotals only | |
| 5.5 Primary: suicide‐related outcomes (continuous) Show forest plot | 2 | Std. Mean Difference (IV, Random, 95% CI) | Subtotals only | |
| 5.5.1 End of treatment | 2 | 104 | Std. Mean Difference (IV, Random, 95% CI) | ‐0.47 [‐1.02, 0.08] |
| 5.5.2 0‐6 months follow‐up | 1 | 28 | Std. Mean Difference (IV, Random, 95% CI) | ‐0.45 [‐1.20, 0.31] |
| 5.5.3 6‐12 months follow‐up | 1 | 76 | Std. Mean Difference (IV, Random, 95% CI) | ‐0.44 [‐0.89, 0.02] |
| 5.5.4 Above 12 months follow‐up | 1 | 76 | Std. Mean Difference (IV, Random, 95% CI) | ‐0.31 [‐0.77, 0.14] |
| 5.6 Primary: psychosocial functioning (continuous) Show forest plot | 2 | Std. Mean Difference (IV, Random, 95% CI) | Subtotals only | |
| 5.6.1 End of treatment | 1 | 99 | Std. Mean Difference (IV, Random, 95% CI) | 0.00 [‐0.39, 0.39] |
| 5.6.2 6‐12 months follow‐up | 1 | 90 | Std. Mean Difference (IV, Random, 95% CI) | 0.13 [‐0.28, 0.55] |
| 5.6.3 Above 12 months follow‐up | 2 | 209 | Std. Mean Difference (IV, Random, 95% CI) | 0.04 [‐0.36, 0.43] |
| 5.7 Secondary: interpersonal problems (continuous) Show forest plot | 1 | Mean Difference (IV, Fixed, 95% CI) | Subtotals only | |
| 5.7.1 End of treatment | 1 | 99 | Mean Difference (IV, Fixed, 95% CI) | 5.40 [‐3.70, 14.50] |
| 5.7.2 6‐12 months follow‐up | 1 | 99 | Mean Difference (IV, Fixed, 95% CI) | 0.30 [‐9.17, 9.77] |
| 5.7.3 Above 12 months follow‐up | 1 | 76 | Mean Difference (IV, Fixed, 95% CI) | 11.70 [0.72, 22.68] |
| 5.8 Secondary: dissociation and psychotic‐like symptoms (continuous) Show forest plot | 1 | Mean Difference (IV, Fixed, 95% CI) | Subtotals only | |
| 5.8.1 End of treatment | 1 | 26 | Mean Difference (IV, Fixed, 95% CI) | ‐2.30 [‐8.84, 4.24] |
| 5.8.2 0‐6 months follow‐up | 1 | 26 | Mean Difference (IV, Fixed, 95% CI) | ‐13.40 [‐24.49, ‐2.31] |
| 5.9 Secondary: depression (continuous) Show forest plot | 5 | Std. Mean Difference (IV, Random, 95% CI) | Subtotals only | |
| 5.9.1 End of treatment | 5 | 314 | Std. Mean Difference (IV, Random, 95% CI) | ‐0.21 [‐0.77, 0.35] |
| 5.9.2 0‐6 months follow‐up | 1 | 26 | Std. Mean Difference (IV, Random, 95% CI) | ‐0.96 [‐1.78, ‐0.14] |
| 5.9.3 6‐12 months follow‐up | 1 | 99 | Std. Mean Difference (IV, Random, 95% CI) | ‐0.29 [‐0.69, 0.11] |
| 5.9.4 Above 12 months follow‐up | 2 | 197 | Std. Mean Difference (IV, Random, 95% CI) | ‐0.15 [‐0.43, 0.13] |
| 5.10 Secondary: attrition (dichotomous), at end of treatment Show forest plot | 1 | Risk Ratio (M‐H, Fixed, 95% CI) | Subtotals only | |
| 5.11 Secondary: adverse effects (dichotomous), at end of treatment Show forest plot | 2 | Risk Ratio (M‐H, Random, 95% CI) | Subtotals only | |
| 5.11.1 Non‐serious adverse effects | 1 | 306 | Risk Ratio (M‐H, Random, 95% CI) | 0.92 [0.45, 1.88] |
| 5.11.2 Serious adverse effects | 2 | 326 | Risk Ratio (M‐H, Random, 95% CI) | 2.65 [0.31, 22.93] |
| Outcome or subgroup title | No. of studies | No. of participants | Statistical method | Effect size |
| 6.1 Primary: BPD symptom severity (continuous) Show forest plot | 4 | Std. Mean Difference (IV, Random, 95% CI) | Subtotals only | |
| 6.1.1 End of treatment | 4 | 222 | Std. Mean Difference (IV, Random, 95% CI) | ‐0.29 [‐0.66, 0.09] |
| 6.1.2 6‐12 months follow‐up | 1 | 33 | Std. Mean Difference (IV, Random, 95% CI) | ‐0.31 [‐1.00, 0.38] |
| 6.2 Primary: self‐harm (continuous) Show forest plot | 1 | Std. Mean Difference (IV, Random, 95% CI) | Subtotals only | |
| 6.2.1 End of treatment | 1 | 33 | Std. Mean Difference (IV, Random, 95% CI) | 0.12 [‐0.56, 0.80] |
| 6.2.2 6‐12 months follow‐up | 1 | 33 | Std. Mean Difference (IV, Random, 95% CI) | 0.14 [‐0.55, 0.82] |
| 6.3 Primary: suicide‐related outcomes (continuous) Show forest plot | 3 | Std. Mean Difference (IV, Random, 95% CI) | Subtotals only | |
| 6.3.1 End of treatment | 3 | 101 | Std. Mean Difference (IV, Random, 95% CI) | ‐0.22 [‐0.62, 0.17] |
| 6.3.2 6‐12 months follow‐up | 1 | 33 | Std. Mean Difference (IV, Random, 95% CI) | ‐0.38 [‐1.07, 0.31] |
| 6.4 Primary: psychosocial functioning (continuous) Show forest plot | 4 | Std. Mean Difference (IV, Random, 95% CI) | Subtotals only | |
| 6.4.1 End of treatment | 4 | 140 | Std. Mean Difference (IV, Random, 95% CI) | ‐0.69 [‐1.98, 0.59] |
| 6.4.2 6‐12 months follow‐up | 1 | 33 | Std. Mean Difference (IV, Random, 95% CI) | 0.05 [‐0.64, 0.73] |
| 6.4.3 Above 12 months follow‐up | 1 | 16 | Std. Mean Difference (IV, Random, 95% CI) | ‐0.40 [‐1.39, 0.60] |
| 6.5 Secondary: anger (continuous) Show forest plot | 1 | Mean Difference (IV, Fixed, 95% CI) | Subtotals only | |
| 6.5.1 End of treatment | 1 | 33 | Mean Difference (IV, Fixed, 95% CI) | 0.00 [‐0.86, 0.86] |
| 6.5.2 6‐12 months follow‐up | 1 | 33 | Mean Difference (IV, Fixed, 95% CI) | 0.00 [‐0.89, 0.89] |
| 6.6 Secondary: affective instability (continuous) Show forest plot | 3 | Std. Mean Difference (IV, Random, 95% CI) | Subtotals only | |
| 6.6.1 End of treatment | 3 | 116 | Std. Mean Difference (IV, Random, 95% CI) | ‐0.50 [‐0.87, ‐0.13] |
| 6.6.2 6‐12 months follow‐up | 1 | 33 | Std. Mean Difference (IV, Random, 95% CI) | ‐0.52 [‐1.21, 0.18] |
| 6.7 Secondary: chronic feelings of emptiness (continuous) Show forest plot | 2 | Std. Mean Difference (IV, Random, 95% CI) | Subtotals only | |
| 6.7.1 End of treatment | 2 | 77 | Std. Mean Difference (IV, Random, 95% CI) | ‐0.49 [‐1.02, 0.04] |
| 6.7.2 6‐12 months follow‐up | 1 | 33 | Std. Mean Difference (IV, Random, 95% CI) | ‐0.58 [‐1.28, 0.11] |
| 6.8 Secondary: impulsivity (continuous) Show forest plot | 2 | Std. Mean Difference (IV, Random, 95% CI) | Subtotals only | |
| 6.8.1 End of treatment | 2 | 77 | Std. Mean Difference (IV, Random, 95% CI) | ‐0.39 [‐0.85, 0.07] |
| 6.8.2 6‐12 months follow‐up | 1 | 33 | Std. Mean Difference (IV, Random, 95% CI) | 0.35 [‐0.34, 1.04] |
| 6.9 Secondary: interpersonal problems (continuous) Show forest plot | 4 | Std. Mean Difference (IV, Random, 95% CI) | Subtotals only | |
| 6.9.1 End of treatment | 4 | 238 | Std. Mean Difference (IV, Random, 95% CI) | ‐0.21 [‐0.71, 0.29] |
| 6.9.2 6‐12 months follow‐up | 1 | 33 | Std. Mean Difference (IV, Random, 95% CI) | ‐0.51 [‐1.20, 0.19] |
| 6.10 Secondary: abandonment (continuous) Show forest plot | 1 | Mean Difference (IV, Fixed, 95% CI) | Subtotals only | |
| 6.10.1 End of treatment | 1 | 33 | Mean Difference (IV, Fixed, 95% CI) | ‐0.20 [‐0.95, 0.55] |
| 6.10.2 6‐12 months follow‐up | 1 | 33 | Mean Difference (IV, Fixed, 95% CI) | ‐0.40 [‐1.08, 0.28] |
| 6.11 Secondary: identity disturbance (continuous) Show forest plot | 3 | Std. Mean Difference (IV, Random, 95% CI) | Subtotals only | |
| 6.11.1 End of treatment | 3 | 199 | Std. Mean Difference (IV, Random, 95% CI) | ‐0.38 [‐1.02, 0.27] |
| 6.11.2 6‐12 months follow‐up | 1 | 33 | Std. Mean Difference (IV, Random, 95% CI) | ‐1.09 [‐1.83, ‐0.35] |
| 6.12 Secondary: dissociation and psychotic‐like symptoms (continuous) Show forest plot | 2 | Std. Mean Difference (IV, Random, 95% CI) | Subtotals only | |
| 6.12.1 End of treatment | 2 | 57 | Std. Mean Difference (IV, Random, 95% CI) | ‐0.18 [‐0.96, 0.60] |
| 6.12.2 6‐12 months follow‐up | 1 | 33 | Std. Mean Difference (IV, Random, 95% CI) | ‐0.59 [‐1.29, 0.11] |
| 6.12.3 Above 12 months follow‐up | 1 | 24 | Std. Mean Difference (IV, Random, 95% CI) | ‐0.01 [‐0.81, 0.79] |
| 6.13 Secondary: depression (continuous) Show forest plot | 3 | Std. Mean Difference (IV, Random, 95% CI) | Subtotals only | |
| 6.13.1 End of treatment | 3 | 190 | Std. Mean Difference (IV, Random, 95% CI) | ‐0.17 [‐0.81, 0.47] |
| 6.13.2 Above 12 months follow‐up | 1 | 24 | Std. Mean Difference (IV, Random, 95% CI) | ‐0.68 [‐1.51, 0.15] |
| 6.14 Secondary: attrition (dichotomous), at end of treatment Show forest plot | 3 | 210 | Risk Ratio (M‐H, Random, 95% CI) | 0.90 [0.56, 1.47] |
| Outcome or subgroup title | No. of studies | No. of participants | Statistical method | Effect size |
| 7.1 Primary: BPD symptom severity (continuous), at end of treatment Show forest plot | 1 | Mean Difference (IV, Fixed, 95% CI) | Subtotals only | |
| 7.2 Primary: psychosocial functioning (continuous), at end of treatment Show forest plot | 1 | Mean Difference (IV, Fixed, 95% CI) | Subtotals only | |
| 7.3 Secondary: affective instability (continuous), at end of treatment Show forest plot | 1 | Mean Difference (IV, Fixed, 95% CI) | Subtotals only | |
| 7.4 Secondary: impulsivity (continuous), at end of treatment Show forest plot | 1 | Mean Difference (IV, Fixed, 95% CI) | Subtotals only | |
| 7.5 Secondary: interpersonal problems (continuous), at end of treatment Show forest plot | 1 | Mean Difference (IV, Fixed, 95% CI) | Subtotals only | |
| 7.6 Secondary: dissociation and psychotic‐like symptoms (continuous), at end of treatment Show forest plot | 1 | Mean Difference (IV, Fixed, 95% CI) | Subtotals only | |
| 7.7 Secondary: attrition (dichotomous), at end of treatment Show forest plot | 1 | Risk Ratio (M‐H, Fixed, 95% CI) | Subtotals only | |
| Outcome or subgroup title | No. of studies | No. of participants | Statistical method | Effect size |
| 8.1 Primary: BPD symptom severity (continuous), at end of treatment Show forest plot | 3 | Std. Mean Difference (IV, Random, 95% CI) | Subtotals only | |
| 8.1.1 End of treatment | 3 | 273 | Std. Mean Difference (IV, Random, 95% CI) | ‐0.39 [‐0.63, ‐0.15] |
| 8.1.2 6‐12 months follow‐up | 1 | 124 | Std. Mean Difference (IV, Random, 95% CI) | 0.03 [‐0.33, 0.38] |
| 8.2 Primary: self‐harm (dichtomous), at end of treatment Show forest plot | 1 | Risk Ratio (M‐H, Fixed, 95% CI) | Subtotals only | |
| 8.3 Primary: psychosocial functioning (continuous) Show forest plot | 1 | Mean Difference (IV, Fixed, 95% CI) | Subtotals only | |
| 8.3.1 End of treatment | 1 | 124 | Mean Difference (IV, Fixed, 95% CI) | ‐7.00 [‐11.43, ‐2.57] |
| 8.3.2 6‐12 months follow‐up | 1 | 124 | Mean Difference (IV, Fixed, 95% CI) | ‐5.90 [‐12.49, 0.69] |
| 8.4 Secondary: affective instability (continuous), at end of treatment Show forest plot | 2 | 221 | Std. Mean Difference (IV, Random, 95% CI) | ‐0.25 [‐0.52, 0.02] |
| 8.5 Secondary: impulsivity (continuous), at end of treatment Show forest plot | 1 | Mean Difference (IV, Fixed, 95% CI) | Subtotals only | |
| 8.6 Secondary: impulsivity (dichotomous), at end of treatment Show forest plot | 1 | Risk Ratio (IV, Fixed, 95% CI) | Subtotals only | |
| 8.7 Secondary: interpersonal problems (continuous), at end of treatment Show forest plot | 2 | 177 | Std. Mean Difference (IV, Random, 95% CI) | ‐0.38 [‐0.67, ‐0.08] |
| 8.8 Secondary: dissociation and psychotic‐like symptoms (continuous), at end of treatment Show forest plot | 1 | Mean Difference (IV, Fixed, 95% CI) | Subtotals only | |
| 8.9 Secondary: depression (continuous), at end of treatment Show forest plot | 1 | Mean Difference (IV, Fixed, 95% CI) | Subtotals only | |
| 8.9.1 End of treatment | 1 | 124 | Mean Difference (IV, Fixed, 95% CI) | ‐3.80 [‐9.34, 1.74] |
| 8.9.2 6‐12 months follow‐up | 1 | 124 | Mean Difference (IV, Fixed, 95% CI) | 0.60 [‐8.42, 9.62] |
| 8.10 Secondary: attrition (dichotomous), at end of treatment Show forest plot | 1 | Risk Ratio (M‐H, Fixed, 95% CI) | Subtotals only | |
| Outcome or subgroup title | No. of studies | No. of participants | Statistical method | Effect size |
| 9.1 Primary: suicide‐related outcomes (continuous) Show forest plot | 1 | Mean Difference (IV, Fixed, 95% CI) | Subtotals only | |
| 9.1.1 End of treatment | 1 | 9 | Mean Difference (IV, Fixed, 95% CI) | ‐1.40 [‐4.21, 1.41] |
| 9.1.2 0‐6 months follow‐up | 1 | 8 | Mean Difference (IV, Fixed, 95% CI) | ‐0.50 [‐2.05, 1.05] |
| 9.2 Primary: psychosocial functioning (continuous) Show forest plot | 1 | Mean Difference (IV, Fixed, 95% CI) | Subtotals only | |
| 9.2.1 End of treatment | 1 | 9 | Mean Difference (IV, Fixed, 95% CI) | ‐16.40 [‐31.20, ‐1.60] |
| 9.2.2 0‐6 months follow‐up | 1 | 9 | Mean Difference (IV, Fixed, 95% CI) | ‐15.80 [‐29.36, ‐2.24] |
| 9.3 Secondary: anger (continuous) Show forest plot | 1 | Mean Difference (IV, Fixed, 95% CI) | Subtotals only | |
| 9.3.1 End of treatment | 1 | 9 | Mean Difference (IV, Fixed, 95% CI) | ‐1.90 [‐7.97, 4.17] |
| 9.3.2 0‐6 months follow‐up | 1 | 8 | Mean Difference (IV, Fixed, 95% CI) | ‐4.50 [‐9.01, 0.01] |
| 9.4 Secondary: dissociation and psychotic‐like symptoms (continuous) Show forest plot | 1 | Mean Difference (IV, Fixed, 95% CI) | Subtotals only | |
| 9.4.1 End of treatment | 1 | 9 | Mean Difference (IV, Fixed, 95% CI) | ‐6.10 [‐15.01, 2.81] |
| 9.4.2 0‐6 months follow‐up | 1 | 9 | Mean Difference (IV, Fixed, 95% CI) | ‐11.70 [‐24.02, 0.62] |
| 9.5 Secondary: depression (continuous) Show forest plot | 1 | Mean Difference (IV, Fixed, 95% CI) | Subtotals only | |
| 9.5.1 End of treatment | 1 | 9 | Mean Difference (IV, Fixed, 95% CI) | ‐9.70 [‐20.10, 0.70] |
| 9.5.2 0‐6 months follow‐up | 1 | 8 | Mean Difference (IV, Fixed, 95% CI) | ‐3.70 [‐11.99, 4.59] |
| 9.6 Secondary: attrition (dichotomous), at end of treatment Show forest plot | 1 | Risk Ratio (M‐H, Fixed, 95% CI) | Subtotals only | |
| Outcome or subgroup title | No. of studies | No. of participants | Statistical method | Effect size |
| 10.1 Primary: psychosocial functioning, at end of treatment Show forest plot | 1 | Mean Difference (IV, Fixed, 95% CI) | Subtotals only | |
| Outcome or subgroup title | No. of studies | No. of participants | Statistical method | Effect size |
| 11.1 Secondary: depression (continuous), at end of treatment Show forest plot | 1 | Mean Difference (IV, Fixed, 95% CI) | Subtotals only | |
| 11.2 Secondary: attrition (dichotomous), at end of treatment Show forest plot | 1 | Odds Ratio (M‐H, Fixed, 95% CI) | Subtotals only | |
| Outcome or subgroup title | No. of studies | No. of participants | Statistical method | Effect size |
| 12.1 Primary: BPD symptom severity (continuous), at end of treatment Show forest plot | 1 | Mean Difference (IV, Fixed, 95% CI) | Subtotals only | |
| 12.2 Primary: self‐harm (dichotomous), at end of treatment Show forest plot | 1 | Risk Ratio (M‐H, Fixed, 95% CI) | Subtotals only | |
| 12.3 Primary: suicide‐related outcomes (dichotomous), at end of treatment Show forest plot | 1 | Risk Ratio (M‐H, Fixed, 95% CI) | Subtotals only | |
| 12.4 Primary: psychosocial functioning (continuous), at end of treatment Show forest plot | 1 | Mean Difference (IV, Fixed, 95% CI) | Subtotals only | |
| 12.5 Secondary: depression (continuous), at end of treatment Show forest plot | 1 | Mean Difference (IV, Fixed, 95% CI) | Subtotals only | |
| 12.6 Secondary: attrition (dichotomous), at end of treatment Show forest plot | 1 | Risk Ratio (M‐H, Fixed, 95% CI) | Subtotals only | |
| Outcome or subgroup title | No. of studies | No. of participants | Statistical method | Effect size |
| 13.1 Primary: self‐harm (continuous), at end of treatment Show forest plot | 1 | Mean Difference (IV, Fixed, 95% CI) | Subtotals only | |
| 13.2 Primary: psychosocial functioning (continuous), at end of treatment Show forest plot | 1 | Mean Difference (IV, Fixed, 95% CI) | Subtotals only | |
| 13.3 Secondary: depression (continuous), at end of treatment Show forest plot | 1 | Mean Difference (IV, Fixed, 95% CI) | Subtotals only | |
| 13.4 Secondary: attrition (dichotomous), at end of treatment Show forest plot | 1 | Risk Ratio (M‐H, Fixed, 95% CI) | Subtotals only | |
| Outcome or subgroup title | No. of studies | No. of participants | Statistical method | Effect size |
| 14.1 Primary: BPD symptom severity (continuous), at end of treatment Show forest plot | 3 | 134 | Std. Mean Difference (IV, Random, 95% CI) | ‐0.90 [‐1.57, ‐0.23] |
| 14.2 Primary: self‐harm (continuous), at end of treatment Show forest plot | 2 | 83 | Std. Mean Difference (IV, Random, 95% CI) | ‐0.84 [‐1.29, ‐0.39] |
| 14.3 Primary: suicide‐related outcomes (continuous), at end of treatment Show forest plot | 2 | 221 | Std. Mean Difference (IV, Random, 95% CI) | ‐0.55 [‐1.29, 0.19] |
| 14.4 Primary: psychosocial functioning (continuous) Show forest plot | 2 | Std. Mean Difference (IV, Random, 95% CI) | Subtotals only | |
| 14.4.1 End of treatment | 2 | 231 | Std. Mean Difference (IV, Random, 95% CI) | ‐0.57 [‐1.10, ‐0.04] |
| 14.4.2 Above 12 months follow‐up | 1 | 170 | Std. Mean Difference (IV, Random, 95% CI) | ‐0.64 [‐1.04, ‐0.24] |
| 14.5 Secondary: anger (continuous), at end of treatment Show forest plot | 1 | Mean Difference (IV, Fixed, 95% CI) | Subtotals only | |
| 14.6 Secondary: affective instability (continuous), at end of treatment Show forest plot | 3 | 134 | Std. Mean Difference (IV, Random, 95% CI) | ‐0.95 [‐1.74, ‐0.15] |
| 14.7 Secondary: chronic feelings of emptiness (continuous), at end of treatment Show forest plot | 1 | Mean Difference (IV, Fixed, 95% CI) | Subtotals only | |
| 14.8 Secondary: impulsivity (continuous), at end of treatment Show forest plot | 3 | 134 | Std. Mean Difference (IV, Random, 95% CI) | ‐0.76 [‐1.30, ‐0.22] |
| 14.9 Secondary: interpersonal problems (continuous), at end of treatment Show forest plot | 2 | 112 | Std. Mean Difference (IV, Random, 95% CI) | ‐0.62 [‐1.09, ‐0.15] |
| 14.10 Secondary: abandonment (continuous), at end of treatment Show forest plot | 1 | Mean Difference (IV, Fixed, 95% CI) | Subtotals only | |
| 14.11 Secondary: identity disturbance (continuous), at end of treatment Show forest plot | 1 | Mean Difference (IV, Fixed, 95% CI) | Subtotals only | |
| 14.12 Secondary: depression (continuous), at end of treatment Show forest plot | 4 | 304 | Std. Mean Difference (IV, Random, 95% CI) | ‐0.82 [‐1.38, ‐0.26] |
| 14.13 Secondary: attrition (dichotomuous), at end of treatment Show forest plot | 4 | 326 | Risk Ratio (M‐H, Random, 95% CI) | 1.06 [0.85, 1.32] |
| 14.14 Secondary: adverse effects (dichotomous), at end of treatment Show forest plot | 1 | Risk Ratio (M‐H, Fixed, 95% CI) | Subtotals only | |
| Outcome or subgroup title | No. of studies | No. of participants | Statistical method | Effect size |
| 15.1 Primary: BPD symptom severity (continuous), at end of treatment Show forest plot | 3 | 161 | Std. Mean Difference (IV, Random, 95% CI) | ‐0.49 [‐0.93, ‐0.05] |
| 15.2 Primary: self‐harm (continuous), at end of treatment Show forest plot | 2 | 128 | Std. Mean Difference (IV, Random, 95% CI) | ‐0.17 [‐0.52, 0.18] |
| 15.3 Primary: suicide‐related outcomes (continuous), at end of treatment Show forest plot | 2 | 108 | Std. Mean Difference (IV, Random, 95% CI) | ‐5.62 [‐16.39, 5.16] |
| 15.4 Primary: psychosocial functioning (continuous) Show forest plot | 5 | Std. Mean Difference (IV, Random, 95% CI) | Subtotals only | |
| 15.4.1 End of treatment | 5 | 219 | Std. Mean Difference (IV, Random, 95% CI) | ‐0.56 [‐1.01, ‐0.11] |
| 15.4.2 0‐6 months follow‐up | 1 | 30 | Std. Mean Difference (IV, Random, 95% CI) | ‐0.89 [‐1.65, ‐0.13] |
| 15.4.3 6‐12 months follow‐up | 1 | 30 | Std. Mean Difference (IV, Random, 95% CI) | ‐1.04 [‐1.81, ‐0.27] |
| 15.4.4 Above 12 months follow‐up | 1 | 28 | Std. Mean Difference (IV, Random, 95% CI) | ‐0.38 [‐1.14, 0.37] |
| 15.5 Secondary: anger (continuous), at end of treatment Show forest plot | 2 | 128 | Std. Mean Difference (IV, Random, 95% CI) | ‐0.58 [‐1.70, 0.55] |
| 15.6 Secondary: affective instability (continuous) Show forest plot | 2 | Std. Mean Difference (IV, Random, 95% CI) | Subtotals only | |
| 15.6.1 End of treatment | 2 | 128 | Std. Mean Difference (IV, Random, 95% CI) | ‐0.99 [‐1.36, ‐0.62] |
| 15.6.2 0‐6 months follow‐up | 1 | 30 | Std. Mean Difference (IV, Random, 95% CI) | ‐0.47 [‐1.20, 0.26] |
| 15.6.3 6‐12 months follow‐up | 1 | 30 | Std. Mean Difference (IV, Random, 95% CI) | ‐0.38 [‐1.10, 0.34] |
| 15.6.4 Above 12 months follow‐up | 1 | 30 | Std. Mean Difference (IV, Random, 95% CI) | ‐0.28 [‐1.01, 0.44] |
| 15.7 Secondary: chronic feelings of emptiness (continuous), at end of treatment Show forest plot | 1 | Mean Difference (IV, Fixed, 95% CI) | Subtotals only | |
| 15.8 Secondary: impulsivity (continuous) Show forest plot | 3 | Std. Mean Difference (IV, Random, 95% CI) | Subtotals only | |
| 15.8.1 End of treatment | 3 | 178 | Std. Mean Difference (IV, Random, 95% CI) | ‐0.52 [‐0.82, ‐0.22] |
| 15.8.2 0‐6 months follow‐up | 1 | 30 | Std. Mean Difference (IV, Random, 95% CI) | ‐0.90 [‐1.66, ‐0.14] |
| 15.8.3 6‐12 months follow‐up | 1 | 30 | Std. Mean Difference (IV, Random, 95% CI) | ‐0.79 [‐1.54, ‐0.04] |
| 15.8.4 Above 12 months follow‐up | 1 | 30 | Std. Mean Difference (IV, Random, 95% CI) | ‐0.75 [‐1.50, ‐0.01] |
| 15.9 Secondary: interpersonal problems (continuous) Show forest plot | 3 | Std. Mean Difference (IV, Random, 95% CI) | Subtotals only | |
| 15.9.1 End of treatment | 3 | 120 | Std. Mean Difference (IV, Random, 95% CI) | ‐0.85 [‐1.23, ‐0.47] |
| 15.9.2 0‐6 months follow‐up | 1 | 30 | Std. Mean Difference (IV, Random, 95% CI) | ‐1.40 [‐2.21, ‐0.59] |
| 15.9.3 6‐12 months follow‐up | 1 | 30 | Std. Mean Difference (IV, Random, 95% CI) | ‐0.90 [‐1.66, ‐0.14] |
| 15.9.4 Above 12 months follow‐up | 1 | 30 | Std. Mean Difference (IV, Random, 95% CI) | ‐0.86 [‐1.62, ‐0.11] |
| 15.10 Secondary: abandonment (continuous), at end of treatment Show forest plot | 1 | Mean Difference (IV, Fixed, 95% CI) | Subtotals only | |
| 15.11 Secondary: identity disturbance (continuous), at end of treatment Show forest plot | 1 | Mean Difference (IV, Fixed, 95% CI) | Subtotals only | |
| 15.12 Secondary: dissociation and psychotic‐like symptoms (continuous), at end of treatment Show forest plot | 2 | 77 | Std. Mean Difference (IV, Random, 95% CI) | ‐0.13 [‐0.65, 0.39] |
| 15.13 Secondary: depression (continuous), at end of treatment Show forest plot | 6 | 239 | Std. Mean Difference (IV, Random, 95% CI) | ‐1.28 [‐2.21, ‐0.34] |
| 15.14 Secondary: attrition (dichotomous), at end of treatment Show forest plot | 3 | 144 | Risk Ratio (M‐H, Random, 95% CI) | 0.55 [0.20, 1.50] |
| Outcome or subgroup title | No. of studies | No. of participants | Statistical method | Effect size |
| 16.1 Primary: BPD symptom severity (continuous), at end of treatment Show forest plot | 2 | 117 | Std. Mean Difference (IV, Random, 95% CI) | ‐0.71 [‐1.08, ‐0.33] |
| 16.2 Primary: self‐harm (continuous), at end of treatment Show forest plot | 1 | Mean Difference (IV, Fixed, 95% CI) | Subtotals only | |
| 16.3 Primary: suicide‐related outcomes (continuous), at end of treatment Show forest plot | 2 | 108 | Std. Mean Difference (IV, Random, 95% CI) | ‐5.62 [‐16.39, 5.16] |
| 16.4 Primary: psychosocial functioning (continuous), at end of treatment Show forest plot | 2 | 117 | Std. Mean Difference (IV, Random, 95% CI) | ‐0.73 [‐1.11, ‐0.36] |
| 16.5 Secondary: anger (continuous), at end of treatment Show forest plot | 1 | Mean Difference (IV, Fixed, 95% CI) | Subtotals only | |
| 16.6 Secondary: affective instability (continuous), at end of treatment Show forest plot | 1 | Mean Difference (IV, Fixed, 95% CI) | Subtotals only | |
| 16.7 Secondary: impulsivity (continuous), at end of treatment Show forest plot | 1 | Mean Difference (IV, Fixed, 95% CI) | Subtotals only | |
| 16.8 Secondary: dissociation and psychotic‐like symptoms (continuous), at end of treatment Show forest plot | 1 | Mean Difference (IV, Fixed, 95% CI) | Subtotals only | |
| 16.9 Secondary: depression (continuous), at end of treatment Show forest plot | 3 | 141 | Std. Mean Difference (IV, Random, 95% CI) | ‐3.20 [‐5.57, ‐0.83] |
| 16.10 DBT‐couple therapy (CDBT) vs waiting list (generic inverse variance) Show forest plot | 1 | Mean Difference (IV, Fixed, 95% CI) | Subtotals only | |
| 16.10.1 Primary: BPD severity (continuous), at end of treatment | 1 | Mean Difference (IV, Fixed, 95% CI) | ‐27.15 [‐31.59, ‐22.71] | |
| 16.10.2 Primary: suicide‐related outcomes (continuous), at end of treatment | 1 | Mean Difference (IV, Fixed, 95% CI) | ‐0.94 [‐1.24, ‐0.64] | |
| 16.10.3 Primary: psychosocial functioning (continuous), at end of treatment | 1 | Mean Difference (IV, Fixed, 95% CI) | ‐10.70 [‐12.31, ‐9.09] | |
| 16.10.4 Secondary: anger (continuous), at end of treatment | 1 | Mean Difference (IV, Fixed, 95% CI) | ‐1.42 [‐1.72, ‐1.12] | |
| 16.10.5 Secondary: affective instability (continuous), at end of treatment | 1 | Mean Difference (IV, Fixed, 95% CI) | ‐4.01 [‐5.44, ‐2.58] | |
| 16.10.6 Secondary: chronic feelings of emptiness (continuous), at end of treatment | 1 | Mean Difference (IV, Fixed, 95% CI) | ‐3.54 [‐4.81, ‐2.27] | |
| 16.10.7 Secondary: impulsivity (continuous), at end of treatment | 1 | Mean Difference (IV, Fixed, 95% CI) | ‐0.51 [‐0.72, ‐0.30] | |
| 16.10.8 Secondary: interpersonal problems (continuous), at end of treatment | 1 | Mean Difference (IV, Fixed, 95% CI) | ‐1.98 [‐2.47, ‐1.49] | |
| 16.10.9 Secondary: abandonment (continuous), at end of treatment | 1 | Mean Difference (IV, Fixed, 95% CI) | ‐0.86 [‐1.09, ‐0.63] | |
| 16.10.10 Secondary: identity disturbance (continuous), at end of treatment | 1 | Mean Difference (IV, Fixed, 95% CI) | ‐2.44 [‐2.77, ‐2.11] | |
| 16.10.11 Secondary: dissociation or psychotic‐like symptoms (continuous), at end of treatment | 1 | Mean Difference (IV, Fixed, 95% CI) | ‐1.92 [‐2.46, ‐1.38] | |
| 16.10.12 Secondary: depression (continuous), at end of treatment | 1 | Mean Difference (IV, Fixed, 95% CI) | ‐10.43 [‐11.86, ‐9.00] | |
| Outcome or subgroup title | No. of studies | No. of participants | Statistical method | Effect size |
| 17.1 Primary: suicide‐related outcomes (continuous), at end of treatment Show forest plot | 1 | Mean Difference (IV, Fixed, 95% CI) | Subtotals only | |
| 17.2 Secondary: depression (continuous), at end of treatment Show forest plot | 1 | Mean Difference (IV, Fixed, 95% CI) | Subtotals only | |
| Outcome or subgroup title | No. of studies | No. of participants | Statistical method | Effect size |
| 18.1 Primary: BPD symptom severity (continuous), at end of treatment Show forest plot | 1 | Mean Difference (IV, Fixed, 95% CI) | Subtotals only | |
| 18.2 Primary: self‐harm (continuous), at end of treatment Show forest plot | 1 | Mean Difference (IV, Fixed, 95% CI) | Subtotals only | |
| 18.3 Primary: psychosocial functioning (continuous) Show forest plot | 2 | Std. Mean Difference (IV, Random, 95% CI) | Subtotals only | |
| 18.3.1 End of treatment | 2 | 76 | Std. Mean Difference (IV, Random, 95% CI) | ‐0.03 [‐0.48, 0.42] |
| 18.3.2 0‐6 months follow‐up | 1 | 30 | Std. Mean Difference (IV, Random, 95% CI) | ‐0.89 [‐1.65, ‐0.13] |
| 18.3.3 6‐12 months follow‐up | 1 | 30 | Std. Mean Difference (IV, Random, 95% CI) | ‐1.04 [‐1.81, ‐0.27] |
| 18.3.4 Above 12 months follow‐up | 1 | 28 | Std. Mean Difference (IV, Random, 95% CI) | ‐0.38 [‐1.14, 0.37] |
| 18.4 Secondary: anger (continuous), at end of treatment Show forest plot | 1 | Mean Difference (IV, Fixed, 95% CI) | Subtotals only | |
| 18.5 Secondary: affective instability (continuous) Show forest plot | 1 | Mean Difference (IV, Fixed, 95% CI) | Subtotals only | |
| 18.5.1 End of treatment | 1 | 44 | Mean Difference (IV, Fixed, 95% CI) | ‐1.02 [‐1.66, ‐0.38] |
| 18.5.2 0‐6 months follow‐up | 1 | 30 | Mean Difference (IV, Fixed, 95% CI) | ‐0.46 [‐1.15, 0.23] |
| 18.5.3 6‐12 months follow‐up | 1 | 30 | Mean Difference (IV, Fixed, 95% CI) | ‐0.39 [‐1.12, 0.34] |
| 18.5.4 Above 12 months follow‐up | 1 | 30 | Mean Difference (IV, Fixed, 95% CI) | ‐0.34 [‐1.17, 0.49] |
| 18.6 Secondary: chronic feelings of emptiness (continuous), at end of treatment Show forest plot | 1 | Mean Difference (IV, Fixed, 95% CI) | Subtotals only | |
| 18.7 Secondary: impulsivity (continuous) Show forest plot | 1 | Mean Difference (IV, Fixed, 95% CI) | Subtotals only | |
| 18.7.1 End of treatment | 1 | 44 | Mean Difference (IV, Fixed, 95% CI) | ‐1.03 [‐1.69, ‐0.37] |
| 18.7.2 0‐6 months follow‐up | 1 | 30 | Mean Difference (IV, Fixed, 95% CI) | ‐1.10 [‐1.95, ‐0.25] |
| 18.7.3 6‐12 months follow‐up | 1 | 30 | Mean Difference (IV, Fixed, 95% CI) | ‐1.10 [‐2.06, ‐0.14] |
| 18.7.4 Above 12 months follow‐up | 1 | 30 | Mean Difference (IV, Fixed, 95% CI) | ‐1.09 [‐2.09, ‐0.09] |
| 18.8 Secondary: interpersonal problems (continuous) Show forest plot | 1 | Mean Difference (IV, Fixed, 95% CI) | Subtotals only | |
| 18.8.1 End of treatment | 1 | 44 | Mean Difference (IV, Fixed, 95% CI) | ‐1.14 [‐1.94, ‐0.34] |
| 18.8.2 0‐6 months follow‐up | 1 | 30 | Mean Difference (IV, Fixed, 95% CI) | ‐2.00 [‐2.98, ‐1.02] |
| 18.8.3 6‐12 months follow‐up | 1 | 30 | Mean Difference (IV, Fixed, 95% CI) | ‐1.56 [‐2.74, ‐0.38] |
| 18.8.4 Above 12 months follow‐up | 1 | 30 | Mean Difference (IV, Fixed, 95% CI) | ‐1.48 [‐2.63, ‐0.33] |
| 18.9 Secondary: abandonment (continuous), at end of treatment Show forest plot | 1 | Mean Difference (IV, Fixed, 95% CI) | Subtotals only | |
| 18.10 Secondary: identity disturbance (continuous), at end of treatment Show forest plot | 1 | Mean Difference (IV, Fixed, 95% CI) | Subtotals only | |
| 18.11 Secondary: dissociation and psychotic‐like symptoms (continuous), at end of treatment Show forest plot | 1 | Mean Difference (IV, Fixed, 95% CI) | Subtotals only | |
| 18.12 Secondary outcome: depression (continuous), at end of treatment Show forest plot | 3 | 98 | Std. Mean Difference (IV, Random, 95% CI) | ‐0.52 [‐1.11, 0.06] |
| 18.13 Secondary outcome: attrition (dichotomous), at end of treatment Show forest plot | 2 | 94 | Risk Ratio (M‐H, Random, 95% CI) | 0.55 [0.20, 1.50] |
| Outcome or subgroup title | No. of studies | No. of participants | Statistical method | Effect size |
| 19.1 Secondary: impulsivity (continuous), at end of treatment Show forest plot | 1 | Mean Difference (IV, Fixed, 95% CI) | Subtotals only | |
| 19.2 Secondary: interpersonal problems (continuous), at end of treatment Show forest plot | 1 | Mean Difference (IV, Fixed, 95% CI) | Subtotals only | |
| 19.3 Secondary: attrition (dichotomous), at end of treatment Show forest plot | 1 | Risk Ratio (M‐H, Fixed, 95% CI) | Subtotals only | |
| Outcome or subgroup title | No. of studies | No. of participants | Statistical method | Effect size |
| 20.1 Primary outcome: psychosocial functioning (continuous), at end of treatment Show forest plot | 1 | Mean Difference (IV, Fixed, 95% CI) | Subtotals only | |
| 20.2 Secondary outcome: interpersonal problems (continuous), at end of treatment Show forest plot | 1 | Mean Difference (IV, Fixed, 95% CI) | Subtotals only | |
| Outcome or subgroup title | No. of studies | No. of participants | Statistical method | Effect size |
| 21.1 Standard DBT (DBT) vs client‐centred therapy (CCT) (continuous) Show forest plot | 1 | Mean Difference (IV, Fixed, 95% CI) | Subtotals only | |
| 21.1.1 Primary: self‐harm (continuous), at end of treatment | 1 | 24 | Mean Difference (IV, Fixed, 95% CI) | ‐2.75 [‐4.42, ‐1.08] |
| 21.1.2 Primary: suicide‐related outcomes (continuous), at end of treatment | 1 | 24 | Mean Difference (IV, Fixed, 95% CI) | ‐7.75 [‐14.66, ‐0.84] |
| 21.1.3 Secondary: anger (continuous), at end of treatment | 1 | 24 | Mean Difference (IV, Fixed, 95% CI) | ‐1.00 [‐1.98, ‐0.02] |
| 21.1.4 Secondary: impulsivity (continuous), at end of treatment | 1 | 24 | Mean Difference (IV, Fixed, 95% CI) | ‐1.50 [‐2.60, ‐0.40] |
| 21.1.5 Secondary: dissociation and psychotic‐like symptoms (continuous), at end of treatment | 1 | 24 | Mean Difference (IV, Fixed, 95% CI) | ‐7.16 [‐12.15, ‐2.17] |
| 21.1.6 Secondary: depression (continuous), at end of treatment | 1 | 24 | Mean Difference (IV, Fixed, 95% CI) | ‐9.16 [‐14.79, ‐3.53] |
| 21.2 DBT vs CCT, secondary: attrition (dichotomous), at end of treatment Show forest plot | 1 | Risk Ratio (M‐H, Fixed, 95% CI) | Subtotals only | |
| 21.3 Standard DBT (DBT) vs good psychiatric management (GPM) (continuous) Show forest plot | 1 | Mean Difference (IV, Fixed, 95% CI) | Subtotals only | |
| 21.3.1 Primary: BPD severity (continuous), at end of treatment | 1 | 180 | Mean Difference (IV, Fixed, 95% CI) | ‐0.23 [‐1.97, 1.51] |
| 21.3.2 Primary: self‐harm (continuous), at end of treatment | 1 | 180 | Mean Difference (IV, Fixed, 95% CI) | ‐8.58 [‐19.38, 2.22] |
| 21.3.3 Secondary: anger (continuous), at end of treatment | 1 | 180 | Mean Difference (IV, Fixed, 95% CI) | ‐0.15 [‐1.65, 1.35] |
| 21.3.4 Secondary: interpersonal problems (continuous), at end of treatment | 1 | 180 | Mean Difference (IV, Fixed, 95% CI) | ‐1.34 [‐15.36, 12.68] |
| 21.3.5 Secondary: depression (continuous), at end of treatment | 1 | 180 | Mean Difference (IV, Fixed, 95% CI) | ‐2.65 [‐7.18, 1.88] |
| 21.4 DBT vs GPM, secondary: attrition (dichotomous), at end of treatment Show forest plot | 1 | Risk Ratio (M‐H, Fixed, 95% CI) | Subtotals only | |
| 21.5 Standard DBT (DBT) vs individual DBT therapy + activities group (DBT‐I) (continuous) Show forest plot | 1 | Mean Difference (IV, Fixed, 95% CI) | Subtotals only | |
| 21.5.1 Primary: self‐harm (continuous), at end of treatment | 1 | 66 | Mean Difference (IV, Fixed, 95% CI) | ‐10.40 [‐22.99, 2.19] |
| 21.5.2 Primary: self‐harm (continuous), at 6‐12 months follow‐up | 1 | 66 | Mean Difference (IV, Fixed, 95% CI) | ‐8.10 [‐19.59, 3.39] |
| 21.5.3 Primary: suicide‐related outcomes (continuous), at end of treatment | 1 | 66 | Mean Difference (IV, Fixed, 95% CI) | 0.50 [‐1.37, 2.37] |
| 21.5.4 Primary: suicide‐related outcomes (continuous), at 6‐12 months follow‐up | 1 | 66 | Mean Difference (IV, Fixed, 95% CI) | ‐1.60 [‐2.79, ‐0.41] |
| 21.5.5 Secondary: depression (continuous), at end of treatment | 1 | 66 | Mean Difference (IV, Fixed, 95% CI) | ‐5.90 [‐9.74, ‐2.06] |
| 21.5.6 Secondary: depression (continuous), at 6‐12 months follow‐up | 1 | 66 | Mean Difference (IV, Fixed, 95% CI) | 1.30 [‐3.10, 5.70] |
| 21.6 DBT vs DBT‐I, secondary: attrition (dichotomous), at end of treatment Show forest plot | 1 | Risk Ratio (M‐H, Fixed, 95% CI) | Subtotals only | |
| 21.7 Standard DBT (DBT) vs skills training group + individual case management (DBT‐S) (continuous) Show forest plot | 1 | Mean Difference (IV, Fixed, 95% CI) | Subtotals only | |
| 21.7.1 Primary: self‐harm (continuous), at end of treatment | 1 | 66 | Mean Difference (IV, Fixed, 95% CI) | 0.30 [‐8.42, 9.02] |
| 21.7.2 Primary: self‐harm (continuous), at 6‐12 months follow‐up | 1 | 66 | Mean Difference (IV, Fixed, 95% CI) | ‐1.50 [‐9.04, 6.04] |
| 21.7.3 Primary: suicide‐related outcomes (continuous), at end of treatment | 1 | 66 | Mean Difference (IV, Fixed, 95% CI) | 0.80 [‐1.06, 2.66] |
| 21.7.4 Primary: suicide‐related outcomes (continuous), at 6‐12 months follow‐up | 1 | 66 | Mean Difference (IV, Fixed, 95% CI) | 0.50 [‐0.02, 1.02] |
| 21.7.5 Secondary: depression (continuous), at end of treatment | 1 | 66 | Mean Difference (IV, Fixed, 95% CI) | 1.90 [‐1.60, 5.40] |
| 21.7.6 Secondary: depression (continuous), at 6‐12 months follow‐up | 1 | 66 | Mean Difference (IV, Fixed, 95% CI) | 3.30 [‐0.90, 7.50] |
| 21.8 DBT vs DBT‐S, secondary: attrition (dichotomous), at 6‐12 months follow‐up Show forest plot | 1 | Risk Ratio (M‐H, Fixed, 95% CI) | Subtotals only | |
| 21.9 Standard DBT (DBT) vs step‐down DBT (DBT‐SD) (continuous) Show forest plot | 1 | Mean Difference (IV, Fixed, 95% CI) | Subtotals only | |
| 21.9.1 Primary: BPD symptom severity (continuous), at end of treatment | 1 | 38 | Mean Difference (IV, Fixed, 95% CI) | ‐2.83 [‐11.21, 5.55] |
| 21.9.2 Primary: self‐harm (continuous), at end of treatment | 1 | 38 | Mean Difference (IV, Fixed, 95% CI) | 4.10 [‐4.07, 12.27] |
| 21.9.3 Primary: suicide‐related outcomes (continuous), at end of treatment | 1 | 38 | Mean Difference (IV, Fixed, 95% CI) | 0.30 [‐0.73, 1.33] |
| 21.9.4 Secondary: anger (continuous), at end of treatment | 1 | 41 | Mean Difference (IV, Fixed, 95% CI) | ‐0.53 [‐1.48, 0.43] |
| 21.9.5 Secondary: affective instability (continuous), at end of treatment | 1 | 41 | Mean Difference (IV, Fixed, 95% CI) | ‐0.71 [‐2.51, 1.09] |
| 21.9.6 Secondary: chronic feeling of emptiness (continuous), at end of treatment | 1 | 41 | Mean Difference (IV, Fixed, 95% CI) | 0.18 [‐1.68, 2.04] |
| 21.9.7 Secondary: impulsivity (continuous), at end of treatment | 1 | 41 | Mean Difference (IV, Fixed, 95% CI) | 0.24 [‐0.26, 0.75] |
| 21.9.8 Secondary: interpersonal problems (continuous), at end of treatment | 1 | 41 | Mean Difference (IV, Fixed, 95% CI) | ‐1.31 [‐2.05, ‐0.57] |
| 21.9.9 Secondary: abandonment (continuous), at end of treatment | 1 | 41 | Mean Difference (IV, Fixed, 95% CI) | ‐1.11 [‐2.14, ‐0.08] |
| 21.9.10 Secondary: dissociation and psychotic‐like symptoms (continuous), at end of treatment | 1 | 41 | Mean Difference (IV, Fixed, 95% CI) | ‐0.44 [‐1.56, 0.68] |
| 21.10 DBT vs DBT‐SD, secondary: attrition (dichotomous), at end of treatment Show forest plot | 1 | 84 | Risk Ratio (M‐H, Fixed, 95% CI) | 0.37 [0.17, 0.78] |
| 21.11 Standard DBT (DBT) vs DBT Prolonged Exposure (PE) (continuous) Show forest plot | 1 | Mean Difference (IV, Fixed, 95% CI) | Subtotals only | |
| 21.11.1 Primary: self‐harm (continuous), end of treatment | 1 | 18 | Mean Difference (IV, Fixed, 95% CI) | 0.10 [‐1.86, 2.06] |
| 21.11.2 Primary: self‐harm (continuous), at 0‐6 months follow‐up | 1 | 18 | Mean Difference (IV, Fixed, 95% CI) | ‐0.30 [‐1.09, 0.49] |
| 21.11.3 Primary: suicide‐related outcomes (continuous), end of treatment | 1 | 18 | Mean Difference (IV, Fixed, 95% CI) | Not estimable |
| 21.11.4 Primary: suicide‐related outcomes (continuous), at 0‐6 months follow‐up | 1 | 18 | Mean Difference (IV, Fixed, 95% CI) | Not estimable |
| 21.11.5 Primary: psychosocial functioning (continuous), end of treatment | 1 | 18 | Mean Difference (IV, Fixed, 95% CI) | 5.27 [‐2.06, 12.60] |
| 21.11.6 Primary: psychosocial functioning (continuous), at 0‐6 months follow‐up | 1 | 18 | Mean Difference (IV, Fixed, 95% CI) | 2.00 [‐6.27, 10.27] |
| 21.11.7 Secondary: interpersonal problems (continuous), end of treatment | 1 | 18 | Mean Difference (IV, Fixed, 95% CI) | 0.14 [‐0.42, 0.70] |
| 21.11.8 Secondary: interpersonal problems (continuous), at 0‐6 months follow‐up | 1 | 18 | Mean Difference (IV, Fixed, 95% CI) | 0.19 [‐0.48, 0.86] |
| 21.11.9 Secondary: dissociation or psychotic‐like symptoms (continuous), end of treatment | 1 | 18 | Mean Difference (IV, Fixed, 95% CI) | 4.60 [‐9.24, 18.44] |
| 21.11.10 Secondary: dissociation or psychotic‐like symptoms (continuous), at 0‐6 months follow‐up | 1 | 18 | Mean Difference (IV, Fixed, 95% CI) | 6.00 [‐9.46, 21.46] |
| 21.11.11 Secondary: depression (continuous), end of treatment | 1 | 18 | Mean Difference (IV, Fixed, 95% CI) | 3.70 [‐3.19, 10.59] |
| 21.11.12 Secondary: depression (continuous), at 0‐6 months follow‐up | 1 | 18 | Mean Difference (IV, Fixed, 95% CI) | 4.30 [‐1.08, 9.68] |
| 21.12 DBT vs DBT‐PE, secondary: attrition (dichotomous), at 0‐6 months follow‐up Show forest plot | 1 | Risk Ratio (M‐H, Fixed, 95% CI) | Subtotals only | |
| 21.13 DBT skills group + case management (DBT‐S) vs DBT individual therapy + activity group (DBT‐I) (continuous) Show forest plot | 1 | Mean Difference (IV, Fixed, 95% CI) | Subtotals only | |
| 21.13.1 Primary: self‐harm (continuous), at end of treatment | 1 | 66 | Mean Difference (IV, Fixed, 95% CI) | ‐10.70 [‐22.47, 1.07] |
| 21.13.2 Primary: self‐harming behaviour (continuous), at 6‐12 months follow‐up | 1 | 66 | Mean Difference (IV, Fixed, 95% CI) | ‐6.60 [‐19.72, 6.52] |
| 21.13.3 Primary: suicide‐related outcomes (continuous), at end of treatment | 1 | 66 | Mean Difference (IV, Fixed, 95% CI) | ‐0.30 [‐1.72, 1.12] |
| 21.13.4 Primary: suicide‐related outcomes (continuous), at 6‐12 months follow‐up | 1 | 66 | Mean Difference (IV, Fixed, 95% CI) | ‐2.10 [‐3.21, ‐0.99] |
| 21.13.5 Secondary: depression (continuous), at end of treatment | 1 | 66 | Mean Difference (IV, Fixed, 95% CI) | ‐7.80 [‐11.27, ‐4.33] |
| 21.13.6 Secondary: depression (continuous), at 6‐12 months follow‐up | 1 | 66 | Mean Difference (IV, Fixed, 95% CI) | ‐2.00 [‐6.44, 2.44] |
| 21.14 DBT‐S vs DBT‐I, secondary: attrition (dichotomous), at 6‐12 months follow‐up Show forest plot | 1 | Risk Ratio (M‐H, Fixed, 95% CI) | Subtotals only | |
| 21.15 DBT skills group (DBT‐S) vs cognitive therapy group (CT‐G) (continuous) Show forest plot | 1 | Mean Difference (IV, Fixed, 95% CI) | Subtotals only | |
| 21.15.1 Primary: BPD symptom severity (continuous), at end of treatment | 1 | 82 | Mean Difference (IV, Fixed, 95% CI) | 0.26 [‐0.13, 0.65] |
| 21.15.2 Primary: BPD symptom severity (continuous), at 0‐6 months follow‐up | 1 | 82 | Mean Difference (IV, Fixed, 95% CI) | ‐0.96 [‐1.15, ‐0.77] |
| 21.15.3 Primary: suicide‐related outcomes (continuous), at end of treatment | 1 | 82 | Mean Difference (IV, Fixed, 95% CI) | 0.46 [‐2.47, 3.39] |
| 21.15.4 Primary: suicide‐related outcomes (continuous), at 0‐6 months follow‐up | 1 | 82 | Mean Difference (IV, Fixed, 95% CI) | ‐2.69 [‐4.89, ‐0.49] |
| 21.15.5 Secondary: depression (continuous), at end of treatment | 1 | 82 | Mean Difference (IV, Fixed, 95% CI) | ‐2.12 [‐5.25, 1.01] |
| 21.15.6 Secondary: depression (continuous), at 0‐6 months follow‐up | 1 | 82 | Mean Difference (IV, Fixed, 95% CI) | ‐1.60 [‐5.07, 1.87] |
| 21.16 DBT‐S vs CT‐G, secondary: attrition (dichotomous), at end of treatment Show forest plot | 1 | Risk Ratio (M‐H, Random, 95% CI) | Subtotals only | |
| 21.17 DBT skills group (DBT‐S) vs schema‐focused therapy group (SFT‐G) Show forest plot | 1 | Mean Difference (IV, Random, 95% CI) | Subtotals only | |
| 21.17.1 Primary: suicide‐related outcomes (continuous), at end of treatment | 1 | 24 | Mean Difference (IV, Random, 95% CI) | 0.92 [‐0.36, 2.20] |
| 21.17.2 Secondary: depression (continuous), at end of treatment | 1 | 24 | Mean Difference (IV, Random, 95% CI) | 4.33 [2.57, 6.09] |
| 21.18 DBT mindfulness group (DBT‐M) vs DBT interpersonal effectiveness group (DBT‐IE) (continuous) Show forest plot | 2 | Std. Mean Difference (IV, Random, 95% CI) | Subtotals only | |
| 21.18.1 Primary: BPD symptom severity (continuous), at end of treatment | 2 | 113 | Std. Mean Difference (IV, Random, 95% CI) | ‐0.45 [‐1.47, 0.58] |
| 21.18.2 Secondary: impulsivity (continuous), at end of treatment | 2 | 91 | Std. Mean Difference (IV, Random, 95% CI) | ‐0.36 [‐0.77, 0.06] |
| 21.19 DBT‐M vs DBT‐IE, secondary: attrition (dichotomous), at end of treatment Show forest plot | 2 | 134 | Risk Ratio (M‐H, Random, 95% CI) | 1.86 [1.07, 3.23] |
| 21.20 DBT mindfulness group (DBT‐M) vs loving‐kindness and compassion meditation (LK/CM), primary: BPD symptom severity (continuous), at end of treatment Show forest plot | 1 | Mean Difference (IV, Fixed, 95% CI) | Subtotals only | |
| Outcome or subgroup title | No. of studies | No. of participants | Statistical method | Effect size |
| 22.1 CBT vs trauma‐ and anxiety‐related group psychoeducation (continuous) Show forest plot | 1 | Mean Difference (IV, Fixed, 95% CI) | Subtotals only | |
| 22.1.1 Primary: BPD symptom severity (continuous), at end of treatment | 1 | 50 | Mean Difference (IV, Fixed, 95% CI) | ‐0.26 [‐1.46, 0.94] |
| 22.1.2 Primary: BPD symptom severity (continuous), at 0‐6 months follow‐up | 1 | 50 | Mean Difference (IV, Fixed, 95% CI) | ‐0.39 [‐1.60, 0.82] |
| 22.1.3 Primary: BPD symptom severity (continuous), at 6‐12 months follow‐up | 1 | 50 | Mean Difference (IV, Fixed, 95% CI) | 0.57 [‐0.48, 1.62] |
| 22.1.4 Primary: psychosocial functioning (continuous), at end of treatment | 1 | 50 | Mean Difference (IV, Fixed, 95% CI) | ‐0.64 [‐5.76, 4.48] |
| 22.1.5 Primary: psychosocial functioning (continuous), at 0‐6 months follow‐up | 1 | 50 | Mean Difference (IV, Fixed, 95% CI) | ‐1.23 [‐6.94, 4.48] |
| 22.1.6 Primary: psychosocial functioning (continuous), at 6‐12 months follow‐up | 1 | 50 | Mean Difference (IV, Fixed, 95% CI) | 0.61 [‐5.00, 6.22] |
| 22.1.7 Secondary: depression (continuous), at end of treatment | 1 | 50 | Mean Difference (IV, Fixed, 95% CI) | 0.76 [‐8.20, 9.72] |
| 22.1.8 Secondary: depression (continuous), at 0‐6 months follow‐up | 1 | 50 | Mean Difference (IV, Fixed, 95% CI) | 3.13 [‐4.05, 10.31] |
| 22.1.9 Secondary: depression (continuous), at 6‐12 months follow‐up | 1 | 50 | Mean Difference (IV, Fixed, 95% CI) | 0.77 [‐7.08, 8.62] |
| 22.2 CBT vs trauma‐ and anxiety‐related group psychoeducation, secondary: attrition (dichotomous), at end of treatment Show forest plot | 1 | Risk Ratio (M‐H, Fixed, 95% CI) | Subtotals only | |
| 22.3 CBT vs interpersonal psychotherapy (IPT) (continuous) Show forest plot | 1 | Mean Difference (IV, Fixed, 95% CI) | Subtotals only | |
| 22.3.1 Primary: psychosocial functioning (continuous), at end of treatment | 1 | 26 | Mean Difference (IV, Fixed, 95% CI) | ‐5.30 [‐12.36, 1.76] |
| 22.3.2 Secondary: depression (continuous), at end of treatment | 1 | 26 | Mean Difference (IV, Fixed, 95% CI) | ‐0.40 [‐4.72, 3.92] |
| 22.4 CBT vs IPT, secondary: attrition (dichotomous), at end of treatment Show forest plot | 1 | Risk Ratio (M‐H, Fixed, 95% CI) | Subtotals only | |
| 22.5 CBT vs Rogerian supportive therapy (continuous) Show forest plot | 1 | Mean Difference (IV, Fixed, 95% CI) | Subtotals only | |
| 22.5.1 Primary: self‐harm (continuous), end of treatment | 1 | 38 | Mean Difference (IV, Fixed, 95% CI) | 0.74 [‐0.03, 1.51] |
| 22.5.2 Primary: self‐harm (continuous), at 6‐12 months follow‐up | 1 | 21 | Mean Difference (IV, Fixed, 95% CI) | ‐0.63 [‐1.75, 0.49] |
| 22.5.3 Primary: suicide‐related outcomes (continuous), at end of treatment | 1 | 38 | Mean Difference (IV, Fixed, 95% CI) | 0.69 [‐2.60, 3.98] |
| 22.5.4 Primary: suicide‐related outcomes (continuous), at 6‐12 months follow‐up | 1 | 21 | Mean Difference (IV, Fixed, 95% CI) | ‐2.43 [‐6.14, 1.28] |
| 22.5.5 Primary: psychosocial functioning (continuous), at end of treatment | 1 | 38 | Mean Difference (IV, Fixed, 95% CI) | ‐0.43 [‐1.31, 0.45] |
| 22.5.6 Primary: psychosocial functioning (continuous), at 6‐12 months follow‐up | 1 | 21 | Mean Difference (IV, Fixed, 95% CI) | ‐0.98 [‐2.02, 0.06] |
| 22.5.7 Secondary: impulsivity (continuous), at end of treatment | 1 | 38 | Mean Difference (IV, Fixed, 95% CI) | ‐1.01 [‐3.85, 1.83] |
| 22.5.8 Secondary: impulsivity (continuous), at 6‐12 months follow‐up | 1 | 21 | Mean Difference (IV, Fixed, 95% CI) | ‐2.18 [‐5.91, 1.55] |
| 22.5.9 Secondary: depression (continuous), at end of treatment | 1 | 38 | Mean Difference (IV, Fixed, 95% CI) | 1.04 [‐5.59, 7.67] |
| 22.5.10 Secondary: depression (continuous), at 6‐12 months follow‐up | 1 | 21 | Mean Difference (IV, Fixed, 95% CI) | ‐5.15 [‐9.38, ‐0.92] |
| 22.6 CBT vs Rogerian supportive therapy, secondary: attrition (dichotomous), end of treatment Show forest plot | 1 | Risk Ratio (M‐H, Fixed, 95% CI) | Subtotals only | |
| 22.7 MACT (Manual‐assisted Cognitive Therapy) vs MACT + therapeutic assessment (MACT + TA) (continuous) Show forest plot | 1 | Mean Difference (IV, Random, 95% CI) | Subtotals only | |
| 22.7.1 Primary: BPD symptom severity (continuous), at end of treatment | 1 | 16 | Mean Difference (IV, Random, 95% CI) | ‐3.75 [‐14.17, 6.67] |
| 22.7.2 Primary: self‐harm (continuous), at end of treatment | 1 | 16 | Mean Difference (IV, Random, 95% CI) | 1.75 [‐18.71, 22.21] |
| 22.7.3 Primary: suicide‐related outcomes (continuous), at end of treatment | 1 | 16 | Mean Difference (IV, Random, 95% CI) | ‐0.63 [‐17.71, 16.45] |
| 22.7.4 Secondary: affective instability (continuous), at end of treatment | 1 | 16 | Mean Difference (IV, Random, 95% CI) | ‐5.25 [‐12.10, 1.60] |
| 22.7.5 Secondary: interpersonal problems (continuous), at end of treatment | 1 | 16 | Mean Difference (IV, Random, 95% CI) | ‐0.50 [‐11.24, 10.24] |
| 22.7.6 Secondary: identity disturbance (continuous), at end of treatment | 1 | 16 | Mean Difference (IV, Random, 95% CI) | ‐4.88 [‐14.98, 5.22] |
| 22.8 MACT vs MACT + TA, secondary: attrition (dichotomous), at end of treatment Show forest plot | 1 | Risk Ratio (M‐H, Fixed, 95% CI) | Subtotals only | |
| 22.9 Meta‐Cognitive training for BPD (B‐MCT) vs progressive muscle relaxation training (PMR) Show forest plot | 1 | Mean Difference (IV, Fixed, 95% CI) | Subtotals only | |
| 22.9.1 Primary: BPD symptom severity (continuous), at end of treatment | 1 | 49 | Mean Difference (IV, Fixed, 95% CI) | ‐1.80 [‐4.97, 1.37] |
| 22.9.2 Primary: BPD symptom severity (continuous), at 0‐6 months follow up | 1 | 39 | Mean Difference (IV, Fixed, 95% CI) | ‐3.60 [‐7.16, ‐0.04] |
| 22.9.3 Secondary: depression (continuous), at end of treatment | 1 | 54 | Mean Difference (IV, Fixed, 95% CI) | ‐3.20 [‐9.91, 3.51] |
| 22.9.4 Secondary: depression (continuous), at 0‐6 months follow‐up | 1 | 47 | Mean Difference (IV, Fixed, 95% CI) | 8.50 [2.03, 14.97] |
| 22.10 B‐MCT vs progressive muscle relaxation (PMR) training + TAU (dichotomous). Secondary: attrition (dichotomous), at end of treatment Show forest plot | 1 | Risk Ratio (M‐H, Fixed, 95% CI) | Subtotals only | |
| 22.11 MOTR (Motive‐Oriented Therapeutic Relationship) vs Good Psychiatric Management (GPM) (continuous) Show forest plot | 2 | Std. Mean Difference (IV, Random, 95% CI) | Subtotals only | |
| 22.11.1 Primary: BPD symptom severity (continuous), at end of treatment | 1 | 74 | Std. Mean Difference (IV, Random, 95% CI) | 0.07 [‐0.39, 0.53] |
| 22.11.2 Primary: psychosocial functioning (continuous), at end of treatment | 2 | 99 | Std. Mean Difference (IV, Random, 95% CI) | ‐0.45 [‐0.85, ‐0.05] |
| 22.11.3 Secondary: interpersonal problems (continuous), at end of treatment | 2 | 99 | Std. Mean Difference (IV, Random, 95% CI) | ‐0.56 [‐0.97, ‐0.16] |
| 22.12 MOTR vs (GPM), secondary: attrition (dichotomous), at end of treatment Show forest plot | 2 | 110 | Risk Ratio (M‐H, Random, 95% CI) | 0.61 [0.26, 1.41] |
| Outcome or subgroup title | No. of studies | No. of participants | Statistical method | Effect size |
| 23.1 SFT vs TFP. Primary: BPD symptom severity (continuous), at end of treatment Show forest plot | 1 | Mean Difference (IV, Fixed, 95% CI) | Subtotals only | |
| 23.2 SFT vs TFP. Secondary: attrition (dichotomous), at 0‐6 months follow‐up Show forest plot | 1 | Risk Ratio (M‐H, Fixed, 95% CI) | Subtotals only | |
| 23.3 SFT vs SFT + therapist availability (TA). Primary: BPD symptom severity (continuous), at end of treatment Show forest plot | 1 | Mean Difference (IV, Fixed, 95% CI) | Subtotals only | |
| 23.4 SFT vs SFT + TA. Secondary: attrition (dichotomous), 0‐6 months follow‐up Show forest plot | 1 | Risk Ratio (M‐H, Fixed, 95% CI) | Subtotals only | |
| Outcome or subgroup title | No. of studies | No. of participants | Statistical method | Effect size |
| 24.1 STEPPS‐PE vs CR Show forest plot | 1 | Mean Difference (IV, Fixed, 95% CI) | Subtotals only | |
| 24.1.1 Primary: BPD symptom severity (continuous), at end of treatment | 1 | 46 | Mean Difference (IV, Fixed, 95% CI) | ‐3.67 [‐6.52, ‐0.82] |
| 24.1.2 Primary: BPD symptom severity (continuous), at 0‐6 months follow‐up | 1 | 42 | Mean Difference (IV, Fixed, 95% CI) | 4.68 [1.42, 7.94] |
| 24.1.3 Secondary: impulsivity (continuous), at end of treatment | 1 | 46 | Mean Difference (IV, Fixed, 95% CI) | 1.99 [0.06, 3.92] |
| 24.1.4 Secondary: impulsivity (continuous), at 0‐6 months follow‐up | 1 | 42 | Mean Difference (IV, Fixed, 95% CI) | 9.92 [7.38, 12.46] |
| 24.1.5 Secondary: depression (continuous), at end of treatment | 1 | 48 | Mean Difference (IV, Fixed, 95% CI) | ‐2.58 [‐3.62, ‐1.54] |
| 24.1.6 Secondary: depression (continuous), at 0‐6 months follow‐up | 1 | 42 | Mean Difference (IV, Fixed, 95% CI) | ‐10.11 [‐11.35, ‐8.87] |
| 24.2 STEPPS‐PE vs CR. Secondary: attrition (dichotomous), at end of treatment Show forest plot | 1 | Risk Ratio (M‐H, Fixed, 95% CI) | Subtotals only | |
| Outcome or subgroup title | No. of studies | No. of participants | Statistical method | Effect size |
| 25.1 Combined inpatient and outpatient psychotherapy versus outpatient psychotherapy Show forest plot | 1 | Mean Difference (IV, Fixed, 95% CI) | Subtotals only | |
| 25.1.1 Primary: psychosocial functioning (continuous), at end of treatment | 1 | 52 | Mean Difference (IV, Fixed, 95% CI) | 6.50 [‐0.06, 13.06] |
| 25.1.2 Primary: psychosocial functioning (continuous), at above 12 months follow‐up | 1 | 52 | Mean Difference (IV, Fixed, 95% CI) | ‐5.70 [‐13.33, 1.93] |
| 25.1.3 Secondary: interpersonal problems (continuous), at end of treatment | 1 | 52 | Mean Difference (IV, Fixed, 95% CI) | 0.05 [‐0.24, 0.34] |
| 25.1.4 Secondary: interpersonal problems (continuous), at above 12 months follow‐up | 1 | 52 | Mean Difference (IV, Fixed, 95% CI) | ‐0.42 [‐0.77, ‐0.07] |
| 25.1.5 Secondary: identity disturbance (continuous), at end of treatment | 1 | 52 | Mean Difference (IV, Fixed, 95% CI) | ‐0.25 [‐0.59, 0.09] |
| 25.1.6 Secondary: identity disturbance (continuous), at above 12 months follow‐up | 1 | 52 | Mean Difference (IV, Fixed, 95% CI) | ‐0.47 [‐0.78, ‐0.16] |
| 25.1.7 Secondary: depression (continuous), at end of treatment | 1 | 52 | Mean Difference (IV, Fixed, 95% CI) | ‐0.40 [‐6.25, 5.45] |
| 25.1.8 Secondary: depression (continuous), at above 12 months follow‐up | 1 | 52 | Mean Difference (IV, Fixed, 95% CI) | ‐4.70 [‐11.02, 1.62] |
| 25.2 Combined inpatient and outpatient psychotherapy versus outpatient psychotherapy. Secondary: attrition (dichotomous), at end of treatment Show forest plot | 1 | Risk Ratio (M‐H, Fixed, 95% CI) | Subtotals only | |
| 25.3 integrative BPD‐oriented adolescent family therapy (I‐BAFT) vs individual drug counselling (IDC) Show forest plot | 1 | Risk Ratio (M‐H, Fixed, 95% CI) | Subtotals only | |
| 25.3.1 Primary: BPD symptom severity (dichotomous), at end of treatment | 1 | 40 | Risk Ratio (M‐H, Fixed, 95% CI) | 0.91 [0.50, 1.64] |
| 25.3.2 Secondary: attrition (dichotomous), at 6‐12 months follow‐up | 1 | 40 | Risk Ratio (M‐H, Fixed, 95% CI) | 0.50 [0.18, 1.40] |
| Outcome or subgroup title | No. of studies | No. of participants | Statistical method | Effect size |
| 26.1 BPD symptom severity Show forest plot | 23 | Std. Mean Difference (IV, Random, 95% CI) | Subtotals only | |
| 26.1.1 DBT | 3 | 149 | Std. Mean Difference (IV, Random, 95% CI) | ‐0.60 [‐1.05, ‐0.14] |
| 26.1.2 MBT | 5 | 267 | Std. Mean Difference (IV, Random, 95% CI) | ‐0.13 [‐0.38, 0.11] |
| 26.1.3 Psychodynamic psychotherapy | 4 | 222 | Std. Mean Difference (IV, Random, 95% CI) | ‐0.29 [‐0.66, 0.09] |
| 26.1.4 STEPPS | 3 | 273 | Std. Mean Difference (IV, Random, 95% CI) | ‐0.39 [‐0.63, ‐0.15] |
| 26.1.5 Eclectic treatments | 3 | 134 | Std. Mean Difference (IV, Random, 95% CI) | ‐0.90 [‐1.57, ‐0.23] |
| 26.1.6 ACT | 1 | 41 | Std. Mean Difference (IV, Random, 95% CI) | ‐1.22 [‐1.89, ‐0.55] |
| 26.1.7 CBT | 1 | 26 | Std. Mean Difference (IV, Random, 95% CI) | ‐1.28 [‐2.14, ‐0.42] |
| 26.1.8 SFT | 1 | 28 | Std. Mean Difference (IV, Random, 95% CI) | ‐1.66 [‐2.54, ‐0.78] |
| 26.1.9 CAT | 1 | 9 | Std. Mean Difference (IV, Random, 95% CI) | ‐0.53 [‐1.88, 0.83] |
| 26.1.10 Tranference‐focused psychotherapy | 1 | 104 | Std. Mean Difference (IV, Random, 95% CI) | ‐0.55 [‐0.95, ‐0.16] |
| 26.2 Psychosocial functioning Show forest plot | 22 | Std. Mean Difference (IV, Random, 95% CI) | Subtotals only | |
| 26.2.1 DBT | 6 | 225 | Std. Mean Difference (IV, Random, 95% CI) | ‐0.36 [‐0.69, ‐0.03] |
| 26.2.2 MBT | 3 | 239 | Std. Mean Difference (IV, Random, 95% CI) | ‐0.54 [‐1.24, 0.16] |
| 26.2.3 Psychodynamic psychotherapy | 4 | 140 | Std. Mean Difference (IV, Random, 95% CI) | ‐0.69 [‐1.98, 0.59] |
| 26.2.4 Eclectic treatments | 2 | 231 | Std. Mean Difference (IV, Random, 95% CI) | ‐0.57 [‐1.10, ‐0.04] |
| 26.2.5 CBT | 1 | 99 | Std. Mean Difference (IV, Random, 95% CI) | 0.00 [‐0.39, 0.39] |
| 26.2.6 SFT | 1 | 28 | Std. Mean Difference (IV, Random, 95% CI) | ‐1.20 [‐2.03, ‐0.38] |
| 26.2.7 STEPPS | 1 | 124 | Std. Mean Difference (IV, Random, 95% CI) | ‐0.55 [‐0.91, ‐0.19] |
| 26.2.8 CAT | 1 | 9 | Std. Mean Difference (IV, Random, 95% CI) | ‐1.22 [‐2.73, 0.30] |
| 26.2.9 Motivation feedback | 1 | 43 | Std. Mean Difference (IV, Random, 95% CI) | ‐0.07 [‐0.69, 0.55] |
| 26.2.10 Tranference‐focused psychotherapy | 1 | 104 | Std. Mean Difference (IV, Random, 95% CI) | ‐0.34 [‐0.73, 0.05] |
| 26.2.11 Once‐only intervention | 1 | 72 | Std. Mean Difference (IV, Random, 95% CI) | 0.03 [‐0.43, 0.49] |
| Outcome or subgroup title | No. of studies | No. of participants | Statistical method | Effect size |
| 27.1 BPD symptom severity Show forest plot | 22 | Std. Mean Difference (IV, Random, 95% CI) | Subtotals only | |
| 27.1.1 15 to 18 years old | 2 | 156 | Std. Mean Difference (IV, Random, 95% CI) | ‐0.14 [‐0.46, 0.17] |
| 27.1.2 Above 18 years old | 20 | 1088 | Std. Mean Difference (IV, Random, 95% CI) | ‐0.57 [‐0.76, ‐0.37] |
| Outcome or subgroup title | No. of studies | No. of participants | Statistical method | Effect size |
| 28.1 BPD symptom severity Show forest plot | 22 | Std. Mean Difference (IV, Random, 95% CI) | Subtotals only | |
| 28.1.1 Less than 6 months | 8 | 525 | Std. Mean Difference (IV, Random, 95% CI) | ‐0.76 [‐1.10, ‐0.42] |
| 28.1.2 6 to 12 months | 11 | 606 | Std. Mean Difference (IV, Random, 95% CI) | ‐0.36 [‐0.60, ‐0.12] |
| 28.1.3 Above 12 months | 3 | 113 | Std. Mean Difference (IV, Random, 95% CI) | ‐0.37 [‐0.75, 0.01] |
| 28.2 Psychosocial functioning Show forest plot | 20 | Std. Mean Difference (IV, Random, 95% CI) | Subtotals only | |
| 28.2.1 Less than 6 months | 6 | 468 | Std. Mean Difference (IV, Random, 95% CI) | ‐0.31 [‐0.73, 0.11] |
| 28.2.2 6 to 12 months | 10 | 535 | Std. Mean Difference (IV, Random, 95% CI) | ‐0.25 [‐0.49, ‐0.01] |
| 28.2.3 Over 12 months | 4 | 263 | Std. Mean Difference (IV, Random, 95% CI) | ‐0.86 [‐1.62, ‐0.10] |
| Outcome or subgroup title | No. of studies | No. of participants | Statistical method | Effect size |
| 29.1 BPD symptom severity Show forest plot | 22 | Std. Mean Difference (IV, Random, 95% CI) | Subtotals only | |
| 29.1.1 Individual therapy | 8 | 520 | Std. Mean Difference (IV, Random, 95% CI) | ‐0.39 [‐0.63, ‐0.16] |
| 29.1.2 Group therapy | 8 | 438 | Std. Mean Difference (IV, Random, 95% CI) | ‐0.89 [‐1.21, ‐0.57] |
| 29.1.3 Mixed therapy | 6 | 286 | Std. Mean Difference (IV, Random, 95% CI) | ‐0.15 [‐0.38, 0.09] |
| 29.2 Psychosocial functioning Show forest plot | 22 | Std. Mean Difference (IV, Random, 95% CI) | Subtotals only | |
| 29.2.1 Individual therapy | 8 | 570 | Std. Mean Difference (IV, Random, 95% CI) | ‐0.31 [‐0.75, 0.12] |
| 29.2.2 Group therapy | 7 | 366 | Std. Mean Difference (IV, Random, 95% CI) | ‐0.44 [‐0.65, ‐0.23] |
| 29.2.3 Mixed therapy | 7 | 378 | Std. Mean Difference (IV, Random, 95% CI) | ‐0.63 [‐1.14, ‐0.13] |
| Outcome or subgroup title | No. of studies | No. of participants | Statistical method | Effect size |
| 30.1 BPD symptom severity Show forest plot | 22 | Std. Mean Difference (IV, Random, 95% CI) | Subtotals only | |
| 30.1.1 Inpatient | 2 | 217 | Std. Mean Difference (IV, Random, 95% CI) | ‐0.07 [‐0.34, 0.20] |
| 30.1.2 Outpatient | 20 | 1027 | Std. Mean Difference (IV, Random, 95% CI) | ‐0.58 [‐0.77, ‐0.39] |
| 30.2 Psychosocial functioning Show forest plot | 22 | Std. Mean Difference (IV, Random, 95% CI) | Subtotals only | |
| 30.2.1 Inpatient | 2 | 179 | Std. Mean Difference (IV, Random, 95% CI) | ‐0.85 [‐1.24, ‐0.46] |
| 30.2.2 Outpatient | 18 | 1057 | Std. Mean Difference (IV, Random, 95% CI) | ‐0.31 [‐0.54, ‐0.08] |
| 30.2.3 Inpatient and outpatient | 2 | 78 | Std. Mean Difference (IV, Random, 95% CI) | ‐1.34 [‐1.84, ‐0.84] |
| Outcome or subgroup title | No. of studies | No. of participants | Statistical method | Effect size |
| 31.1 BPD symptom severity Show forest plot | 22 | Std. Mean Difference (IV, Random, 95% CI) | Subtotals only | |
| 31.1.1 Self‐rated | 8 | 408 | Std. Mean Difference (IV, Random, 95% CI) | ‐0.74 [‐1.19, ‐0.29] |
| 31.1.2 Clinician‐rated | 14 | 836 | Std. Mean Difference (IV, Random, 95% CI) | ‐0.42 [‐0.58, ‐0.25] |
| 31.2 Psychosocial functioning Show forest plot | 22 | Std. Mean Difference (IV, Random, 95% CI) | Subtotals only | |
| 31.2.1 Self‐rated | 12 | 728 | Std. Mean Difference (IV, Random, 95% CI) | ‐0.29 [‐0.60, 0.03] |
| 31.2.2 Clinician‐rated | 10 | 586 | Std. Mean Difference (IV, Random, 95% CI) | ‐0.66 [‐0.96, ‐0.37] |
| Outcome or subgroup title | No. of studies | No. of participants | Statistical method | Effect size |
| 32.1 BPD symptom severity Show forest plot | 22 | Std. Mean Difference (IV, Random, 95% CI) | Subtotals only | |
| 32.1.1 Obligatory TAU | 19 | 1071 | Std. Mean Difference (IV, Random, 95% CI) | ‐0.50 [‐0.70, ‐0.30] |
| 32.1.2 Optional TAU | 3 | 173 | Std. Mean Difference (IV, Random, 95% CI) | ‐0.63 [‐1.09, ‐0.17] |
| 32.2 Psychosocial functioning Show forest plot | 22 | Std. Mean Difference (IV, Random, 95% CI) | Subtotals only | |
| 32.2.1 Obligatory TAU | 17 | 1002 | Std. Mean Difference (IV, Random, 95% CI) | ‐0.32 [‐0.56, ‐0.09] |
| 32.2.2 Optional TAU | 5 | 312 | Std. Mean Difference (IV, Random, 95% CI) | ‐0.96 [‐1.62, ‐0.30] |
| Outcome or subgroup title | No. of studies | No. of participants | Statistical method | Effect size |
| 33.1 BPD symptom severity Show forest plot | 25 | Std. Mean Difference (IV, Random, 95% CI) | Subtotals only | |
| 33.1.1 TAU | 22 | 1244 | Std. Mean Difference (IV, Random, 95% CI) | ‐0.52 [‐0.70, ‐0.33] |
| 33.1.2 Waiting list | 3 | 161 | Std. Mean Difference (IV, Random, 95% CI) | ‐0.49 [‐0.93, ‐0.05] |
| 33.2 Psychosocial functioning Show forest plot | 27 | Std. Mean Difference (IV, Random, 95% CI) | Subtotals only | |
| 33.2.1 TAU | 22 | 1314 | Std. Mean Difference (IV, Random, 95% CI) | ‐0.45 [‐0.68, ‐0.22] |
| 33.2.2 Waiting list | 5 | 219 | Std. Mean Difference (IV, Random, 95% CI) | ‐0.56 [‐1.01, ‐0.11] |
| Outcome or subgroup title | No. of studies | No. of participants | Statistical method | Effect size |
| 34.1 BPD symptom severity Show forest plot | 22 | Std. Mean Difference (IV, Random, 95% CI) | Subtotals only | |
| 34.1.1 ZAN‐BPD | 4 | 261 | Std. Mean Difference (IV, Random, 95% CI) | ‐0.45 [‐0.69, ‐0.20] |
| 34.1.2 SCID | 3 | 112 | Std. Mean Difference (IV, Random, 95% CI) | ‐0.58 [‐1.16, ‐0.00] |
| 34.1.3 BEST | 4 | 147 | Std. Mean Difference (IV, Random, 95% CI) | ‐1.10 [‐1.47, ‐0.72] |
| 34.1.4 BPDSI | 4 | 267 | Std. Mean Difference (IV, Random, 95% CI) | ‐0.21 [‐0.45, 0.04] |
| 34.1.5 BPP‐40 | 1 | 52 | Std. Mean Difference (IV, Random, 95% CI) | ‐0.55 [‐1.11, 0.00] |
| 34.1.6 CGI‐BPD | 1 | 33 | Std. Mean Difference (IV, Random, 95% CI) | 0.00 [‐0.68, 0.68] |
| 34.1.7 CCGI‐BPD | 1 | 59 | Std. Mean Difference (IV, Random, 95% CI) | ‐1.01 [‐1.55, ‐0.47] |
| 34.1.8 BPT | 1 | 122 | Std. Mean Difference (IV, Random, 95% CI) | ‐0.07 [‐0.43, 0.28] |
| 34.1.9 BPFS‐C | 1 | 59 | Std. Mean Difference (IV, Random, 95% CI) | ‐0.01 [‐0.52, 0.50] |
| 34.1.10 BSI | 1 | 28 | Std. Mean Difference (IV, Random, 95% CI) | ‐1.66 [‐2.54, ‐0.78] |
| 34.1.11 Mean number of DSM‐IV symptoms | 1 | 104 | Std. Mean Difference (IV, Random, 95% CI) | ‐0.55 [‐0.95, ‐0.16] |
| 34.2 Psychosocial functioning Show forest plot | 22 | Std. Mean Difference (IV, Random, 95% CI) | Subtotals only | |
| 34.2.1 GAF | 4 | 204 | Std. Mean Difference (IV, Random, 95% CI) | ‐0.73 [‐1.41, ‐0.05] |
| 34.2.2 GAS | 4 | 330 | Std. Mean Difference (IV, Random, 95% CI) | ‐0.71 [‐0.96, ‐0.46] |
| 34.2.3 SAS | 4 | 283 | Std. Mean Difference (IV, Random, 95% CI) | ‐0.23 [‐0.99, 0.53] |
| 34.2.4 SPS | 1 | 24 | Std. Mean Difference (IV, Random, 95% CI) | ‐2.17 [‐3.22, ‐1.13] |
| 34.2.5 QQ45 | 1 | 41 | Std. Mean Difference (IV, Random, 95% CI) | ‐0.47 [‐1.09, 0.15] |
| 34.2.6 WSAS | 1 | 72 | Std. Mean Difference (IV, Random, 95% CI) | 0.03 [‐0.43, 0.49] |
| 34.2.7 CORE‐OM | 1 | 41 | Std. Mean Difference (IV, Random, 95% CI) | 0.29 [‐0.34, 0.92] |
| 34.2.8 BDQ | 1 | 48 | Std. Mean Difference (IV, Random, 95% CI) | ‐0.42 [‐1.00, 0.16] |
| 34.2.9 SOFAS | 1 | 9 | Std. Mean Difference (IV, Random, 95% CI) | ‐1.22 [‐2.73, 0.30] |
| 34.2.10 SFQ | 1 | 99 | Std. Mean Difference (IV, Random, 95% CI) | 0.00 [‐0.39, 0.39] |
| 34.2.11 SDS | 1 | 61 | Std. Mean Difference (IV, Random, 95% CI) | ‐0.28 [‐0.78, 0.23] |
| 34.2.12 CGI | 1 | 59 | Std. Mean Difference (IV, Random, 95% CI) | ‐0.29 [‐0.80, 0.22] |
| 34.2.13 HoNOS | 1 | 43 | Std. Mean Difference (IV, Random, 95% CI) | ‐0.07 [‐0.69, 0.55] |
| Outcome or subgroup title | No. of studies | No. of participants | Statistical method | Effect size |
| 35.1 Primary: BPD symptom severity, at end of treatment Show forest plot | 22 | 1244 | Std. Mean Difference (IV, Random, 95% CI) | ‐0.47 [‐0.63, ‐0.31] |
| 35.2 Primary: self‐harm Show forest plot | 13 | 616 | Mean Difference (IV, Random, 95% CI) | ‐0.42 [‐0.69, ‐0.15] |
| 35.3 Primary: suicide‐related outcomes Show forest plot | 13 | 676 | Std. Mean Difference (IV, Random, 95% CI) | ‐0.30 [‐0.47, ‐0.14] |
| 35.4 Primary: psychosocial functioning, at end of treatment Show forest plot | 22 | 1314 | Std. Mean Difference (IV, Random, 95% CI) | ‐0.36 [‐0.55, ‐0.17] |
| 35.5 Secondary: depression Show forest plot | 22 | 1568 | Std. Mean Difference (IV, Random, 95% CI) | ‐0.34 [‐0.54, ‐0.14] |