Tests sans contact pour identifier les personnes à risque de glaucome primitif par fermeture de l'angle
Résumé scientifique
Contexte
Le glaucome primitif par fermeture de l'angle (GPFA) est responsable de 50 % de la cécité due au glaucome dans le monde. Plus des trois quarts des personnes atteintes de GPFA résident en Asie. Dans ces populations, le GPFA se développe souvent de manière insidieuse, entraînant une augmentation chronique de la pression intraoculaire et des lésions du nerf optique qui sont souvent asymptomatiques. Les tests sans contact permettant d'identifier les personnes présentant un risque de fermeture de l'angle sont relativement rapides et peuvent être effectués aux fins de dépistage par des professionnels de santé ou des techniciens ayant reçu une formation appropriée. Si le test est positif, la personne sera orientée vers une évaluation spécialisée plus poussée.
Objectifs
Déterminer la précision diagnostique des tests sans contact (profondeur de la chambre antérieure limbique (LACD) (signe de van Herick) ; éclairage oblique ; mesure de profondeur de la chambre antérieure périphérique par balayage (SPAC), photographie de Scheimpflug ; tomographie par cohérence optique du segment antérieur (AS‐OCT), pour identifier les personnes présentant un angle occlusif.
Stratégie de recherche documentaire
Nous avons effectué des recherches dans les bases de données bibliographiques suivantes le 3 octobre 2019: CENTRAL ; MEDLINE ; Embase ; BIOSIS ; OpenGrey ; ARIF et les registres d'essais cliniques. Les recherches n’ont pas pris en compte les études de cas. Les recherches ne comportaient aucune restriction sur la date ou la langue.
Critères de sélection
Nous avons inclus les études prospectives et rétrospectives transversales, de cohorte et de cas‐témoins, menées dans n'importe quel contexte, qui ont évalué la précision d'un ou de plusieurs tests de dépistage pour identifier les personnes présentant un angle occlusif par rapport à une norme de référence gonioscopique.
Recueil et analyse des données
Deux auteurs ont indépendamment effectué l'extraction des données et l'évaluation de la qualité en utilisant l’échelle QUADAS‐2 pour chaque étude. Pour chaque test, des tableaux 2 x 2 ont été créés et la sensibilité et la spécificité ont été calculées. Lorsque quatre études ou plus ont fourni des données à des seuils fixés pour chaque test, nous avons ajusté un modèle bivarié à l'aide de la fonction METANDI de STATA afin de calculer des estimations ponctuelles groupées pour la sensibilité et la spécificité. Pour les comparaisons entre les tests à l’étude et les sous‐groupes, nous avons effectué un test de rapport de vraisemblance comparant le modèle avec et sans la covariable.
Résultats principaux
Nous avons inclus 47 études portant sur 26 151 participants et analysant les données de 23 440 participants. La plupart des études ont été menées en Asie (36, 76,6 %). Vingt‐sept études ont évalué l'AS‐OCT (analyses portant sur 15 580 participants), 17 études le test LACD (7385 participants), neuf études la photographie Scheimpflug (1616 participants), six études le test SPAC (5239 participants) et cinq études ont évalué l’éclairage oblique (998 participants). En ce qui concerne la qualité des études, on a jugé que 36 des études incluses (76,6 %) présentaient un risque élevé de biais dans au moins un domaine. L'utilisation d’un plan d’étude cas‐témoin (13 études) ou les exclusions inappropriées (6 études) ont posé des problèmes de sélection des patients dans 40,4 % des études. Dans 59,6 % des études, des problèmes en matière de tests à l’étude étaient attribuables à l'absence de masquage ou à la détermination post‐hoc des seuils optimaux. Parmi les études qui n'ont pas utilisé un plan d’étude cas‐témoin, 16 (20 599 participants) ont été menées dans le cadre de la médecine générale/de soins de santé communautaires et 18 (2 590 participants) dans le cadre de soins secondaires, dont 15 ont examiné le test LACD.
On a procédé au calcul d’estimations globales pour les paramètres et les seuils couramment cités pour chaque test: LACD ≤ 25 % (16 études, 7540 yeux) : sensibilité 0,83 (intervalle de confiance (IC) à 95 % 0,74 à 0,90), spécificité 0,88 (IC à 95 % 0,84 à 0,92) (niveau de confiance modéré) ; éclairage oblique (grade1) (5 études, 1188 yeux) : sensibilité 0,51 (IC à 95 % 0,25 à 0,76), spécificité 0,92 (IC à 95 % 0,70 à 0,98) (niveau de confiance faible) ; SPAC (≤ 5 et/ou S ou P) (4 études, 4677 yeux) : sensibilité 0,83 (IC à 95 % 0,70 à 0,91), spécificité 0,78 (IC à 95 % 0,70 à 0,83) (niveau de confiance modéré) ; photographie de Scheimpflug (ACD central) (9 études, 1698 yeux) : sensibilité 0,92 (IC à 95 % 0,84 à 0,96), spécificité 0,86 (IC à 95 % 0,76 à 0,93) (niveau de confiance modéré) ; AS‐OCT (opinion subjective sur l’occlusion de l’angle) (13 études, 9242 yeux) : sensibilité 0,85 (IC à 95 % 0,76 à 0,91) ; spécificité 0,71 (IC à 95 % 0,62 à 0,78) (niveau de confiance modéré).
Pour les comparaisons de sensibilité et de spécificité entre les tests à l’étude, nous avons utilisé le test LACD (≤ 25%) comme référence. Le test d’éclairage oblique (seuil de grade 1) a montré une sensibilité statistiquement significativement inférieure à celle du test LACD (≤ 25 %), tandis que le test AS‐OCT (jugement subjectif) avait une spécificité statistiquement significativement inférieure. On a pas observé de différence statistiquement significative entre les groupes pour les autres comparaisons de tests à l’étude. Une analyse par sous‐groupes a été réalisée pour le test LACD (≤ 25%), comparant l’utilisation de ce dernier dans le cadre de soins de santé communautaires (7 études, 14,4% de prévalence) et de soins secondaires (7 études, 42% de prévalence). Nous n'avons pas trouvé de données probantes montrant une différence statistiquement significative dans les résultats des tests en fonction du cadre.
Si le test LACD était administré à 1 000 personnes présentant un risque de fermeture de l'angle avec une prévalence d'angles occlusifs de 10 %, le test LACD manquerait environ 17 cas sur les 100 présentant un angle occlusif et classerait de manière incorrecte 108 cas sur 900 sans fermeture d’angle.
Conclusions des auteurs
Le fait que la mesure de la profondeur de la chambre antérieure limbique ait donné d'aussi bons résultats que les tests diagnostiques qui utilisent des technologies d'imagerie sophistiquées, confirme le potentiel de ce test pour la détection des cas d'angle occlusif dans les populations à risque élevé. Toutefois, en raison des problèmes méthodologiques entre les études, il se peut que nos estimations de la précision des tests soient plus élevées que ce à quoi on pourra s’attendre dans la pratique clinique. Des études de haute qualité sont encore nécessaires pour évaluer la performance des tests non invasifs pour l'évaluation de la fermeture de l'angle dans le cadre de soins de santé communautaires et de soins de santé secondaires.
Résumé simplifié
Quelle est la précision des tests de dépistage pour identifier les personnes à risque de développer un glaucome primaire à angle fermé ?
Pourquoi est‐il important d'améliorer le diagnostic du glaucome primaire à angle fermé ?
Les glaucomes sont des maladies oculaires qui endommagent le nerf optique qui se trouve à l’arrière de l'œil. S'il n'est pas traité, le glaucome peut entraîner la cécité. Le glaucome primaire à angle fermé est un type de glaucome dans lequel la voie de drainage du liquide à l'intérieur de l'œil (appelée angle de drainage) est rétrécie ou bloquée, ce qui entraîne une augmentation de la pression oculaire et une perte du champ de vision. Le glaucome primaire à angle fermé représente 25 % de tous les cas de glaucome dans le monde et il est plus susceptible d'entraîner une perte de vision que la forme la plus courante, le glaucome primaire à angle ouvert.
Plusieurs tests non invasifs sont disponibles pour identifier les personnes à risque de développer un glaucome primaire à angle fermé dans un cadre de soins communautaires ou de soins cliniques non spécialisés. Les personnes dont le test est positif sont orientées vers des examens spécialisés plus poussés et un éventuel traitement. La non‐détection de cette affection (résultat faussement négatif) peut entraîner un risque accru de lésions progressives du nerf optique et de cécité. Une erreur de diagnostic (un résultat faussement positif) pourrait entraîner des investigations inutiles et coûteuses.
Quel est l’objectif de cette revue ?
L'objectif de cette revue était de de déterminer la précision des tests de dépistage non invasifs pour identifier les personnes à risque de développer un glaucome primaire à angle fermé.
Qu’étudie cette revue ?
Cinq tests non invasifs ont été étudiés. Il s’agissait soit de tests simples nécessitant une lampe stylo ou un équipement clinique largement répandu, le microscope à lampe à fente (éclairage oblique, profondeur de la chambre antérieure limbique (LACD)), soit d'équipements d'imagerie plus sophistiqués (tomographie par cohérence optique (OCT) du segment antérieur), photographie de Scheimpflug et mesure de profondeur de la chambre antérieure périphérique par balayage (SPAC)) qui peuvent scanner et mesurer les dimensions de l'angle de drainage.
Quels ont été les principaux résultats de cette revue ?
Cette revue inclut 47 études pertinentes, portant sur un total de 26 151 participants. Vingt‐sept études ont évalué l’OCT du segment antérieur, 17 études ont évalué le test LACD, neuf études, la photographie de Scheimpflug, six études, le test SPAC et cinq études ont évalué le test de l’éclairage oblique.
La performance diagnostique globale du test LACD était similaire à celle des technologies d'imagerie plus avancées, à savoir l’OCT du segment antérieur, la photographie de Scheimpflug et le test SPAC, tandis que le test de l’éclairage oblique a montré une performance inférieure. En prenant l'exemple du test LACD, si ce test était effectué sur 1000 personnes, dont 100 à risque de développer un glaucome primaire à angle fermé, nous estimons que 83 cas seraient correctement identifiés et que 17 cas ne seraient pas décelés (résultats faussement négatifs). Le test identifierait correctement 792 des 900 personnes ne présentant pas de risque de glaucome primaire à angle fermé et en classerait incorrectement 108 (12 %), qui seraient inutilement orientées vers un spécialiste (résultats faussement positifs).
Dans quelle mesure les résultats des études incluses dans cette revue sont‐ils fiables ?
La plupart des études étaient de faible qualité en raison du mode de recrutement des participants ou de la façon dont les tests étaient effectués. Cela a pu conduire à ce que les tests semblent plus précis que ce qu’ils n’étaient réellement. Nous ne pouvons donc pas être sûrs que les tests produiront toujours les résultats observés.
Quelles sont les implications de cette revue ?
Les études incluses dans cette revue ont été réalisées pour la plupart en Asie, où le glaucome primaire à angle fermé est le plus répandu. Les résultats ont montré que la mesure de la profondeur de la chambre antérieure, qui est un test simple et rapide pouvant être réalisé avec un minimum de formation, peut identifier les personnes à risque de glaucome primaire à angle fermé, ce qui permet un traitement précoce et adapté. Bien que ce test puisse potentiellement passer à côté d'environ une personne sur six présentant un risque de développer la maladie et conduire à la prise en charge inutile de 12 % d’entre elles, il pourrait être utile pour un dépistage ciblé dans les régions où la prévalence de la maladie est élevée.
Cette revue est‐elle à jour ?
Les données de cette revue sont à jour au 3 octobre 2019.
Authors' conclusions
Summary of findings
| Test (measure and/or threshold) | N. studies (N. with occludable angles/total analysed) | Accuracy estimates | False positives and false negatives at prevalence 10%: 100 participants with and 900 without occludable angles | False positives and false negatives at prevalence 30%: 300 participants with and 700 without occludable angles | Certainty of evidence for sensitivity and specificity | |||
|---|---|---|---|---|---|---|---|---|
| Sensitivity (95%CI) | Specificity (95%CI) | False positives (95% CI) | False negatives (95% CI) | False positives (95% CI) | False negatives (95% CI) | |||
| LACD (cut‐off: ≤25%) | 16 studies (1490/7540) | 0.83 (0.74 to 0.90) | 0.88 (0.84 to 0.92) | 108 (72 to 144) | 17 (10 to 26) | 51 (30 to 78) | 84 (56 to 112) | Moderatea |
| Oblique flashlight test (grade 1) | 5 studies (298/1188) | 0.51 (0.25 to 0.76) | 0.92 (0.70 to 0.98) | 72 (18 to 270) | 49 (24 to 46) | 56 (14 to 210) | 147 (75 to 228) | Lowb |
| SPAC (≤5 and/or S or P) | 4 studies (994/4677) | 0.83 (0.70 to 0.91) | 0.78 (0.70 to 0.83) | 207 (162 to 261) | 17 (10 to 26) | 161 (126 to 203) | 51 (30 to 78) | Moderatec |
| Scheimpflug photography (ACD central) | 9 studies (461/1698) | 0.92 (0.84 to 0.96) | 0.86 (0.76 to 0.93) | 126 (63 to 216) | 8 (4 to 16) | 98 (49 to 168) | 24 (12 to 48) | Moderated |
| AS‐OCT (subjective assessment) | 13 studies (1850/9239) | 0.85 (0.76 to 0.91) | 0.71 (0.62 to 0.78) | 270 (198 to 351) | 14 (8 to 24) | 210 (154 to 273) | 42 (24 to 72) | Moderatee |
| Certainty of evidence applies to both sensitivity and specificity. Explanations a Downgraded one level due to risk of bias: 75% of studies had a high risk of bias in one or more domains. Two studies (13%) used a case‐control design. Legend ACD: anterior chamber depth | ||||||||
Background
Clinical problem
Primary angle closure (PAC) is characterised by appositional or adhesional (synechial) narrowing (and eventually occlusion) of the drainage angle in the anterior chamber of the eye, resulting in elevated intraocular pressure (IOP) and subsequent glaucomatous optic neuropathy, a condition known as primary angle closure glaucoma (PACG). The occlusion of the drainage angle may occur rapidly or slowly. Rapid occlusion results in symptomatic IOP elevation that requires emergency medical treatment (known as acute angle closure). Individuals presenting with acute angle closure, characterised by eye pain, headache, corneal oedema and vascular congestion, are treated initially with topical and oral medications to lower the IOP. This is followed by laser peripheral iridotomy (LPI) as soon as possible after angle closure, usually with prophylactic treatment of the fellow eye (Emanuel 2014). An occlusion that develops insidiously results in chronically raised IOP, which is often asymptomatic. Management for chronic angle closure involves: medical therapy (topical hypotensives); LPI; filtration surgery or a combination of these to lower the IOP and open up the drainage angle. Although LPI remains the first‐line intervention for acute and chronic PAC, there is a growing evidence that clear lens extraction is associated with better clinical and patient‐reported outcomes than LPI and may therefore be a better first‐line treatment option (Azuara‐Blanco 2016; Tanner 2020).
The prevalence of PACG varies across ethnic groups; in European‐derived populations PACG has been estimated to be 0.40% of those aged 40 years and older, compared to 1.09% in Asian populations (Tham 2014). For those aged 70 years and older, the prevalence increases to 0.94% (Day 2012) and 2.32% (Cheng 2014), respectively. Although, globally, open‐angle glaucoma is more common (3%) (Tham 2014), PACG is more likely to result in bilateral blindness (Foster 2001; Quigley 1996; Quigley 2006; Resnikoff 2004).
A classification scheme for PAC designed for use in prevalence surveys and epidemiological research was published by Foster and colleagues (Foster 2002). This identifies three stages in the natural history of angle closure from initial irido‐trabecular contact (ITC) to anterior segment signs of disease (raised IOP, peripheral anterior synechiae (PAS), or both), culminating in glaucomatous optic neuropathy.
-
Primary angle closure suspect (PACS): an eye in which appositional contact between the peripheral iris and posterior trabecular meshwork is considered in two or more quadrants, in dark room conditions using static gonioscopy.
-
PAC: an eye with an occludable drainage angle and features indicating that trabecular obstruction by the peripheral iris has occurred, such as PAS, elevated IOP (> 21 mmHg), iris whorling (distortion of the radially orientated iris fibres), “glaucomfleken” lens opacities, or excessive pigment deposition on the trabecular surface. There is no evidence of glaucomatous optic neuropathy or associated glaucomatous field loss.
-
PACG: signs of PAC, as described above, and evidence of glaucomatous optic neuropathy.
There are various anatomical and demographic risk factors for PAC (Amerasinghe 2008; Lowe 1970). Anatomical risk factors include: a shallow anterior chamber depth (ACD), thickening of the crystalline lens, small corneal diameter and a short axial length (Nolan 2006; Wang 2019). The risk of PACG increases with age (Day 2012; Wang 2019), and the prevalence also varies with ethnicity, with higher rates occurring in Inuit and Asian populations (Clemmesen 1971; Drance 1973; Tham 2014).
The natural history of angle closure disease is not well documented due to the sparsity of long‐term observational data (Alsbirk 1992; Thomas 2003; Wilensky 1993; Yip 2008). A recent large randomised controlled trial, conduced in China (Zhongshan Angle‐closure Prophylaxis Study) (He 2019), carried out LPI in one randomly selected eye of participants with bilateral PACS, with the other eye acting as an untreated control. The primary outcome was incident primary angle closure disease as a composite endpoint of elevated IOP, PAS, or an acute angle‐closure episode during the 72‐month follow‐up period. The rate of developing any angle closure endpoint in this population was very low (less than 1% per year). Although eyes that underwent LPI showed a significant reduction in the risk of developing PAC or an acute attack, the authors concluded that prophylactic treatment is of limited benefit and was unlikely to be cost‐effective. However, in view of differences in the causative mechanism of angle closure between Europeans and East Asians (He 2006), the generalisability of these findings is unclear.
Target condition being diagnosed
For this review we used an occludable angle as the target condition indicative of an anatomical predisposition to angle closure as identified by gonioscopy (Weinreb 2006). In this review we defined an occludable angle as either:
-
an eye which has appositional contact between the peripheral iris and posterior trabecular meshwork in two or more quadrants (≥180°); or
-
an eye with, or at risk of, angle closure as judged by an experienced eye care professional using gonioscopy with or without indentation.
Conditions that are similar to the target condition include secondary angle closure glaucoma, such as aqueous misdirection, neovascular glaucoma and ciliary body swelling. The clinical features and management of conditions that cause secondary angle closure glaucoma have been reviewed by Parivadhini 2014 and were not investigated in this review.
Index test(s)
Targeted screening for PAC/PACG has established the effectiveness of measuring anterior chamber dimensions to identify occludable angles (Congdon 1996; Devereux 2000; Kurita 2009). A variety of non‐contact tests are available for the assessment of the ACD, anterior chamber angle (ACA), or both.
Oblique flashlight test
The flashlight test is an accessible method to detect a potentially occludable angle if no other equipment is available. The test can be carried out in a primary‐ or secondary‐care setting and involves shining a pen torch into the eye from the temporal limbus parallel to the iris to assess the ACD. Quantitative grading uses a four‐point scale, based on the proportion of the nasal iris that is in shadow (grade 4 = minimal or no shadow; grade 1 = nasal iris in complete shadow (Van Herick 1969; Vargas 1973;) grade 1 is associated with a high risk of angle closure. Alternatively, qualitative grading can be used to describe the amount of shadow falling on the iris as shallow, medium or deep, and is further described by He 2007.
Limbal anterior chamber depth assessment (van Herick technique)
The van Herick technique is used to assess the ACD at the limbus using a slit lamp biomicroscope (Van Herick 1969). The illumination system is set at 60° from the observation system. A focused vertical slit‐beam is positioned at the limbus and moved just onto the cornea until the beam separates into a corneal section and reflection of the beam onto the iris. An estimate of the thickness of the dark space between the beams (which corresponds to the limbal anterior chamber depth (LACD)) is recorded as a fraction (or percentage) of the corneal section thickness over the central portion of the beam. Van Herick 1969 originally described a four‐point grading scheme, which was extended to a seven‐point scale by Foster 2000, in an effort to improve the precision of the measurement. Van Herick 1969 considered that an eye with a LACD of grade 2 or less (≤ 25%) required gonioscopy and that a grade 1 angle was at a high risk of angle closure. Foster 2000 further subdivided grade 1 into 5% and 15% cut‐off values and also included a 0% grade, which was defined as iridocorneal contact for at least one clock hour within the observed quadrant. The augmented scale was associated with improved test accuracy.
Scanning peripheral anterior chamber depth analyser
Scanning peripheral anterior chamber depth analysis (SPAC) is an objective method for measuring the peripheral and central ACD by automatically taking 21 slit lamp images of the anterior chamber using a 1 mm‐wide slit at 0.4‐mm intervals from the optical axis towards the limbus (Kashiwagi 2006). These measurements are compared to a normative database and converted into a numerical scale ranging from 1 to 12, with 12 representing the deepest ACD. In addition, the instrument provides a categorical grading of the risk of angle closure, S (suspect angle closure), P (potential angle closure), or N (normal). The device has been shown to be reproducible and easy to operate (Kashiwagi 2004).
Scheimpflug photography
The Scheimpflug principle is used to correct perspective distortion in aerial photographs and has been adapted for ocular imaging. The Oculus Pentacam (Oculus, Wetzlar, Germany) device employs this principle using monochromatic blue light at a wavelength of 475 nm. By rotating the apparatus around the optical axis of the eye, a series of radially oriented images is generated in three dimensions around the 360° extent of the anterior segment. Between 12 and 50 real‐time sections from the anterior surface of the cornea to the posterior vertex of the lens are acquired within a two‐second acquisition frame. This generates a set of measurements that provide a detailed description of the biometric configuration of the anterior segment, which includes the ACA, ACD and the anterior chamber volume (ACV). When calculating the ACA, it should be noted that this is not a direct measurement of the ACA, but is extrapolated from the measurements taken by the Pentacam. . Currently there is no consensus on which parameter or cut‐off value to use in the determination of an occludable angle.
Anterior segment‐optical coherence tomography
Anterior segment‐optical coherence tomography (AS‐OCT) allows both qualitative and quantitative analysis of the angle. The technique is based on low‐coherence interferometry whereby the delay and intensity of light reflected from the ocular tissue structures is measured. There are currently several AS‐OCT devices available on the market; depending on the device, they use one of the following methods to obtain clinical data: time domain, spectral domain or the more recent swept source domain method. Spectral and swept source domain methods have a higher scan speed and resolution than time domain methods. A wavelength of 1310 nm is used to image the anterior segment and inbuilt software is used to quantitatively assess in detail angle parameters, which include: the trabeculo‐iris space area (TISA, measured at 500 microns and 750 microns), angle recess area (ARA) and angle opening distance (AOD) at 500 microns and 750 microns (Quek 2011). Qualitative interpretation has been typically defined by contact between the peripheral iris and any part of the angle wall anterior to the scleral spur. There is currently no consensus on which threshold values to use for any of the quantitative parameters mentioned to identify an occludable angle (Smith 2013).
Clinical pathway
A variety of non‐contact devices with varying degrees of sophistication have been developed to evaluate the risk of angle closure. The high prevalence of PAC and the burden of blindness attributable to PACG raises the possibility of using such techniques as triage tests in high‐risk populations who may not have access to eye care services (see Figure 1) (Nolan 2003; Nolan 2006). More commonly, non‐invasive assessment of the dimensions of the anterior chamber, including ACD, angle, or both are part of a standard ophthalmic examination in a primary/community or secondary care setting. If the index test is positive, such individuals are identified as being 'at risk' of PACG and are referred for further assessment, usually to a glaucoma sub‐specialist ophthalmologist. The ophthalmologist will carry out gonioscopy (the reference standard for qualitative and quantitative assessment of the ACA). If an occludable angle is diagnosed, additional tests are then performed to further diagnose the condition as PACS/PAC/PACG. Depending on the clinical presentation, the affected individual may be closely monitored or undergo prophylactic treatment with LPI or lens extraction, possibly in conjunction with IOP‐lowering eye drops.

Clinical Pathway
Role of index test(s)
The reference standard test to detect an occludable angle is gonioscopy; however, this is not routinely performed outside the specialist setting since it is invasive and requires a high level of skill, which may lead to missed diagnoses. Non‐contact tests are relatively quick and can be carried out by appropriately trained healthcare professionals or technicians as a triage test to identify people at risk of angle closure. A systematic review published in 2013 concluded that there was insufficient evidence for non‐contact tests to replace gonioscopy, as they do not provide sufficient information on the ACA anatomy (Smith 2013). It should be noted that in some cases, when gonioscopy fails to visualise the anterior chamber configuration and depth, typically in secondary causes of angle closure, AS‐OCT and Scheimpflug photography can be used to provide objective measurements (Kang 2013). In addition, these techniques can be used to supplement existing clinical documentation by providing objective measurements (Smith 2013).
Alternative test(s)
Tests that use contact methods, such as ultrasound biomicroscopy, have been reviewed by Smith 2013, and were not included in the current review.
Rationale
A systematic review published in 2013 evaluated whether anterior segment imaging (using ultrasound biomicroscopy, optical coherence tomography (OCT), Scheimpflug photography or SPAC aided the diagnosis of PAC (Smith 2013). This review included 79 studies and concluded that although anterior segment imaging provided useful information, none of the tests provided sufficient information about the anatomy of ACA to be considered a substitute for gonioscopy. However, no meta‐analysis of accuracy data was conducted. The current review updates and extends this review by considering the following non‐contact tests of anterior chamber assessment (flashlight test, slit‐lamp techniques for LACD assessment, AS‐OCT, Scheimpflug photography and SPAC).
Objectives
To determine the diagnostic accuracy of non‐contact tests for identifying people with an occludable anterior chamber angle of the eye.
Secondary objectives
-
To investigate the accuracy of each non‐contact test for detecting the most severe referable condition or PACG (versus PACS or PAC)
-
To explore potential causes of heterogeneity in diagnostic performance
Methods
Criteria for considering studies for this review
Types of studies
We included all prospective and retrospective cohort studies ('single‐gate' design) and case‐control studies ('two‐gate' design) that evaluated the accuracy of non‐contact tests for diagnosing occludable angles compared to a gonioscopic reference standard. We included studies comparing each method separately, and studies comparing more than one method, to the reference standard in the same population. This included studies in which participants received all the tests or were randomised to receive different tests. We included only studies that provided sufficient data to allow the calculation of sensitivity and specificity.
Non‐contact tests for the detection of occludable angles are mainly of interest in primary‐care settings as a triage test aiming to guide referrals to glaucoma specialists. The tests are also used in non‐specialist secondary care settings. Since the relative accuracy of these tests in these settings is not well known, we included studies investigating these tests in any setting, and planned to assess the effect of this on accuracy in subgroup analyses.
Participants
We included all participants who met the inclusion criteria for studies conducted in any setting, which evaluated any of the index tests against the reference standard. We considered data from both untested asymptomatic populations and other pre‐tested predominantly asymptomatic populations recruited in secondary care.
Index tests
We assessed non‐contact tests including: the oblique flashlight test, LACD using the van Herick technique, SPAC, Scheimpflug photography and AS‐OCT.
Target conditions
An occludable angle, as a referable condition that can include PACS, PAC or PACG, as described above, was the target condition of interest.
As a secondary objective, we also planned to extract data to investigate the accuracy of the test for detecting the most severe referable condition or PACG (versus PAC or PACS).
Reference standards
Gonioscopy was the reference standard for the diagnosis of an occludable angle. We included studies using any of the standard gonioscopic classification schemes and used the authors' definition of an occludable angle, based on the number of quadrants of ITC. When the information was available, we further classified an occludable angle into one of three subgroups PACS, PAC, PACG.
Gonioscopy
Gonioscopy is the acknowledged reference standard for the evaluation of eyes with or at risk of angle closure, and should be performed on both eyes in any individual with suspected angle closure. The technique should be performed under dark‐room conditions and used in the primary position to visualise angle structures, the presence of ITC, PAS, or both (Bhargava 1973). Dynamic assessment is helpful in distinguishing ITC from PAS using a four‐mirror lens, which is applied to the cornea creating pressure with the goniolens. The Shaffer grading system, which records the ACA width in four quadrants, from grade 0 (closed) to grade 4 (wide open), is the most widely adopted ACA classification scheme (Shaffer 1960). Angle morphology can be further described using the Scheie grading system (Scheie 1957). This scheme describes the angle according to the anatomical structures observed (grade IV: Schwalbe’s line not visible; grade III: Schwalbe’s line visible; grade II: anterior trabecular meshwork visible; grade I: visible scleral spur; and grade 0: ciliary body band visible). The Spaeth classification is the most detailed of the three grading systems that allows grading of the geometric angle, iris profile and level of iris insertion (Spaeth 1971).
Search methods for identification of studies
Electronic searches
The Cochrane Eyes and Vision Information Specialist searched the following electronic databases. We imposed no restrictions on language or year of publication.The date of the search was 3 October 2019.
-
Cochrane Central Register of Controlled Trials (CENTRAL) (which contains the Cochrane Eyes and Vision Trials Register) in the Cochrane Library (searched 3 October 2019) (Appendix 1).
-
Health Technology Assessment Database (HTAD) in the Cochrane Library (searched 3 October 2019) (Appendix 1).
-
MEDLINE Ovid (January 1946 to 3 October 2019) (Appendix 2).
-
Embase Ovid (January 1980 to 3 October 2019) (Appendix 3).
-
BIOSIS (January 1969 to 3 October 2019) (Appendix 4).
-
System for Information on Grey Literature in Europe (OpenGrey) (1995 to 3 October 2019) (Appendix 5).
-
Aggressive Research Intelligence Facility database (ARIF) (www.birmingham.ac.uk/research/activity/mds/projects/HaPS/PHEB/ARIF/index.aspx; searched 3 October 2019. ARIF database last updated June 2018) (Appendix 6).
-
ISRCTN registry (www.isrctn.com/editAdvancedSearch; searched 3 October 2019) (Appendix 7).
-
US National Institutes of Health Ongoing Trials Register ‐ ClinicalTrials.gov (www.clinicaltrials.gov; searched 3 October 2019) (Appendix 8).
-
World Health Organization International Clinical Trials Registry Platform (www.who.int/ictrp; searched 3 October 2019) (Appendix 9).
Searching other resources
We searched the references of included studies for information about further studies. We did not handsearch journals and conference proceedings.
Data collection and analysis
Selection of studies
Two review authors (AJ and IC) independently assessed the titles and abstracts of all studies identified by the electronic searches. We labelled each record at this stage as "definitely relevant", "possibly relevant" or "definitely not relevant". We excluded records labelled as "definitely not relevant" by both review authors. We retrieved full‐text reports of records labelled as "definitely relevant" or "possibly relevant" and the two review authors independently assessed whether these met the inclusion criteria. We resolved any disagreement when present at any stage through discussion. When necessary, we consulted a third review author or contacted the study investigators for more information to determine eligibility.
Data extraction and management
Two review authors (AJ and JL) independently extracted the following data, where possible, from the included studies: the number of true positives (TP), false positives (FP), true negatives (TN) and false negatives (FN) using 2 x 2 contingency tables. From the 2 X 2 tables we calculated sensitivity (the proportion of diseased people correctly diagnosed) and specificity (the proportion of non‐diseased people correctly diagnosed) with 95% confidence intervals (CIs).
One review author entered data into Review Manager 5 (RevMan 5) (Review Manager 2014) and a second review author verified the entered data. We resolved any disagreement when present at any stage through discussion. We contacted study investigators to provide missing information or to clarify data, and we allowed two weeks for a response. If we did not receive a response during this time, we proceeded to use the information available in the published reports. We summarised the characteristics of included studies in a 'Characteristics of included studies' table. The characteristics extracted from each study are shown in Appendix 10. See Appendix 11 for abbreviations.
Assessment of methodological quality
Two review authors (AJ and JL) independently assessed each included study for risk of bias using the QUADAS 2 tool to assess the susceptibility to bias of the included studies, based on guidance presented in Appendix 12 (Whiting 2011). We assessed each study and judged each bias criterion to be at 'high', 'low' or 'unclear' risk of bias (lack of information or uncertainty over the potential for bias). Concerns regarding applicability were rated as 'high', 'low' or 'unclear' concerns.
Statistical analysis and data synthesis
We extracted and analysed the data available at fixed thresholds for each index test, in order to ease the interpretability of our summary measures of accuracy. Our preferred thresholds were:
-
oblique flashlight test: grades 1 and 2;
-
LACD using the van Herick technique: grades 1 and 2 (≤ 25%);
-
SPAC: categorical grading of suspect angle closure or potential angle closure, as provided by the device.
As there is no current consensus regarding thresholds for Scheimpflug photography and AS‐OCT, we extracted these data, when available, from the included studies.
We generated estimates of sensitivity and specificity in forest plots for each index test and also plotted them in receiver operating characteristics (ROC) space in RevMan. When four or more studies provided data at fixed thresholds for each test, we fitted a bivariate model using the METANDI function in STATA to calculate pooled point estimates for sensitivity and specificity. For comparisons between index tests and between subgroups, we performed a likelihood ratio test comparing the model with and without the covariate and assumed that the variances for the random effects for the logit sensitivities and logit specificities were similar. For the investigation of heterogeneity we used the melogit command in STATA to fit models that included particular covariates.
Takwoingi 2013 has showed that direct comparisons conducted within each study are more reliable than indirect comparisons. When direct comparisons were available, we plotted data points and joined the two estimates (one for each test) from each study by a line to show the difference in accuracy between tests. If a sufficient number of such paired studies had been available, we planned to pool them in bivariate meta‐analyses and tested their relative accuracy with a covariate coding for each test using the methods described above.
Since occludable angles are often bilateral, this complication may result in unit of analysis issues. We included studies that evaluated only one eye of each participant or, in participants with two affected eyes, studies that randomly selected only one eye. We also included studies that included both eyes in our review, but we acknowledged the unit of analysis issue when formulating our conclusions (i.e. acknowledging the overestimate of the precision in accuracy).
Investigations of heterogeneity
We investigated any heterogeneity in sensitivity and specificity through visual inspection of forest plots and the degree to which individual study results lie close together on the summary ROC curve. For diagnostic tests with a sufficient number of eligible studies, we planned to formally explore heterogeneity using the following study‐level covariates:
-
study design (e.g. single‐gate and two‐gate designs);
-
diagnostic reference thresholds (gonioscopy grading (e.g. number of quadrants occluded));
-
characteristics of the study population (e.g. high versus low prevalence, ethnicity). The comparison of low versus high prevalence level was based on the study setting. Studies undertaken in secondary care included populations with a higher prevalence, whilst studies conduced in a primary care/community setting included participants with a low prevalence of the target condition.
Sensitivity analyses
We planned to perform a sensitivity analysis to assess the impact of risk of bias on test accuracy by repeating the analysis after removing studies at high risk of bias.
Results
Results of the search
The electronic searches yielded a total of 6719 records (Figure 2). After 2460 duplicate records were removed we screened the remaining 4259 records. We excluded 4094 records at the title and abstract stage and obtained full‐text reports of 165 references for further assessment. We excluded 108 reports of 108 studies (see Characteristics of excluded studies for reasons). We identified 57 reports of 47 studies (see Characteristics of included studies) that met the inclusion criteria, recruiting 26,151 participants and providing data from 23,440 participants for quantitative analysis. Nineteen of the included studies were cohort studies, 15 were cross‐sectional and 13 used a case‐control design. Most studies were conducted in Asia (36, 76.6%), followed by Europe (5, 10.6%), North America (3, 6.4%), South America (2, 4.3%) and Africa (1, 2.1%), and over half the studies (30 studies, 4950 participants) were conducted in a secondary care setting, with the remainder (17 studies, 21,201 participants) in a primary care or community setting. The sample size ranged from 24 to 2052 participants (median 200) with most studies enrolling one eye per person (34, 72.3%).

Study flow diagram.
Twenty‐seven studies assessed AS‐OCT (analysing 15,580 participants), 17 studies LACD (7385 participants), nine studies Scheimpflug photography (1616 participants), six studies SPAC (5239 participants) and five studies evaluated the flashlight (oblique handlight) test (998 participants). Thirty‐three of the studies evaluated a single index test and the remainder evaluated two or more tests on the same population. For the gonioscopic reference standard, 42 studies reported either the number of quadrants or degrees occluded. Thirty‐six (76.6%) studies (analysing 21,840 (93.2%) of participants) used a diagnostic definition 2 or more quadrants occluded, six studies used one or more quadrants occluded, three studies reported on occlusion of the nasal or temporal quadrant only, and one study used the clinicians subjective opinion of occludability. The gonioscopic reference criterion was not reported in one study.
Methodological quality of included studies
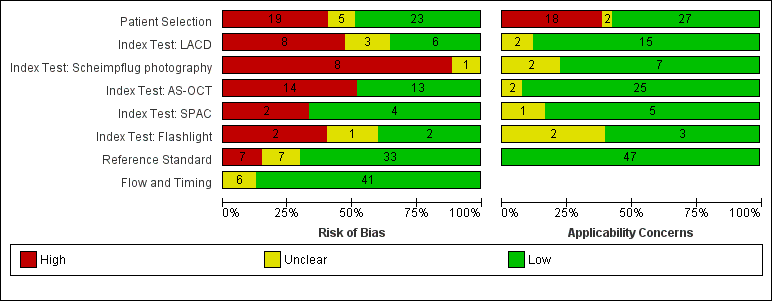
A summary of the methodological quality assessment is shown in the risk of bias and applicability graph and summary for each test (Figure 3 and Figure 4). Thirty‐six of the included studies (76.6%) were judged to have a high risk of bias in at least one domain.The risk of bias and applicability concerns are detailed below.

Risk of bias and applicability concerns graph: review authors' judgements about each domain presented as percentages across included studies

Risk of bias and applicability concerns summary: review authors' judgements about each domain for each included study
Patient Selection domain
Nineteen of the included studies (40.4%) were judged to have a high risk of patient selection bias. Thirteen studies adopted a case‐control design that recruited participants with the target condition (cases), and a group of control participants without the target condition. Six studies used inappropriate exclusions e.g. excluding eyes with PAS, high myopia, optic neuropathy, or used age restrictions. Five studies (10.6%) were categorised as having an unclear risk of bias due to poor reporting of recruitment strategy e.g. failure to report exclusion criteria or method of sampling,
The purpose of the index tests is to triage at‐risk populations or in opportunistic case‐detection to identify people at risk of angle closure. The inclusion of participants with a previous diagnosis of the target condition therefore raised applicability concerns, as the spectrum of participants in these studies was not representative of those who would receive the test in practice.
Index test domain
There was a high risk of bias in studies where index test thresholds were not pre‐defined. Optimal cut‐offs were determined post hoc in eight of the nine studies that evaluated Scheimpflug photography, approximately half for AS‐OCT (14 studies, 52%) and two of the six studies that evaluated SPAC. In the majority of studies, the index test was interpreted without knowledge of the results of the reference standard. However, for LACD, eight studies (47.1%) were judged at high risk of bias since either the same observer performed the index and reference test (6 studies) or the threshold was not pre‐defined (2 studies).
Applicability of the test was generally of low concern across all the index tests, as the tests and testing procedures were clearly described and executed by personal who were sufficiently trained.
Reference standard domain
For the reference standard domain, 33 studies (70.2%) were judged to be at a low risk of bias, seven studies (14.9%) were classified as high risk as gonioscopy was not masked to the index test result, and in seven studies (14.9%) masking was unclear. Concerns regarding applicability were not applicable for this review, since gonioscopy was used as the reference standard for the diagnosis of an occludable angle in all of the included studies.
Flow and Timing domain
For the flow and timing domain, the majority of studies (41, 87.2%) were classified as having a low risk of bias. In these studies, all participants receiving the index test were verified with the reference standard, the number of participants included in the study matched the number in the analysis and there was less than a three‐month interval between the execution of the index and reference tests. There were five studies (10.6%) where the time interval where the time interval between the index and reference test was not reported, and in one study it was unclear whether all participants were included in the analysis.
The overall number of participants/eyes excluded from all the studies due to gonioscopy was negligible (< 0.3%), for LACD, flashlight, SPAC and Scheimpflug photography it was small (0% to 1.9%). The number of eyes/participants excluded from final analysis using AS‐OCT was relatively high (13.9%), due to the non‐interpretation of the data owing to either the clinician or the internal software inability to identify the scleral spur.
Conflict of Interest
Conflict of interest was of high concern in 15 studies, of unclear concern in 10 studies, and of no concern in 22 studies. Conflicts of interest were reported for 13 studies that evaluated AS‐OCT (56.5%), where the authors described receiving financial support from the manufacturer and/or loan of the device. For SPAC, four studies (66%) involved the patent holder of the device who was also a co‐author.
Unit of analysis concerns
Thirteen studies analysed data from both eyes, however seven of these studies corrected for clustering of data (Congdon 1996; Foster 2000; Lavanya 2008; Narayanaswamy 2010; Nolan 2007; Li 2019; Rossi 2012).
Findings
Forty‐seven studies reported sensitivity and specificity values for one or more index tests. Table 1 presents the pooled diagnostic accuracy estimates for index test parameters with four or more studies providing data at fixed thresholds for each test.
| Test | No. of studies (Number of eyes analysed) | Se (95% CI) | Sp (95% CI) | P values for differences between [test] and LACD ≤ 25% | |
| Se | Sp | ||||
| LACD | |||||
| 25% or < 25% | 16 (7540) | 0.83 (0.74 to 0.90) | 0.88 (0.84 to 0.92) | Reference | |
| 15% | 5 (3345) | 0.61 (0.36 to 0.81) | 0.93 (0.83 to 0.97) | ||
| 5% | 4 (2920) | 0.42 (0.31 to 0.55) | 0.97 (0.96 to 0.98) | ||
| 0% | 4 (2920) | 0.08 (0.03 to 0.18) | 1.00 (0.99 to 1.00) | ||
| Flashlight | |||||
| Grade One | 5 (1188) | 0.51 (0.25 to 0.76) | 0.92 (0.70 to 0.98) | 0.0181 | 0.5508 |
| SPAC | |||||
| ≤ 5 and/or S or P | 4 (4677) | 0.83 (0.70 to 0.91) | 0.78 (0.70 to 0.83) | 0.9707 | 0.5947 |
| Scheimpflug photography | |||||
| ACD central | 9 (1698) | 0.92 (0.84 to 0.96) | 0.86 (0.76 to 0.93) | 0.0828 | 0.5325 |
| ACA | 6 (1330) | 0.79 (0.64 to 0.89) | 0.88 (0.68 to 0.96) | ||
| ACV | 6 (1474) | 0.87 (0.82 to 0.91) | 0.79 (0.70 to 0.86) | ||
| AS‐OCT | |||||
| Subjective | 13 (9239) | 0.85 (0.76 to 0.91) | 0.71 (0.62 to 0.78) | 0.6632 | 0.0003 |
| ACA | 4 (517) | 0.81 (0.72 to 0.88) | 0.91 (0.84 to 0.95) | ||
| ACD | 4 (530) | 0.89 (0.78 to 0.95) | 0.88 (0.75 to 0.95) | ||
| AOD 500 nasal | 4 (1976) | 0.95 (0.76 to 0.99) | 0.82 (0.72 to 0.89) | ||
| AOD 500 temp. | 4 (1976) | 0.94 (0.75 to 0.99) | 0.81 (0.73 to 0.87) | ||
| AOD 750 temp. | 4 (3758) | 0.93 (0.84 to 0.97) | 0.85 (0.77 to 0.90) | ||
| TISA 500 nasal | 4 (1976) | 0.79 (0.71 to 0.85) | 0.81 (0.73 to 0.86) | ||
| TISA 500 temp. | 4 (1976) | 0.84 (0.77 to 0.89) | 0.81 (0.61 to 0.92) | ||
For the comparison between index tests, we considered LACD < 25% as the reference category and used bivariate models to investigate whether sensitivity and/or specificity differs between the most commonly used test parameters for each index test.
Limbal anterior chamber depth (LACD)
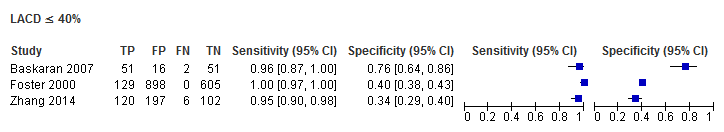
Seventeen studies (recruiting 7385 participants) assessed LACD, with nine studies evaluating a single threshold and the remainder providing data on two or more thresholds. With an increasing LACD cut‐off criterion (0%, ≤ 5%, ≤ 15%, ≤ 25%), there was an increase in sensitivity (0.08 to 0.83) with a corresponding reduction in specificity (1.00 to 0.88). (Table 1). The most commonly used threshold was ≤ 25% (used in 16 studies, 7011 participants (7540 eyes)), which produced pooled sensitivity and specificity estimates of 0.83 (95% CI 0.74 to 0.90) and 0.88 (95% CI 0.84 to 0.92), respectively Figure 5. The certainty of this evidence was moderate due to risk of bias concerns, since the same observer performed the index and the reference test in many studies (see summary of findings Table 1).

Summary ROC Plot of LACD with thresholds of 0%, ≤5%, ≤15%, ≤ 25% or <25%, ≤40%, >25% to ≤50%. Summary point estimate and confidence region shown for LACD ≤ 25%.
Flashlight Test
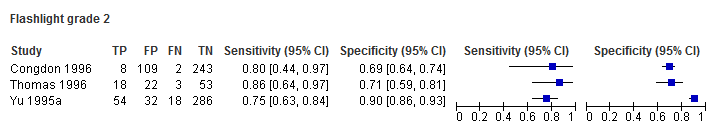
Five studies (998 participants) evaluated the flashlight test, three studies evaluated grades 1 and 2, and two studies evaluated only grade 1. Visual inspection of the forest plot at this threshold revealed significant heterogeneity with respect to sensitivity, which ranged from 0.20 to 0.89. A meta‐analysis was conducted for grade 1 (1188 eyes), including all studies, with an estimated pooled sensitivity of 0.51 (95% CI 0.25 to 0.76) and specificity of 0.92 (95% CI 0.70 to 0.98) (Figure 6). The certainty of this evidence was low due to heterogeneity in accuracy estimates among studies and a high risk of bias (summary of findings Table 1). There were insufficient studies to generate a summary estimate for grade 2.

Summary ROC Plot of the flashlight test with thresholds of grade 1 and grade 2. Summary point estimate and confidence region shown for flashlight grade 1.
SPAC
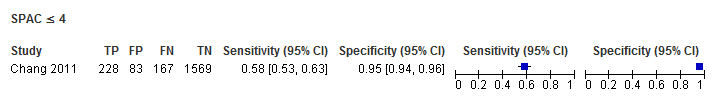
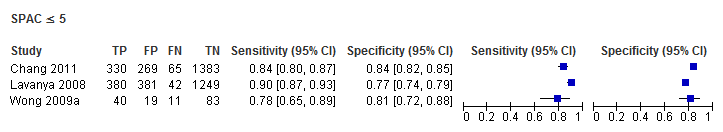
Six studies (5239 participants) examined SPAC, three studies reported both categorical and numerical grades, two studies presented only the numerical grading and one study described only categorical thresholds. Four studies used both categorical and numerical thresholds Figure 7. The most common numerical grading was a threshold of ≤ 5. For the meta‐analysis, this numerical grade was amalgamated with the combined S and P categorical grade (4 studies, 4677 eyes), to produce a summary estimate of diagnostic performance for ≤ 5 and/or S or P (sensitivity 0.83 (95% CI 0.70 to 0.91); specificity 0.78 (95% CI 0.70 to 0.83)). The certainty of this evidence was moderate (summary of findings Table 1).
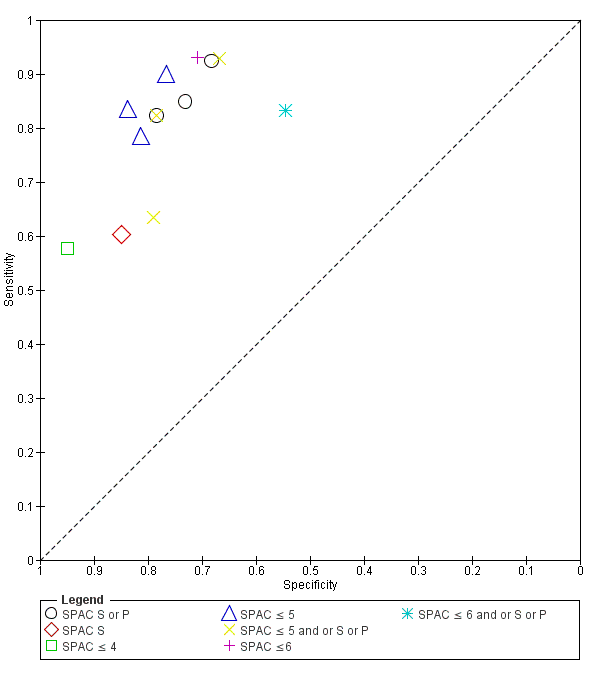
Summary ROC Plot of SPAC with thresholds of S or P, S, ≤ 4, ≤ 5, ≤ 5 and or S or P, ≤ 6, ≤ 6 and or S or P.
Scheimpflug photography
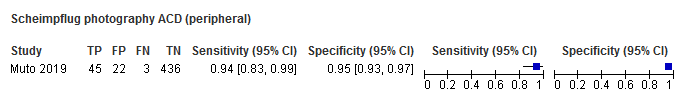
Nine studies (1616 participants) evaluated the diagnostic performance of Scheimpflug photography. Four studies reported all three anterior segment parameters (ACA, ACD and ACV), four studies evaluated two parameters and one study evaluated only ACD Figure 8. Point estimates of summary sensitivity varied between 0.79 and 0.92 across the parameters. Central ACD was the most commonly reported threshold (used in all nine studies, 1698 eyes), which produced a pooled sensitivity estimate of 0.92 (95% CI 0.84 to 0.96) and specificity 0.86 (95% CI 0.76 to 0.93). The certainty of this evidence was moderate due to the case‐control design used in over half of the studies (summary of findings Table 1).
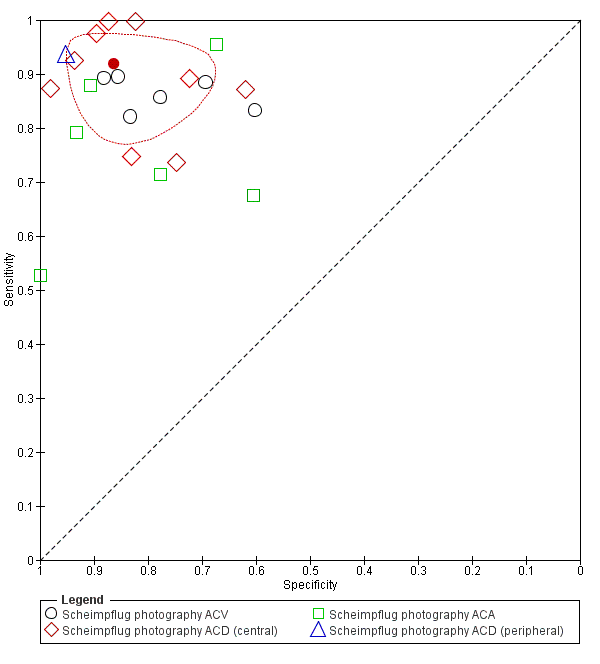
Summary ROC Plot of Scheimpflug photography with thresholds of ACV, ACD (central), ACA. and ACD (peripheral). Summary point estimate and confidence region shown for ACD (central).
Quantitative parameters reported unique cut‐off values that were derived from the data post‐hoc in eight of the nine studies.
Anterior segment optical coherence tomography (AS‐OCT)
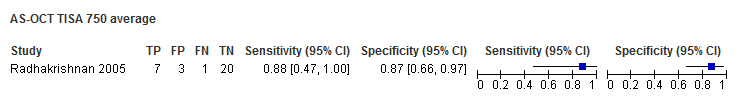
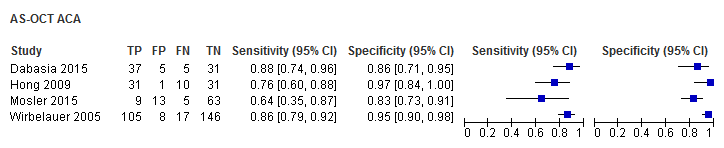
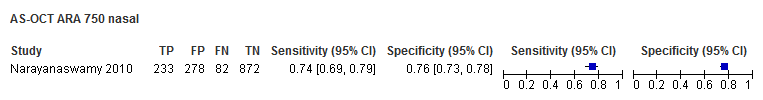
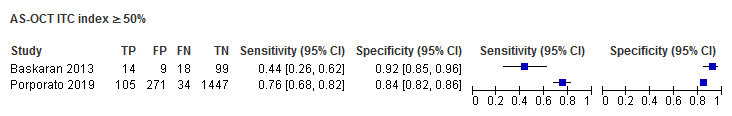
Twenty‐seven studies (15,580 participants) assessed AS‐OCT, 17 studies used the Visante time domain AS‐OCT; four studies used a slit lamp OCT; two studies spectral domain OCT with a lens adapter and four studies utilised swept source OCT. Thirteen unique AS‐OCT parameters were reported; using either quantitative or qualitative thresholds or both. Pooled point estimates of sensitivity and specificity could only be calculated for eight parameters (subjective opinion of occludability, AOD 500 (nasal), AOD 500 (temporal), AOD 750 (temporal), TISA 500 (nasal), TISA 500 (temporal), ACA, ACD) with pooled sensitivities ranging from 0.79 to 0.95 and specificities from 0.71 to 0.88 (Table 1). Subjective judgement of occludability was the most commonly used threshold (used in 13 studies (48.1%), 9,239 eyes), which produced a pooled sensitivity estimate of 0.85 (95% CI 0.76 to 0.91); specificity 0.71 (95% CI 0.62 to 0.78) (Figure 9). The certainly of this evidence was moderate (summary of findings Table 1).

Summary ROC Plot of AS‐OCT with thresholds of subjective judgement), AOD 500 temporal, AOD 500 nasal, AOD 750 temporal, TISA 500 temporal, TISA 500 nasal, TISA 750 temporal, TISA 750 nasal, ACA angle, ACA area, ACD, ACV, ARA 500 average, ARA 750 average, ARA 750 nasal and LV. Summary point estimate and confidence region shown for AS‐OCT (subjective judgement).
Quantitative parameters reported unique cut‐off values that were derived from the data post‐hoc, which could have led to an overestimation of test performance.
Comparison between tests
The most commonly reported parameter for each index test was compared using LACD (≤ 25%) as the reference category Table 1. Comparisons of sensitivity and specificity were not shown to differ across all the index tests, except for the flashlight test, where a grade 1 threshold had a statistically significant lower sensitivity than LACD, and AS‐OCT (subjective judgement), which had a statistically significant lower specificity.
Direct comparisons between tests in the same studies were available for LACD ≤ 25% versus AS‐OCT (subjective opinion of occludability) in three studies, Figure 10) and for LACD ≤ 25% versus Scheimpflug photography (central ACD) in two studies (Figure 11), with no clear pattern seen. LACD ≤ 25% seemed more accurate than flashlight (grade1) in two studies (Figure 12).

Summary ROC of tests: 4 Direct comparison: LACD ≤ 25% or <25%, 20 Direct comparison: AS‐OCT (subjective judgement).

Summary ROC Plot of tests: 4 Direct comparison: LACD ≤ 25% or < 25%, 17 Direct comparison: Scheimpflug photography ACD (central).

Summary ROC Plot of tests: 4 Direct comparison: LACD ≤ 25% or < 25%, 7 Direct comparison: Flashlight grade 1.
Investigation of heterogeneity and subgroup analysis
Among pre‐planned study level covariates, we investigated the effect of the setting by comparing accuracy in 16 studies reporting LACD at a common threshold (≤ 25%) conducted in a primary care/ community setting (seven studies, mean prevalence 14.4%) with that in studies conducted in secondary care (seven studies, mean prevalence 42%) and in case‐control studies (two studies, 520 participants, mean prevalence 79.2%). Case‐control studies were analysed in a different category since prevalence is determined by study design. The sensitivity and specificity were 0.90 (95% CI: 0.75 to 0.97) and 0.82 (95%CI: 0.66 to 0.91) for primary care/community studies, 0.82 (95%CI: 0.67 to 0.91) and 0.91 (95% CI: 0.85 to 0.94) in secondary care studies, and 0.89 (95% CI: 0.64 to 0.97) and 0.86 (95% CI: 0.78 to 0.91) in case‐control studies. We found no evidence of a statistically significant difference in test performance according to setting.
There were insufficient studies to conduct the effect of other pre‐specified covariates including gonioscopic diagnostic reference thresholds. We also planned to perform a sensitivity analysis to assess the impact of risk of bias on test accuracy by repeating the analysis after removing studies at high risk of bias, however nearly all the studies were judged to have at least one domain that was labelled as high/unclear risk of bias or had applicability concern.
Discussion
This systematic review evaluated the diagnostic accuracy of non‐contact tests including: LACD (van Herick test), flashlight, SPAC, Scheimpflug photography and AS‐OCT for detecting individuals at risk of PACG. These tests were evaluated as stand‐alone triage methods that could be used by specialist or non‐specialist healthcare professionals in a primary care or secondary care setting for case‐detection. In the proposed clinical pathway, screen positive cases would be referred for gonioscopic assessment by a glaucoma specialist.
Summary of main results
We analysed data from a total of 23,440 participants in 47 studies reporting the diagnostic accuracy of one or more index tests for the detection of an occludable angle.
The LACD test (van Herick test) was investigated in 17 studies. This test is quick, relatively inexpensive and can be used by non‐glaucoma specialists with a minimal amount of training, Using a cut‐off 25% or less, our pooled estimates found that at 10% prevalence as in a community setting, 17 out of 100 people at risk of angle closure would be missed and not sent to ophthalmic assessment and would potentially be exposed to acute or chronic angle‐closure glaucoma and 108 out of 900 people who are not at risk would be sent to ophthalmic assessment unnecessarily, increasing costs with little or no benefit. These estimates of accuracy, although they are sub‐optimal, can still be suitable for case‐detection in areas where most people do not receive basic ophthalmic care, There were only two case‐control studies in the main analysis on LACD and the certainty of the evidence was moderate, meaning that we are relatively confident in our estimates. A subgroup analysis comparing community (low prevalence) studies versus secondary care (high prevalence) settings found no evidence of a statistically significant difference in diagnostic performance according to setting.
Fifty‐seven per cent of included studies evaluated AS‐OCT. This technology has a number of theoretical advantages, including the rapid and non‐invasive acquisition of high‐resolution images of the complete 360 degrees of the ACA. These images can be interpreted qualitatively or quantitatively. Although the included studies provided data on 13 separate AS‐OCT parameters, the lack of consistency in the thresholds used meant that summary estimates could only be calculated for a minority of parameters (n = 8). The largest number of studies used subjective AS‐OCT assessment of angle width (n = 13) and yielded a similar sensitivity to LACD but a statistically significant lower specificity. This evidence was moderate‐certainty. Only four studies each used objective AS‐OCT test measures and ACD and AOD 500 obtained good sensitivity and specificity. However, given the small number of studies available for each measure, we conclude that more research is needed on AS‐OCT both in community and secondary care settings. This is particularly important as OCT technology continues to develop with ongoing improvements in image resolution. It is likely that the superior resolution of newer devices e.g. swept‐source OCT, may overcome the current problem of scleral spur visualisation, which is an important anatomical landmark for ACA evaluation. Furthermore, machine learning has recently shown potential for automated detection of angle‐closure in AS‐OCT images (Fu 2019).
Scheimpflug photography, which requires a costly device that is rarely used for anterior chamber angle assessment was evaluated in nine studies. The best performing parameter was ACD (central), which had similar sensitivity and specificity estimates to LACD (moderate‐certainty evidence).
Other tests, including the oblique flashlight test and SPAC, were investigated in only five studies each and showed either a low sensitivity or unacceptable specificity, with low‐ and moderate‐certainty evidence, respectively.
Although no firm conclusions can be drawn from indirect comparisons of diagnostic tests, we find no evidence of statistically significant differences between LACD and other objective tests that use costly devices. However, based on this analysis, the flashlight test showed a statistically significant lower sensitivity than LACD. This was also shown in the small number of studies that compared the tests directly.
The majority of studies were conducted in Asia. Pre‐specified thresholds were reported for LACD, flashlight, SPAC and the subjective judgement of occludability using AS‐OCT. However, all the reported thresholds for eight out of the nine studies for Scheimpflug photography and all quantitative AS‐OCT thresholds were calculated post‐hoc and were based on the best performing cut‐points derived from each study population. The heterogeneity of sensitivity and specificity estimates for each test was large and could not be adequately explained. Furthermore, 36 of the 47 included studies (76.6%) were judged to have a high risk of bias in at least one domain, most commonly due to patient selection bias and/or not pre‐defining the index test threshold. However, 38% of included studies recruited participants with a previous diagnosis of an occludable angle, which was mainly attributed to the use of a case‐control design. These designs are known to over‐estimate the performance of diagnostic tests and therefore our estimates of test accuracy could be higher than would be expected in unscreened populations. It is therefore possible that the reported estimates of test performance may differ from what may be expected in a standard clinical setting.
Strengths and weaknesses of the review
Strengths of this systematic review included its methodological rigour, which included the following.
-
A comprehensive search strategy to identify as many potential studies for inclusion as possible, with no language, clinical setting, study design or publication year restrictions
-
All titles and abstracts were independently screened by two review authors
-
Two review authors independently extracted data and conducted a quality assessment of studies (using QUADAS‐2).
-
We obtained translations of two non‐English studies that met the inclusion criteria and undertook data extraction and conducted 'Risk of bias' assessments
-
Sufficient studies were available to conduct a meta‐analysis and produce summary estimates of sensitivity and specificity for all five index tests
There were a number of limitations of the review. Comparisons between index tests are best conducted using direct (within study) comparisons, as direct comparisons are considered to be more reliable than indirect comparisons (between studies) (Takwoingi 2013). Since there were insufficient studies that reported more than one test or parameter, comparisons of test accuracy were mostly based on indirect comparisons and therefore subject to between‐study differences in characteristics of participants, diagnostic standards and study design. The majority of studies had a high or unclear risk of bias in at least one domain and substantial heterogeneity was observed between studies. This should be taken into consideration when interpreting the review findings. Finally, there were insufficient studies to compare test performance in populations of different ethnicity or angle closure disease severity, in addition we were unable to conduct the planned sensitivity analysis on the risk of bias, as this may have impacted the applicability of such tests.
Applicability of findings to the review question
Given that the tests could be applied in either primary or secondary care, we did not place any restriction on setting, although in both pathways consecutive undiagnosed participants would be evaluated or triaged. Several included studies recruited participants with a previous diagnosis of an occludable angle, which was mainly attributed to the use of a case‐control design, which may not only overestimate accuracy, but also cause concerns regarding applicability.
Although proportionately more studies were conducted in a secondary care setting and participants were typically recruited from specialist or general ophthalmology clinics, over 80% of participants included in the quantitative analysis were recruited from a primary care or community setting. Participants in these studies included those recruited in large cross‐sectional epidemiological studies, or from community polyclinics that provide primary care services to local populations. In the context of angle closure, patients with suspected occludable angles in such settings would be referred to secondary care for specialist evaluation.
Three‐quarters of the included studies were performed in Asia, which carries the greatest burden of PACG and its associated blindness (Tham 2014). The prevalence of PACG in Asian populations is up to three times higher than in European‐derived groups (Cheng 2014; Day 2012). Consequently, case‐detection of angle closure disease in these populations is more likely to be cost‐effective (Tang 2019).
Non‐contact tests for identifying occludable angles include both subjective (flashlight, LACD) and objective tests (SPAC and Scheimpflug photography). AS‐OCT imaging can be interpreted subjectively or objectively. Subjective tests in the included studies were generally interpreted by ophthalmologists, which could have potentially led to an improved test performance. However, previous studies evaluating LACD have found no difference in performance within and between ophthalmologists and non‐medical healthcare professionals, with moderate inter‐observer agreement for each group (Jindal 2015; Johnson 2018). Similarly, a small study assessing AS‐OCT qualitative judgements by glaucoma specialists also found moderate agreement (Tay 2015).
Angle closure disease represents a spectrum of disorders from angle closure suspect to PACG. Angle closure is defined by the degree of appositional contact between the peripheral iris and trabecular meshwork and the presence or absence of trabecular damage (PAS). Although all studies used gonioscopy as the reference standard, a variety of diagnostic definitions were used. The review allowed for this flexibility in clinical definition and accepted the classification of an occludable angle adopted by the investigators. The term 'occludable angle' could encompass varying degrees of risk of angle closure, clinically it is most important to ascertain whether the angle is potentially occludable and therefore at risk of developing glaucomatous optic neuropathy. The widely accepted classification of occludability is that proposed by the International Society for Geographical and Epidemiological Ophthalmology ISGEO group (Foster 2002) (two more quadrants occluded). Thirty‐six (76.6%) of the included studies (recruiting 24,347 (93.1%) of participants) used a diagnostic definition two or more quadrants occluded, one study used a sub‐specialist ophthalmologist opinion that the angle was occludable and nine studies used a threshold of one or less quadrants occluded. We therefore feel that the majority of angles included represented a referable condition and would be classified as at risk of occludability.

Clinical Pathway

Study flow diagram.
Risk of bias and applicability concerns graph: review authors' judgements about each domain presented as percentages across included studies

Risk of bias and applicability concerns summary: review authors' judgements about each domain for each included study

Summary ROC Plot of LACD with thresholds of 0%, ≤5%, ≤15%, ≤ 25% or <25%, ≤40%, >25% to ≤50%. Summary point estimate and confidence region shown for LACD ≤ 25%.

Summary ROC Plot of the flashlight test with thresholds of grade 1 and grade 2. Summary point estimate and confidence region shown for flashlight grade 1.

Summary ROC Plot of SPAC with thresholds of S or P, S, ≤ 4, ≤ 5, ≤ 5 and or S or P, ≤ 6, ≤ 6 and or S or P.

Summary ROC Plot of Scheimpflug photography with thresholds of ACV, ACD (central), ACA. and ACD (peripheral). Summary point estimate and confidence region shown for ACD (central).

Summary ROC Plot of AS‐OCT with thresholds of subjective judgement), AOD 500 temporal, AOD 500 nasal, AOD 750 temporal, TISA 500 temporal, TISA 500 nasal, TISA 750 temporal, TISA 750 nasal, ACA angle, ACA area, ACD, ACV, ARA 500 average, ARA 750 average, ARA 750 nasal and LV. Summary point estimate and confidence region shown for AS‐OCT (subjective judgement).

Summary ROC of tests: 4 Direct comparison: LACD ≤ 25% or <25%, 20 Direct comparison: AS‐OCT (subjective judgement).

Summary ROC Plot of tests: 4 Direct comparison: LACD ≤ 25% or < 25%, 17 Direct comparison: Scheimpflug photography ACD (central).

Summary ROC Plot of tests: 4 Direct comparison: LACD ≤ 25% or < 25%, 7 Direct comparison: Flashlight grade 1.


LACD ≤ 25% or <25%

LACD > 25% to ≤ 50%

Flashlight grade 1
Flashlight grade 2


SPAC ≤ 5 and or S or P


SPAC ≤ 6 and or S or P

Scheimpflug photography ACV

Scheimpflug photography ACD (central)

Scheimpflug photography ACA
Scheimpflug photography ACD (peripheral)

AS‐OCT (subjective judgement)

AS‐OCT AOD 500 temporal
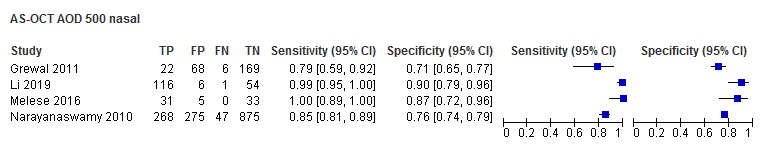
AS‐OCT AOD 500 nasal
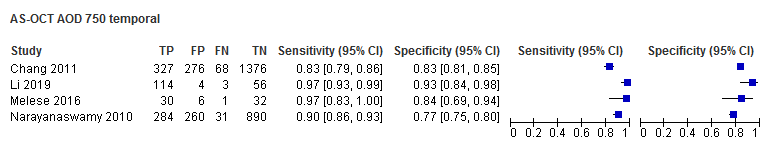
AS‐OCT AOD 750 temporal

AS‐OCT AOD 750 nasal
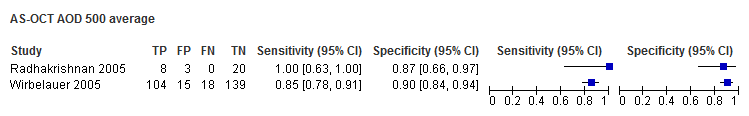
AS‐OCT AOD 500 average

AS‐OCT TISA 500 temporal

AS‐OCT TISA 500 nasal
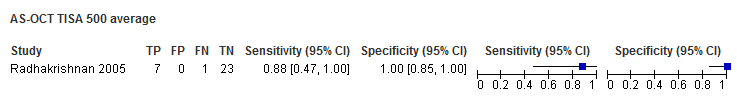
AS‐OCT TISA 500 average

AS‐OCT TISA 750 temporal

AS‐OCT TISA 750 nasal
AS‐OCT TISA 750 average


AS‐OCT ARA 500 average
AS‐OCT ARA 750 nasal

AS‐OCT ARA750 temporal

AS‐OCT ARA 750 average

AS‐OCT ITC index ≥35%
AS‐OCT ITC index ≥50%

AS‐OCT ITC index ≥70%

AS‐OCT ITC index ≥75%

| Test (measure and/or threshold) | N. studies (N. with occludable angles/total analysed) | Accuracy estimates | False positives and false negatives at prevalence 10%: 100 participants with and 900 without occludable angles | False positives and false negatives at prevalence 30%: 300 participants with and 700 without occludable angles | Certainty of evidence for sensitivity and specificity | |||
|---|---|---|---|---|---|---|---|---|
| Sensitivity (95%CI) | Specificity (95%CI) | False positives (95% CI) | False negatives (95% CI) | False positives (95% CI) | False negatives (95% CI) | |||
| LACD (cut‐off: ≤25%) | 16 studies (1490/7540) | 0.83 (0.74 to 0.90) | 0.88 (0.84 to 0.92) | 108 (72 to 144) | 17 (10 to 26) | 51 (30 to 78) | 84 (56 to 112) | Moderatea |
| Oblique flashlight test (grade 1) | 5 studies (298/1188) | 0.51 (0.25 to 0.76) | 0.92 (0.70 to 0.98) | 72 (18 to 270) | 49 (24 to 46) | 56 (14 to 210) | 147 (75 to 228) | Lowb |
| SPAC (≤5 and/or S or P) | 4 studies (994/4677) | 0.83 (0.70 to 0.91) | 0.78 (0.70 to 0.83) | 207 (162 to 261) | 17 (10 to 26) | 161 (126 to 203) | 51 (30 to 78) | Moderatec |
| Scheimpflug photography (ACD central) | 9 studies (461/1698) | 0.92 (0.84 to 0.96) | 0.86 (0.76 to 0.93) | 126 (63 to 216) | 8 (4 to 16) | 98 (49 to 168) | 24 (12 to 48) | Moderated |
| AS‐OCT (subjective assessment) | 13 studies (1850/9239) | 0.85 (0.76 to 0.91) | 0.71 (0.62 to 0.78) | 270 (198 to 351) | 14 (8 to 24) | 210 (154 to 273) | 42 (24 to 72) | Moderatee |
| Certainty of evidence applies to both sensitivity and specificity. Explanations a Downgraded one level due to risk of bias: 75% of studies had a high risk of bias in one or more domains. Two studies (13%) used a case‐control design. Legend ACD: anterior chamber depth | ||||||||
| Test | No. of studies (Number of eyes analysed) | Se (95% CI) | Sp (95% CI) | P values for differences between [test] and LACD ≤ 25% | |
| Se | Sp | ||||
| LACD | |||||
| 25% or < 25% | 16 (7540) | 0.83 (0.74 to 0.90) | 0.88 (0.84 to 0.92) | Reference | |
| 15% | 5 (3345) | 0.61 (0.36 to 0.81) | 0.93 (0.83 to 0.97) | ||
| 5% | 4 (2920) | 0.42 (0.31 to 0.55) | 0.97 (0.96 to 0.98) | ||
| 0% | 4 (2920) | 0.08 (0.03 to 0.18) | 1.00 (0.99 to 1.00) | ||
| Flashlight | |||||
| Grade One | 5 (1188) | 0.51 (0.25 to 0.76) | 0.92 (0.70 to 0.98) | 0.0181 | 0.5508 |
| SPAC | |||||
| ≤ 5 and/or S or P | 4 (4677) | 0.83 (0.70 to 0.91) | 0.78 (0.70 to 0.83) | 0.9707 | 0.5947 |
| Scheimpflug photography | |||||
| ACD central | 9 (1698) | 0.92 (0.84 to 0.96) | 0.86 (0.76 to 0.93) | 0.0828 | 0.5325 |
| ACA | 6 (1330) | 0.79 (0.64 to 0.89) | 0.88 (0.68 to 0.96) | ||
| ACV | 6 (1474) | 0.87 (0.82 to 0.91) | 0.79 (0.70 to 0.86) | ||
| AS‐OCT | |||||
| Subjective | 13 (9239) | 0.85 (0.76 to 0.91) | 0.71 (0.62 to 0.78) | 0.6632 | 0.0003 |
| ACA | 4 (517) | 0.81 (0.72 to 0.88) | 0.91 (0.84 to 0.95) | ||
| ACD | 4 (530) | 0.89 (0.78 to 0.95) | 0.88 (0.75 to 0.95) | ||
| AOD 500 nasal | 4 (1976) | 0.95 (0.76 to 0.99) | 0.82 (0.72 to 0.89) | ||
| AOD 500 temp. | 4 (1976) | 0.94 (0.75 to 0.99) | 0.81 (0.73 to 0.87) | ||
| AOD 750 temp. | 4 (3758) | 0.93 (0.84 to 0.97) | 0.85 (0.77 to 0.90) | ||
| TISA 500 nasal | 4 (1976) | 0.79 (0.71 to 0.85) | 0.81 (0.73 to 0.86) | ||
| TISA 500 temp. | 4 (1976) | 0.84 (0.77 to 0.89) | 0.81 (0.61 to 0.92) | ||
| For the comparison between index tests, we considered LACD < 25% as the reference category and used bivariate models to investigate whether sensitivity and/or specificity differs between the most commonly used test parameters for each index test. | |||||
| Test | No. of studies | No. of participants |
| 1 LACD 0% Show forest plot | 4 | 2920 |
| 2 LACD ≤ 5% Show forest plot | 4 | 2920 |
| 3 LACD ≤ 15% Show forest plot | 5 | 3345 |
| 4 LACD ≤ 25% or <25% Show forest plot | 16 | 7540 |
| 5 LACD ≤ 40% Show forest plot | 3 | 2177 |
| 6 LACD > 25% to ≤ 50% Show forest plot | 3 | 988 |
| 7 Flashlight grade 1 Show forest plot | 5 | 1188 |
| 8 Flashlight grade 2 Show forest plot | 3 | 848 |
| 9 SPAC S or P Show forest plot | 3 | 2325 |
| 10 SPAC S Show forest plot | 1 | 120 |
| 11 SPAC ≤ 4 Show forest plot | 1 | 2047 |
| 12 SPAC ≤ 5 Show forest plot | 3 | 4252 |
| 13 SPAC ≤ 5 and or S or P Show forest plot | 3 | 2630 |
| 14 SPAC ≤6 Show forest plot | 1 | 442 |
| 15 SPAC ≤ 6 and or S or P Show forest plot | 1 | 425 |
| 16 Scheimpflug photography ACV Show forest plot | 6 | 1474 |
| 17 Scheimpflug photography ACD (central) Show forest plot | 9 | 1698 |
| 18 Scheimpflug photography ACA Show forest plot | 6 | 1330 |
| 19 Scheimpflug photography ACD (peripheral) Show forest plot | 1 | 506 |
| 20 AS‐OCT (subjective judgement) Show forest plot | 13 | 9239 |
| 21 AS‐OCT AOD 500 temporal Show forest plot | 4 | 1976 |
| 22 AS‐OCT AOD 500 nasal Show forest plot | 4 | 1976 |
| 23 AS‐OCT AOD 750 temporal Show forest plot | 4 | 3758 |
| 24 AS‐OCT AOD 750 nasal Show forest plot | 3 | 1711 |
| 25 AS‐OCT AOD 500 average Show forest plot | 2 | 307 |
| 26 AS‐OCT TISA 500 temporal Show forest plot | 4 | 1976 |
| 27 AS‐OCT TISA 500 nasal Show forest plot | 4 | 1976 |
| 28 AS‐OCT TISA 500 average Show forest plot | 1 | 31 |
| 29 AS‐OCT TISA 750 temporal Show forest plot | 3 | 1711 |
| 30 AS‐OCT TISA 750 nasal Show forest plot | 3 | 1711 |
| 31 AS‐OCT TISA 750 average Show forest plot | 1 | 31 |
| 32 AS‐OCT ACA Show forest plot | 4 | 517 |
| 33 AS‐OCT ACA area Show forest plot | 2 | 3702 |
| 34 AS‐OCT ACD Show forest plot | 4 | 530 |
| 35 AS‐OCT ACV Show forest plot | 3 | 3879 |
| 36 AS‐OCT ARA 500 average Show forest plot | 1 | 31 |
| 37 AS‐OCT ARA 750 nasal Show forest plot | 1 | 1465 |
| 38 AS‐OCT ARA750 temporal Show forest plot | 1 | 1465 |
| 39 AS‐OCT ARA 750 average Show forest plot | 1 | 31 |
| 40 AS‐OCT ITC index ≥35% Show forest plot | 2 | 1997 |
| 41 AS‐OCT ITC index ≥50% Show forest plot | 2 | 1997 |
| 42 AS‐OCT ITC index ≥70% Show forest plot | 1 | 140 |
| 43 AS‐OCT ITC index ≥75% Show forest plot | 1 | 1857 |
| 44 AS‐OCT LV Show forest plot | 3 | 2260 |