Uso de TEP con flutemetamol F 18 para el diagnóstico temprano de la demencia de la enfermedad de Alzheimer y otras demencias en pacientes con deterioro cognitivo leve (DCL)
Resumen
Antecedentes
La absorción del 18F‐flutamol por el tejido cerebral, medida por la tomografía por emisión de positrones (PET), es aceptada por organismos reguladores como la Administración de Alimentos y Medicamentos (FDA) y las Agencias Europeas de Medicamentos (EMA) para evaluar la carga amiloide en personas con demencia. Su valor agregado se demuestra principalmente al excluir la patología de Alzheimer en un diagnóstico establecido de demencia. Sin embargo, el National Institute on Aging y la Alzheimer's Association (NIA‐AA) revisaron los criterios diagnósticos de la enfermedad de Alzheimer, y la confianza en el diagnóstico del deterioro cognitivo leve (DCL) debido a la enfermedad de Alzheimer puede aumentar al usar algunas pruebas de marcadores biológicos de amiloide como el flutemetamol F18. Estas pruebas, agregadas a los criterios clínicos centrales del DCL, podrían aumentar la exactitud de la prueba diagnóstica (EPD) de una estrategia de evaluación. Sin embargo, todavía no se ha evaluado sistemáticamente la EPD del flutemetamol F18 para predecir la evolución del DCL a la demencia de la enfermedad de Alzheimer (DEA) u otras demencias.
Objetivos
Determinar la EPD de la TEP con flutemetamol F18 para detectar a pacientes con DCL en el momento de realizar la prueba que progresarán clínicamente a DEA, otras formas de demencia (no DEA) o cualquier forma de demencia en el seguimiento.
Métodos de búsqueda
La búsqueda más reciente para esta revisión se realizó en mayo 2017. Se hicieron búsquedas en MEDLINE (OvidSP), Embase (OvidSP), PsycINFO (OvidSP), BIOSIS Citation Index (Thomson Reuters Web of Science), Web of Science Core Collection, incluyendo el Science Citation Index (Thomson Reuters Web of Science), en el Conference Proceedings Citation Index (Thomson Reuters Web of Science), LILACS (BIREME), CINAHL (EBSCOhost), ClinicalTrials.gov (https://clinicaltrials.gov) y en la World Health Organization International Clinical Trials Registry Platform (WHO ICTRP) (http://www.who.int/ictrp/search/en/). Se hicieron búsquedas en ALOIS, en el registro especializado de estudios de demencia del Grupo Cochrane de Demencia y Trastornos Cognitivos (http://www.medicine.ox.ac.uk/alois/). Se verificaron las listas de referencias de cualquier estudio y revisión sistemática relevante, y se realizó el seguimiento de citas usando el Science Citation Index para identificar cualquier estudio relevante adicional. No se aplicaron restricciones de idioma o de fecha a las búsquedas electrónicas.
Criterios de selección
Se incluyeron estudios que habían definido de manera prospectiva a las cohortes con cualquier definición aceptada de DCL en el momento de realizar la prueba y el uso del flutemetamol F18 para evaluar la EPD de la evolución de DCL a DEA u otras formas de demencia. Además, sólo se seleccionaron los estudios que aplicaron un estándar de referencia para el diagnóstico de la demencia del Alzheimer, p.ej., el National Institute of Neurological and Communicative Disorders and Stroke and the Alzheimer’s Disease and Related Disorders Association (NINCDS‐ADRDA) o los criterios del Manual Diagnóstico y Estadístico de Trastornos Mentales IV (DSM‐IV).
Obtención y análisis de los datos
Se seleccionaron todos los títulos y los resúmenes identificados en las búsquedas electrónicas en las bases de datos. Dos autores de la revisión, de forma independiente, seleccionaron los estudios para la inclusión y extrajeron los datos para crear tablas de dos por dos, mostrando los resultados de la prueba binaria clasificados de forma cruzada con el estándar de referencia binaria. Estos datos se utilizaron para calcular la sensibilidad, la especificidad y los intervalos de confianza del 95%. Dos asesores independientes realizaron la evaluación de la calidad mediante la herramienta QUADAS‐2 más algunos ítems adicionales para evaluar la calidad metodológica de los estudios incluidos.
Resultados principales
La evolución del DCL a DEA se evaluó en 243 participantes de dos estudios. Los estudios informaron datos sobre 19 participantes con dos años de seguimiento y sobre 224 participantes con tres años de seguimiento. Nueve participantes (47,4%) evolucionaron a DEA a los dos años de seguimiento y 81 (36,2%) a los tres años de seguimiento.
Había inquietudes con respecto al muestreo y a la selección de los participantes en ambos estudios. El dominio de la prueba índice en un estudio se consideró poco claro, y en el segundo estudio se consideró en bajo riesgo de sesgo. Para el dominio del estándar de referencia, un estudio se consideró en bajo riesgo y el segundo presentaba un riesgo poco claro del sesgo. Con respecto al dominio de flujo y tiempo, ambos estudios se consideraron en alto riesgo de sesgo.
DCL a DEA;
La evolución del DCL a DEA a los dos años de seguimiento tenía una sensibilidad de un 89% (IC del 95%: 52 a 100) y una especificidad de un 80% (IC del 95%: 44 a 97) mediante la evaluación cuantitativa por SUVR (n = 19, un estudio).
La evolución del DCL a DEA a los tres años de seguimiento tenía una sensibilidad de un 64% (IC del 95%: 53 a 75) y una especificidad de un 69% (IC del 95%: 60 a 76) mediante la evaluación visual (n = 224, un estudio).
No hubo información con respecto a los otros dos objetivos de esta revisión sistemática (RS): la progresión del DCL a otras formas de demencia y la progresión a cualquier forma de demencia en el seguimiento.
Conclusiones de los autores
Debido a la sensibilidad y especificidad variables para predecir la evolución de DCL a DEA y los datos limitados disponibles, no se puede recomendar el uso sistemático de flutemetanol F18 en la práctica clínica. El 18F‐flutemetamol tiene altos costos económicos; por lo tanto, es importante demostrar claramente su DTA y normalizar el proceso de la modalidad de 18F‐flutemetamol antes de su uso más amplio.
Resumen en términos sencillos
Uso de TEP con flutemetamol F 18 para el diagnóstico temprano de la demencia de la enfermedad de Alzheimer y otras demencias en pacientes con deterioro cognitivo leve
Pregunta de la revisión: ¿En los pacientes con deterioro cognitivo leve (DCL), el uso de una TEP F18 con flutemetamol predice la evolución a la demencia de la enfermedad de Alzheimer (DEA) y otras demencias?
Antecedentes
Debido al envejecimiento global, se espera que el número de personas con demencia aumente de manera significativa en las próximas décadas. Se aconseja el diagnóstico de la demencia en un estadio inicial, aunque no hay un acuerdo generalizado sobre el mejor enfoque. Varias pruebas sencillas con lápiz y papel utilizadas por los profesionales de la salud pueden evaluar a los pacientes con memoria deficiente o deterioro cognitivo. Aún no se conoce si el uso de una TEP especial que detecta el amiloide — uno de los sellos distintivos de la enfermedad de Alzheimer — mejora la capacidad de predecir la progresión de DCL a DEA u otras formas de demencia. Debido a que estas pruebas son costosas, es importante que proporcionen beneficios adicionales.
Objetivo
Se intentó evaluar la exactitud de la TEP con flutemetamol F18 para identificar a los pacientes con DCL que progresan clínicamente a DEA, otro tipo de demencia o cualquier forma de demencia durante un periodo de tiempo.
Características de los estudios
La evidencia está actualizada hasta mayo 2017. Se encontraron dos estudios que evaluaron la evolución de DCL a DEA. Los estudios incorporaron 252 pacientes con DCL aptos y 243 participantes que tuvieron seguimiento. De estos, 127 eran mujeres. La edad promedio en un estudio con dos años de seguimiento fue 72,7+ 7,09 años. En el otro estudio con tres años de seguimiento, la edad promedio fue 71,1 + 8,62 años. El ámbito de un estudio fueron los consultorios de memoria.
Fuentes de financiación del estudio: ambos estudios fueron financiados por el fabricante de la prueba.
Calidad de la evidencia
La limitación principal de esta revisión fue que los resultados se basaron en sólo dos estudios y no había suficientes detalles sobre la forma en que se seleccionaron los pacientes, cómo se interpretó la TEP en un estudio y cómo se realizó el diagnóstico clínico de la demencia en el otro. Se consideraron los estudios en alto riesgo de sesgo debido a los posibles conflictos de intereses detectados.
Hallazgos clave
En esta revisión, se halló que la TEP de flutemetamol F18, como examen único, en un estudio con 19 participantes y dos años de seguimiento, tuvo una sensibilidad de 89% y una especificidad de 80%. Esto significa que en una cohorte con 100 pacientes con DCL y la evolución en este estudio estimada en un 47%, se esperaría que 42 de 47 pacientes con DCL y resultado positivo para la TEP con flutemetamol F18evolucionen a DEA y cinco sean falsos positivos. Además, se esperaría que 42 de 53 participantes que no evolucionan a DEA tengan un resultado negativo en la TEP con flutemetamol F18 y 11 sean falsos negativos.
En el otro estudio con 224 participantes incluidos en el análisis y un seguimiento de tres años, la sensibilidad fue de 64% y la especificidad fue de 69%. Esto significa que en una cohorte de 100 pacientes con DCL y una evolución en este estudio estimada en 36%, se esperaría que 23 de 36 pacientes con DCL y un resultado positivo en la TEP con flutemetamol F18 evolucionen a DEA y 13 sean falsos positivos. Además, se esperaría que 44 de 64 participantes que no evolucionan a DEA tengan un resultado negativo en la TEP con flutemetamol F18 y 20 sean falsos negativos.
No había información con respecto a la evolución del DCL a otras formas de demencia ni la evolución a cualquier forma de demencia en el seguimiento.
Se concluye que no puede recomendarse el uso sistemático de la imagenología de TEP con flutemetamol F18 en la práctica clínica para predecir la evolución de DCL a DEA sobre la base de los datos disponibles en la actualidad. Se necesitan más estudios para demostrar claramente su utilidad.
Authors' conclusions
Summary of findings
| What is the diagnostic accuracy of 18F‐flutemetamol PET amyloid biomarker for predict progression to ADD in people with MCI? | |||||||
| Descriptive | |||||||
| Patient population | Participants diagnosed with MCI at the time of performing the test using any of the Petersen criteria or Winblad criteria or CDR = 0.5 or any of the 16 definitions included by Matthews (Matthews 2008). | ||||||
| Sources of referral | Not reported (n = 2) | ||||||
| MCI criteria | Petersen criteria (n = 2) | ||||||
| Sampling procedure | Unclear (n = 2) | ||||||
| Prior testing | The only testing prior to performing the 18F‐flutemetamol PET amyloid biomarker was the application of diagnostic criteria for identifying participants with MCI | ||||||
| Settings | Secondary care (n = 1) Not reported (n = 1) | ||||||
| Index test | 18F‐flutemetamol PET | ||||||
| Threshold pre‐specified at baseline | Yes (n=1) Unclear (n=1) | ||||||
| Threshold interpretation | Visual (n = 1) Quantitative (n = 1) | ||||||
| Thershold | SUVR (Standardised Uptake Volume ratio) of ROI: > 1.5 (n = 1) Not specified: analytical visual approach of ROI: (n = 1) | ||||||
| 18F‐flutemetamol retention region | Global cortex (n = 1) Not reported (n = 1) | ||||||
| Reference Standard | For Alzheimer’s disease dementia: NINCDS‐ADRDA (n = 1) Unclear (n = 1) | ||||||
| Target condition | Progression from MCI to Alzheimer’s disease dementia or any other forms of dementia (non‐ADD) or any form of dementia | ||||||
| Included studies | Prospectively well‐defined cohorts with any accepted definition of MCI (as above). Two studies (N = 252 participants) were included. Number of participants included in analysis: 243 | ||||||
| Quality concerns | Patient selection and index test QUADAS‐2 domain: unclear risk of bias Reference standard domain: low risk of bias Flow and timing domain: high risk of bias There were unclear concerns about applicability in the patient selection and index test domain. Patient selection and index test QUADAS‐2 domain: low risk of bias Reference standard domain: unclear risk of bias Flow and timing domain: high risk of bias. There was unclear concern about applicability in the reference standard domain. | ||||||
| Limitations | Limited investigation of heterogeneity and sensitivity analysis due to an insufficient number of studies. We were unable to evaluate progression from MCI to any other form of dementia (non‐ADD) or any form of dementia due to lack of included studies. | ||||||
| Test | Studies | Cases/Participants | Sensitivity | Specificity | Consequences in a cohort of 100 | ||
| Proportion converting1 | Missed cases2 | Overdiagnosed2 | |||||
| Alzheimer's disease dementia | |||||||
| 18F‐flutemetamol with visual assessment | 1 | 81/224 | 64% (95% CI 53% to 75%) | 69% (95% CI 60% to 76%) | 36 | 13 | 20 |
| 18F‐flutemetamol with SUVR | 1 | 9/19 | 89% (95% CI 52% to 100%) | 80% (95% CI 44% to 97%) | 47 | 5 | 11 |
| Investigation of heterogeneity and sensitivity analysis: The planned investigations were not possible due to the limited number of studies available for each analysis. | |||||||
| Conclusions:18F‐flutemetamol PET scan is not an accurate test for detecting progression from MCI to Alzheimer’s disease dementia. The strength of the evidence was weak because of considerable variation in study methods, unclear methodological quality due to poor reporting, and high risk of bias due to possible conflict of interest. There is a need for conducting studies using standardised 18F‐flutemetamol PET scan methodology in larger populations. | |||||||
| 1. Proportion converting to ADD in each included study 2. Missed and overdiagnosed numbers were computed using the proportion converting to the target condition. ADD: Alzheimer's disease dementia QUADAS‐2: Quality Assessment of Diagnostic Accuracy Studies‐2 | |||||||
Background
Dementia is a syndrome due to a brain disease — usually of a chronic or progressive nature — in which there is disturbance of multiple higher cortical functions, including memory, thinking, orientation, comprehension, calculation, learning capacity, language, and judgement. However, consciousness remains unaffected. See the glossary in Appendix 1. The impairments of cognitive function are commonly accompanied, and occasionally preceded, by a deterioration in emotional control, social behaviour, motivation, and the impairment is sufficient to interfere with everyday activities. Dementia is a collection of different subtypes distinguished by the underlying pathology. ADD is the most common form of dementia and other important pathologies associated with dementia are vascular disease, Lewy bodies, and frontotemporal pathology (WHO 2012).
Dementia is a serious worldwide public health problem, with a prevalence of 4.7% in adults older than 60 years (6.2% and 6.5% in Europe and the Americas, respectively). Due to its prevalence in older people, it is expected that the number of people with dementia will increase dramatically. Consequently, in the year 2050, an expected number of 115 million people will have dementia. This will result in a considerable economic burden, which currently stands at 1% of the world's Gross National Product (GNP) in direct and indirect costs (WHO 2012). These financial costs are in addition to the devastating personal and social consequences of the condition.
The definition of MCI applies to people without evidence of significant deterioration in activities of daily living, but with subjective memory complaints and cognitive impairment detected by standardised tests. MCI often precedes clinical dementia, but there is no consensus regarding how to operationalise the MCI diagnosis. There are several clinical criteria to define which people have MCI, including the Petersen criteria or Petersen Revisited Criteria (Petersen 1999; Petersen 2004; Winblad 2004), Clinical Dementia Rating Scale (CDR= 0.5) (Morris 1993), or 16 other different classifications of MCI (Matthews 2008).
A diagnosis of MCI reputedly allows testing of preventive interventions that would slow the progression of MCI to dementia. If the progression of MCI to dementia could be deferred by five years, the prevalence of dementia would decrease by 43% in 2050 (Alzheimer's Association 2010). MCI has an annual progression rate to ADD from 5% to 15%. However, not every person with MCI develops dementia, and a significant number of people recover or stabilise. Therefore, future research should try to clarify which people with MCI develop dementia in order to be able to focus specifically on people who are at high risk of developing dementia. This may possibly explain the failure of therapy to alter the progression to dementia in people with MCI. Other aspects that may contribute to this failure are the disparity in diagnostic criteria and different settings of the studied participants: community, primary, secondary, and research centres (Bruscoli 2004; Mattsson 2009; Petersen 1999; Petersen 2009).
The definition of Alzheimer's disease pathology is over 100 years old. This pathology includes neuritic plaques that contain deposits of amyloid beta (Aβ) and neurofibrillary tangles (Goedert 2006). This pathology is present in approximately 84% of all people with dementia (Schneider 2007). Furthermore, Alzheimer's disease pathology is found in 88% of people diagnosed with probable ADD (Schneider 2009). Despite this, Alzheimer's disease pathology may be found concomitantly at autopsy in people thought to have other forms of dementia, such as vascular dementia, Lewy body dementia, or frontotemporal dementia (FTD) (Jellinger 2006). Furthermore, at least five common pathologies have been found in the brains of people who died and were thought to have ADD prior to death (White 2009). Also, Alzheimer's disease pathology was found in 42% of community‐dwelling older people without dementia (Schneider 2007). This has generated controversy about the importance of the presence of Alzheimer's disease pathology. The pathology can be associated with aging per se, and, for older people, the relationship between amyloid plaque burden and cognitive impairment diminishes as age progresses (Savva 2009). Thus, this pathology could be an epiphenomenon associated with the presence of dementia, e.g. a by‐product of repair mechanisms by vascular damage (De la Torre 2004; Garcia‐Alloza 2011). On the other hand, this controversy could be because our clinical diagnostic criteria have not had enough accuracy to diagnose Alzheimer's disease that is detected by histopathology in postmortem studies (Hyman 2012). In addition, other researchers think that there is not a real controversy about the amyloid hypothesis, because the amyloid cascade and the Aβ deposition have a primary role in Alzheimer's disease (Selkoe 2016).
More recently, the development of Aβ pathology biomarkers in vivo has been suggested as an important advance as a diagnostic tool in the field of Alzheimer's disease, and has promoted the creation of new diagnostic criteria for people without symptoms (preclinical stages), people with MCI, and people with ADD, based on the presence of biomarkers of Alzheimer's disease. These have included Aβ tracers by positron emission tomography (PET) (Albert 2011; Dubois 2014; McKhann 2011; Sperling 2011). However, uncertainties regarding the usability of biomarkers in the diagnosis of dementia still exist, mainly due to variation between biomarker types, criteria for positivity, and differences in methodology (Noel‐Storr 2013). This prompted an important initiative, the Standards for Reporting of Diagnostic Accuracy Studies in dementia studies (STARDdem) statement (Noel‐Storr 2014). Consequently, clinical properties of dementia biomarkers should not be assumed, and formal systematic evaluations of sensitivity, specificity, and other properties of biomarkers should be performed (Davis 2013).
PET is an imaging technique using compounds labelled with short‐lived positron‐emitting radionuclides. The use of Aβ ligands permits the in vivo detection of amyloid deposition in the brain. 18F PET ligands, such as 18F‐flutemetamol, is a fluorinated tracer, derived from the Pittsburgh Compound B (the first tracer developed), and it is characterised by a higher median life of 110 minutes than the Pittsburgh Compound B and a high affinity for amyloid β. The performance of the 18F‐flutemetamol PET scan was probed in vivo with healthy people and ADD (Nelissen 2009) and also in people with MCI (Vandenberghe 2010) and it has been considered that it could eventually be used to differentiate between different dementia types, specifically between FTD and ADD like other fluorinated tracers such as 18F‐florbetaben (Villemagne 2011) or 18F‐florbetapir (Kobylecki 2015).
In 2013, 18F‐flutemetamol was approved by the Food and Drug Administration (FDA) and, in 2014, by the European Medicines Agency (EMA). A positive scan indicates moderate to frequent presence of neuritic amyloid plaques. However, this might also occur in people with other neurological conditions and in older adults with normal cognition. Therefore, the safety and effectiveness of 18F‐flutemetamol have not been established for predicting development of dementia or other neurological conditions and it should be combined with other diagnostic evaluations or instruments (EMA 2014; FDA 2014).
Despite not being approved for this purpose by the regulatory agencies, research has been conducted in people with MCI to determine whether biomarkers, such as 18F‐flutemetamol for Aβ, increase the risk of developing dementia over time. The evidence for this is uncertain. For this and other reasons, the NIA‐AA in the USA established two different criteria for MCI. Firstly, they established the Core Clinical Criteria for use in all clinical settings, without use of biomarkers, and characterised by concerns regarding a change in cognition with impairment in one or more cognitive domains with preservation of independence in functional abilities, therefore no dementia. Secondly, they established the Clinical Research Criteria, which incorporate the use of biomarkers, such as PET amyloid scans, intended for use exclusively in research settings, including academic centres and clinical trials. This will help determine whether positive scans increase the likelihood of progression from MCI to clinical dementia (Albert 2011). Lastly, it is hoped that people with MCI and positive scans will 'enrich' clinical trials, and more people who will progress to dementia in a shorter time will be included to allow more efficient studies of treatments and prevention strategies of ADD (CMS 2013).
An assumption for some researchers, and one on which this systematic review (SR) is predicated, is that if a person has both MCI and the pathology of Alzheimer's disease and develops clinical ADD subsequently, then the cause of the initial MCI and of the ADD was the Alzheimer’s pathology. Our approach is an example of assessing diagnostic test accuracy (DTA) using delayed verification of diagnosis. Instead of the reference standard being based on pathology, it is based on a clinical standard and the progression from MCI to ADD, or any other form of non‐ADD, or any dementia. Although, for the reasons stated above, a degree of unreliability has been introduced, defining progression has the advantage of being based on what matters most to people with MCI, their families, and clinicians involved in their care.
18F‐flutemetamol PET scan is considered the diagnostic marker of interest, and in this SR we assessed the DTA of 18F‐flutemetamol Aβ binding in the brain and progression of the following:
-
From MCI to ADD.
-
From MCI to any other form of non‐ADD.
-
From MCI to any form of dementia
This SR belongs to a series of SRs regarding PET biomarkers for Aβ, including 18F‐florbetaben and 18F‐florbetapir (Martínez 2016).
Target condition being diagnosed
This SR assessed the following three target conditions.
-
ADD (progression from MCI to ADD).
-
Any other form of dementia (progression from MCI to any other form of non‐ADD).
-
Any form of dementia (progression from MCI to any form of dementia).
We compared the index test results obtained at baseline with the results of the reference standards obtained at follow‐up (delayed verification).
Index test(s)
The 18F‐flutemetamol scan is an index test for the detection of Aβ deposition in the brain region of interest (ROI). The ROI is a selected brain area that physicians create for further study in various anatomical areas of the brain. 18F‐flutemetamol is a molecular biomarker, described as follows.
-
18F‐flutemetamol Aβ is described as 6‐benzothiazolol, 2‐[3‐[18F]fluoro‐4‐(methylamino)phenyl], and is also referred to as 18F‐3'‐F‐6‐OH‐BTA1, 18F‐GE067, AH110690 (Koole 2009; Nelissen 2009).
-
18F‐flutemetamol has been evaluated in people with ADD, MCI, and healthy controls in a clinical field in order to identify a valid, simple, and reliable PET quantitation method for the routine measure of brain amyloid retention in vivo (Vandenberghe 2010).
Image Interpretation
Both the FDA and EMA have described the criteria for 18F‐flutemetamol for Aβ positivity (EMA 2014; FDA 2014).
18F‐flutemetamol diagnosis is by PET image assessment, and is defined as positive if analysis shows the following.
-
At least one cortical region (frontal lobes, posterior cingulate and precuneus, lateral temporal lobes, inferolateral parietal lobes, striatum) with reduction or loss of the normally distinct grey‐white matter contrast. These scans have one or more regions with increased cortical grey matter signal (above 50% to 60% peak intensity) or reduced (or absent) grey‐white matter contrast (white matter sulcal pattern is less distinct), or both.
-
A positive scan may have one or more regions in which grey matter radioactivity is as intense or exceeds the intensity in adjacent white matter.
Readers trained in PET images with the 18F‐flutemetamol should interpret the Aβ PET images made with this ligand (EMA 2014; FDA 2014).
Before the FDA and EMA described the criteria for 18F‐flutemetamol scan positivity, the diagnosis of dementia was made using different thresholds. Therefore, we planned to use the FDA or EMA criteria applied in each included study to classify participants as either test‐positive or test‐negative, or, alternatively, if 18F‐flutemetamol Aβ uptake and retention exceeded a certain threshold.
We considered the measurement of the 18F‐flutemetamol retention (retention ratio): distribution volume ratio (DVR), standardised uptake value ratio (SUVR), or other ratios. DVR refers to the ratio of the 18F‐flutemetamol distribution volume in the selected area (ROI) to the distribution volume in the reference area. SUVR is the ratio of the 18F‐flutemetamol ligand standardised uptake value in the selected area (ROI) to the standardised uptake value in the reference area.
The unit of analysis of our SR was the participant. We did not include studies that analysed multiple ROIs per participant.
Image analysis: not prespecified (e.g. Statistical Parametric Mapping (SPM) or other image analysis techniques).
Administration Instructions and Recommended Dosing
-
Time between 18F‐flutemetamol injection and PET acquisition: images should be acquired in 20 minutes starting from 90 minutes after intravenous administration (EMA 2014; FDA 2014).
-
Injection dose: the recommended dose for 18F‐flutemetamol Aβ PET is 185 MBq (5.0 mCi) administered as a single slow intravenous bolus (EMA 2014; FDA 2014).
Although it was inevitable that included studies had used different imaging protocols, readers' expertise, and varied parameters, the amyloid PET data in these included studies should be technically adequate and acquired at a fully qualified and certified facility.
Clinical pathway
At this time, the clinical evaluation often has similarities between different countries (Cordella 2013; NICE 2006). It often starts with people experiencing memory complaints detected by themselves or their relatives. Frequently, general practitioners or family physicians are consulted, and they often conduct a medical evaluation using a screening test for cognitive impairment. Whenever this screening test is positive, they complete an assessment with a clinical evaluation conducted with laboratory studies that can rule out a secondary cause of cognitive impairment (e.g. hypothyroidism, renal failure, liver failure, vitamin B12 or folate deficiency, and others). In addition, these people are then referred to medical specialists in cognitive disorders (preferably a geriatrician, psychiatrist, or neurologist) in a secondary centre or directly to memory clinics where further clinical assessment, laboratory studies, and cerebral image studies are conducted to confirm the dementia diagnosis.
People with dementia, or their relatives, often directly consult these specialists or specialised memory clinics in the study of cognitive disorders. Therefore, the performance of the diagnostic tests will probably vary according to whether it is a primary consultation or referral from primary to specialist care, or if the people have different clinical stages of the disease (MCI, mild, moderate, or severe dementia). Due to these differing pathways, the use of 18F‐flutemetamol PET ligand for Aβ is mainly used in specialist consultations and memory clinics as an addition to clinical evaluation or other tests, helping in a clinical setting to discard a diagnosis of Alzheimer's dementia with a negative scan in a person with clinical dementia and doubts about the aetiology (e.g. FTD versus ADD). Otherwise, it might be used solely in the research field in people with MCI for the enrichment of clinical trials, for example, enrolling people with MCI and a positive PET scan to study preventive interventions before people develop dementia.
However, in some memory clinics the 18F‐flutemetamol PET is used for clinical purposes in people with persistent or progressive unexplained MCI adopting the Johnson criteria (Johnson 2013), criteria without sufficient evidence. Therefore, if the 18F‐flutemetamol PET is positive in a person with MCI, this positivity is considered as one of the core histopathological findings of Alzheimer's disease. The person will thus be catalogued as a patient with prodromal Alzheimer's disease or MCI due to Alzheimer's disease.
Alternative test(s)
Currently there are no standard practice tests available for the clinical diagnosis of Alzheimer's disease dementia. Below, we have listed the alternative tests that we have excluded from this SR. The Cochrane Dementia and Cognitive Improvement Group is in the process of conducting a series of DTA SRs of biomarkers and scales (see list below).
-
18F PET ligands for Aβ (18F‐florbetapir, 18F‐florbetaben) (Martínez 2016).
-
18F‐FDG‐PET (PET F‐fluorodeoxyglucose) (Smailagic 2015).
-
11C‐PIB‐PET (PET‐Pittsburgh compound B) (Zhang 2014).
-
Cerebrospinal fluid (CSF) analysis of Aβ and tau (Kokkinou 2014; Ritchie 2013; Ritchie 2014).
-
Structural magnetic resonance imaging (sMRI) (Filippini 2012).
-
Neuropsychological tests (Mini‐Mental State Examination (MMSE); MiniCOG; Montreal Cognitive Assessment (MoCA) (Arevalo‐Rodriguez 2015; Chan 2014; Creavin 2016; Davis 2015; Fage 2015; Seitz 2014).
-
Informant interviews (Informant Questionnaire on Cognitive Decline in the Elderly (IQCODE); AD8) (Harrison 2014; Hendry 2014; Lees 2014; Harrison 2015; Quinn 2014).
-
APOE‐ϵ4 (Elias‐Sonnenschein 2014a; Elias‐Sonnenschein 2014b; Elias‐Sonnenschein 2014c).
-
Single‐photon emission computed tomography (SPECT) brain imaging (Archer 2015; McCleery 2015).
Rationale
Accurate and early diagnosis of Alzheimer's disease is crucial for planning in healthcare systems, because the costs of dementia are currently at least 1% of the world's GNP (WHO 2012).
18F‐flutemetamol is approved for use in the clinical field mainly in people who are diagnosed clinically with dementia of uncertain aetiology, in which case diagnosis of ADD can be discarded if the test is negative. Even though 18F‐flutemetamol is not approved for this purpose, this biomarker test is currently being used in the research field to search for the accurate identification of people with MCI who would progress to ADD or other forms of dementia. Amyloid β tracers by PET have been included in newly diagnostic criteria in the study in people with MCI (Albert 2011; Dubois 2014). However, some uncertainties exist about the generalisability of the DTA results in clinical settings, especially in older people (Richard 2012).
It is currently believed that if the health system can identify which people are at high risk of progressing from MCI to dementia, it can focus on improving opportunities for appropriate contingency planning for them. Proper recognition of the disease may also help prevent inappropriate and potentially harmful admissions to hospital or institutional care (NAO 2007), and enable the development of new treatments designed to delay or prevent progression to more debilitating stages of the disease. Additionally, this may demonstrate a real clinical benefit for people and caregivers, and will reduce health system costs.
This SR assesses the DTA with 18F‐flutemetamol Aβ PET in people with MCI.
Objectives
To determine the diagnostic test accuracy (DTA) of 18F‐flutemetamol as the index test for detecting people with mild cognitive impairment (MCI) at time of performing the test who would clinically progress to Alzheimer's disease dementia (ADD), or other forms of non‐ADD, or any form of dementia at follow‐up.
Secondary objectives
To investigate the heterogeneity of the DTA in the included studies, by evaluating the spectrum of people, referral centres, clinical criteria of MCI, 18F‐flutemetamol techniques, reference standards used, duration of follow‐up, aspects of study quality, and conflicts of interest.
Methods
Criteria for considering studies for this review
Types of studies
We included longitudinal studies that had prospectively defined cohorts with any accepted definition of mild cognitive impairment (MCI), as outlined below, at time of performing the 18F‐flutemetamol Aβ scan and a reference standard (see Index tests and Reference standards below). We obtained the results at the follow‐up of the studies. These studies had to employ delayed verification of progression to dementia and were sometimes labelled as 'delayed verification cross sectional studies' (Bossuyt 2008; Knottnerus 2002). We included case‐control studies when they incorporate a delayed verification design. This occurred in the context of a cohort study, so these studies were invariably diagnostic‐nested case‐control studies.
Participants
Participants recruited and clinically classified as having MCI at time of performing the test were eligible for inclusion. We established the diagnosis of MCI using the Petersen criteria or revised Petersen criteria (Petersen 1999; Petersen 2004; Winblad 2004), the criteria included in Matthews study (Matthews 2008), CDR = 0.5 (CDR structured interviews collects information from both the collateral source and the subject regarding memory, orientation, judgment and problem solving, community affairs, home and hobbies, and personal care, where the range of possible scores varies from none=0 point to severe=3 points) (Morris 1993), the National Institute on Aging‐Alzheimer's Association (NIA‐AA) core clinical criteria (Albert 2011), or a combination.
We excluded studies that included people with MCI possibly caused by any of the following:
-
Current or a history of alcohol or drug abuse.
-
Central nervous system (CNS) trauma (e.g. subdural hematoma), tumour, or infection.
-
Other neurological conditions (e.g. Parkinson’s or Huntington’s diseases). Regarding Parkinson's disease, many of the studies specifically excluded people with Parkison's disease from the group with mild cognitive impairment. This specific group of people is complex in both regards to defining neuropathology and in determination of functional decline. For these reasons this group of people needs to be addressed in specific studies
Index tests
The index test of this SR was 18F‐flutemetamol biomarker test. We used the criteria and cut‐off values for test positivity, as reported in the included studies. We considered positivity for 18F‐flutemetamol Aβ scan uptake and retention exceeding a certain threshold.
Target conditions
Three target conditions were included in this SR:
-
Alzheimer’s disease dementia (ADD) (progression from MCI to ADD).
-
Any other forms of dementia (progression from MCI to any other forms of non‐ADD).
-
Any form of dementia (progression from MCI to any form of dementia).
Reference standards
The reference standard was the progression to the target conditions evaluated by a physician with expertise in the dementia field (preferably a geriatrician, psychiatrist, or neurologist). For the purpose of this SR, we accepted several definitions of ADD. We included studies that applied the National Institute of Neurological and Communicative Disorders and Stroke and the Alzheimer’s Disease and Related Disorders Association (NINCDSADRDA) criteria (McKhann 1984), the Diagnostic and Statistical Manual of Mental Disorders (DSM) criteria (APA 1987; APA 1994), and the International Classification of Diseases (ICD) (ICD‐10) criteria for ADD. Notably, different iterations of these standards may not be directly comparable over time (e.g. APA 1987 versus APA 1994). Moreover, the validity of the diagnoses may vary with the degree or manner in which the criteria have been operationalised (e.g. individual clinician versus algorithm versus consensus determination). We considered all these issues when we interpreted the results.
Similarly, we accepted differing clinical definitions of other dementias. For Lewy Body Dementia the reference standard is the McKeith criteria (McKeith 1996; McKeith 2005); for frontotemporal dementia the Lund criteria (Boxer 2005; Brun 1994; Neary 1998), the DSM criteria (APA 1987; APA 1994), the ICD criteria (ICD‐10), or the International Behavioural Variant FTD Criteria Consortium (Rascovsky 2011); and, for vascular dementia, the National Institute of Neurological Disorders and Stroke and Association Internationale pour la Recherché et l'Enseignement en Neurosciences (NINDS‐AIREN) criteria (Román 1993), the DSM criteria (APA 1987; APA 1994), or the ICD criteria (ICD‐10).
The time interval in which the progression from MCI to ADD (or other forms of dementia) occurs is very important. We used one year as the minimum period of delay in the verification of the diagnosis (the time between the assessment at which a diagnosis of MCI is made and the assessment at which the diagnosis of dementia is made).
Search methods for identification of studies
Electronic searches
We searched MEDLINE (Ovid SP) from 1946 to May 2017; Embase (Ovid SP) from 1974 to May 2017; PsycINFO (Ovid SP) from 1806 to May 2017; BIOSIS Citation Index (Thomson Reuters Web of Science) from 1922 to May 2017; Web of Science Core Collection, including the Science Citation Index (Thomson Reuters Web of Science) and the Conference Proceedings Citation Index (Thomson Reuters Web of Science) from 1946 to May 2017; LILACS (Bireme); CINAHL (EBSCOhost) from 1980 to May 2017; ClinicalTrials.gov (https://clinicaltrials.gov); and the World Health Organization International Clinical Trials Registry Platform (WHO ICTRP) (http://www.who.int/ictrp/search/en/). We also searched ALOIS, the Cochrane Dementia & Cognitive Improvement Group’s specialized register of dementia studies (http://www.medicine.ox.ac.uk/alois/).
We used two approaches in designing the search. One focused solely on the specifically named index test (including a range of synonyms) and the second, run in parallel covered a more general search, linking broader terms for the index test. It focused on terms describing its diagnostic use and terms for the target condition to try to capture the more difficult to locate studies of a more general nature, where these particular radioligands were included in diagnostic accuracy research but not named specifically in the parts of the electronic bibliographic record that are searchable and therefore would be missed.
See Appendix 2 for details of the sources and search strategies that we used. No language or date restrictions were applied to the electronic searches.
Searching other resources
We examined the reference lists of all relevant studies for additional studies. We also searched the Database of Abstracts of Reviews of Effects (DARE) via the Cochrane Library (www.cochranelibrary.com)), the National Institute for Health Research ‐ Health Technology Assessment Database (NIHR‐HTA) (via the Cochrane Library: www.cochranelibrary.com), the Aggressive Research Intelligence Facility (ARIF) database (www.arif.bham.ac.uk) for other related systematic diagnostic accuracy reviews, and the International Federation of Clinical Chemistry and Laboratory Medicine Committee for Evidence‐based Laboratory Medicine database (C‐EBLM) (http://www.ifcc.org/ifcc‐education‐division/emd‐committees/c‐eblm/evidence‐based‐laboratory‐medicine‐c‐eblm‐base).
We checked the reference lists of any relevant studies and SRs, and performed citation tracking using the Science Citation Index to identify any additional relevant studies.
Data collection and analysis
Selection of studies
Two review authors (GM, RV) independently screened the retrieved titles and abstracts for potentially eligible studies. A third review author (PF) resolved any disagreements between the two review authors. The two review authors (GM, RV) then independently assessed the full‐text articles of the selected studies with the inclusion criteria. They resolved any disagreements through discussion or, where necessary, consulted a third review author (PF) who acted as an arbitrator. When a study did not present all relevant data for creating 2 × 2 table, we contacted the study authors directly to request further information. When more than one article presented data on the same population, we included the primary article, which was the article with the largest number of people or with the most informative data (e.g. longest time of follow‐up in the primary outcome).
Data extraction and management
We planned to extract the following data regarding the study characteristics.
-
Bibliographic details of primary paper:
-
author, title of study, year, and journal.
-
-
Basic clinical and demographic details:
-
number of participants;
-
clinical diagnosis;
-
MCI clinical criteria;
-
age;
-
gender;
-
sources of referral;
-
participant recruitment;
-
sampling procedures.
-
-
Details of the index test:
-
method of the 18F‐flutemetamol test administration, including those who administered the test;
-
thresholds used to define positive and negative test;
-
other technical aspects as seemed relevant to the review, e.g. brain areas.
-
-
Details of the reference standard:
-
definition of ADD and other dementias used in reference standard;
-
duration of follow‐up from time of the index test performed to defining ADD and other dementias by the reference standard: one year to less than two years; two years to less than four years; and four years or more. If participants had been followed for varied amounts of time we recorded a mean follow‐up period for each included study. If possible, we grouped those data into minimum, maximum, and median follow‐up periods, to enable subgroup analyses;
-
prevalence or proportion of population developing ADD and other dementias, with severity if described.
-
We created 2 × 2 tables (cross‐relating index test results of the reference standards) as shown in Appendix 3. For each included study, we recorded the number of participants lost to follow‐up. We also extracted data necessary for the quality assessment, as defined below. Two review authors (GM, RV) independently performed data extraction. We resolved any disagreements regarding data extraction by discussion, or consulting a third review author (PF), if it was necessary.
Assessment of methodological quality
We assessed the methodological quality of the included studies using the Quality Assessment of Diagnostic Accuracy Studies 2 tool (QUADAS‐2) (Whiting 2011), as recommended by Cochrane (Davis 2013). This tool is comprised of four domains: patient selection, index test, reference standard, and patient flow.
Two review authors (GM, RV), who were blinded to each other’s scores, independently performed the QUADAS‐2 assessment. We resolved any disagreements by discussion or, if necessary, consulted a third review author (PF) who acted as an arbitrator. We assessed each domain in terms of risk of bias, and also considered the first three domains in terms of applicability concerns. In Appendix 4, we have detailed the components of each of these domains and provided a rubric that shows how we made judgements concerning risk of bias. Key areas important to quality assessment were participant selection, blinding, and missing data.
We included three additional signalling questions on our checklist.
-
Was the PET scan interpretation done by a trained reader physician? (We included this under the ’Index test’ domain.)
-
Was there a clear definition of a positive result? (We included this under the ’Index test’ domain.)
-
Was the study free of commercial funding? (We included this under the ’flow and timing’ domain.)
We included the item pertaining to the PET scan interpretation and the definition of positive results to take into account the subjective nature of the 18F‐flutemetamol Aβ scan image interpretation, which may be based on a variety of different criteria, such as extensive clinical experience, different standardised uptake values (SUV), different morphological features, or a combination of the aforementioned. We included the third additional item in order to record any potential bias resulting from commercial interest in the results due to the potential risk by the manufacturing company leading to more favourable results and conclusions than sponsorship by other sources (Lundh 2017).
We did not use QUADAS‐2 data to form a summary quality score. We produced a narrative summary that described each included study as at high, low, or unclear risk of bias, as well as concerns regarding applicability, which we have described in Appendix 5.
Statistical analysis and data synthesis
We applied the DTA framework for the analysis of a single test and extracted the data from each included study into a 2×2 table, showing the binary test results cross‐classified with the binary reference standard, and we ignored any censoring that might have occurred. We acknowledge that such a reduction in the data may represent a significant oversimplification. We used data from the 2×2 tables abstracted from the included studies: true positive (TP), false negative (FN), false positive (FP), true negative (TN), and entered these into Review Manager (RevMan) (Review Manager 2014) to calculate the sensitivities, specificities, and their 95% confidence intervals. We also presented individual study results graphically by plotting estimates of sensitivities and specificities in both a forest plot. If an individual included study published more than one threshold, we presented the graphical findings for all reported thresholds.
We planned to segment analyses into separate follow‐up mean periods for the delay in verification: one year to less than two years; two to less than four years; and greater than four years. In this we planned to clearly note where the same included studies contributed to the analysis for more than one reference standard follow‐up interval.
However, due to lack of data, we conducted no meta‐analyses. However, we prepared a 'summary of findings table'.
Investigations of heterogeneity
We were able to include only two studies, therefore issues of heterogeneity did not arise.
Sensitivity analyses
We found insufficient data to conduct any sensitivity analyses.
Assessment of reporting bias
We did not investigate reporting bias.
Results
Results of the search
The total number of records identified for this SR was 1333. The PRISMA diagram (Figure 1) shows the selection of records through the screening and selection processes. In total, we assessed 81 studies (23 full‐text papers, 22 conference publications, 11 registered studies in clinicaltrials.gov, and 25 registered studies in WHO ICTRP) for eligibility in the full‐text screening. We excluded 72 studies. Ten studies were multiple publications or duplicated and 4 studies did not have extractable data for constructing 2 x 2 tables, and we received no reply when we contacted the authors (Goukasian 2015; Rowe 2015a; Rowe 2015b; Rowe 2015c) (Characteristics of excluded studies). We excluded the remaining 58 studies because they did not meet the inclusion criteria: i) not a longitudinal study (n = 23); ii) no MCI participants at time of performing the test (n = 21); iii) index test not a 18F‐flutemetamol PET scan (n = 4); iv) discussion or review paper (n = 6); v) wrong outcomes or design (n = 4). We included two studies and identified seven references as ongoing studies.

Flow diagram.
Included studies
See Characteristics of included studies.
Thurfjell 2012 refers to a study with baseline data that had been published 2 years earlier with ADD, MCI and healthy controls (HC) participants. MCI participants were recruited from secondary care (7 memory clinics). Participants were recruited as part of a study to evaluate the 18F‐flutemetamol PET scan in people with ADD (n = 27), amnestic MCI (n = 20) and healthy controls (n = 20) as a cross‐sectional study to determine the efficacy of blinded visual assessment of images of 18F‐flutemetamol uptake for separating subjects with clinically probable ADD from healthy controls, the SUVRs of subjects with probable ADD and HC, the concordance between (11)C‐labelled Pittsburgh Compound‐B ((11)C‐PIB) and 18F‐flutemetamol scans, regarding visual assessment and quantitative SUVR in ADD and MCI participants, and the assignation of a raised or low amyloid group category through visual or quantitative assessment in MCI participants (Vandenberghe 2010).
The study of Thurfjell 2012 included 20 MCI participants with a follow‐up of two years to evaluate the progression from amnestic MCI to probable ADD according to their 18F‐flutemetamol status as positive or negative, using a SUVR > 1.5 (Thurfjell 2012). The SUVR established in the previous study with ADD and HC participants was 1.56. The other objective of this study was to compute the hippocampus volume from MRI and investigate its accuracy performance alone and combined with the 18F‐flutemetamol PET scan at follow‐up. MCI participants fulfilled Petersen 1999 criteria for amnestic MCI, 11 were male, they had a mean age of 72.7 + 7.09 years, with 14.4 + 2.97 mean years of education, and their mean MMSE was 28.0 + 0.94 points.
Of the 20 participants, 9 (45%) developed Alzheimer’s dementia. One participant (5%) was reported as lost to follow‐up without further information about the cause.
The reference standard was not explicitly stated, although NINCDS‐ADRDA criteria for ADD (McKhann 1984) and APA 1994 were baseline diagnostic criteria in the Vandenberghe study (Vandenberghe 2010).
Potential conflicts of interest were noted. Financial support for the baseline study (Vandenberghe 2010) was from the manufacturer of 18F‐flutemetamol tracer and two authors were employees of this company.
NCT01028053 refers to an international and multicentric study in the United States and Europe (also known as EUCTR2009‐010227‐62‐GB in Europe) and with a common sponsor's protocol code number, GE‐067‐005.
The main objective of this study was to evaluate the 'hazard ratio by PET scan readers for conversion to probable Alzheimer's disease based on visual image Interpretation' in amnestic MCI participants with normal and abnormal patterns of 18F‐flutemetamol uptake, based on the visual assessment of a 18F‐flutemetamol PET scan. This unpublished study had no information regarding the participants' recruitment. There were 230 planned evaluable participants. The participants were 60 years old or older (US inclusion criteria in clinicaltrials.gov) or over 55 years old (Europe in EUDRACT), they met the Petersen criteria for amnestic MCI (not provided which of the different Petersen criteria published were used), had a score of less than or equal to 4 on the Modified Hachinski Ischemic Scale, a MMSE score of 24 to 30, and a non‐contrast MRI examination as part of the screening visit that excluded amnestic MCI arising from structural causes, and they had no significant neurologic disease other than suspected amnestic MCI. The mean age was 71.1 (+ 8.62) years, 63 participants were less than 65 years, and 118 were women.
Participants were assessed clinically on‐site every six months until progression to probable ADD (as determined by an independent Clinical Adjudication Committee (CAC)); or completion of 36 months of follow‐up, whichever came first. Clinical assessments were performed by a trained on‐site clinician who collected the results of a battery of tests, the National Institute of Neurological and Communicative Disorders and Stroke‐Alzheimer’s Disease and Related Disorders Association (NINCDS‐ADRDA) diagnostic criteria for probable ADD, and clinical assessment; this clinician was blinded to the subjects’ PET images and interpretations until the study was complete. The follow‐up data were regularly submitted to the CAC (which consisted of four experts in the diagnosis of memory disorders), which determined whether or not the subject had converted to probable ADD. The CAC reviewed all study data (excluding the investigator’s progression assessment, the 18F‐flutemetamol PET scan results and any other amyloid imaging data) for each subject to determine whether or not the subject had converted to probable ADD. The decision rules to be used in defining a progression to probable ADD were established by the CAC before reviewing any subject’s data.
The study analysed 224 participants of the original 232 participants at 36 months of follow‐up, because 8 participants withdrew before the first assessment at the follow‐up.
Potential conflicts of interest were noted. Total financial support was provided from the manufacturer of 18F‐flutemetamol tracer.
Excluded studies
We excluded four studies since they did not meet the inclusion criteria for participants, index test, or target condition (Characteristics of excluded studies).
The Goukasian 2015 study was focused on neuropsychiatric symptoms with a probable follow‐up in 38 MCI participants with a SUVR > 1.27 for brain amyloidosis. In Rowe 2015a, there were 59 participants with MCI at the time of performing the test and at the end of 18 months of follow‐up, there were 16 participants to be evaluated. In Rowe 2015b, there were 50 MCI participants and at the end of 18 months of follow‐up, there were seven participants to be evaluated. In Rowe 2015c, there were 17 participants with MCI evaluated at 18 months of follow‐up. All of these three studies were focused on change of 18F‐flutemetamol PET scan retention over time and probably shared participants, so it is possible that these reports referred to the same study.
None of the authors answered our email inquiries for additional information.
Ongoing studies
We found two ongoing studies in clinicaltrials.gov. NCT02164643 is a study that focused on participants with different cognitive spectrums, from isolated cognitive complaints to MCI with a basal 18F‐flutemetamol or 18F‐florbetapir PET scan and the progression to a clinical dementia stage according to DSM‐IV and NINCDS‐ADRDA as reference standards for up 24 months follow‐up. This study has been recruiting participants since July 2014 in France. The second study, NCT02196116, is focused on the amyloid load in three different participants in a cross‐sectional study: controls, MCI without memory complaints, and MCI with memory complaints. However, they also considered a longer term clinical follow‐up of study participants to investigate the prognosis value of amyloid load for improving the prediction of cognitive decline and disease progression. No further information about the follow‐up was detailed.
We found five ongoing studies in the WHO ICTRP register. EUCTR2011‐001756‐12‐BE is a study focused on cognitively healthy older people and MCI participants. The main objective is to evaluate, with a multimarker approach, the amnestic MCI participants by quantitative analysis of each biomarker by comparison to a normal database of recruited healthy volunteers and a clinical follow‐up from one to three years with basal 18F‐flutemetamol. No further details were provided regarding the participants, index test, and reference standard(s). This study has been ongoing since April 2012. The second study, EUCTR2011‐006195‐39‐SE, is focused on MCI participants and the main objective is to examine the efficacy of raised 18F‐flutemetamol brain uptake for differentiating people with mild cognitive impairment (MCI), who subsequently will develop ADD, from people with MCI who will be cognitively stable or develop other dementias than ADD. No further details were provided regarding the participants, index test, and reference standard(s). This study has been ongoing since January 2012. The third study is JPRN‐UMIN000019926, which is focused on preclinical Alzheimer's disease and MCI participants. Their main objective is to discriminate between MCI individuals at risk of development of Alzheimer dementia over an established follow‐up of 36 months. The index test will be 11C‐PiB, 18F‐florbetapir, or 18F‐flutemetamol PET scan. No further details were given regarding index test, and reference standard(s). This study has been ongoing since January 2016. The fourth study, EUCTR2017‐000094‐36‐SE, is focused on MCI, dementia, and healthy elderly people and the main objective is to study the diagnostic accuracy of Tau PET 18F‐RO6958948 and 18F‐flutemetamol for identifying healthy elderly individuals and people with subjective or objective mild cognitive symptoms who are at high risk of subsequent development of ADD or other neurodegenerative disorders. The follow‐up was not clearly stated. This study has been ongoing since March 2017. The fifth study, EUCTR2016‐002635‐15‐NL, is focused on people aged 90 or older. The main objectives are to understand how clinical markers and biomarkers previously identified in younger and older ADD cohorts apply to the extremely old, to identify novel biomarkers linked with resilience to developing ADD in extremely old subjects and the generation of normative data for the oldest, and measure the concordance between amyloid pathology as assessed in CSF and by PET. This study has been ongoing since July 2016.
Methodological quality of included studies
We assessed methodological quality using the QUADAS‐2 tool (Whiting 2011). Review authors’ judgements about each methodological quality item for each included study are presented in the Characteristics of included studies table. The overall methodological quality of the studies is summarised in Figure 2.
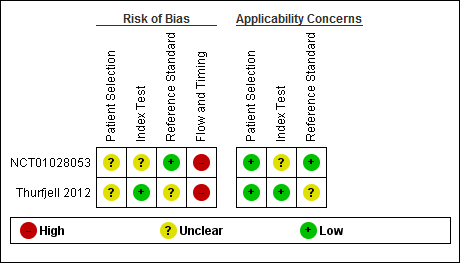
Risk of bias and applicability concerns summary: review authors' judgements about each domain for each included study
In the patient selection domain, we considered both studies (Thurfjell 2012; NCT01028053) to be at unclear risk of bias due to lack of reporting on sampling procedures and exclusion criteria. We stated that the included studies avoided a case‐control design because we only considered data on performance of the index test to discriminate between people with MCI who converted to dementia and those who remained stable.
In the index test domain, we considered one study to have a low risk of bias and the other study to be at unclear risk of bias. The Thurfjell study had low risk of bias because the threshold used, according to Thurfjell 2012 references, was established in the previous study in ADD and HC participants as a SUVR > 1.56 (Vandenberghe 2010), however, the SUVR used in this study was 1.5 and the index test results were interpreted without knowledge of the results of the reference standard. Regarding NCT01028053, the interpretation was made without knowledge of the reference standard, however the threshold was not clearly prespecified. In our two additional signalling questions, in the question on whether the index test was interpreted by a trained reader physician, this risk was unclear due to lack of information in the Thurfjell study, but no risk was identified in the NCT01028053 study. On the other hand, the other signalling question was rated as low risk in the Thurfjell study because there was a clear definition of a positive result, and unclear in NCT01028053 due to lack of information.
In the reference standard domain, we considered the Thurfjell study to have an unclear risk of bias because it was not reported if the clinicians conducting follow‐up were aware of the initial 18F‐flutemetamol result. We were not able to obtain the information about which reference standard was used, or how and by whom this reference standard was obtained, due to poor reporting (Thurfjell 2012). We judged NCT01028053, to be at a low risk of bias, because the reference standard used was NINCDS‐ADRDA (McKhann 1984) and the CAC were blinded to the 18F‐flutemetamol PET scan to established the reference standard.
In the flow and timing domain, we judged the Thurfjell study to have a high risk of bias because, in our additional signalling question, there were potential conflicts of interest due to financial support for the study (Vandenberghe 2010) and two authors of Thurfjell 2012 were employees from the manufacturer of the 18F‐flutemetamol tracer. We judged the NCT01028053 study as having a high risk of bias due to possible conflict of interest due to financial support by the 18F‐flutemetamol producer company.
For assessment of applicability, there was no concern that the included patients and setting, or the conduct and interpretation of the index test, did not match the review question; however, the target condition (as defined by the reference standard) was unclear due to lack to information about which reference standard(s) were applied and also the methodology used in the Thurfjell study (Thurfjell 2012). On the other hand, in NCT01028053, there was concern regarding the index test due to lack to information about the threshold and its definition.
Findings
The results of the included studies are summarised in Data table 1. Additionally, the summary of main results for the included studies are presented in the summary of findings Table.
18F‐flutemetamol for Alzheimer’s disease dementia (ADD)
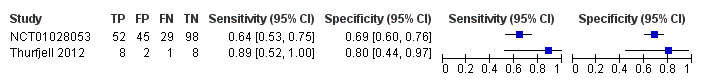
NCT01028053 data on 224 of 232 eligible participants with amnestic MCI (diagnosed with Petersen criteria (not clear which of them were used), using NINCDS‐ADRDA (McKhann 1984)) had a sensitivity of 64% (95% CI 53 to 75) and a specificity of 69% (95% CI 60 to 76) to predict the progression from amnestic MCI to ADD at three years follow‐up. Of 232 participants who were given an initial clinical diagnosis of amnestic MCI, the study had data on 224 of them at the follow‐up; 52 were true positive, 45 were false positive, 29 were false negative, and 98 were true negative (Figure 3).
Forest plot of 18F‐flutemetamol.
The criteria for 18F‐flutemetamol PET scan positivity was a visual assessment done by five blinded and trained readers, and they established the positivity or negativity of the PET scan according to the majority readings.
Thurfjell 2012 data on 19 of 20 eligible participants with amnestic MCI (diagnosed with Petersen criteria (Petersen 1999), using a nonspecified reference standard, probably NINCDS‐ADRDA (McKhann 1984) and APA 1994) had a sensitivity of 89% (95% CI 52 to 100) and a specificity of 80% (95% CI 44 to 97) to predict the progression from amnestic MCI to ADD at two years follow‐up. Of 20 participants who were given an initial clinical diagnosis of amnestic MCI, the study had data on 19 of them at the follow‐up; 8 were true positive, 2 were false positive, 1 was false negative and 8 were true negative (Figure 3).
The criterion for 18F‐flutemetamol PET scan positivity was a quantitative threshold with a SUVR > 1.5 and the measures of 18F‐flutemetamol amyloid retention were:; lateral frontal cortex (FRO), lateral temporal cortex (LTC), lateral parietal cortex (PAR), anterior cingulate (ANC), occipital cortex (OCC), and pons (PON); a cerebellar ROI served as the reference region.
No data were available regarding the other two target conditions in this Cochrane review: progression from MCI to another form of dementia (non‐ADD) or progression from MCI to any form of dementia.
Investigation of heterogeneity
The planned investigations were not possible due to the limited number of studies available for the analysis.
Sensitivity analyses
There were insufficient studies identified to permit any sensitivity analyses.
Discussion
Summary of main results
The volume and quality of evidence regarding the DTA of 18F‐flutemetamol for early diagnosis of ADD and other dementias in people with MCI is limited. We identified two studies in this SR. However, we were not able to construct a meta‐analysis. We did not perform sensitivity analyses and were not able to analyse the heterogeneity.
The two included studies addressed the DTA of 18F‐flutemetamol analysed quantitatively with a threshold of SUVR > 1.5 (Thurfjell 2012) or by visual assessment (NCT01028053) for the prediction of progression from MCI to ADD at follow‐up. The results are summarised in the 'Summary of findings' table (summary of findings Table). The studies were evaluated as at high risk of bias mainly due to the potential conflict of interest because of the financial support of the company that manufactured the 18F‐flutemetamol tracer. The study had no information about the progression to any form of dementia or any other form of dementia (non‐ADD). Regarding our objectives, to determine the DTA of the 18F‐flutemetamol PET scan for detecting participants with MCI at the time of performing the test who would clinically progress to ADD, or to other forms of dementia or any form of dementia at follow‐up, the results were the following:
18F‐flutemetamol PET scan for Alzheimer’s disease dementia (ADD)
Progression from MCI to ADD at three years of follow‐up by visual assessment had a sensitivity of 64% (95% CI 53 to 75) and a specificity of 69% (95% CI 60 to 76) respectively (n = 224) (Figure 3).
Progression from MCI to ADD at two years of follow‐up by quantitative assessment by SUVR had a sensitivity of 89% (95% CI 52 to 100) and a specificity of 80% (95% CI 44 to 97) respectively (n = 19) (Figure 3).
The DTA of18F‐flutemetamol includes a wide range of low‐to‐moderate and good sensitivity and specificity for predicting progression to ADD through visual or SUVR assessment evaluation at different follow‐up. In other words, the low‐to‐moderate or good sensitivity could be affected by a relatively high false negative rate, admittedly from only one study. As with other amyloid tracers, 18F‐flutemetamol probes the detection of amyloid plaques that are composed of insoluble Aβ peptides (EMA 2014; FDA 2014). However, the soluble Aβ oligomers play a central role in Alzheimer's pathogenesis in the amyloid hypothesis (Heyden 2013), with the possibility of producing false negatives. In addition, amyloid tracers are not be able to bind to the other histopathologic core of Alzheimer's disease ‐ the neurofibrillary tangles (NFTs). There is evidence that suggests that plaques and tangles independently contribute to cognitive impairment over the clinical course of Alzheimer's disease (Serrano‐Pozo 2013). Moreover, in another cohort study, the NFT formation might be either unrelated to amyloid plaques formation or a temporally distinct process, or both(Royall 2014). Another reason that could explain false negative results is that those with probable ADD may have multiple brain pathologies, most commonly Alzheimer's disease with macroscopic infarcts, followed by Alzheimer's disease with neocortical Lewy body disease, and, like ADD, MCI pathology could be heterogeneous (Schneider 2007; Schneider 2009).
In addition, the low‐to‐moderate or good specificity could be affected by a high false positive rate. A positive 18F‐flutemetamol PET scan for Aβ, has been found in other neurological conditions. It was positive in pure vascular dementia and Lewy body dementia cases confirmed by autopsy (Thal 2015). On the other hand, in other amyloid biomarkers like PET PiB, and closer to the 18F‐flutemetamol chemical composition, the false positive rate could be explained because it has affinity to amyloid in vessel walls, in particular to cerebral amyloid angiopathy (CAA) (Zhang 2014). We would think that the pathological diagnosis of some people with clinical probable ADD may be vascular dementia secondary to CAA and some MCI participants may have vascular MCI due to CAA. The other important option for a high false positive rate is that in many people without cognitive impairment it is possible to find Aβ deposits at their autopsies (Gelber 2012), generating some doubts about the real pathophysiological relevance of the Aβ hypothesis in Alzheimer's disease.
Another important factor to be considered in predicting the progression to ADD and the number of false positives is the duration of follow‐up, because the reported progression rate of MCI to ADD is between 8% and 16% per year (Mitchell 2009). Therefore, a high percentage of people with MCI at the time of performing the test would progress to Alzheimer’s disease if we had included a longer follow‐up period, and this would affect the predictive DTA of the 18F‐flutemetamol PET scan. However, the progression rate at two years was 47.4% and 36.2% at three years of follow‐up in the included studies. The latest was found in a systematic review with PiB PET where the data were separated into short follow‐up and longer than two years of follow‐up. They included five studies with 102 participants in total, with a specificity between 58% to 100% (Ma 2014). However, in our study, the follow‐up time and percentage of progression were discordant; the progression rate at two years was 47.4% and 36.2% at three years of follow‐up in the included studies. This difference is probably explained by the setting of recruitment or demographic or MCI characteristics and possibly other underlying factors that were affecting the data (Thurfjell 2012; NCT01028053). As a consequence, due to the lack of data, we were not able to investigate the effect of the follow‐up on the progression rate from MCI to ADD or any form of dementia.
On the other hand, MCI subtypes have been related to progression to dementia. A large longitudinal study with 550 MCI participants indicated that the MCI subtype, presence of storage memory impairment, multiple domain condition, and presence of APOE ϵ4 allele increased the risk of progression to dementia. Multivariate survival and Kaplan‐Meier analyses showed that amnestic MCI with storage memory impairment had the most and closest risk of progression to dementia (Espinosa 2013). In our review, both studies included only amnestic participants, therefore, we could predict a worse accuracy if non‐amnestic MCI were included. Additionally, some other risk factors like family history of dementia, APOE ϵ4 allele presence, and Aβ and tau protein levels in cerebrospinal fluid may contribute to a faster progression rate to dementia. In conclusion, further reviews that include high quality research with more detailed data about the characteristics of MCI are required to not only explore the underlying mechanisms but also to elucidate the causal pathways that link 18F‐flutemetamol PET scan positivity of diverse MCI subtypes and disease progression.
Strengths and weaknesses of the review
We conducted an extensive, comprehensive, and sensitive literature search, using eleven different electronic databases without any limit to language or date. However, we were only able to include two studies with 243 participants, therefore, our DTA estimates are relatively imprecise. This paucity of evidence reflects the very significant challenges inherent in conducting long term prospective studies of well‐characterised participants, followed up to the point of progression to clinical dementia. The methodological quality assessment and data syntheses were based on the recommended methods (Davis 2013). To increase the reliability of our findings, we included only studies that fulfilled delayed verification of progression from MCI to ADD or other form of dementia (non‐ADD) or any form of dementia at follow up.
The included studies had significant methodological limitations that weakened confidence in the results of this SR. First, considerable uncertainty remains concerning the clinical diagnosis of ADD; the anatomopathological diagnosis would be the better way to probe the diagnosis, but there was not a clear definition of a positive index test in one study, the reference standard in one study was not explicitly described, and the major problem was the potential conflict of interest with the company that produced the tracer in both studies.
The selection of participants with MCI in these studies could be another weakness, because we did not have all the necessary baseline data in the ClinicalTrials.gov registered study included in this SR (NCT01028053), and what would happen in those with non‐amnestic MCI in the future. However, this selection of participants, such as type of MCI, age, presence of the APOE ϵ4 allele, structural abnormality at MRI, hypometabolism at FDG‐PET scan, and alteration in cerebrospinal fluid could help determine different subgroups of people at higher risk of developing dementia at follow‐up, and perform a stratification that could help avoid biases, and develop more efficient studies in the future (Caroli 2015; Hampel 2012; Wolz 2016). NCT01028053 had some information about age, presence of the APOE ϵ4 allele, and amnestic MCI stage (early/late) in a Cox regression, but without useable data for this DTA review. The Thurfjell study tried to correlate SUVR and hippocampus volume (Thurfjell 2012).
Finally, an important weakness of this SR was the nonresponse of the authors about their studies. This has resulted in a lack of data for analysis in this review.
Applicability of findings to the review question
Regarding the question of this review: Could the 18F‐flutemetamol PET scan identify those MCI participants who would progress to clinical dementia at follow up?. There were applicability concerns in the index test in one study that did not provide a clear definition of what was considered a 18F‐flutemetamol positive result. There were also applicability concerns in the reference standard in one study, mainly due to lack of information regarding how the clinical progression to ADD was made. However, due to the limited number of included studies and levels of heterogeneity with respect to the two domains mentioned above, it was difficult to determine to what extent the findings from this review could be applied to clinical practice.
The DTA of the 18F‐flutemetamol PET scan for identifying Alzheimer’s disease pathology and identifying those people with MCI who would convert to ADD could be affected by a number of factors that have not been determined so far. First, and most important, is the lack of a large study to evaluate this question. We included only two studies that addressed the question with 243 participants at follow‐up. Second, the quantitative criterion used for several studies is not the actually approved criterion of FDA and EMA, because they approved the visual assessment interpretation. However, in this SR we included one study with quantitative evaluation and the other with visual assessment, with lack of information regarding how that visual assessment was made.
We await new studies using the FDA and EMA approval visual assessment criteria in longitudinal studies. The 18F‐flutemetamol test is expensive, therefore, we believe it is important to clearly determine its DTA prior to recommending its adoption in clinical practice. The actual sensitivity and specificity are too low to have enough accuracy to be used in clinical practice to predict the progression from MCI to ADD.
Risk of bias and applicability concerns summary: review authors' judgements about each domain for each included study
Forest plot of 18F‐flutemetamol.

| What is the diagnostic accuracy of 18F‐flutemetamol PET amyloid biomarker for predict progression to ADD in people with MCI? | |||||||
| Descriptive | |||||||
| Patient population | Participants diagnosed with MCI at the time of performing the test using any of the Petersen criteria or Winblad criteria or CDR = 0.5 or any of the 16 definitions included by Matthews (Matthews 2008). | ||||||
| Sources of referral | Not reported (n = 2) | ||||||
| MCI criteria | Petersen criteria (n = 2) | ||||||
| Sampling procedure | Unclear (n = 2) | ||||||
| Prior testing | The only testing prior to performing the 18F‐flutemetamol PET amyloid biomarker was the application of diagnostic criteria for identifying participants with MCI | ||||||
| Settings | Secondary care (n = 1) Not reported (n = 1) | ||||||
| Index test | 18F‐flutemetamol PET | ||||||
| Threshold pre‐specified at baseline | Yes (n=1) Unclear (n=1) | ||||||
| Threshold interpretation | Visual (n = 1) Quantitative (n = 1) | ||||||
| Thershold | SUVR (Standardised Uptake Volume ratio) of ROI: > 1.5 (n = 1) Not specified: analytical visual approach of ROI: (n = 1) | ||||||
| 18F‐flutemetamol retention region | Global cortex (n = 1) Not reported (n = 1) | ||||||
| Reference Standard | For Alzheimer’s disease dementia: NINCDS‐ADRDA (n = 1) Unclear (n = 1) | ||||||
| Target condition | Progression from MCI to Alzheimer’s disease dementia or any other forms of dementia (non‐ADD) or any form of dementia | ||||||
| Included studies | Prospectively well‐defined cohorts with any accepted definition of MCI (as above). Two studies (N = 252 participants) were included. Number of participants included in analysis: 243 | ||||||
| Quality concerns | Patient selection and index test QUADAS‐2 domain: unclear risk of bias Reference standard domain: low risk of bias Flow and timing domain: high risk of bias There were unclear concerns about applicability in the patient selection and index test domain. Patient selection and index test QUADAS‐2 domain: low risk of bias Reference standard domain: unclear risk of bias Flow and timing domain: high risk of bias. There was unclear concern about applicability in the reference standard domain. | ||||||
| Limitations | Limited investigation of heterogeneity and sensitivity analysis due to an insufficient number of studies. We were unable to evaluate progression from MCI to any other form of dementia (non‐ADD) or any form of dementia due to lack of included studies. | ||||||
| Test | Studies | Cases/Participants | Sensitivity | Specificity | Consequences in a cohort of 100 | ||
| Proportion converting1 | Missed cases2 | Overdiagnosed2 | |||||
| Alzheimer's disease dementia | |||||||
| 18F‐flutemetamol with visual assessment | 1 | 81/224 | 64% (95% CI 53% to 75%) | 69% (95% CI 60% to 76%) | 36 | 13 | 20 |
| 18F‐flutemetamol with SUVR | 1 | 9/19 | 89% (95% CI 52% to 100%) | 80% (95% CI 44% to 97%) | 47 | 5 | 11 |
| Investigation of heterogeneity and sensitivity analysis: The planned investigations were not possible due to the limited number of studies available for each analysis. | |||||||
| Conclusions:18F‐flutemetamol PET scan is not an accurate test for detecting progression from MCI to Alzheimer’s disease dementia. The strength of the evidence was weak because of considerable variation in study methods, unclear methodological quality due to poor reporting, and high risk of bias due to possible conflict of interest. There is a need for conducting studies using standardised 18F‐flutemetamol PET scan methodology in larger populations. | |||||||
| 1. Proportion converting to ADD in each included study 2. Missed and overdiagnosed numbers were computed using the proportion converting to the target condition. ADD: Alzheimer's disease dementia QUADAS‐2: Quality Assessment of Diagnostic Accuracy Studies‐2 | |||||||
| Test | No. of studies | No. of participants |
| 1 18F‐flutemetamol Show forest plot | 2 | 243 |