| What is the diagnostic accuracy of 18F‐florbetaben PET amyloid biomarker for predict progression to ADD or any other form of dementia (non‐ADD) or any form of dementia in people with MCI? |
| Descriptive | |
| Patient population | Participants diagnosed with MCI at baseline using any of the Petersen criteria or Winblad criteria or CDR = 0.5 or any 16 definitions included by Matthews (Matthews 2008) |
| Sources of referral | Memory clinic |
| MCI criteria | Petersen criteria 2004 and Winblad 2004 (Petersen 2004; Winblad 2004) |
| Sampling procedure | unclear |
| Prior testing | The only testing prior performing the 18F‐florbetaben PET amyloid biomarker was the application of diagnostic criteria for identifying participants with MCI |
| Settings | Secondary care |
| Index test | 18F‐florbetaben PET |
| Threshold prespecified at baseline | Yes |
| Threshold interpretation | Visual and quantitative |
| Threshold | Visual: if any tracer uptake was visible in any of the frontal, parietal, temporal, and posterior cingulate/precuneus cortices SUVR (Standardised Uptake Volume ratio) of ROI: > 1.45 |
| 18F‐florbetaben retention region | Visual: frontal, parietal, temporal, and posterior cingulate/precuneus cortices Global cortex (SUVR) SUVR: Global cortex |
| Reference Standard | For Alzheimer’s disease dementia: NINCDS‐ADRDA (McKhann 1984) For Lewy body dementia: McKeith criteria (McKeith 2005) For frontotemporal dementia: Lund criteria (Brun 1994) For progressive supranuclear palsy: Preliminary NINDS criteria (Hauw 1994) |
| Target condition | Progression from MCI to Alzheimer’s disease dementia or any other forms of dementia or any form of dementia. |
| Included studies | Prospectively well‐defined cohorts with any accepted definition of MCI (as above). One study (N = 45 participants) was included. Number of participants included in analysis: 45. |
| Quality concerns | Patient characteristics were poorly reported. Reference standard diagnosis was made with knowledge of the index test. Applicability concerns were high in reference standard. |
| Limitations | We were not able to calculate a summary of sensitivity and specificity due to insufficient number of studies. Investigation of heterogeneity and sensitivity analysis were not done due to insufficient number of studies. |
| Test | Studies | Cases/Participants | Sensitivity | Specificity | Consequences in a cohort of 100 |
| Proportion converting1 | Missed cases2 | Overdiagnosed |
| Alzheimer's disease dementia | |
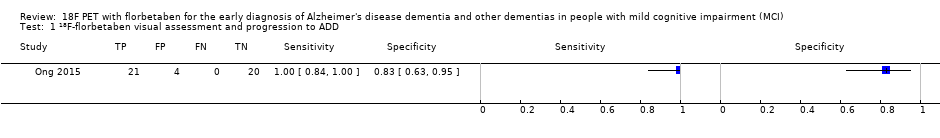
| 18F‐florbetaben (visual assessment) | 1 | 21/45 | 100% (95% CI 84% to 100%) | 83% (95% CI 63% to 95%) | 47 | 0 | 9 |
| 18F‐florbetaben (SUVR) | 1 | 21/45 | 100% (95% CI 84% to 100%) | 88% (95% CI 68% to 97%) | 47 | 0 | 6 |
| Any other form of dementia (non‐ADD) | |
| 18F‐florbetaben (visual assessment) | 1 | 5/45 | 0% (95% CI 0% to 52%) | 38% (95% CI 23% to 54%) | 11 | 11 | 55 |
| 18F‐florbetaben (SUVR) | 1 | 5/45 | 0% (95% CI 0% to 52%) | 40% (95% CI 25% to 57%) | 11 | 11 | 53 |
| Any form of dementia | |
| 18F‐florbetaben (visual assessment) | 1 | 26/45 | 81% (95% CI 61% to 93%) | 79% (95% CI 54% to 94%) | 58 | 11 | 9 |
| 18F‐florbetaben (SUVR) | 1 | 26/45 | 81% (95% CI 61% to 93%) | 84% (95% CI 60% to 97%) | 58 | 11 | 7 |
| Investigation of heterogeneity and sensitivity analysis: The planned investigations of heterogeneity or sensitivity analyses were not possible due to a limited number of studies available for each analysis. |
| Conclusions:18F‐florbetaben PET scan has a good sensitivity achieved especially in predicting the progression from MCI to ADD. The quality of evidence was weak because it was based on only one study (45 participants) and there was high risk of bias due to the knowledge of the reference standard to do the diagnosis at four‐year follow‐up and due to possible conflict of interest detected. There is a need for conducting studies using standardised 18F‐florbetaben PET scan methodology in larger populations. Regarding the aforementioned we do not recommend the use in clinical practice until the DTA performance will be clearly demonstrated. |