ผลของการตั้งครรภ์หลังจากการให้การรักษารอยโรคที่ปากมดลูกในระยะก่อนเป็นมะเร็งและมะเร็งระยะแรก
บทคัดย่อ
บทนำ
อายุเฉลี่ยของสตรีที่ได้รับการรักษารอยโรคปากมดลูกก่อนระยะรุกราน (ปากมดลูกมะเร็งเยื่อบุผิวภายใน CIN) หรือมะเร็งปากมดลูกระยะแรก (ระยะ IA1) เป็นวัย 30 ปีซึ่งเป็นวัยคล้ายกับอายุสตรีที่มีลูกคนแรก การรักษาปากมดลูกแบบเฉพาะที่สัมพันธ์กับการเจ็บป่วยในระบบสืบพันธุ์ที่ไม่พึงประสงค์ในการตั้งครรภ์ตามมา อย่างไรก็ตาม การเผยแพร่การศึกษาและการวิเคราะห์เมตายังมีข้อสรุปที่ขัดแย้ง
วัตถุประสงค์
การประเมินผลการรักษาปากมดลูก CIN และมะเร็งปากมดลูกระยะแรกต่อผลของการตั้งครรภ์ (หลัง 24 สัปดาห์ของการตั้งครรภ์) และการเชื่อมโยงผลนี้ต่อการตัดปากมดลูกแบบทรงกรวยลึกและกลุ่มเปรียบเทียบที่ใช้
วิธีการสืบค้น
เราค้นฐานข้อมูลต่อไปนี้: Cochrane Central Register of Controlled Trials (CENTRAL; the Cochrane Library, 2017, Issue 5), MEDLINE (up to June week 4, 2017) and Embase (up to week 26, 2017) ในความพยายามที่จะหาบทความที่หายไป หรือที่ไม่ได้ตีพิมพ์ เราติดต่อผู้เชี่ยวชาญและเราค้นหาจากเอกสารอ้างอิงและเอกสารการประชุมด้วยมือ
เกณฑ์การคัดเลือก
เรารวมการศึกษารายงานทั้งหมดที่รายงานผลของการตั้งครรภ์ (มากกว่า 24 สัปดาห์ของการตั้งครรภ์) ในสตรีที่ได้รับ หรือไม่ ได้รับการรักษาในทุกๆระยะ ของ CIN หรือมะเร็งปากมดลูกระยะแรก (ระยะ IA1) การรักษารวมทั้ง excisional และวิธีระเหย เรารวมการศึกษาที่มีประชากรไม่อ้างอิงได้รับการรักษา รายงานผลในสตรีที่ได้รับการรักษาในระหว่างตั้งครรภ์ หรือมีกลุ่มบำบัดหรือเปรียบเทียบที่มีความเสี่ยงสูง หรือทั้งสอง
การรวบรวมและวิเคราะห์ข้อมูล
เราจัดการศึกษาตามประเภทของการรักษาและผลลัพธ์ทางสูติกรรม การศึกษาถูกจัดประเภทตามวิธีการรักษาและผลลัพธ์ทางสูติกรรม อัตราเสี่ยงทั้งหมด (RR) และความเชื่อมั่น 95% ช่วง (CIs) ถูกคำนวณโดยใช้ a random‐effects model and inverse variance ประเมิน heterogeneity ระหว่างการศึกษาด้วยสถิติ I2 เราประเมินผลทางด้านของมารดาได้แก่การคลอดก่อนกำหนด (PTB) (เกิดขึ้นเอง และคุกคาม) น้ำเดินก่อนกำหนด (pPROM) ถุงน้ำคร่ำอักเสบ ช่องทางการคลอด ความยาวของการเจ็บครรภ์คลอด การกระตุ้นคลอด การใช้ยา oxitocin การตกเลือด การใช้ยาแก้ปวด การเย็บปากมดลูก และปากมดลูกตีบ ผลทางด้านทารกเมื่อคลอดได้แก่ ทารกแรกเกิดน้ำหนักน้อย (LBW) การนอนรักษาในห้อง NICU ทารกตายคลอด การตายปริกำเนิด และคะแนนแอพการ์
ผลการวิจัย
เรารวมการศึกษา 69 ( 6,357,823:65,098 ตั้งครรภ์ได้รับการรักษา และ 6,292,725 ของสตรีที่ไม่ได้รับการรักษา) การศึกษาหลายการศึกษามีสตรีในการศึกษาจำนวนน้อย รูปแบบการศึกษาหลากหลาย และส่วนใหญ่เป็นการศึกษาย้อนหลัง ดังนั้นจึงมีความเสี่ยงในเรื่องอคติสูง ผลลัพธ์หลายอย่างถูกประเมินว่าคุณภาพต่ำ หรือต่ำมาก (ประเมินโดยใช้ GRADE) และดังนั้น ผลลัพธ์ควรจะตีความ ด้วยความระมัดระวัง การรักษาเพิ่มความเสี่ยงโดยรวมของการคลอดก่อนกำหนด (PTB) (น้อยกว่า 37 สัปดาห์) (10.7% กับ 5.4%, RR 1.75, 95% CI 1.57 ถึง 1.96 การศึกษา 59 เรื่อง ผู้เข้าร่วม 5,242,917 ราย คุณภาพต่ำมาก) รุนแรง (น้อยกว่า 32‐34 สัปดาห์) (3.5% เมื่อเทียบกับ 1.4%, RR 2.25 , 95% CI 1.79 ถึง 2.82) การศึกษา 24 เรื่อง มีผู้เข้าร่วม 3,793,874 ราย คุณภาพต่ำมาก) และคลอดก่อนกำหนดมาก (น้อยกว่า 28‐30 สัปดาห์) (1.0% กับ 0.3%, (RR 2.23, 95% CI 1.55 ถึง 3.22 การศึกษา 8 เรื่อง ผู้เข้าร่วม 3,910,629 รายคุณภาพต่ำมาก) เมื่อเทียบกับสตรีที่ไม่ได้รับการรักษา
ความเสี่ยงโดยรวมของ prematurity สูงใน excisional (ผ่าตัดเล็กและไม่มีการรักษา: 11.2% เมื่อเทียบกับ 5.5%, RR 1.87, 95% CI 1.64 ถึง 2.12 การศึกษา 53 เรื่อง ผู้เข้าร่วม 4,599,416 ราย) กว่าการระเหย (การระเหยเมื่อเทียบกับไม่มีการรักษา: 7.7% เทียบกับ 4.6%, RR 1.35, 95% CI 1.20 ถึง 1.52 การศึกษา 14 เรื่อง ผู้เข้าร่วม 602,370 ราย) การรักษาและผลกระทบจาการรักษารุนแรงมากขึ้นสำหรับเทคนิค excisional (น้อยกว่า 37 สัปดาห์: เลเซอร์เย็นมีด conisation (CKC) (RR 2.70, 95% CI 2.14 3.40 การศึกษา 12 เรื่อง ผู้เข้าร่วม 39,102 คน) laser conisation (LC) (RR 2.11, 95% CI1.26 ถึง 3.54 การศึกษา 9 เรื่อง ผู้เข้าร่วม 1509 ราย) ห่วงใหญ่จี้การแปลงโซน (LLETZ) (RR 1.58, 95% CI 1.37 ถึง 1.81 การศึกษา 25 เรื่อง ผู้เข้าร่วม 1,445,104 ราย) การรักษาซ้ำเพิ่มความเสี่ยงของ prematurity โดยรวม (การรักษาซ้ำกับไม่มีการรักษา: 13.2% และ 4.1%, RR 3.78, 95% CI 2.65 ถึง 5.39 การศึกษา 11 เรื่อง ผู้เข้าร่วม 1,317,284 ราย คุณภาพต่ำมาก) ความเสี่ยงโดยรวมของ prematurity เพิ่มขึ้น ด้วยการเพิ่มความลึกของกรวยที่ตัด (น้อยกว่า 10 มม.ถึง 12 มม.เมื่อเทียบกับไม่มีการรักษา: 7.1% เมื่อเทียบกับ 3.4%, RR 1.54, 95% CI 1.09 ถึง 2.18, การศึกษา 8 เรื่อง ผู้เข้าร่วม 550,929 ราย คุณภาพต่ำมาก: มากกว่า 10 มม.ถึง 12 มม.เมื่อเทียบกับไม่มีการรักษา: 9.8% เมื่อเทียบกับ 3.4%, RR 1.93, 95% CI 1.62 ถึง 2.31 การศึกษา 8 เรื่อง ผู้เข้าร่วม 552,711 ราย คุณภาพต่ำ; มากกว่า 15 มม.ถึง 17 มม.เมื่อเทียบกับไม่มีการรักษา: 10.1 เมื่อเทียบกับ 3.4%, RR 2.77, 95% CI 1.95 ถึง 3.93 การศึกษา 4 เรื่อง ผู้เข้าร่วม 544,986 ราย คุณภาพต่ำมาก; 20 มิลลิเมตรหรือมากกว่าเมื่อเทียบกับไม่มีการรักษา: 10.2% เมื่อเทียบกับ 3.4%, RR 4.91, 95% CI 2.06 ถึง 11.68, การศึกษา 3 เรื่อง ผู้เข้าร่วม 543,750 ราย คุณภาพต่ำมาก) กลุ่มเปรียบเทียบส่งผลต่อขนาดของผลลัพธ์นั่นคือตัวเปรียบเทียบภายนอกสูงกว่า แล้วตามด้วยตัวเปรียบเทียบภายใน และสตรีที่มีโรค แต่ไม่มีการรักษา สตรีที่ไม่ได้รับการรักษาโรคและการรักษาก่อนตั้งครรภ์ของสตรีที่ได้รับการรักษาต่อมามีความเสี่ยงโดยรวมสูงของ prematurity มากกว่าประชากรทั่วไป (5.9% เมื่อเทียบกับ 5.6%, RR 1.24, 95% CI 1.14 ถึง 1.34 การศึกษา 15 เรื่อง ผู้เข้าร่วม 4,357,998 ราย คุณภาพต่ำมาก )
pPROM (6.1% กับ 3.4%, RR 2.36, 95% CI 1.76 ถึง 3.17 การศึกษา 21 เรื่อง ผู้เข้าร่วม 477,011 ราย คุณภาพต่ำมาก) น้ำหนักน้อยเมื่อคลอด (7.9% เทียบกับ 3.7%, RR 1.81, 95% CI 1.58 ถึง 2.07 การศึกษา 30 เรื่อง ผู้เข้าร่วม 1,348,206 ราย คุณภาพต่ำมาก) อัตราเข้า NICU (12.6% และ 8.9%, RR 1.45, 95% CI 1.16 ถึง 1.81 การศึกษา 8 เรื่อง ผู้เข้าร่วม 2557 ราย คุณภาพต่ำ) และการตายปริกำเนิด (0.9% เมื่อเทียบกับ 0.7%, RR 1.51, 95% CI 1.13 ถึง 2.03 การศึกษา 23 เรื่อง ผู้เข้าร่วม 1,659,433 ราย คุณภาพต่ำ) ได้เพิ่มขึ้นหลังการรักษา
ข้อสรุปของผู้วิจัย
สตรีที่มี CIN มีความเสี่ยงพื้นฐานสูงต่อการคลอด prematurity Excisional และการระเหยจะเพิ่มความเสี่ยงที่มากขึ้น ความถี่และความรุนแรงของอาการไม่พึงประสงค์ที่เกิดตามมาเพิ่มขึ้นสัมพันธ์กับความลึกของการตัดกรวย และสูงมากกว่าในการผ่าตัดเมื่อเทียบกับการระเหย อย่างไรก็ตาม ผลลัพธ์ควรจะตีความ ด้วยความระมัดระวัง ตามที่การศึกษามีคุณภาพต่ำ หรือต่ำมาก (ประเมินโดยใช้ GRADE) ซึ่งส่วนใหญ่เป็นการศึกษาย้อนหลัง
PICO
ข้้อสรุปภาษาธรรมดา
ผลของการตั้งครรภ์หลังจากการให้การรักษารอยโรคที่ปากมดลูกในระยะก่อนเป็นมะเร็ง
ประเด็นปัญหา
รอยโรคที่ปากมดลูกในระยะก่อนเป็นมะเร็ง หรือ Cervical intra‐epithelial neoplasia (CIN) คือ รอยโรคที่ปากมดลูกในระยะก่อนเป็นมะเร็ง (คอของมดลูก) โดยเกิดจากเชื้อไวรัส HPV ซึ่งอาจพัฒนาไปเป็นมะเร็งปากมดลูกถ้าไม่ได้รับการรักษา การรักษาเฉพาะที่ (Local treatment) เกี่ยวข้องกับการทำลายหรือการตัดบริเวณที่ผิดปกติที่ปากมดลูก ถ้าต้องการตั้งครรภ์ปากมดลูกที่เหลือและมดลูกจะคงความสามารถพยุงการตั้งครรภ์ในอนาคต ชนิดของการรักษาเฉพาะที่อาจเหมาะสมสำหรับมะเร็งระยะต้นๆ (stage IA1) ถ้าขนาดก้อนเล็กและแทบไม่มีแนวโน้มกระจายเกินปากมดลูก มีหลายการศึกษาที่ประเมินเรื่องการรักษาเฉพาะที่สำหรับรอยโรคที่ปากมดลูกในระยะก่อนเป็นมะเร็งและรอยโรคลุกลามระยะแรกต่อความเสี่ยงในการเกิดการคลอดก่อนกำหนด (PTB) ในการตั้งครรภ์หลังจากรักษา อย่างไรก็ตาม ยังไม่มีข้อสรุปที่ชัดเจน ทำให้เกิดความสับสนทั้งต่อแพทย์และสตรีที่ได้รับคำแนะนำให้รักษาแต่ต้องการตั้งครรภ์ในอนาคต
จุดมุ่งหมายของรีวิว
เรามุ่งที่จะประเมินว่าเทคนิครักษาเฉพาะที่สำหรับรอยโรคที่ปากมดลูกในระยะก่อนเป็นมะเร็ง (CIN) และมะเร็งระยะแรกเพิ่มความเสี่ยงของภาวะแทรกซ้อนสำหรับแม่และเด็กระหว่างการตั้งครรภ์หลังการรักษา โดยเฉพาะอย่างยิ่งการรักษาเกี่ยวข้องกับการเพิ่มความเสี่ยงของ PTB นอกจากนี้เรายังศึกษาว่าความเสี่ยงของ PTB ที่เพิ่มขึ้นเกี่ยวข้องกับจำนวนของเนื้อเยื่อปากมดลูกที่ถูกตัดออกหรือไม่อย่างไร
เกณฑ์การเลือก
เรารวมการศึกษาทั้งหมดที่ตรวจสอบผลของการรักษา CIN และมะเร็งปากมดลูกระยะแรกในช่วงปลายผลการตั้งครรภ์ (เกิน 24 สัปดาห์ของการตั้งครรภ์) ในสตรีที่ได้รับการรักษา CIN และมะเร็งปากมดลูกระยะแรกก่อนหน้านี้เทียบกับสตรีที่ไม่ได้รับการรักษา เราตัดการศึกษาที่กลุ่มเปรียบเทียบไม่ได้รับการรักษาออก การศึกษารายงานผลการตั้งครรภ์ในสตรีที่เคยได้รับการรักษาในระหว่างตั้งครรภ์ หรือมีความเสี่ยงสูงในการรักษาเป็นกลุ่มเปรียบเทียบหรือทั้งสอง
ผลการค้นพบหลักคืออะไรบ้าง
เรารวม 69 การศึกษา (ตั้งครรภ์ 6,357,823:65,098 ตั้งครรภ์ที่่ได้รับการรักษา และ 6,292,725 ของสตรีไม่ได้รับการรักษา) การรักษาสัมพันธ์กับการเพิ่มความเสี่ยงของ PTB ก่อนตั้งครรภ์ 37 สัปดาห์ รวมทั้งเพิ่มความเสี่ยงของ PTB อายุครรภ์น้อย (น้อยกว่าตั้งครรภ์ 32‐34 สัปดาห์) PTB อายุครรภ์น้อยมาก (น้อยกว่าตั้งครรภ์ 28 ถึง 30 สัปดาห์) และ pPROM (ถุงน้ำคร่ำแตกก่อนการเจ็บครรภ์ในอายุครรภ์ก่อนกำหนด) เมื่อเทียบกับสตรีที่ไม่ได้รับการรักษา ความเสี่ยงโดยรวมของ PTB สูงขึ้นในสตรีที่รับการรักษา โดยวิธี excisional (เนื้อเยื่อถูกตัดออกไป) มากกว่า โดยระเหยบำบัด (เนื้อเยื่อถูกทำลายแทนที่จะถูกตัดออกไป) ให้หลายการรักษารวมถึงการตัดเนื้อเยื่อออกมากในเวลาของการรักษา เกี่ยวข้องกับความเสี่ยงโดยรวมของ PTB อย่างไรก็ตาม สตรีที่มี CIN ที่ไม่ได้รักษาก็มีความเสี่ยงสูงของ PTB โดยรวมมากกว่าประชากรทั่วไป ทารกแรกเกิดน้ำหนักน้อย (LBW) < 2500 กรัม) การนอนรักษาในห้อง NICU และอัตราการตายปริกำเนิดยังพบว่าจะเพิ่มขึ้นหลังการรักษา
คุณภาพของหลักฐานคืออะไร
เนื่องจากรูปแบบของการให้การรักษาและผลของการรักษา เราสามารถรวบรวมได้เฉพาะการศึกษาเชิงพรรนณา ซึ่งส่วนใหญ่เป็นการศึกษาย้อนหลังเท่านั้น ชนิดของการศึกษาเหล่านี้มีคุณภาพต่ำกับระดับของความแปรปรวนสูงระหว่างการศึกษา ดังนั้นระดับของหลักฐานส่วนใหญ่ของผลการศึกษาถือได้ว่าคุณภาพต่ำ หรือต่ำมาก
ข้อสรุปคืออะไร
สตรีที่มี CIN มีพื้นฐานความเสี่ยงสูงสำหรับ PTB มากกว่าประชากรทั่วไปและการรักษา CIN อาจเพิ่มความเสี่ยงอื่นๆ ความเสี่ยงสำหรับ PTB อาจจะสูงขึ้นมากกว่าเมื่อใช้เทคนิค excisional เทียบการระเหยบำบัด นอกจากนี้ ความเสี่ยงของ PTB จะเพิ่มขึ้นเมื่อให้การรักษาหลายแบบและตัดเนื้อเยื่อออกมาก อย่างไรก็ตาม ผลลัพธ์เหล่านี้ควรจะตีความ ด้วยความระมัดระวังเนื่องจากคุณภาพโดยรวมของการศึกษาต่ำ และต่ำมาก
Authors' conclusions
Summary of findings
| The effect of treatment for CIN on maternal outcomes | ||||||
| Patient or population: women with known obstetric outcomes | ||||||
| Outcomes | Anticipated absolute effects* (95% CI) | Relative effect | № of participants | Quality of the evidence | Comments | |
| Risk with [comparison] | Risk with [intervention] | |||||
| PTB (< 37 w) | Study population | RR 1.75 | 5,242,917 | ⊕⊝⊝⊝ | ||
| 54 per 1000 | 95 per 1000 | |||||
| PTB (< 32 to 34 w) | Study population | RR 2.25 | 3,793,874 | ⊕⊝⊝⊝ | ||
| 14 per 1000 | 32 per 1000 | |||||
| PTB (< 28 to 30 w) | Study population | RR 2.23 | 3,910,629 | ⊕⊝⊝⊝ | ||
| 3 per 1000 | 7 per 1000 | |||||
| PTB (< 37 w) ‐ Repeat cones versus No Treatment | Study population | RR 3.78 | 1,317,284 | ⊕⊝⊝⊝ | ||
| 41 per 1000 | 156 per 1000 | |||||
| pPROM (<3 7 w) | Study population | RR 2.36 | 477,011 | ⊕⊝⊝⊝ | ||
| 34 per 1000 | 80 per 1000 | |||||
| PTB (< 37 w) ‐ Depth ≤ 10 mm to 12 mm versus No Treatment | Study population | RR 1.54 | 550,929 | ⊕⊝⊝⊝ | ||
| 34 per 1000 | 53 per 1000 | |||||
| PTB (< 37 w) ‐ PTB (< 37 w) ‐ Depth ≥10 mm to 12 mm versus No Treatment | Study population | RR 1.93 | 552,711 | ⊕⊕⊕⊝ | ||
| 34 per 1000 | 66 per 1000 | |||||
| PTB (< 37w) ‐ PTB (<37w) ‐ Depth ≥15 to 17mm versus No Treatment | Study population | RR 2.77 | 544,986 | ⊕⊕⊕⊕ | ||
| 34 per 1000 | 94 per 1000 | |||||
| PTB (< 37 w) ‐ PTB (< 37 w) ‐ Depth ≥ 20 mm versus No Treatment | Study population | RR 4.91 | 543,750 | ⊕⊕⊕⊕ | ||
| 34 per 1000 | 167 per 1000 | |||||
| *The risk in the intervention group (and its 95% confidence interval) is based on the assumed risk in the comparison group and the relative effect of the intervention (and its 95% CI). | ||||||
| GRADE Working Group grades of evidence | ||||||
| 1 Low‐quality evidence (based on observational studies only) is downgraded one level because of considerable heterogeneity (I2 90%) 2 Low‐quality evidence (based on observational studies only) is downgraded one level because of considerable heterogeneity (I2 83%) and suspected publication bias 3 Low‐quality evidence (based on observational studies only) is downgraded one level because of considerable heterogeneity (I2 84%) 4 Low‐quality evidence (based on observational studies only) is downgraded one level because of considerable heterogeneity (I2 75%) 5 Low‐quality evidence (based on observational studies only) is downgraded one level because of considerable heterogeneity (I2 79%) 6 Low‐quality evidence (based on observational studies only) is downgraded one level because of substantial heterogeneity (I2 67%) 7 Low‐quality evidence (based on observational studies only); heterogeneity was low (I2 37%) 8 Low‐quality evidence (based on observational studies only) is downgraded one level because of moderate heterogeneity (I2 53%) 9 Low‐quality evidence (based on observational studies only) is downgraded one level because of considerable heterogeneity (I2 77%) | ||||||
| The effect of treatment for CIN on neonatal outcomes | ||||||
| Patient or population: women with known obstetric outcomes | ||||||
| Outcomes | Anticipated absolute effects* (95% CI) | Relative effect | № of participants | Quality of the evidence | Comments | |
| Risk with No Treatment | Risk with Treatment | |||||
| LBW (< 2500 g) ‐ Treatment versus No Treatment | Study population | RR 1.81 | 1,348,206 | ⊕⊝⊝⊝ | ||
| 37 per 1000 | 66 per 1000 | |||||
| NICU Admission ‐ Treatment versus No Treatment | Study population | RR 1.45 | 2557 | ⊕⊕⊝⊝ | ||
| 89 per 1000 | 130 per 1000 | |||||
| Perinatal Mortality ‐ Treatment versus No Treatment | Study population | RR 1.51 | 1,659,433 | ⊕⊕⊝⊝ | ||
| 7 per 1000 | 11 per 1000 | |||||
| *The risk in the intervention group (and its 95% confidence interval) is based on the assumed risk in the comparison group and the relative effect of the intervention (and its 95% CI). | ||||||
| GRADE Working Group grades of evidence | ||||||
| 1 Low‐quality evidence (based on observational studies only) is downgraded one level because of substantial heterogeneity (I2 63%) | ||||||
Background
Description of the condition
Cervical cancer remains the commonest gynaecological malignancy worldwide, and accounts for 7.5% of female cancer deaths. Over half a million new cases are diagnosed each year around the world, with the vast majority occurring in the developing world, where a woman's risk of cervical cancer by age 74 is almost double that in the developed world (1.6% versus 0.9%) (Ferlay 2015).The introduction of cervical screening programmes over the last 20 years has produced a profound decrease in the incidence and mortality from cervical cancer (Arbyn 2009; Quinn 1999). This is due to the treatment of pre‐invasive lesions, cervical intra‐epithelial neoplasia (CIN), detected by screening (IARC 2005).
CIN is an abnormality in the squamous cells of the cervix and, if left untreated, cervical cancer may develop. The condition is asymptomatic and interventions are usually performed only on women with higher grade CIN of grade (CIN 2 or 3). This is because cervical treatment has been correlated with adverse obstetric sequelae (Kyrgiou 2006), while many of the low‐grade lesions (also known as LSIL, low‐grade squamous intra‐epithelial lesions or CIN 1) resolve spontaneously in young individuals (NHS Cervical Screening Programme 2016).
The average age of a woman diagnosed and treated for CIN is between 25 and 30 years of age, although it may occur in women considerably younger (NHS Cervical Screening Programme 2016). As the pre‐cancerous lesions typically occur in young women of reproductive age, the impact of their treatment on the outcomes of subsequent pregnancies has been an area of active research for the past decade. Whilst it is paramount that effective treatment is undertaken, it is also important that this treatment has minimal adverse effects on future fertility and pregnancy outcomes for this young female population.
Description of the intervention
The conservative methods for treatment of CIN are classified into excisional and ablative. These techniques remove or destroy the transformation zone (TZ) containing the abnormal cells whilst preserving cervical function. Excisional methods include cold knife conisation (CKC), laser conisation (LC), needle excision of the transformation zone (NETZ), also known as straight wire excision of the transformation zone (SWETZ), large loop excision of the transformation zone (LLETZ) (Kitchener 1995; Prendiville 1989), also known as loop electrosurgical excisional procedure (LEEP) and Fischer cone biopsy excisor (FCBE). Ablative methods include laser ablation (LA), radical diathermy (RD), cold coagulation (CC) and cryotherapy (CT).
The mean age of women undergoing treatment for pre‐invasive cervical disease is around their 30s and similar to the age of women having their first child (Herbert 2000; Paraskevaidis 1992). Local cervical treatment has been correlated with an increased risk of preterm birth, perinatal morbidity and mortality in a subsequent pregnancy (Albrechtsen 2008; Arbyn 2008; Bruinsma 2011; Kyrgiou 2006; Kyrgiou 2014; Noehr 2009a). The underlying mechanism is unclear; hypotheses include immunomodulation relating to human papillomavirus (HPV) infection affecting parturition pathways, unexplained confounders in women with CIN and acquired ‘mechanical weakness’ secondary to loss of cervical tissue (Kyrgiou 2012).
In England alone in 2013 to 2014, 3.6 million women aged between 25 and 64 years attended for cervical screening and over 23,800 cervical procedures were carried out (CervicalCancerScreening 2015), the vast majority in an outpatient setting. In contrast in the USA, there are approximately 400,000 cases of pre‐invasive disease per year (Henk 2010). The regulations in colposcopy are more liberal than in the UK leading to wide variation in clinical practice. In Germany, treatment for CIN is still commonly performed with the cold knife under general analgesia (Petry 2008). The long‐term sequelae of treatment remains therefore an important international issue to both healthcare professionals and women, whatever the clinical setting.
How the intervention might work
The characteristics of the conservative methods of treatment are well‐described and established in the medical literature (Martin‐Hirsch 2013). LLETZ, LC and LA are usually performed under local anaesthesia in an outpatient setting, while CKC requires general anaesthesia and hospitalisation. Theoretically, the excisional techniques (CKC, LC, NETZ, LLETZ, FCBE) are superior over ablative techniques (LA, RD, CC, CT) as they allow a comprehensive histological evaluation of the excised tissue and the whole TZ with precise evaluation of excision margins. Ablative techniques destroy the TZ epithelium and preclude histological evaluation and, therefore, demand accurate pre‐treatment biopsy at a separate visit. LLETZ is the most favoured technique (Kitchener 1995), by combining all the advantages of the excisional techniques mentioned above together with a relatively shorter duration, low cost, good compliance, simplicity and easier learning curve for practitioners.
The best available evidence suggests that these methods (CKC, LC, LLETZ, LA) present similar low morbidity and are equally successful, in terms of eradicating CIN (Martin‐Hirsch 2013; Nuovo 2000) and in preventing invasive cervical cancer (Chew 1999; Paraskevaidis 1991; Soutter 1997). However, the existing data regarding future fertility and pregnancy outcomes are conflicting.
Why it is important to do this review
Observational studies have indicated that the treatment of CIN could have detrimental effects on fertility and pregnancy outcome; although the conclusions are usually equivocal, perhaps due to the weakness associated with small sample sizes used in the studies. We have not found any published randomised controlled trials (RCTs) comparing pregnancy outcome between treated and untreated women in the literature and because of the pre‐malignant nature of the condition treated, it is perhaps unlikely that one will be ever conducted. Thus, the only available level of evidence on this subject may have to be provided by systematic reviews and meta‐analyses of observational studies.
Media publicity has heightened public awareness that treatment for cervical precancer is associated with an increased reproductive morbidity. There has been a substantial increase in enquiries from patients and clinicians on the risks associated with different treatment techniques and cone depths (Founta 2010; Kyrgiou 2015a), and as to how this risk may be managed and prevented. With a rapidly evolving evidence base and lack of a robust synthesis of the published literature, these questions are becoming increasingly difficult to answer.
Since the first systematic review of the reproductive risk associated with treatment almost a decade ago (Kyrgiou 2006), more than 50 observational studies have been published confirming (Jakobsson 2007; Ortoft 2010) or disputing these associations (Castanon 2012; Reilly 2012); some of these reporting data from large population‐based datasets. Individual attempts to synthesise parts of this rapidly evolving evidence base in small systematic reviews and meta‐analyses reached contradictory conclusions (Arbyn 2008; Bruinsma 2011; Conner 2014; Crane 2003; Danhof 2015; Jin 2014; Kyrgiou 2006; Kyrgiou 2014;) and initiated debates and confusion within the scientific community (Arbyn 2008; Conner 2014; Crane 2003; Danhof 2015; Jin 2014). Whether these discrepancies were due to questionable quality of some of these primary and secondary studies or differences in the explored comparisons (Bruinsma 2011; Conner 2014; Danhof 2015; Jin 2014), the subject is open to a definitive comprehensive high‐quality synthesis of the existing evidence that will be highly informative to women, clinicians and policy makers (Arbyn 2008; Bruinsma 2011; Conner 2014; Danhof 2015; Jin 2014; Kyrgiou 2014). Because many large studies (Albrechtsen 2008; Bruinsma 2007; Castanon 2012; Heinonen 2013; Jakobsson 2007; Jakobsson 2009; Noehr 2009a; Ortoft 2010; Reilly 2012; Shanbhag 2009) have been published since Kyrgiou's first meta‐analysis (Kyrgiou 2006), we decided to update it in order to incorporate the latest studies and pay attention especially to the effect of the comparison group and the depth of the excised cone; two areas on which other meta‐analyses do not emphasise.
Objectives
To assess the effect of local cervical treatment for CIN and early cervical cancer on obstetric outcomes (after 24 weeks of gestation) and to correlate these to the cone depth and comparison group used.
Methods
Criteria for considering studies for this review
Types of studies
We included all studies reporting on late obstetric outcomes (beyond 24 weeks of gestation) in women with one or more previous local cervical treatments for CIN or early invasive disease (stage IA1), as compared to women without treatment. The interventions included any type of conservative treatment, either excisional or ablative (See:Types of interventions).
Studies were included irrespective of the type of untreated control group, which could have been drawn from one of the following sources: a) external group from general population that was mostly matched or adjusted for confounders; b) internal group with self‐matching of the pregnancies for the same women before and after treatment; c) internal group with the pre‐treatment and post‐treatment pregnancies of a given population; d) women attending colposcopy with or without CIN/biopsy but no treatment; e) women with high‐grade disease but no treatment (high‐grade squamous intra‐epithelial lesion (HSIL)). As the studies are non‐randomised, the choice of comparison group can impact on the magnitude of effect of the proposed comparisons. We know that women with CIN may have demographic and behavioural characteristics or even background immunological imbalances that place them at higher baseline risk of adverse reproductive outcomes. The different comparison groups have advantages and disadvantages and subgroup analyses for the different groups will allow better assessment of the true effects of treatment. More details are described in Assessment of risk of bias in included studies.
We excluded studies that did not include an untreated control group, compared different treatment techniques without an untreated control, reported on only fertility or early obstetric outcomes (before 24 weeks of gestation), reported only on obstetric outcomes beyond 24 weeks of gestation that are not listed below (see: Types of outcome measures), compared outcomes for treatments performed during pregnancy, or those that described outcomes in high‐risk women (i.e. women with history of miscarriage or women conceiving through assisted reproductive technology (ART))
Types of participants
We included women who had a pregnancy with or without a previous conservative treatment for CIN/early cervical cancer (stage IA1). We included women irrespective of the grade of the lesion for both squamous and glandular intra‐epithelial neoplasia. There was also no age restriction.
Types of interventions
Any comparison of interventions for treatment of CIN or stage IA1 cervical cancer by conservative methods of either:
-
excision (cold knife conisation (CKC); laser conisation (LC); needle excision of the transformation zone (NETZ), also known as straight wire excision of the transformation zone (SWETZ); large loop excision of the transformation zone (LLETZ), also known as loop electrosurgical excisional procedure (LEEP); Fischer cone biopsy excisor (FCBE));
-
ablation (laser ablation (LA); radical diathermy (RD); cold coagulation (CC); cryotherapy (CT)).
In studies that reported on the impact of several treatment techniques, we extracted data for each specific method, where possible. If the outcomes were not reported separately for each technique, we analysed the intervention under broader terms, i.e. excisional treatment not otherwise specified (NOS), ablative treatment NOS and treatment NOS.
Types of outcome measures
Primary outcomes
-
Maternal outcomes
-
-
overall (less than 37 weeks) prematurity (both iatrogenic and spontaneous)
-
severe (less than 32 to 34 weeks) prematurity
-
extreme (less than 28 to 30 weeks) prematurity
-
overall prematurity in singleton and multiple pregnancies
-
overall prematurity in nulliparous and parous women
-
overall prematurity for single and multiple cones
-
overall prematurity for different cone depths and volumes
-
overall prematurity for different comparison groups
-
Secondary outcomes
-
Maternal outcomes
-
-
overall spontaneous (i.e. non‐iatrogenic) prematurity
-
severe spontaneous prematurity
-
extreme spontaneous prematurity
-
threatened preterm birth
-
premature rupture of the membranes
-
chorioamnionitis
-
mode of delivery (caesarean section, instrumental deliveries)
-
length of labour (precipitous, prolonged)
-
induction of labour or use of oxytocin
-
haemorrhage (antepartum, postpartum)
-
analgesia (epidural, pethidine, not otherwise specified)
-
cervical stenosis
-
cervical cerclage
-
-
Neonatal outcomes
-
-
low birth weight (less than 2500 g, less than 2000 g, less than 1500 g, less than 1000 g)
-
admission to neonatal intensive unit (NICU)
-
perinatal mortality
-
stillbirth
-
Apgar score
-
In cases of heterogeneity in the cut‐offs used for cone depth and prematurity classification, these were grouped together when possible (i.e. 32 to 34 weeks to include both cut‐offs, 10 to 12 mm cone depth to include studies grouping at both these cut‐offs including or not the values equal to these numbers).
Search methods for identification of studies
The literature searches started from 1948 when the conservative methods of treatment for CIN were introduced into clinical practice and included references published up to June 2017.
Electronic searches
We searched the following electronic databases.
-
Cochrane Central Register of Controlled Trials (CENTRAL) (CENTRAL, 2017, Issue 5) (Appendix 1).
-
MEDLINE (1948 to June week 4, 2017) (Appendix 2).
-
Embase (1980 to 2017, week 26) (Appendix 3).
The searches started from inception to date in order to capture all studies published since the late 1970s. The treatment techniques used predominantly to manage the disease have changed over the years, although there are still clinical indications for the oldest techniques.
We used the 'related articles' feature in MEDLINE to retrieve additional references.
Searching other resources
We searched Metaregister, Physicians Data Query, www.controlled‐trials.com/rct, www.clinicaltrials.gov and www.cancer.gov/clinicaltrials for ongoing studies. We contacted the main investigators of any relevant ongoing trials for further information.
We searched conference proceedings and abstracts through ZETOC (http://zetoc.mimas.ac.uk)) and WorldCat Dissertations. We searched reports of conferences in the following sources.
-
Annual Meeting of the British Society of Colposcopy and Cervical Pathology.
-
Annual Meeting of the International Federation of Cervical Pathology and Colposcopy.
-
Annual Meeting of European Federation of Colposcopy.
-
Annual Meeding of the American Society of Colposcopy and Cervical Pathology.
In an attempt to identify any articles missed by the initial search or any unpublished data, we handsearched the references of the retrieved articles and meta‐analyses and the proceedings of relevant conferences. We contacted experts in the field, including directors of UK cancer and colposcopy registries, to identify further reports of studies.
We included both published and unpublished studies, if they met the inclusion criteria for the review.
Data collection and analysis
Selection of studies
We downloaded all titles and abstracts retrieved by electronic searches to the reference management database Endnote. We also added titles and abstracts retrieved from other sources to Endnote. We removed duplicates and two review authors (MK, AA) independently examined the remaining references. Titles and abstracts retrieved from other sources were also added to the EndNote database. We excluded those studies which clearly did not meet the inclusion criteria and we obtained copies of the full text of potentially relevant references. We assessed the eligibility of retrieved papers independently, compared the results and resolved disagreements by discussion. If necessary, we reached consensus with the involvement of a third review author (MA). We documented reasons for exclusion.
Data extraction and management
We classified the studies according to treatment modality (i.e. CKC, LC, LLETZ, LA etc) and in groups of excisional or ablative techniques.
From each study, we extracted data on the study design and setting, the study population, the interventions examined, the comparison group, the quality of the data and risk of bias and the outcomes assessed. We retrieved from each study and outcome, the number of events in treated and untreated women. If required, we contacted authors to obtain additional data if the numbers provided in the published report did not allow sufficient precision in the data extraction.
More specifically, we extracted the following data.
-
Author, year of publication, journal and language.
-
Country.
-
Setting where the study was conducted (hospital‐based versus population‐based).
-
Inclusion and exclusion criteria.
-
Study design, methodology, source of information.
-
Study population:
-
-
total number enrolled and number included in each group;
-
grade of CIN;
-
cone size;
-
single/multiple pregnancy;
-
single/multiple treatment;
-
nulliparous/parous women;
-
control for confounding factors:
-
age;
-
smoking;
-
parity;
-
socio‐economic status;
-
race;
-
history of previous preterm birth (PTB);
-
others.
-
-
-
Intervention details:
-
type of procedure used (excisional or ablative);
-
specific type of procedure used (excisional: CKC, LC, NETZ, LLETZ, FCBE; ablative: LA, RD, CC, CT).
-
-
Comparison group:
-
external untreated comparison group (general population);
-
internal comparison group:
-
self‐matching: the treated group consisted of only parous women and the pregnancy after treatment was compared to the pregnancy before treatment;
-
pre‐treatment pregnancies: in some studies, the treated group consisted of both nulliparous and parous women and the comparison group consisted of the pregnancies of the parous women before treatment.
-
-
untreated women with colposcopy with or without a biopsy who did not undergo treatment;
-
untreated women with untreated high‐grade disease.
-
-
Risk of bias (Assessment of risk of bias in included studies).
-
Outcomes reported in each study.
-
-
Primary outcomes:
-
overall (less than 37 weeks) prematurity (both iatrogenic and spontaneous);
-
severe (less than 32 to 34 weeks) prematurity;
-
extreme (less than 28 to 30 weeks) prematurity;
-
overall prematurity in singleton and multiple pregnancies;
-
overall prematurity in nulliparous and parous women;
-
overall prematurity for single and multiple cones;
-
overall prematurity for different cone depths and volumes;
-
overall prematurity for different comparison groups.
-
-
Secondary outcomes:
-
maternal outcomes: overall (less than 37 weeks) spontaneous (i.e. non‐iatrogenic) prematurity, severe (less than 32 to 34 weeks) spontaneous prematurity, extreme (less than 28 weeks) spontaneous prematurity, threatened preterm birth, premature rupture of the membranes, chorioamnionitis, mode of delivery (caesarean section, instrumental deliveries), length of labour (precipitous, prolonged), induction of labour or use of oxytocin, haemorrhage (antepartum, postpartum), analgesia (epidural, pethidine, not otherwise specified), cervical stenosis, cervical cerclage;
-
neonatal outcomes: low birth weight (LBW) (less than 2500 g, less than 2000 g, less than 1500 g, less than 1000 g), perinatal mortality, stillbirth, Apgar score.
-
-
-
-
For each reported outcome, we extracted information on:
-
the outcome definition;
-
number of participants allocated to each group;
-
for the dichotomous outcomes of interest: number of adverse pregnancy events in each group (treated and untreated), in order to estimate the risk ratio (RR), and missing participants.
-
-
Two review authors (MK, AA) abstracted data independently in a data abstraction form specially designed for the review. They resolved differences by discussion or by appeal to a third review author (EP) if necessary.
Assessment of risk of bias in included studies
To assess the risk of bias in included RCTs, we planned to use Cochrane's'Risk of bias' tool, comprising assessments of the following study characteristics: sequence generation; allocation concealment; blinding (of participants, healthcare providers and outcome assessors); incomplete outcome data; selective reporting of outcomes; other possible sources of bias (Higgins 2011).
As RCTs comparing women with CIN with non‐treated are not feasible or ethical due to the pre‐malignant nature of the condition, we anticipated that published evidence might rely only on observational cohort studies. As the comparison groups (treated for CIN with a particular procedure versus non‐treated) are non‐randomised, effects and effect sizes cannot be attributed with certainty to the treatment alone. The differences in the size of the treatment effect across studies may be partly explained by the choice of control population, because women with CIN may have demographic and behavioural characteristics or even background immunological imbalances that place them at higher baseline risk of adverse reproductive outcomes.
It should also be noted that all eligible comparison groups have advantages and limitations. A recent meta‐analysis showed that the use of historical external controls might produce inherent biases that could inflate the contribution of cervical treatment to adverse outcomes, even if the authors control for possible confounders (such as age, parity, smoking etc; Bruinsma 2011). The use of internal controls (pregnancies in the index woman before treatment) is an attractive alternative approach, but even this might be inadequate for confounders that are liable to change with time. Women with mild precancerous lesions that do not warrant excision treatment probably provide the best, although still imperfect, comparator. In contrast, those with high‐grade disease who neglect treatment advice aimed at preventing cancer may have high risk for confounders related to low socioeconomic class that may influence fertility or pregnancy outcomes.
For non‐randomised studies (NRS), we assessed the risk of bias in the following domains: Incomplete outcome Data (Attrition bias) was considered to be present if for more than 20% of the cohort the outcome data were missing or the method to collect outcome data was not systematic; Selective reporting (Reporting bias) was considered to be present if outcome data were not reported stratified according to all included study types; Performance and selection bias was assessed in whether the treatment assignment was reported appropriately, based on the representativeness of both the treatment and comparison groups, i.e. whether the treated cohort indeed represented the population at risk and was not subjected to possible selection bias, whether the comparison groups were drawn from the same source as the treated group and on their comparability, i.e. whether the authors used internal or self‐matched comparison group, or otherwise matched or adjusted for the possible confounders or effect modifiers; no other possible sources of bias were assessed.
We used the GRADE (Grading of Recommendations, Assessment, Development and Evaluation) (GRADE Working Group 2004) approach to assess the quality of evidence provided by the included studies. We used GRADEpro (GRADE profiler) software to generate 'Summary of findings' tables to include an assessment of the more clinically relevant outcomes .
Measures of treatment effect
We calculated risk ratio (RR) and 95% confidence intervals (95% CIs) for each adverse pregnancy outcome in the treated versus untreated women for dichotomous outcomes. We separated studies by general type of treatment (excisional or ablative) and we further grouped them by specific treatment procedure and by specific comparison group. We used a random‐effects model to pool RR (Dersimonian 1986). We used unadjusted data for the analyses.
Unit of analysis issues
In studies with multiple treatment groups, we proportionally divided the ‘shared’ comparison group into the number of treatment groups (i.e. based on the number of treated women for each technique), in order to avoid duplicate inclusion of some untreated women in the same forest plot. We treated comparisons between each treatment group and the split comparison group as independent comparisons.
When more than one comparison group was described in the included studies, the comparison groups were summed together if appropriate (i.e. external, any CIN or HSIL without treatment). If an external and internal self‐matching group was available, only data on the external group were included. In one study (Castanon 2012), with both internal controls, pre‐conisation population was used in preference to self‐matching.
Dealing with missing data
We contacted study authors about inclusion/exclusion criteria and eligibility of their study. We further contacted authors for additional data not presented in the original manuscript i.e. data according to different cone depths.
Assessment of heterogeneity
We assessed inter‐study heterogeneity with Cochran Q test (Cochran 1954), by visual inspection of forest plots, by estimation of the percentage heterogeneity between studies which cannot be ascribed to sampling variation (I2 statistic) (Higgins 2003), and by a formal statistical test of the significance of the heterogeneity (Deeks 2001). If there was evidence of substantial heterogeneity, we investigated and reported the possible reasons for this.
Assessment of reporting biases
For the outcomes presented in the 'Summary of findings' tables that included more than 10 studies, we explored potential publication bias graphically by the funnel plot in the Cochrane Review Manager software (Review Manager 2104).
Data synthesis
We pooled the results of the studies in meta‐analyses. For dichotomous outcomes, we calculated RR and 95% CIs and these were then pooled. We analysed the data separately for each treatment modality, in groups of ablative and excisional techniques, and as a whole, irrespective of the type of method used. We further analysed the data according to the cone depth.
Several studies provided separate data for overall and spontaneous PTB (sPTB) (less than37 weeks of gestation). If only data on sPTB were provided, these were also included in the overall PTB analysis (Crane 2006; Noehr 2009a; Ortoft 2010; Poon 2012; Stout 2015). If studies provided data on nulliparous and parous women separately, these were presented together and were also included in the respective forest plots for overall PTB (i.e. Analysis 1.15; Analysis 1.16). This was also the case for single and multiple treatment and singleton and multiple pregnancies .
We used random‐effects models with inverse variance weighting for all meta‐analyses (Dersimonian 1986).
If data were not of suitable quality for meta‐analysis, we reported the results as a narrative in the text of the review.
Subgroup analysis and investigation of heterogeneity
Given the non‐randomised nature of the included studies, we assessed whether the choice of comparison group impacts on the risk estimate for each outcome and over‐inflates the effect of treatment that could be partly attributed to other confounders. We therefore distinguished the different untreated comparison groups used across studies and performed analyses for the risk of PTB for each individual comparator (external; internal (self‐matching); internal (pre‐treatment pregnancies); colposcopy but no treatment; HSIL but no treatment). We performed separate analyses according to the comparison group for PTB (less than 37 weeks of gestation).
Furthemore, for the outcome of PTB (less than 37 weeks of gestation), we also performed analyses according to parity (nulliparous and parous women separately), number of treatments (women with single and multiple treatments separately), and number of fetuses (women with singleton and multiple pregnancies separately).
Sensitivity analysis
Finally, we performed meta‐regression analysis to assess the impact of some factors on the risk of PTB (less than37 weeks). These included the year of study (1979 to 1989, 1990 to 1999, 2000 to 2009, 2010 to 2015); type of treatment (excision or ablation); type of comparator (external, internal – pregnancies before treatment, internal – self‐matching, CIN but no treatment, HSIL but no treatment).
Results
Description of studies
The characteristics of the included and excluded studies and the outcomes examined are described in the Characteristics of included studies and in the Characteristics of excluded studies, respectively.
Results of the search
We retrieved 3219 citations from the literature search. Of those, 2849 were excluded based on the title or abstract; 370 were retrieved in full text for evaluation. We identified 69 studies that fulfilled the inclusion criteria and 289 were excluded (of these 289 studies, 242 were reviews/meta‐analyses, conference proceedings, letters or duplicates; the remaining 47 studies are listed in detail in Excluded studies and Characteristics of excluded studies); 12 studies are awaiting classification. No unpublished studies could be identified. The details, including reasons for exclusion, are present in the PRISMA flowchart (Moher 2009; Figure 1).

Flow diagram.
Included studies
Sixty‐nine studies fulfilled the inclusion criteria of this systematic review and were also included in the meta‐analysis. We identified no unpublished studies. The detailed characteristics of the included studies are shown in Characteristics of included studies. All studies were cohorts and retrospective, except for five prospective studies (Fischer 2010; Frega 2013; Guo 2013; Poon 2012; Simoens 2012). Fifteen studies were population‐based (the data were drawn from registers, or they included a large number of hospitals covering a large area) (Albrechtsen 2008; Andia 2011; El‐Bastawissi 1999; Frega 2013; Heinonen 2013; Jakobsson 2007; Jones 1979; Kristensen 1985; Kristensen 1993; Larsson 1982; Noehr 2009a; Noehr 2009b; Reilly 2012; Shanbhag 2009; Sjoborg 2007) and the remaining studies were hospital‐based (the data were drawn from hospital records). There were no RCTs.
Seven studies were identified in non‐English language and were not included (He 2007; Kalitsaris 1991; Kasum 1991; Lund 1986; Praest 1979; Spuhler 1995; Zornoza‐Garcia 2009) given the large number of included studies and the low quality of these small studies we considered that their inclusion would not alter the conclusions of the review. In future updates we will consider the inclusion of these reports (Characteristics of studies awaiting classification). Five studies published after April 2016, week 2 are awaiting classification in future updates of this review (Aleman 2016; Bjorge 2016; Brie 2016; Jancar 2016; Zebitay 2017).
Many of the included studies included cohorts treated with a variety of treatment modalities. Specifically, 14 studies examined the impact of cold knife conisation; (CKC) (Bruinsma 2007; Buller 1982; Crane 2006; Ehsanipoor 2014; Guo 2013; Jones 1979; Klaritsch 2006; Kuoppala 1986; Larsson 1982; Ludviksson 1982; Moinian 1982; Ortoft 2010; Sozen 2014; Weber 1979), 10 of laser conisation (LC) (Andersen 1999; Bekassy 1996; Forsmo 1996; Hagen 1993; Lima 2011; Raio 1997; Sadler 2004; Sagot 1995; Simoens 2012; Spitzer 1995), one of needle excision of the transformation zone (NETZ) (Ortoft 2010), 32 of large loop excision of the transformation zone (LLETZ) (Acharya 2005; Andia 2011; Blomfield 1993; Braet 1994; Bruinsma 2007; Crane 2006; Cruickshank 1995; Ehsanipoor 2014; Frega 2013; Frey 2013; Gunasekera 1992; Guo 2013; Haffenden 1993; Heinonen 2013; Himes 2007; Jakobsson 2009; Kitson 2014; Lima 2011; Martyn 2015; Noehr 2009a; Noehr 2009b; Ortoft 2010; Paraskevaidis 2002; Parikh 2008; Poon 2012; Sadler 2004; Samson 2005; Simoens 2012; Stout 2015; Tan 2004; Turlington 1996; Werner 2010), one of Fischer cone biopsy Excisor (FCBE) (Anwar 2016), eight of laser ablation (LA) (Anderson 1984; Bruinsma 2007; Forsmo 1996; Gunasekera 1992; Sadler 2004; Saunders 1986; Spitzer 1995; van Rooijen 1999), one of radical diathermy (RD) (Bruinsma 2007), two of cryotherapy (CT) (Crane 2006; Hemmingsson 1982), 15 of excision not otherwise specified (NOS) (Albrechtsen 2008; Armarnik 2011; Castanon 2012; El‐Bastawissi 1999; Fischer 2010; Jakobsson 2007; Martyn 2015; Miller 2015; Reilly 2012; Shanbhag 2009; Simoens 2012; Sjoborg 2007; van de Vijner 2010; Van Hentenryck 2012; Wuntakal 2013), five of ablation NOS (Ehsanipoor 2014; El‐Bastawissi 1999; Jakobsson 2007; Reilly 2012; Shanbhag 2009) and three of treatment NOS (Kirn 2015; Kristensen 1985; Kristensen 1993).
There were five types of comparison groups: external (general population) (Acharya 2005; Albrechtsen 2008; Andersen 1999; Anderson 1984; Andia 2011; Armarnik 2011; Bekassy 1996; Blomfield 1993; Braet 1994; Castanon 2012; Crane 2006; Cruickshank 1995; Ehsanipoor 2014; El‐Bastawissi 1999; Fischer 2010; Forsmo 1996; Frega 2013; Frey 2013; Gunasekera 1992; Haffenden 1993; Hagen 1993; Heinonen 2013; Jakobsson 2007; Jakobsson 2009; Jones 1979; Kirn 2015; Klaritsch 2006; Kristensen 1985; Kristensen 1993; Kuoppala 1986; Lima 2011; Ludviksson 1982; Miller 2015; Noehr 2009a; Noehr 2009b; Ortoft 2010; Paraskevaidis 2002; Parikh 2008; Poon 2012; Raio 1997; Reilly 2012; Samson 2005; Saunders 1986; Shanbhag 2009; Simoens 2012; Sjoborg 2007; Sozen 2014; Tan 2004; van de Vijner 2010; Van Hentenryck 2012; van Rooijen 1999; Weber 1979; Werner 2010); internal (pre‐treatment pregnancies) (Acharya 2005; Albrechtsen 2008; Andia 2011; Buller 1982; Castanon 2012; Cruickshank 1995; Hemmingsson 1982; Larsson 1982; Moinian 1982; Sagot 1995; Spitzer 1995; Stout 2015; Werner 2010; Wuntakal 2013); internal (self‐matching) (Anwar 2016; Bekassy 1996; Castanon 2012; Jakobsson 2009; Kristensen 1993; Ortoft 2010; Raio 1997; Sjoborg 2007); women who attended colposcopy with or without biopsy who did not undergo treatment (Bruinsma 2007; Castanon 2012; Frey 2013; Guo 2013; Himes 2007; Kitson 2014; Martyn 2015; Miller 2015; Noehr 2009a; Poon 2012; Sadler 2004; Stout 2015; Wuntakal 2013), and women with untreated high‐grade squamous intra‐epithelial lesion (HSIL) (El‐Bastawissi 1999; Ortoft 2010; Shanbhag 2009).
As many studies were old, dating back to the 1980s, we ensured that we avoided overlapping the same patients in different reports, particularly those from the Scandinavian countries. More specifically, seven studies were identified from Denmark. Weber 1979 was an old hospital‐based study (delivery during 1974 to 1975), with no overlapping with the other more recent studies. Kristensen 1985 identified treated women from the registry of a Danish county (1973 to1980), but only women delivering in a specific university hospital (up to 1982) were included. Kristensen 1993 was a population‐based study from the whole of Denmark including only parous women, with their first infant delivered in 1982, and their second during 1982 to 1987 (treatment during 1977 to 1987). There was no overlapping with Kristensen 1985. Andersen 1999 was a hospital‐based study including women treated during 1985 to 1989. There was a negligible degree of overlapping with Kristensen 1993 (for women with delivery in 1982, treatment during 1985 to 1987 and subsequent delivery until 1987). Noehr 2009a was a population‐based study from the whole of Denmark that was comprised of women treated during 1997 to 2005 with subsequent singleton pregnancy at the same time period. There was no overlapping with the previous studies. Noehr 2009b had the same design with Noehr 2009a and the only difference was that only women with twin pregnancies were included. Ortoft 2010 identified treated women from the Danish nationwide pathology database (1989 to 2007), but only women delivering at Aarhus University Hospital until 2007 were included. Approximately 8% of all Danish births take place in this hospital. Women delivering during 1997 to 2005 (nine years) were also included in Noehr 2009a, but women delivering during 1989 to 1996 and 2006 to 2007 (10 years) were not included in Noehr 2009a. Because there was no way to eliminate the overlapping, we decided to include both studies.
Four studies were identified from Finland. Some of the authors in Jakobsson 2007 (population‐based study from the whole of Finland), Jakobsson 2009 (hospital‐based study) and Heinonen 2013 (population‐based study from the whole of Finland) were common, and we carefully avoided duplication. More details about the outcomes extracted from each study are listed in Characteristics of included studies. Kuoppala 1986 was another hospital‐based study from Finland, but there was no overlapping with the aforementioned population‐based studies.
Five studies were identified from Norway. Albrechtsen 2008 was a population‐based study from the whole of Norway (excisional treatment during 1953 to 1979 or 1986 to 2003 and subsequent pregnancy during 1967 to 2003). All participants in Acharya 2005 and Sjoborg 2007 were also included in Albrechtsen 2008, thus we excluded Acharya 2005 and Sjoborg 2007 from the analyses, which also included Albrechtsen 2008. There was no overlapping between Acharya 2005 and Sjoborg 2007. Forsmo 1996 was a hospital‐based study which included women treated with LLETZ or LA during 1983 to 1988. There was overlapping with Albrechtsen 2008 for women treated with LLETZ during 1986 to 1988, but there was no way to eliminate this overlapping. In Hagen 1993, all women had received LLETZ during 1983to 1985 and there was no overlapping with Albrechtsen 2008.
Six studies were identified from Sweden. Five of these studies were hospital‐based (Bekassy 1996; Hemmingsson 1982; Ludviksson 1982; Moinian 1982; van Rooijen 1999). Larsson 1982 identified women from the South Swedish Regional Tumour Registry, but only women delivering in two hospitals were included. One of these hospitals was also included in Bekassy 1996, but the studies took place in different periods with no overlapping.
Although case‐control studies and studies assessing the impact of treatment performed during pregnancy were excluded, we included the study by Ortoft 2010, as only 18 women (2.5%) were treated during pregnancy, and the case‐control study by Castanon 2012, as additional data were provided by the authors.
There was no risk of overlapping for studies from other countries.
Excluded studies
The characteristics of the 47 excluded studies (not including reviews/meta‐analyses, conference proceedings, letters or duplicates) are shown in Characteristics of excluded studies. The PRISMA flowchart is shown in Figure 1 . We excluded studies without an untreated comparison group (Althuisius 2001; Berghella 2004; Berretta 2013; Bull‐Phelps 2007; Chevreau 2017; Conner 2013; Ferenczy 1995; Gordon 1991; Gronroos 1979; Khalid 2012; Kim 2016; Kindinger 2016; Kullander 1971; Leiman 1980; Liu 2014; Liverani 2016; Macvicar 1968; Mariya 2016; Masamoto 2008; Michelin 2009; Monaghan 1982; Nam 2010; Novikova 1994; Patrelli 2008; Radha Bai Prabhu 2010; Rafaeli‐Yehudai 2014; Sangkarat 2014; Shin 2010; Wakita 1990; Wongtiraporn 2014), studies with women treated during pregnancy (Mitsuhashi 2000; Rosen 1991; Seki 2010; Sljivancanin 2013), or late obstetric outcomes (beyond 24 weeks) that we did not study in this meta‐analysis (Ciavattini 2015; Gentry 2000; Kalliala 2012; Naleway 2015; Ricciotti 1995; Spracklen 2013), case‐control studies (Watson 2012), studies with a high‐risk treated and/or comparison group (i.e. previous history of mid trimester loss (Pils 2014), conceived through assisted reproductive technology (ART) (Ciavattini 2014; Pinborg 2015)), and studies assessing the impact of CIN on outcomes without information as to whether treatment was performed (Al‐Halal 2013; Smaldone 2010; Zuo 2011).
Risk of bias in included studies
The included studies were non‐randomised studies (NRS); they were prospective or retrospective cohorts and were therefore at high risk of underlying bias. The included studies varied with regard to design, the data source, the study and comparison populations, the reported outcomes, the length of follow‐up and the matching for possible confounders, as described above.
The summary of the authors' judgements about each 'Risk of bias' item is presented in Figure 2 and the detailed evaluation of 'Risk of bias' domains separately for each included study in Figure 3.

'Risk of bias' graph: review authors' judgements about each risk of bias item presented as percentages across all included studies.
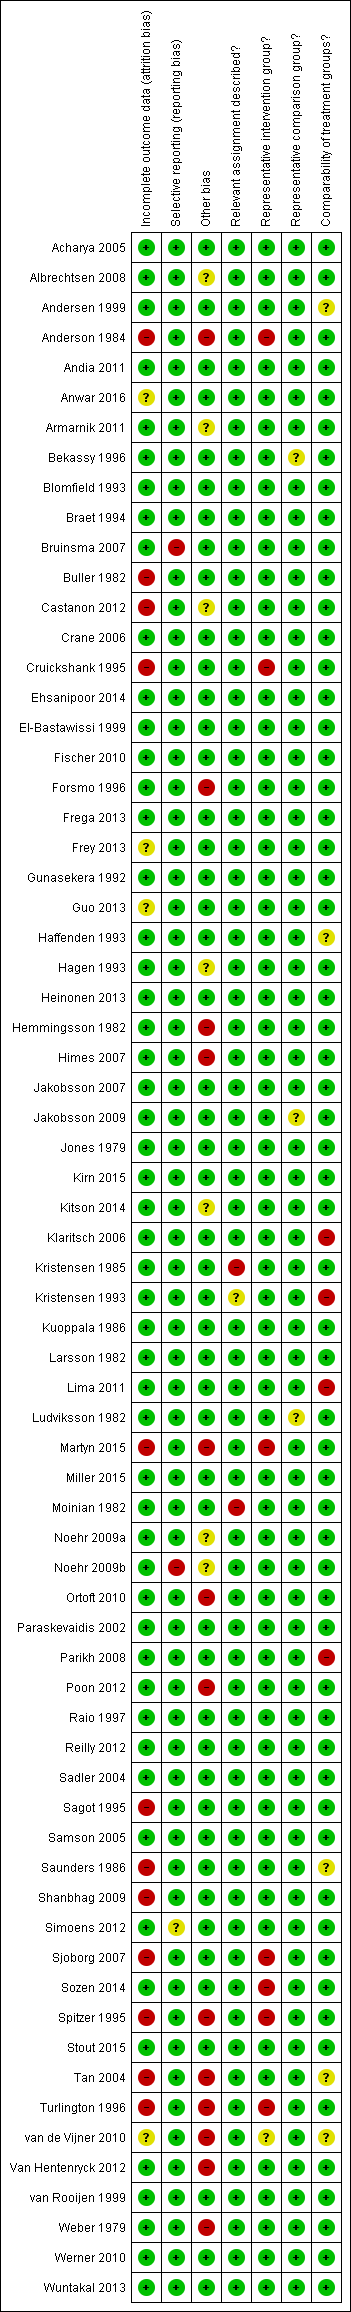
'Risk of bias' summary: review authors' judgements about each risk of bias item for each included study.
A description of the quality of the evidence is provided based on the GRADE assessment on maternal outcomes (summary of findings Table for the main comparison) and on fetal outcomes (summary of findings Table 2).
Allocation
Representativeness of intervention group
Risk of bias due to unrepresentative intervention group was generally considered low. In six studies (Anderson 1984; Cruickshank 1995; Martyn 2015; Sjoborg 2007; Spitzer 1995; Turlington 1996), the representativeness of the intervention group was considered inadequate due to considerable, over 20%, non‐responder rate to follow‐up questionnaires, which might result in selection bias due to women in higher social classes being more prone to answer. In one study (Sozen 2014), the intervention group was considered unrepresentative due to the very small number of participants (15 patients) and in one study (van de Vijner 2010), the representativeness was unclear due to lack of information regarding the number of women providing questionnaire‐based follow‐up data.
Representativeness of comparison group
The representativeness of the comparison group was considered good in all but three studies. In two studies (Bekassy 1996; Jakobsson 2009), the untreated external comparison group was not drawn from the same source as the treated population and in one study (Ludviksson 1982), the source of reference population was unclear.
Comparability of the groups
The comparison group used and the adjustment for possible risk factors are important measures of study quality and risk of bias. Of the studies that used an external comparison group (n = 53, Included studies), 49 matched for known risk factors or performed a regression analysis to control for known confounders. Only four studies did not include any measures to control for confounders (Klaritsch 2006; Kristensen 1993; Lima 2011; Parikh 2008) and were hence considered to be of high risk of bias. Of the remaining 49 studies, 29 studies used matching (Acharya 2005; Andersen 1999; Anderson 1984; Bekassy 1996; Blomfield 1993; Braet 1994; Cruickshank 1995; Fischer 2010; Forsmo 1996; Frega 2013; Gunasekera 1992; Haffenden 1993; Hagen 1993; Jones 1979; Kirn 2015; Kristensen 1985; Kuoppala 1986; Ludviksson 1982; Paraskevaidis 2002; Raio 1997; Samson 2005; Saunders 1986; Simoens 2012; Sozen 2014; Tan 2004; van de Vijner 2010; Van Hentenryck 2012; van Rooijen 1999; Weber 1979), 17 studies used regression analysis (Albrechtsen 2008; Andia 2011; Armarnik 2011; Castanon 2012; Crane 2006; Ehsanipoor 2014; Heinonen 2013; Jakobsson 2007; Jakobsson 2009; Miller 2015; Noehr 2009a; Noehr 2009b; Ortoft 2010; Poon 2012; Reilly 2012; Shanbhag 2009; Werner 2010) and three studies used both matching and regression analysis (El‐Bastawissi 1999; Frey 2013; Sjoborg 2007). In five studies (Andersen 1999; Haffenden 1993; Saunders 1986; Tan 2004; van de Vijner 2010), the risk was considered unclear due to incomplete matching between the two groups.
Of the 13 studies that had an internal comparison group (pre‐treatment pregnancies), two used matching (Larsson 1982; Spitzer 1995) and four studies also performed regression analysis (Albrechtsen 2008; Castanon 2012; Werner 2010; Wuntakal 2013). Of the eight studies that had an internal comparison group (self‐matching), three studies also performed regression analysis (Castanon 2012; Jakobsson 2009; Sjoborg 2007).
Of the 15 studies that used as a comparison group women who attended colposcopy with or without biopsy who did not undergo treatment or untreated HSIL, 10 studies performed regression analysis (Bruinsma 2007; Castanon 2012; El‐Bastawissi 1999; Miller 2015; Noehr 2009a; Ortoft 2010; Poon 2012; Sadler 2004; Shanbhag 2009; Wuntakal 2013), four studies used matching for confounders (Guo 2013; Kitson 2014; Martyn 2015; Stout 2015), and one study (Frey 2013) used both matching and regression analysis. The most common confounding factors that were used in matching or regression analysis were age, parity, smoking, race/ethnicity and social class.
Blinding
Relevant assignment described (Performance bias)
Bias due to unclear or inappropriate treatment assignment was considered low in most studies. In two studies the risk was deemed high, due to the conisation type not being described (Kristensen 1985) and the CKC treatment being described to be more radical than as usual (Moinian 1982). In one study (Kristensen 1993), the risk was unclear as the method of treatment was not specified but could have included three different types of treatment.
Incomplete outcome data
Overall 12/69 studies (17%) were considered to be at high risk of attrition bias due to incomplete outcome data. In 10 studies information about the subsequent pregnancies was missing for more than 20% of the study population (Anderson 1984; Buller 1982; Castanon 2012; Cruickshank 1995; Martyn 2015; Sagot 1995; Sjoborg 2007; Spitzer 1995; Tan 2004; Turlington 1996), in one study (Saunders 1986), the method to retrieve subsequent pregnancy data was deemed non‐systematic, i.e. contacting local general practitioners, and in one study (Shanbhag 2009), the method of CIN treatment was unclear for more than 50% and these women were excluded from all analyses. In four studies (Anwar 2016; Frey 2013; Guo 2013; van de Vijner 2010), the number of women lost to follow‐up and therefore the risk of attrition bias was unclear and for all other studies the risk was deemed to be low.
Selective reporting
Reporting bias due to selective reporting was considered low in almost all included studies. For two studies (Bruinsma 2007; Noehr 2009b), the risk was deemed high due to the results being reported only for the whole treated‐group, not stratified according to the treatment type. For one study (Simoens 2012), the risk was considered to be unclear due to reporting the outcomes only after some, not all included treatments.
Other potential sources of bias
The outcome ascertainment was made with a questionnaire in seven studies (Martyn 2015; Ortoft 2010; Poon 2012; Spitzer 1995; Turlington 1996; van de Vijner 2010; Weber 1979), which might predispose to recall bias and misclassification and the risk of other bias was hence considered high in these studies. A further five studies were as well considered to be of high risk of other bias, due to contradictions between the tables and the text (Himes 2007; Tan 2004; Van Hentenryck 2012), due to including treated women in comparison groups (Forsmo 1996), and marked temporal differences in outcomes between the exposed and unexposed groups (Hemmingsson 1982). The risk of other bias was considered unclear in six studies. In two studies (Albrechtsen 2008; Castanon 2012), some women in the comparison group might have been being treated but the effect of this possible misclassification was deemed unclear, in one study some of the data were discrepant but the possible effect of this again deemed unclear (Armarnik 2011), and in two studies (Noehr 2009a; Noehr 2009b), the LLETZ group might have included women treated with LC as well, but the number was considered negligible and unclear whether it would introduce bias.
We assessed the presence of publication bias for the outcomes presented in the 'Summary of findings' tables if more than 10 studies were included. There was evidence of publication bias only for PTB at < 32 to 34 weeks of gestation. None of the other outcomes showed any evidence of publication bias.
Effects of interventions
See: Summary of findings for the main comparison The effect of treatment for CIN on maternal outcomes; Summary of findings 2 The effect of treatment for CIN on neonatal outcomes
MATERNAL OUTCOMES
Preterm birth
The risk of preterm birth was increased after cervical treatment. This was the case for prematurity rate overall at less than 37 weeks of gestation (Analysis 1.1: 59 studies, 5,242,917 women, 10.7% versus 5.4%, risk ratio (RR) 1.75, 95% confidence interval (CI) 1.57 to 1.96; Analysis 1.2: 59 studies, 5,242,917 women, 10.7% versus 5.4%, RR 1.78, 95% CI 1.60 to 1.98, very low quality of evidence because of considerable (I2 90% and 88%, respectively) heterogeneity (summary of findings Table for the main comparison)); for severe prematurity less than 32 to 34 weeks of gestation (Analysis 1.3: 24 studies, 3,793,874 women, 3.5% versus 1.4%, RR 2.25, 95% CI 1.79 to 2.82; Analysis 1.4: 24 studies, 3,793,874 women, 3.5% versus 1.4%, RR 2.35, 95% CI 1.88 to 2.95, very low quality of evidence because of considerable (I2 83% and 82%, respectively) heterogeneity and suspected publication bias (summary of findings Table for the main comparison)); and extreme prematurity less than 28 to 30 weeks of gestation (Analysis 1.5: 8 studies, 3,910,629 women, 1.0% versus 0.3%, RR 2.23, 95% CI 1.55 to 3.22; Analysis 1.6: 8 studies, 3,910,629 women, 1.0% versus 0.3%, RR 2.43, 95% CI 1.69 to 3.49, very low quality of evidence because of considerable (I2 84% and 82%, respectively) heterogeneity (summary of findings Table for the main comparison)). We further conducted analyses for more specific gestational ages cut‐offs (i.e. 34 weeks or less (Analysis 1.7 (RR 2.59, 95% CI 1.78 to 3.77); Analysis 1.8 (RR 2.56, 95% CI 1.78 to 3.69)), less than 32 to 33 weeks (Analysis 1.9 (RR 2.08, 95% CI 1.55 to 2.79); Analysis 1.10 (RR 2.26, 95% CI 1.70 to 3.01)), less than 30 weeks (Analysis 1.11 (RR 2.86, 95% CI 0.12 to 69.11); Analysis 1.12 (RR 2.86, 95% CI 0.12 to 69.11)), less than 28 weeks (Analysis 1.13 (RR 2.22, 95% CI 1.54 to 3.22); Analysis 1.14 (RR 2.52, 95% CI 1.71 to 3.72)) for broader treatment groups as well as individual techniques. The impact of treatment was not different for nulliparous (Analysis 1.15) and multiparous (Analysis 1.16) women. The effect of multiple treatment on the risk of prematurity was substantially higher than the effect of single treatments (single treatment versus no treatment (Analysis 1.17): 17 studies, 1,367,023 women, 7.5% versus 4.2%, RR 1.75, 95% CI 1.49 to 2.06; repeat treatment versus no treatment (Analysis 1.18): 11 studies, 1,317,284 women, 13.2% versus 4.1%, RR 3.78, 95% CI 2.65 to 5.39, very low quality of evidence because of considerable (I2 75%) heterogeneity (summary of findings Table for the main comparison)). The relative risk of preterm birth for two excisional treatments not otherwise specified (NOS) was as high as 5.48 (95% CI 2.68 to 11.24) and that of two loop excisions as high as 2.81 (95% CI 2.33 to 3.39), as compared to no treatment.
The magnitude of the effect of treatment was higher for excision (Analysis 1.1.1: RR 1.87, 95% CI 1.64 to 2.12) rather than ablation (Analysis 1.1.2: RR 1.35, 95% CI 1.20 to 1.52) and for more radical treatment techniques. The risk of preterm birth at less than 37 weeks of gestation for individual treatment techniques varied: cold knife conisation (CKC) (Analysis 1.2.1: RR 2.70, 95% CI 2.14 to 3.40); laser conisation (LC) (Analysis 1.2.2: RR 2.11, 95% CI 1.26 to 3.54); large loop excision of the transformation zone (LLETZ) (Analysis 1.2.4: RR 1.58, 95% CI 1.37 to 1.81); laser ablation (LA) (Analysis 1.2.6: RR 1.04, 95% CI 0.86 to 1.26); CT (Analysis 1.2.7: RR 1.02, 95% CI 0.22 to 4.77); excision NOS (Analysis 1.2.9: RR 1.90, 95% CI 1.50 to 2.41); ablation NOS (Analysis 1.2.10: RR 1.46, 95% CI 1.27 to 1.66) and treatment NOS (Analysis 1.2.11: (RR 2.57, 95% CI 1.39 to 4.77). Similar trends were noted for severe (Analysis 1.4) and extreme (Analysis 1.6) prematurity. Some, but not all, types of treatments were also associated with an increased risk of preterm birth for women with singleton (Analysis 1.19) or multiple pregnancies (Analysis 1.20; Analysis 1.21; Analysis 1.22), but the results were inconsistent due to the small number of studies.
Preterm birth — dimensions of excised cone
We further analysed the data on the risk of preterm birth at less than 37 weeks of gestation for different cone depths. The risk for treated versus untreated women was greater for women with cone depth ≤ 10 mm to 12 mm (Analysis 1.23: 8 studies, 550,929 women, 7.1 % versus 3.4%, RR 1.54, 95% CI 1.09 to 2.18, very low quality of evidence because of substantial (I2 67%) heterogeneity (summary of findings Table for the main comparison)), and the magnitude of effect increased with increasing cone depth (≥ 10 mm to 12 mm (Analysis 1.24): 8 studies, 552,711 women, 9.8 % versus 3.4%, RR 1.93, 95% CI 1.62 to 2.31, low quality of evidence (summary of findings Table for the main comparison); ≥ 15 mm to 17 mm (Analysis 1.25): 4 studies, 544,986 women, 10.1 % versus 3.4%, RR 2.77, 95% CI 1.95 to 3.93, very low quality of evidence because of moderate (I2 53%) heterogeneity (summary of findings Table for the main comparison); ≥ 20 mm (Analysis 1.26): 3 studies, 543,750 women, 10.2 % versus 3.4%, RR 4.91, 95% CI 2.06 to 11.68, very low quality of evidence because of considerable (I2 67%) heterogeneity (summary of findings Table for the main comparison)). A similar increasing effect was observed, although based on only one study, with increasing cone volume (less than 6 cc (Analysis 1.27): 1 study, 550 women, 8.1% versus 3.6%, RR 2.25, 95%CI 1.09 to 4.66; > 6 cc (Analysis 1.28): 1 study, 284 women, 50.0% versus 3.6%, RR 13.90, 95% CI 5.09 to 37.98). We have performed additional analyses assessing several more specific cone depths/volumes without merging these in broader groups (Analysis 1.29; Analysis 1.30; Analysis 1.31; Analysis 1.32; Analysis 1.33; Analysis 1.34; Analysis 1.35; Analysis 1.36; Analysis 1.37; Analysis 1.38; Analysis 1.39; Analysis 1.40; Analysis 1.41; Analysis 1.42).
The comparison of treated women for different cone depths revealed that deep excisions increased the risk of preterm birth (less than 37 weeks) as opposed to less deep excisions and the magnitude of the effect increased in longer cones (≥ 10 mm to 12 mm versus ≤ 10 mm to 12 mm (Analysis 1.43): 7 studies, 6359 women, 12.3 % versus 7.8%, RR 1.54, 95% CI 1.31 to 1.80; ≥ 15 mm to 17 mm versus ≤ 15 mm to 17 mm (Analysis 1.44): 4 studies, 4275 women, 10.1 % versus 5.7%, RR 1.82, 95% CI 1.47 to 2.26; ≥ 20 mm versus ≤ 20 mm (Analysis 1.45): 3 studies, 3944 women, 10.2 % versus 5.6%, RR 2.79, 95% CI 1.24 to 6.27). The findings were similar for the comparison of cone volumes (> 3 cc versus less than 3 cc (Analysis 1.46): 1 study, 278 women, 15.0 % versus 7.3%, RR 2.04, 95% CI 0.95 to 4.39; > 6 cc versus less than 6 cc (Analysis 1.47): 1 study, 278 women, 50.0% versus 8.1%, RR 6.18, 95% CI 2.53 to 15.13). Further subgroup analyses of comparisons of more specific cone depths are also shown (Analysis 1.48; Analysis 1.49; Analysis 1.50).
Preterm birth — effect of the comparison group
The impact that the choice of comparison group may have on the magnitude of effect was assessed by additional analysis that classified different studies according to the comparator used. The magnitude of effect was higher when an external comparison group was used (Analysis 1.51: 44 studies, 5,192,047 women, 10.5% versus 5.4%, RR 1.92, 95% CI 1.70 to 2.16), followed by internal comparators (self‐matching (Analysis 1.52): 8 studies, 2987 women, 10.9% versus 7.0%, RR 1.59, 95% CI 1.19 to 2.13; pre‐treatment pregnancies (Analysis 1.53): 13 studies, 83,404 women, 14.1% versus 6.4%, RR 1.39, 95% CI 0.98 to 1.96) and ultimately women with disease but no treatment (Analysis 1.54: 13 studies, 74,958 women, 8.8% versus 6.0%, RR 1.27, 95% CI 1.14 to 1.41). A further analysis of treated women versus those with untreated HSIL was also explored although this included only three studies (Analysis 1.55: 3 studies, 3764 women, 12% versus 7.8%, RR 1.37, 95% CI 0.85 to 2.19). The forest plot where we compared treatment in general to the different comparison groups can be seen in Analysis 1.56. When women with disease but no treatment and the pregnancies of the parous women before treatment were compared to the general population, the risk of preterm birth was higher (Analysis 1.57: 15 studies, 4,357,998 women, 5.9% versus 5.6%, RR 1.24, 95% CI 1.14 to 1.34) based on very low‐quality evidence. These groups were also analysed separately (Analysis 1.57.1; Analysis 1.57.2; Analysis 1.57.3).
Furthermore, we performed a series of analyses for different cone depths and comparison groups with particularly emphasis on the comparisons of different depths of treatment versus untreated women with CIN (Analysis 1.58; Analysis 1.59; Analysis 1.60; Analysis 1.61; Analysis 1.62; Analysis 1.63; Analysis 1.64; Analysis 1.65; Analysis 1.66; Analysis 1.67; Analysis 1.68; Analysis 1.69; Analysis 1.70; Analysis 1.71; Analysis 1.72; Analysis 1.73; Analysis 1.74; Analysis 1.75). The subgroup analysis of the risk of preterm birth (less than 37 weeks of gestation) according to cone depth when compared to women with CIN but not treated revealed similar direction of effect although for cone depth ≤ 10 mm to 12 mm, the difference was less marked. The number of the studies was however small for many comparisons (treatment versus women with untreated CIN = cone depth ≤ 10 mm to 12 mm (Analysis 1.60): 4 studies, 43,145 women, 7.0% versus 5.0%, RR 1.11, 95% CI 0.85 to 1.43; ≥ 10 mm to 12 mm (Analysis 1.67): 4 studies, 45,275 women, 9.6% versus 5.0%, RR 1.52, 95% CI 1.37 to 1.68; ≥ 15 mm to 17 mm (Analysis 1.69): 3 studies, 33,934 women, 9.6% versus 4.3%, RR 2.30, 95% CI 1.57 to 3.35; ≥ 20 mm (Analysis 1.71): 2 studies, 32,717 women, 9.3% versus 4.2%, RR 4.32, 95% CI 0.93, 20.03) based on low‐ or very low‐quality evidence.
Preterm birth ‐ sensitivity and meta‐regression analysis
The mono‐variate meta‐regression analysis suggested that the type of treatment and comparator affected the risk of preterm birth, although the year of study did not. Type of treatment and comparison group remained important factors for risk of preterm birth (PTB) in a multivariate regression analysis. When we performed further meta‐regression restricting only to excisional treatments and using as a comparator women with colposcopy/biopsy, we found that all treatments were associated with an increased risk of PTB (RR 1.34, 95% CI 1.10 to 1.64, for LLETZ; RR 2.3, 95% CI 1.39 to 3.85, for CKC; RR 1.6, 95% CI 0.91 to 2.87, for LC; and RR 4.26, 95% CI 1.96 to 9.33, for needle excision of the transformation zone) (data not shown).
Other Maternal outcomes
Maternal outcomes other than preterm birth were assessed in several studies and many of these were found to be increased after cervical treatment. This increase was more frequent for excisional as opposed to ablative techniques and with increasing treatment radicality, although the number of studies assessing each individual treatment method was frequently small.
Cervical treatment increased the risk of spontaneous overall, severe and extreme preterm birth (less than 37 weeks (Analysis 2.1): 14 studies, 1,024,731 women, 7.0% versus 3.7%, RR 1.76, 95% CI 1.47 to 2.11; less than 32 to 34 weeks (Analysis 2.2): 7 studies, 655,675 women, 1.8% versus 0.6%, RR 2.63, 95% CI 1.91 to 3.62; less than 28 weeks (Analysis 2.3): 2 studies, 626,670 women, 0.6% versus 0.2%, RR 3.18, 95% CI 1.64 to 6.16). The risk of spontaneous preterm birth (less than 37 weeks) was higher for CKC (Analysis 2.1.1: RR 3.53, 95% CI 2.05 to 6.05) followed by excision NOS (Analysis 2.1.7: RR 1.70, 95% CI 1.17 to 2.46), LLETZ (Analysis 2.1.4: RR 1.60, 95% CI 1.22 to 2.08) and ablation NOS (Analysis 2.1.8: RR 1.42, 95% CI 1.20 to 1.70). Needle excision of the transformation zone (NETZ) (Analysis 2.1.3) and LA (Analysis 2.1.5) were only assessed in one study, respectively. There was substantial heterogeneity for the comparisons assessing spontaneous preterm birth at all cut‐offs (P value less than 0.05) based on low‐ or very low‐quality evidence.
The risk of pPROM less than 37 weeks (Analysis 2.4: 21 studies, 477,011 women, 6.1% versus 3.4%, RR 2.36, 95% CI 1.76 to 3.17, very low quality of evidence because of considerable (I2 79%) heterogeneity (summary of findings Table for the main comparison)) was also increased after treatment. The risk of pPROM was higher for CKC (Analysis 2.4.1: RR 4.11, 95% CI 2.05 to 8.25) followed by LLETZ (Analysis 2.4.4: RR 2.15, 95% CI 1.48 to 3.12). NETZ (Analysis 2.4.3) was only assessed in one study and LA (Analysis 2.4.5) did not significantly affect the risk but was only assessed in two studies based on low‐ or very low‐quality evidence. We also included analyses at different gestational cut‐offs (Analysis 2.5; Analysis 2.6)
Treatment increased the risk of admission for threatened preterm birth (Analysis 2.7; 5 studies, 903 women, 9.1% versus 3.2%, RR 2.44, 95% CI 1.37 to 4.33) and chorioamnionitis (Analysis 2.8; 4 studies, 29,198 women, 3.5% versus 1.1%, RR 3.43, 95% CI 1.36 to 8.64).The mode of delivery (caesarean section (Analysis 2.9; very low quality of evidence because of imprecision and strongly suspected publication bias (summary of findings Table 2)) or instrumental delivery (Analysis 2.10)), the length of labour (precipitous (Analysis 2.11) or prolonged (Analysis 2.12)), the rate of induction of labour with or without oxytocin to (Analysis 2.13), the use of oxytocin (Analysis 2.14), the use of analgesia (epidural (Analysis 2.15), pethidine (Analysis 2.16) or NOS (Analysis 2.17)), cervical stenosis (Analysis 2.18) or antepartum haemorrhage (Analysis 2.19). was not affected by treatment. The risk of postpartum haemorrhage was increased after treatment, but this outcome included just one study (Analysis 2.20; 1 study, 149 women, 18.7% versus 4.1%, RR 4.60, 95% CI 1.38 to 15.36). The risk of massive obstetric haemorrhage was not increased but there was only one small study (Analysis 2.21). As expected, the rate of cervical cerclage insertion was higher for treated as opposed to non‐treated women (Analysis 2.22; 8 studies, 141,300 women, 4.0% versus 0.7%, RR 14.29, 95% CI 2.85 to 71.65) and more so for CKC (Analysis 2.22.1: RR 31.42, 95% CI 2.32 to 426.22) and excisional treatment NOS (Analysis 2.22.4: RR 42.45, 95% CI 28.99 to 62.16) based on low‐ or very low‐quality evidence.
Neonatal outcomes
More than 30 studies assessed one or more neonatal outcomes. Cervical treatment (excisional or ablative) was associated with a higher frequency of adverse neonatal outcomes as opposed to women who had not been treated (comparison group not specified). The association with adverse neonatal events was stronger and more frequent for excisional as opposed to ablative techniques and with increasing treatment radicality, although the number of studies for each individual treatment technique was often limited.
More specifically, cervical treatment overall increased the risk of low birth weight (LBW) for some, but not all, cut‐offs, although the number of studies was small for most cut‐offs (less than 2500 g (Analysis 3.1): 30 studies, 1,348,206 women, 7.9% versus 3.7%, RR 1.81, 95% CI 1.58 to 2.07, very low quality of evidence because of substantial (I2 63%) heterogeneity (summary of findings Table 2); less than 2000 g (Analysis 3.2): 3 studies, 74,981 women, 4.7% versus 1.1%, RR 2.49, 95% CI 0.97 to 6.36; less than 1500 g (Analysis 3.3)): 5 studies, 76,836 women, 2.0% versus 0.5%, RR 3.00, 95% CI 1.54 to 5.85; less than 1000 g (Analysis 3.4): 2 studies, 2185 women, 1.1% versus 0.3%, RR 2.09, 95% CI 0.06 to 74.71). Treatment also increased the risk of neonatal intensive care unit (NICU) admission (Analysis 3.5: 8 studies, 2557 women, 12.6% versus 8.9%, RR 1.45, 95% CI 1.16 to 1.81, low quality of evidence (summary of findings Table 2)) and perinatal mortality (Analysis 3.6: 23 studies, 1,659,433 women, 0.9% versus 0.7%, RR 1.51, 95% CI 1.13 to 2.03, low quality of evidence (summary of findings Table 2)). Subgroup analyses of the perinatal mortality for different gestational ages at delivery was also included (Analysis 3.7; Analysis 3.8; Analysis 3.9). The rate of stillbirth was not affected by treatment (Analysis 3.10), while the analysis on the impact of treatment on the Apgar scores only included a small number of studies (Analysis 3.11; Analysis 3.12; Analysis 3.13).
The rate of neonates born with A birth weight of less than 2500 g was more frequently observed in women treated with CKC (Analysis 3.1.1: 5 studies, 30,304 women, RR 2.51, 95% CI 1.78 to 3.53), LLETZ (Analysis 3.1.3: 12 studies, 3357 women, RR 2.11, 95% CI 1.51 to 2.94), excisional (Analysis 3.1.6: 10 studies, 823,648 women, RR 2.01, 95% CI 1.62 to 2.49) or ablative (Analysis 3.1.7: 4 studies, 483,402 women, RR 1.36, 95% CI 1.19 to 1.55) treatment NOS, but not so for laser ablation (Analysis 3.1.4: RR 1.07, 95% CI 0.59 to 1.92), although only four studies with a total of 1104 participants assessed that comparison. The rate of NICU admission was increased overall (Analysis 3.5), and for LLETZ (Analysis 3.5.2: 5 studies, 1994 women, RR 1.42, 95% CI 1.01 to 1.99) and excisional technique NOS (Analysis 3.5.4: 2 studies, 434 women, RR 1.76, 95% CI 1.13 to 2.75). Perinatal mortality was greater for treated women overall (Analysis 3.6), and for excisional technique NOS (Analysis 3.6.7: 5 studies, 820,028 women, RR 1.85, 95% CI 1.02 to 3.36), but not for the individual techniques, possibly due to the limited number of studies and the low prevalence of the outcome. Subgroup analysis according to the different comparison groups or cone depths was not possible due to the limited number of studies assessing each outcome based on low‐ or very low‐quality evidence.
Discussion
Summary of main results
The results of this systematic review suggest that all types of local cervical treatment technique (excisional or destructive) are associated with an increased risk of preterm birth (PTB) and adverse obstetric sequelae. This is the first systematic review that includes subgroup analyses according to the depth (and volume) of treatment, the number of treatments and the comparison group used.
The knowledge that local treatment for cervical pre‐cancer, particularly excisional treatment, increases the risk of PTB has led to major changes in clinical practice. With a rapidly evolving evidence base and inconsistencies in the published literature (Castanon 2012; Conner 2013; Danhof 2015; Jakobsson 2009; Jin 2014; Reilly 2012), a high‐quality synthesis of the evidence should be available for effective patient counselling at colposcopy and antenatal clinics.
This meta‐analysis documents that any local cervical treatment for cervical pre‐invasive or early invasive disease increases the risk of PTB and adverse sequelae in a subsequent pregnancy, although the impact of small excisions, as opposed to just having the disease, remains uncertain and is likely to be small. Cervical treatment was found to be associated with an increased risk of overall, severe and extreme prematurity, spontaneous PTB, threatened preterm labour, pPROM, chorioamnionitis, low birth weight, neonatal admission and perinatal death. The rate of cervical cerclage was unsurprisingly substantially increased in treated women as opposed to untreated controls. Treatment equally affected outcomes for nulliparous as well as parous, singleton and multiple pregnancies. The analysis suggested that local treatment had no impact on mode of delivery, length of labour, the induction rate, the use of analgesia, the rate of stenosis and haemorrhage .
The magnitude of the effect of treatment was higher for more radical techniques (i.e. cold knife conisation (CKC) > large loop excision of the transformation zone (LLETZ) > laser ablation (LA)) and for excision rather than ablation. Multiple conisations increased four‐fold the risk of PTB compared to untreated controls. Subgroup analyses clearly demonstrated that the risk of PTB directly correlates to the cone dimensions (depth and volume) and progressively increases with increasing cone depth (‘dose‐effect’). Although the risk was increased even for excisions measuring less than 10 mm in depth, this was almost two‐fold higher for excisions of more than 10 mm, three‐fold higher for more than 15 MM to 17 mm and almost five‐fold higher for excisions exceeding 20 mm in depth.
It has been previously suggested that the impact of treatment on the risk of PTB may not be a consequence of treatment but rather a product of other confounders present in women with cervical disease (Castanon 2012; Kyrgiou 2012; Reilly 2012). Our subgroup analyses that stratified the risk to the comparator used, clearly documents that although the risk of PTB is increased after treatment, irrespective of the comparison group used, the choice of comparator may over‐inflate or under‐estimate the effect of treatment. The magnitude of effect was higher when external controls were used, followed by internal control, followed by women who had cervical intra‐epithelial neoplasia (CIN), but who were not treated. The analyses in women with high‐grade squamous intra‐epithelial lesion (HSIL) but no treatment only included three studies and 3764 participants; we were unable to draw any firm conclusions from this comparison. When we assessed the risk of PTB according to the cone depth when compared to women with CIN but no treatment, we noted the same direction of effect. Although the difference in the risk for PTB for small excisions (10 mm to 12 mm or less) as opposed to just having CIN but no treatment did not differ greatly, the number of studies assessing that comparison was however small and firm conclusions cannot be drawn. We also found that women with CIN have a higher baseline risk of prematurity when compared to the general population.
Overall completeness and applicability of evidence
For some of the outcomes of interest, we identified only a small number of studies and a limited number of participants. The cut‐off used for the definitions of severe and extreme prematurity and for different cone depths varied slightly across studies; these were merged in broader groups for the analysis. Individual patient meta‐analysis data is required to more accurately describe the stratified risk of PTB for individual cone depths. The data on the cone dimensions relied on retrospective documentation data recorded in histopathology reports of formalin‐fixed samples with obvious limitations. The formulas used for the volume calculation also varied across studies. Future research should aim to correlate outcomes with prospective precise done depth and cervical measurements.
Both the included and excluded studies demonstrated a wide range of inclusion/exclusion criteria and outcome measures limiting statistical pooling of all the primary studies. There should be agreement amongst academic colposcopists and obstetricians on core research clinical outcome measures in line with the CROWN initiative of the premier reproductive health journals (http://www.crown‐initiative.org/aims‐and‐scope/). This would improve the applicability of findings of primary and secondary research internationally.
Quality of the evidence
This meta‐analysis included a large number of studies (69 cohorts) with sufficient sample size and power to explore several comparisons of treatment techniques and cone depths. We performed analyses for the different comparison groups used across studies and made observations on how this impacts on the results.
However, the results should be interpreted with caution. Due to the pre‐malignant nature of the disease, no randomised controlled trials (RCTs) could be identified. All the included studies were cohorts, in the vast majority retrospective. Such reports are at known risk of recall bias and inadequate adjustment for known and unknown confounders, while some of the outcomes of interest were difficult to measure objectively. Many of the studies relied on data collected from structured interviews and mailed questionnaires and in some of these, the response rate was small, increasing also the risk of incomplete outcome data (attrition). Altogether 13 studies were considered to be of very low quality because of attrition bias or recall bias or small number of participants, but we were able to upgrade 31 studies to moderate quality because they were population‐based, had a large number of participants or were prospective. Still, the quality of the evidence based on the GRADE assessment was low or very low for the assessed maternal or fetal outcomes (summary of findings Table for the main comparison) and low or high for analyses regarding the effect of the cone depth (summary of findings Table 2). Although the overall number of studies was large, for some outcomes and comparisons the numbers of studies was small and the analyses did not have sufficient sample sizes to support definite conclusions.
Meta‐regression was possible for some, but not all, possible confounders. For many moderators, the data were reported only in a proportion of the included studies. When these studies were not deemed representative of the whole population of studies, we did not perform meta‐regression as this would introduce bias. Sensitivity and subgroups analyses based on the studies’ quality did not change the effect of the meta‐analysis.
Potential biases in the review process
This review relies on non‐randomised studies and therefore at high risk of bias. Many of the included studies were of low or very low quality.
We opted for the use of unadjusted data for the analysis that was recommended during the protocol and early stages of this review. More recent guidance recommends the use of adjusted as opposed to unadjusted data. This is because unadjusted data may over‐inflate or underestimate the effect of treatment due to other confounding factors. Despite existing controversies, it is possible that the use of adjusted data may better control for existing confounders that may affect the magnitude of the effect in observational studies. In future updates of this review adjusted data will be incorporated to meet he more recent recommendations.
There was no evidence of publication bias apart from one outcome (PTB <32 to 34 weeks of gestation).
One of the major strengths of this systematic review is that this provides a full assessment of the up‐to‐date literature for all clinically relevant outcomes. However, the reporting of a large number of outcomes increases the chance of type 1 statistical error (outcomes will be found to be statistically significant just by chance; incorrect rejection of a true null hypothesis).
Agreements and disagreements with other studies or reviews
The knowledge that local treatment for cervical precancer, particularly excisional, increases the risk of PTB has led to major changes in clinical practice. With an increasing evidence base suggesting that this risk is higher for more radical techniques, there has been a tendency to use less aggressive treatments. Although it was previously thought that the various techniques had comparable efficacy (Martin‐Hirsch 2013), evidence from a population‐based study raised concerns that less radical treatment may increase the risk of post‐treatment invasion (Arbyn 2014; Strander 2014). Although the decreased number of hysterectomies may explain this increase, the move to less conservative methods in another plausible explanation. Additionally, since the first documentation of the reproductive risk associated with treatment almost a decade ago (Kyrgiou 2006), subsequent observational studies and even meta‐analyses reached contradictory conclusions (Arbyn 2008; Bruinsma 2011; Conner 2014; Danhof 2015; Jin 2014; Kyrgiou 2014) and initiated debates within the scientific community. With some authors raising concerns that the progressive reduction in the radicality of treatment has led to increased risk of future of invasion (Arbyn 2014; Strander 2014), and others advocating the move to less radical techniques like laser ablation (LA) for the prevention of treatment‐associated future perinatal morbidity and mortality (Paraskevaidis 2007), high‐quality synthesis of the evidence had become an urgent unmet need. Some of the previous small meta‐analyses suffered methodological flaws and attempted analysis of individual treatment techniques or subgroups minimising the validity of their findings in context with the rest of the literature (Conner 2014; Danhof 2015; Jin 2014). All of the published meta‐analyses failed to analyse the data according to major confounders and stratifiers of risk, the comparison group and the depth of the excision. Although Bruinsma and colleagues first approached the comparison group as a possible confounder, data on the depth and dimensions of the treatment were not available (Bruinsma 2011).
Preterm birth is a major cause of neonatal death and disability and represents an enormous cost to health services and society. While pregnant, these women make up a large proportion of preterm clinics referrals. These referrals have increased from almost none in 1999, to more than 40% in 2012 (Kindinger 2016). Ultrasound‐directed surveillance is labour‐intensive, costly, and may be associated with maternal anxiety, more so because 85% of women post‐excision are effectively low risk and will deliver at term (Bruinsma 2011; Kyrgiou 2006).
With rapidly accumulating evidence correlating cervical treatment to adverse reproductive morbidity, quantification of the comparative obstetric morbidity for different treatment techniques and cone depths was required to assist clinicians' decision‐making and counselling. The results of this meta‐analysis will allow clinicians, patients and policy makers to balance the absolute increase in reproductive morbidity with increasing treatment radicality. Patients should be informed that treatment increases the risk of PTB, as opposed to having CIN only, but the absolute increase in risk in small type 1 excisions is likely to be low, if any.
Furthermore, the quantified individual risk stratified by treatment and cone depth could allow obstetricians the selection of those considered to be at high risk of PTB that would benefit from intensive surveillance antenatally and minimise the unnecessary interventions for those at low risk. The antenatal management of women after treatment has been inconsistent and largely unit‐ or clinician‐dependent (Buller 1982). The risks and benefits associated with various interventions in pregnant women with a history of cervical treatment have not been fully assessed in properly designed studies (Kindinger 2016). Future research should assess their value in this distinct clinical group and devise a logical prevention strategy.

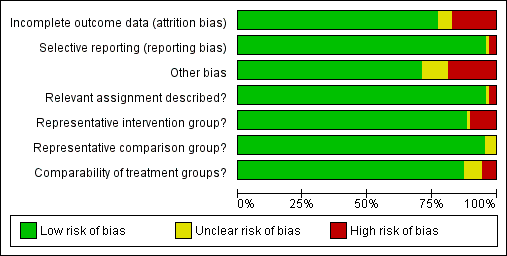
'Risk of bias' graph: review authors' judgements about each risk of bias item presented as percentages across all included studies.

'Risk of bias' summary: review authors' judgements about each risk of bias item for each included study.

Comparison 1 Maternal Outcomes‐PTB, Outcome 1 PTB (<37w).

Comparison 1 Maternal Outcomes‐PTB, Outcome 2 PTB (<37w)‐Analysis by treatment modality.
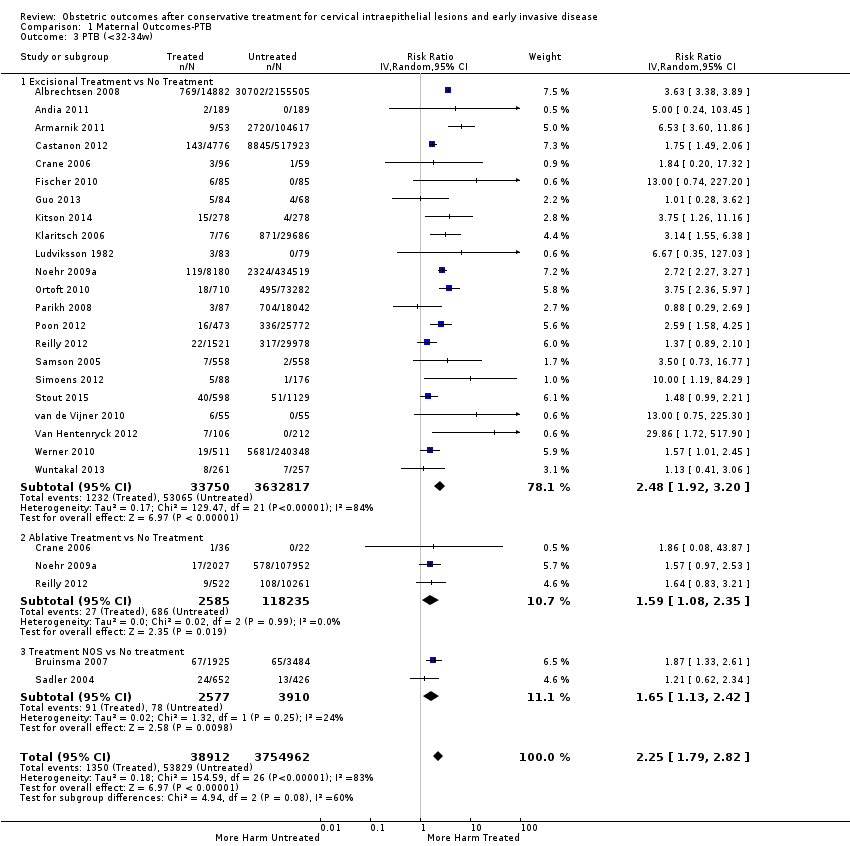
Comparison 1 Maternal Outcomes‐PTB, Outcome 3 PTB (<32‐34w).

Comparison 1 Maternal Outcomes‐PTB, Outcome 4 PTB (<32‐34w)‐Analysis by treatment modality.

Comparison 1 Maternal Outcomes‐PTB, Outcome 5 PTB (<28‐30w).
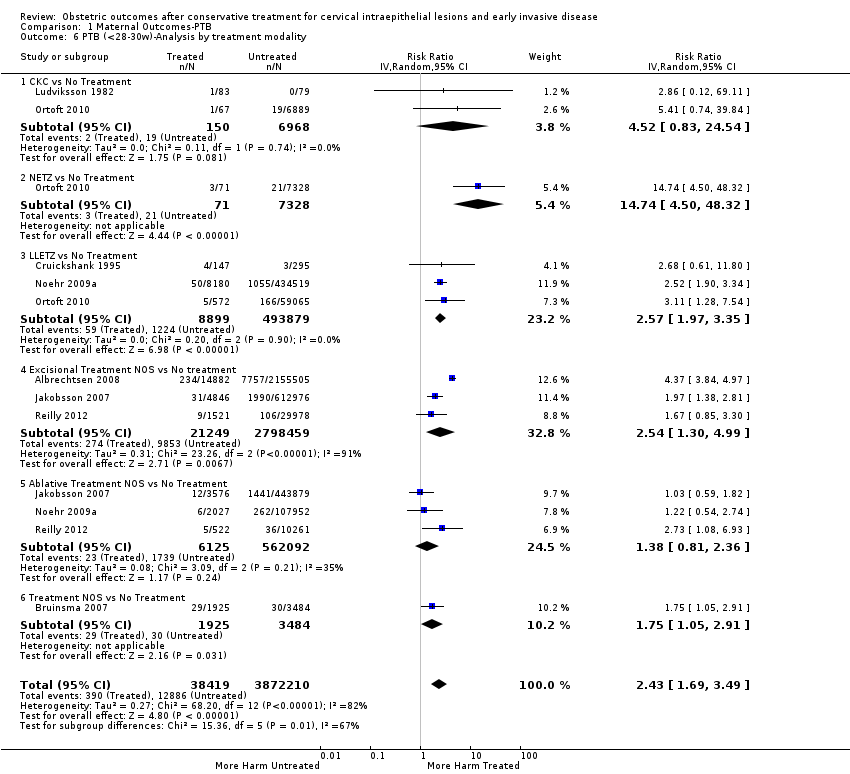
Comparison 1 Maternal Outcomes‐PTB, Outcome 6 PTB (<28‐30w)‐Analysis by treatment modality.
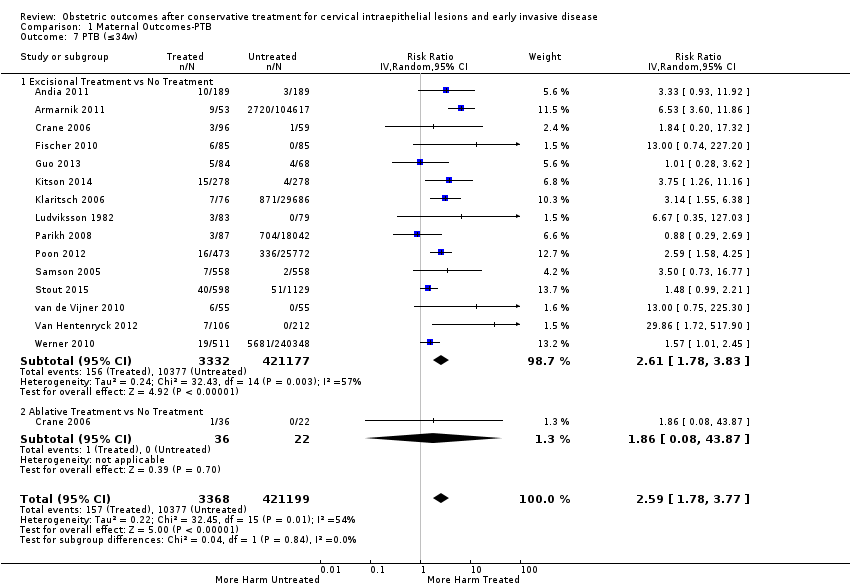
Comparison 1 Maternal Outcomes‐PTB, Outcome 7 PTB (≤34w).
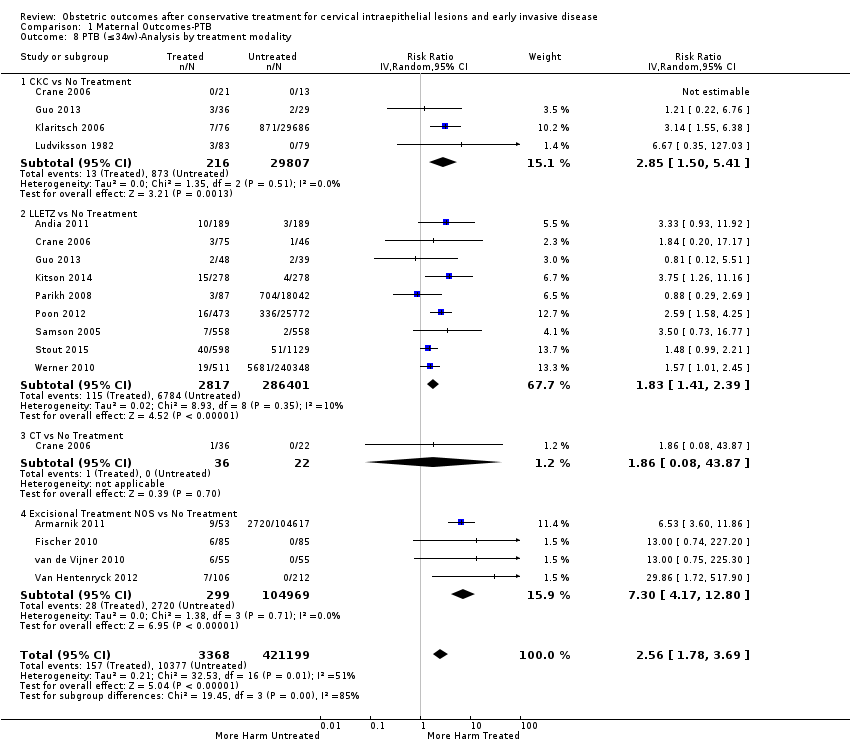
Comparison 1 Maternal Outcomes‐PTB, Outcome 8 PTB (≤34w)‐Analysis by treatment modality.

Comparison 1 Maternal Outcomes‐PTB, Outcome 9 PTB (<32‐33w).

Comparison 1 Maternal Outcomes‐PTB, Outcome 10 PTB (<32‐33w)‐Analysis by treatment modality.

Comparison 1 Maternal Outcomes‐PTB, Outcome 11 PTB (<30w).
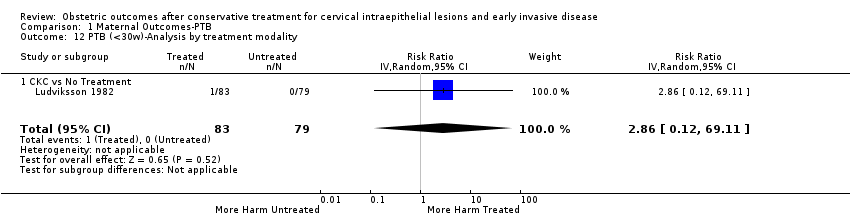
Comparison 1 Maternal Outcomes‐PTB, Outcome 12 PTB (<30w)‐Analysis by treatment modality.
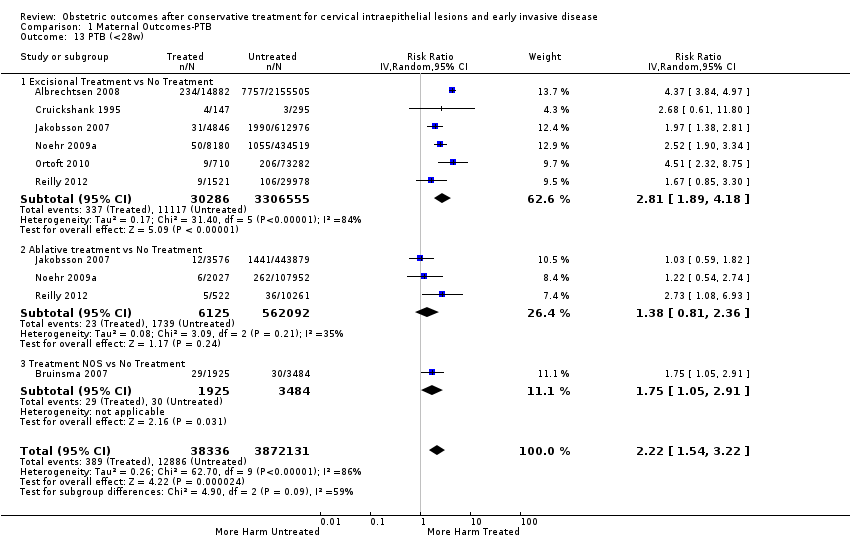
Comparison 1 Maternal Outcomes‐PTB, Outcome 13 PTB (<28w).

Comparison 1 Maternal Outcomes‐PTB, Outcome 14 PTB (<28w)‐Analysis by treatment modality.

Comparison 1 Maternal Outcomes‐PTB, Outcome 15 PTB (<37w)‐Nulliparous women.

Comparison 1 Maternal Outcomes‐PTB, Outcome 16 PTB (<37w)‐Parous women.
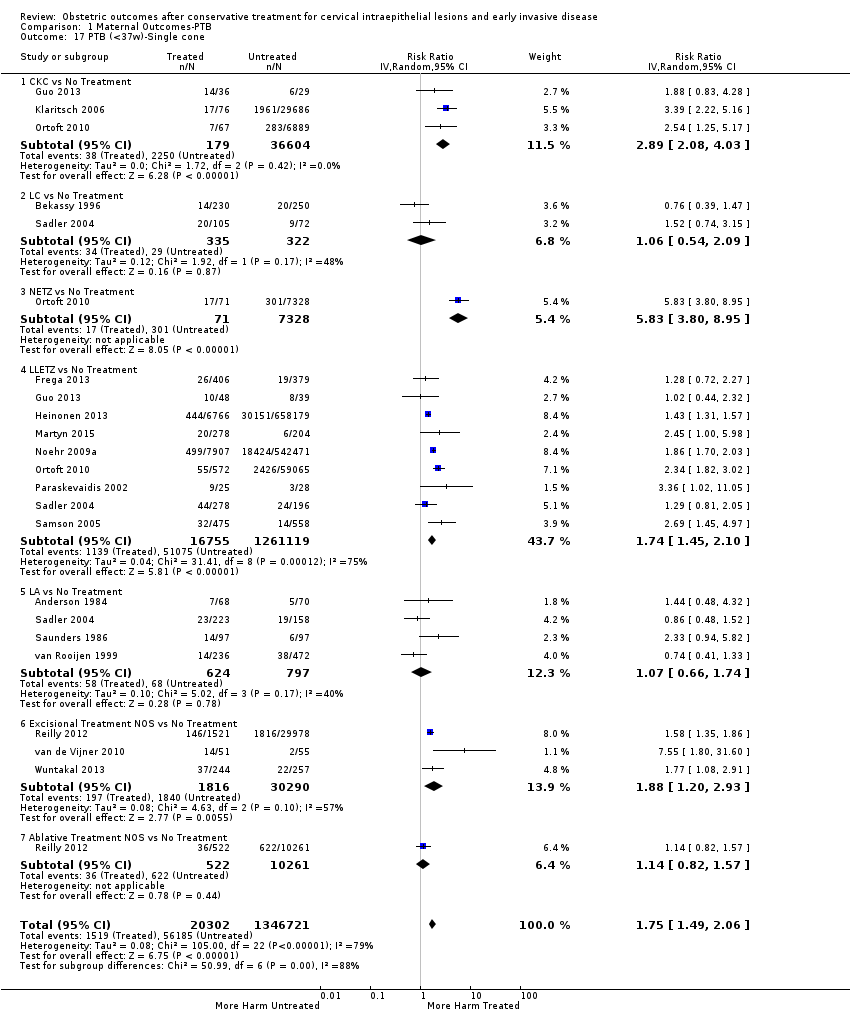
Comparison 1 Maternal Outcomes‐PTB, Outcome 17 PTB (<37w)‐Single cone.

Comparison 1 Maternal Outcomes‐PTB, Outcome 18 PTB (<37w)‐Repeat cones.

Comparison 1 Maternal Outcomes‐PTB, Outcome 19 PTB (<37w)‐Singleton pregnancies.

Comparison 1 Maternal Outcomes‐PTB, Outcome 20 PTB (<37w)‐Multiple pregnancies.
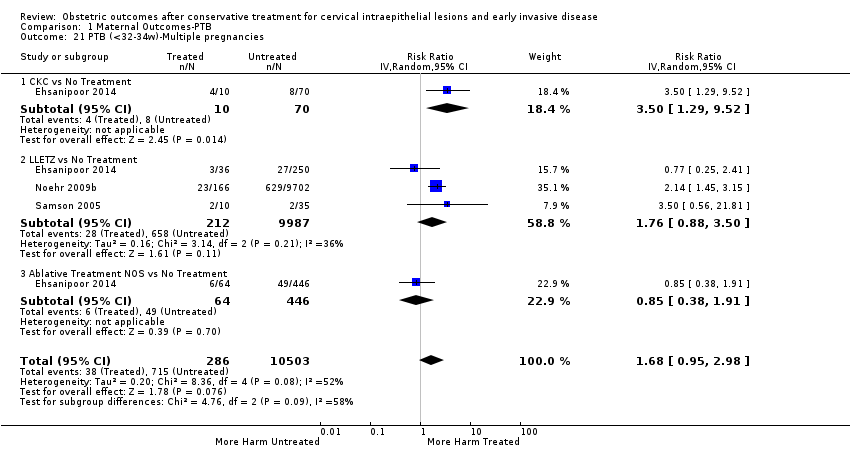
Comparison 1 Maternal Outcomes‐PTB, Outcome 21 PTB (<32‐34w)‐Multiple pregnancies.
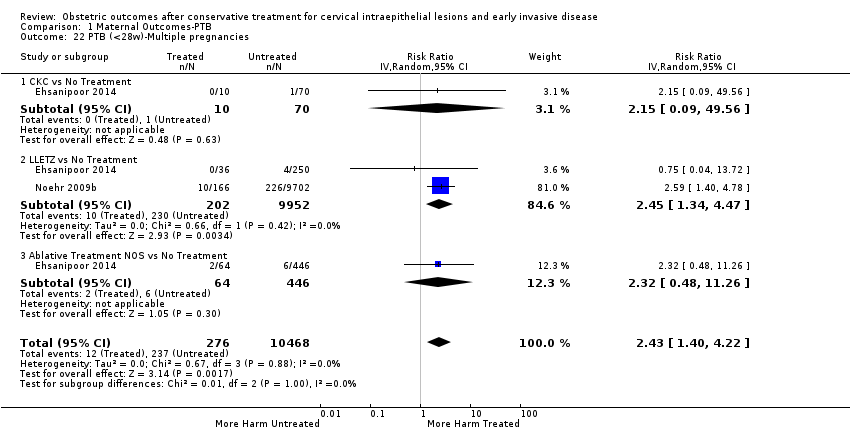
Comparison 1 Maternal Outcomes‐PTB, Outcome 22 PTB (<28w)‐Multiple pregnancies.

Comparison 1 Maternal Outcomes‐PTB, Outcome 23 PTB (<37w)‐Depth≤10‐12mm.

Comparison 1 Maternal Outcomes‐PTB, Outcome 24 PTB (<37w)‐Depth≥10‐12mm.

Comparison 1 Maternal Outcomes‐PTB, Outcome 25 PTB (<37w)‐Depth≥15‐17mm.

Comparison 1 Maternal Outcomes‐PTB, Outcome 26 PTB (<37w)‐Depth≥20mm.
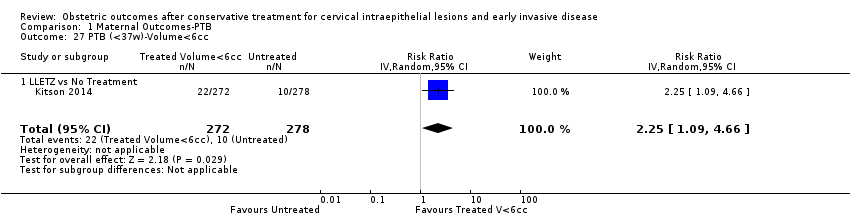
Comparison 1 Maternal Outcomes‐PTB, Outcome 27 PTB (<37w)‐Volume<6cc.

Comparison 1 Maternal Outcomes‐PTB, Outcome 28 PTB (<37w)‐Volume>6cc.

Comparison 1 Maternal Outcomes‐PTB, Outcome 29 PTB (<37w)‐Depth≤10mm.

Comparison 1 Maternal Outcomes‐PTB, Outcome 30 PTB (<37w)‐Depth≤12mm.
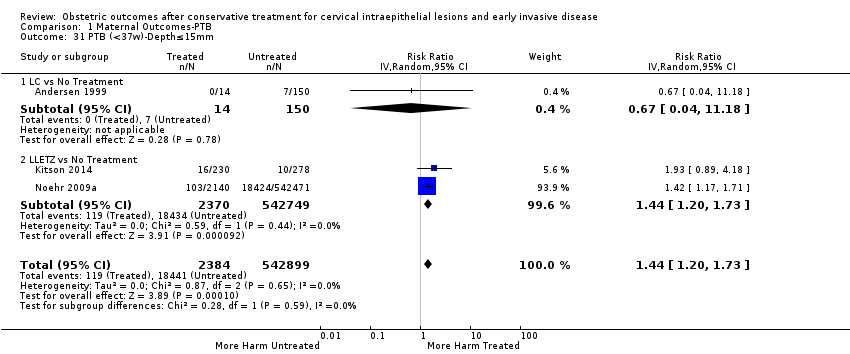
Comparison 1 Maternal Outcomes‐PTB, Outcome 31 PTB (<37w)‐Depth≤15mm.

Comparison 1 Maternal Outcomes‐PTB, Outcome 32 PTB (<37w)‐Depth≤17mm.
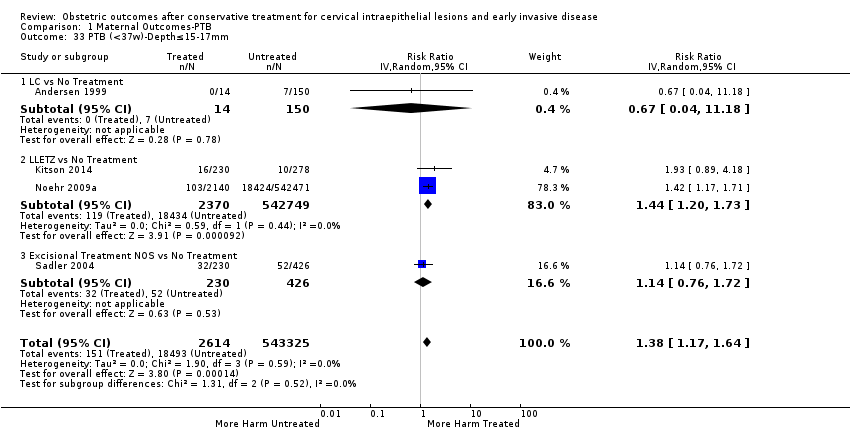
Comparison 1 Maternal Outcomes‐PTB, Outcome 33 PTB (<37w)‐Depth≤15‐17mm.
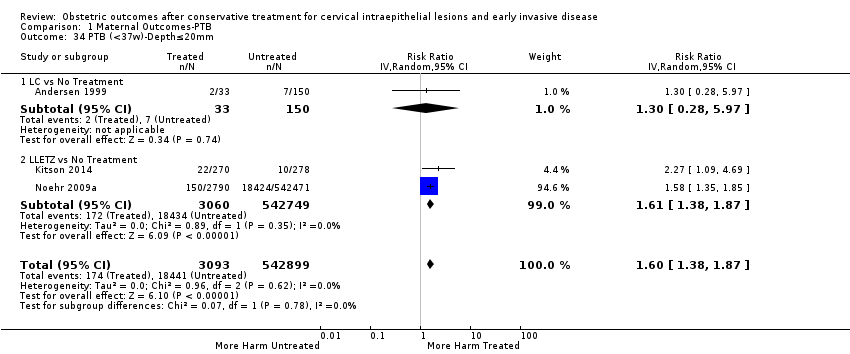
Comparison 1 Maternal Outcomes‐PTB, Outcome 34 PTB (<37w)‐Depth≤20mm.

Comparison 1 Maternal Outcomes‐PTB, Outcome 35 PTB (<37w)‐Depth≥10mm.

Comparison 1 Maternal Outcomes‐PTB, Outcome 36 PTB (<37w)‐Depth≥12mm.
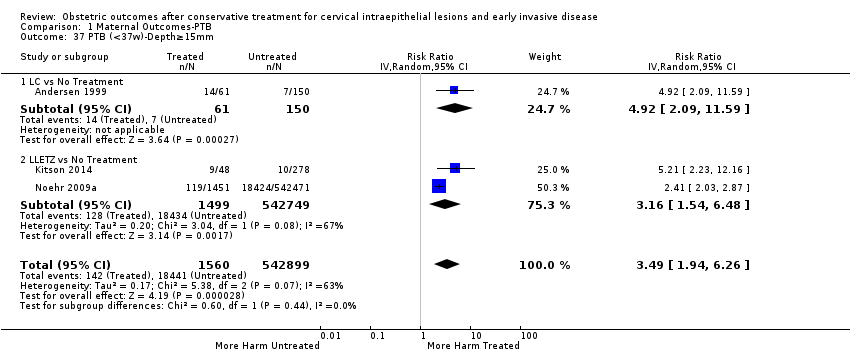
Comparison 1 Maternal Outcomes‐PTB, Outcome 37 PTB (<37w)‐Depth≥15mm.
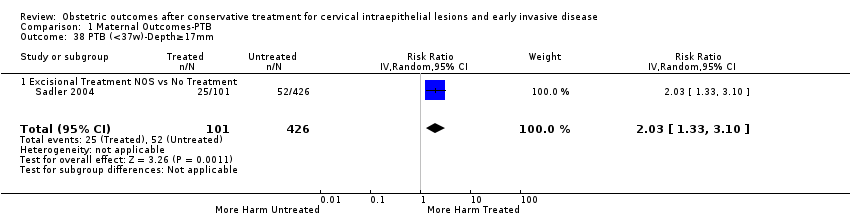
Comparison 1 Maternal Outcomes‐PTB, Outcome 38 PTB (<37w)‐Depth≥17mm.

Comparison 1 Maternal Outcomes‐PTB, Outcome 39 PTB (<37w)‐Depth 10/13‐15/16mm.
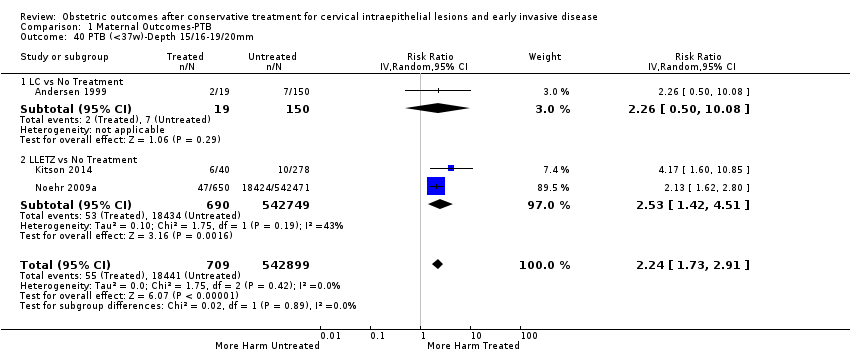
Comparison 1 Maternal Outcomes‐PTB, Outcome 40 PTB (<37w)‐Depth 15/16‐19/20mm.

Comparison 1 Maternal Outcomes‐PTB, Outcome 41 PTB (<37w)‐Volume<3cc.

Comparison 1 Maternal Outcomes‐PTB, Outcome 42 PTB (<37w)‐Volume>3cc.

Comparison 1 Maternal Outcomes‐PTB, Outcome 43 PTB (<37w)‐Depth≥10‐12mm vs ≤10‐12mm.

Comparison 1 Maternal Outcomes‐PTB, Outcome 44 PTB (<37w)‐Depth≥15‐17mm vs ≤15‐17mm.

Comparison 1 Maternal Outcomes‐PTB, Outcome 45 PTB (<37w)‐Depth≥20mm vs ≤20mm.
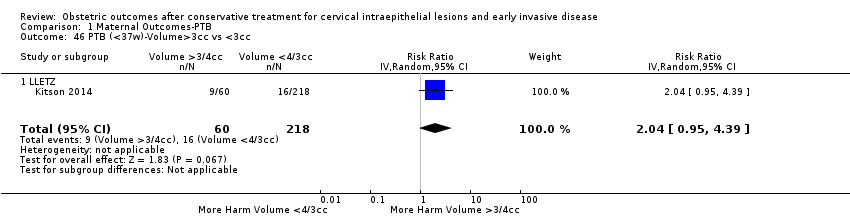
Comparison 1 Maternal Outcomes‐PTB, Outcome 46 PTB (<37w)‐Volume>3cc vs <3cc.
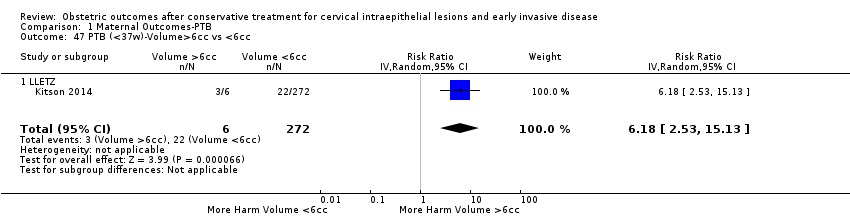
Comparison 1 Maternal Outcomes‐PTB, Outcome 47 PTB (<37w)‐Volume>6cc vs <6cc.

Comparison 1 Maternal Outcomes‐PTB, Outcome 48 PTB (<37w)‐Depth 11/13‐15/16mm vs ≤10‐12mm.

Comparison 1 Maternal Outcomes‐PTB, Outcome 49 PTB (<37w)‐Depth 16‐19mm vs 13‐15mm.
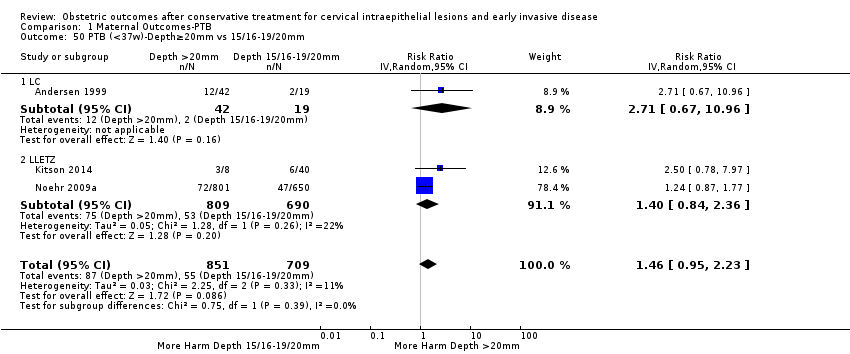
Comparison 1 Maternal Outcomes‐PTB, Outcome 50 PTB (<37w)‐Depth≥20mm vs 15/16‐19/20mm.
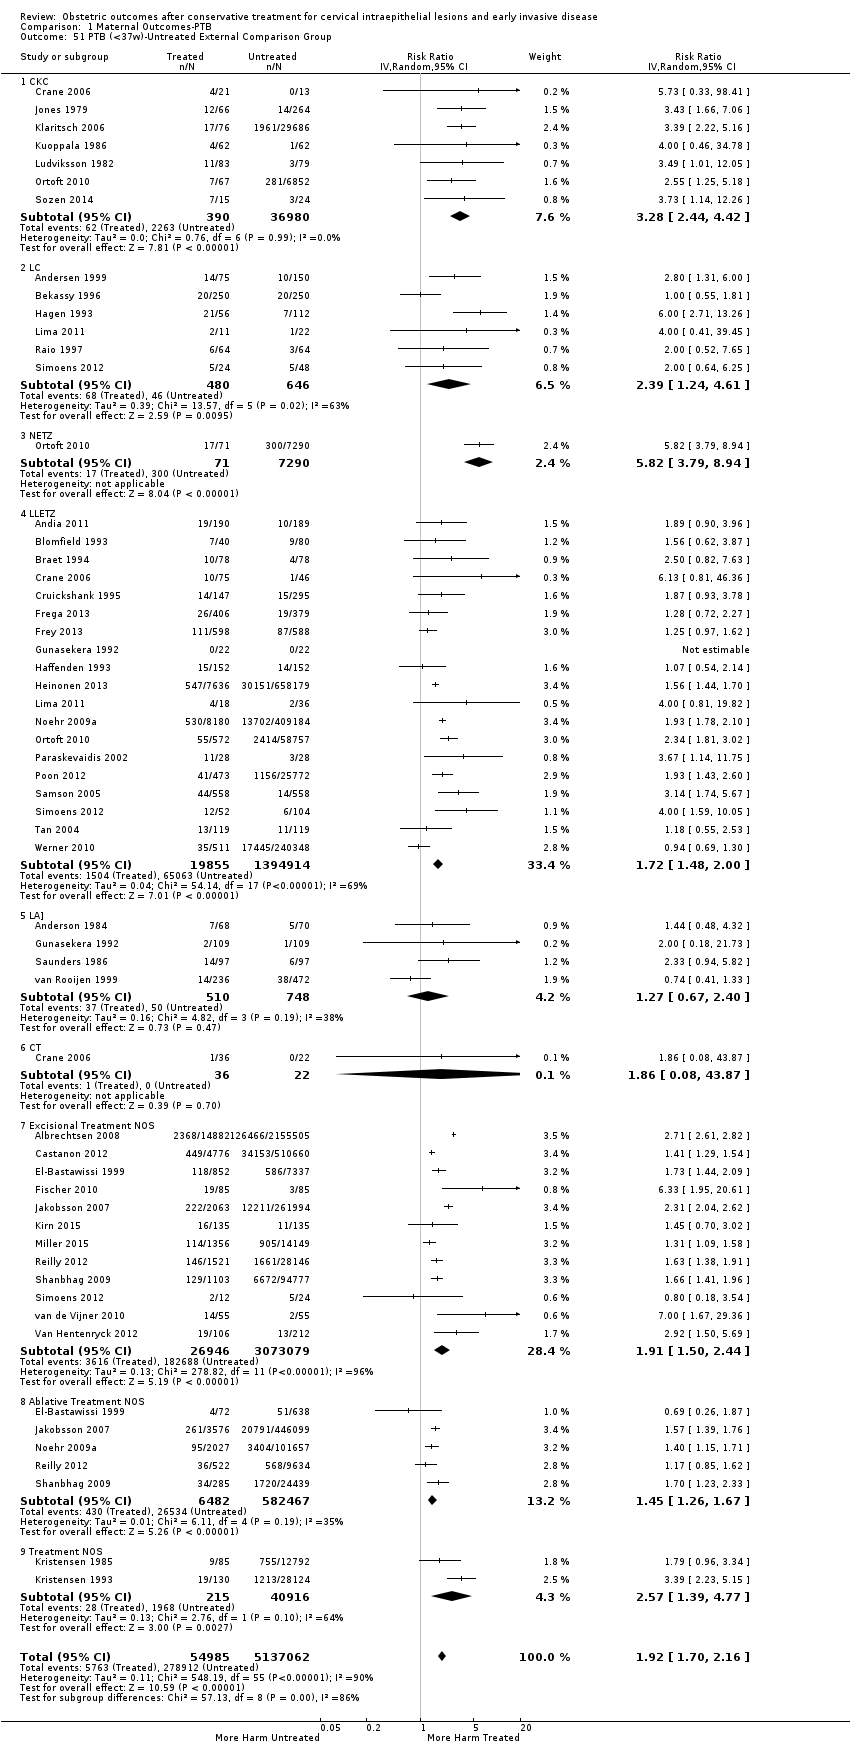
Comparison 1 Maternal Outcomes‐PTB, Outcome 51 PTB (<37w)‐Untreated External Comparison Group.

Comparison 1 Maternal Outcomes‐PTB, Outcome 52 PTB (<37w)‐Untreated Internal Comparison Group (self‐matching).
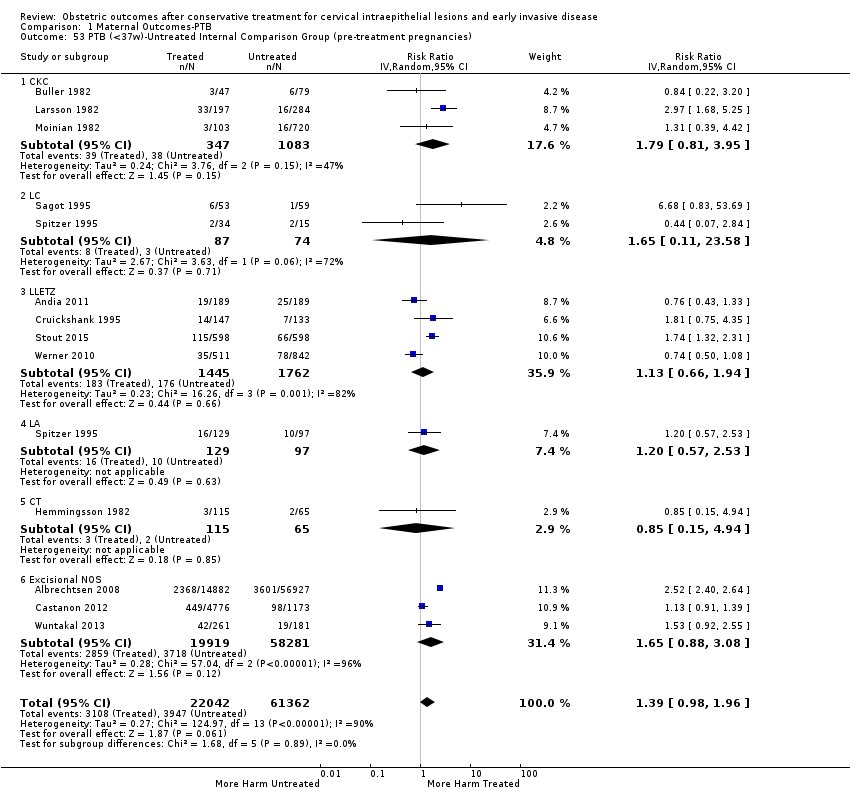
Comparison 1 Maternal Outcomes‐PTB, Outcome 53 PTB (<37w)‐Untreated Internal Comparison Group (pre‐treatment pregnancies).

Comparison 1 Maternal Outcomes‐PTB, Outcome 54 PTB (<37w)‐Untreated Colposcopy+/‐CIN+/‐Biopsy Comparison Group.

Comparison 1 Maternal Outcomes‐PTB, Outcome 55 PTB (<37w)‐Untreated HSIL Comparison Group.

Comparison 1 Maternal Outcomes‐PTB, Outcome 56 PTB (<37w)‐All Comparison Groups.
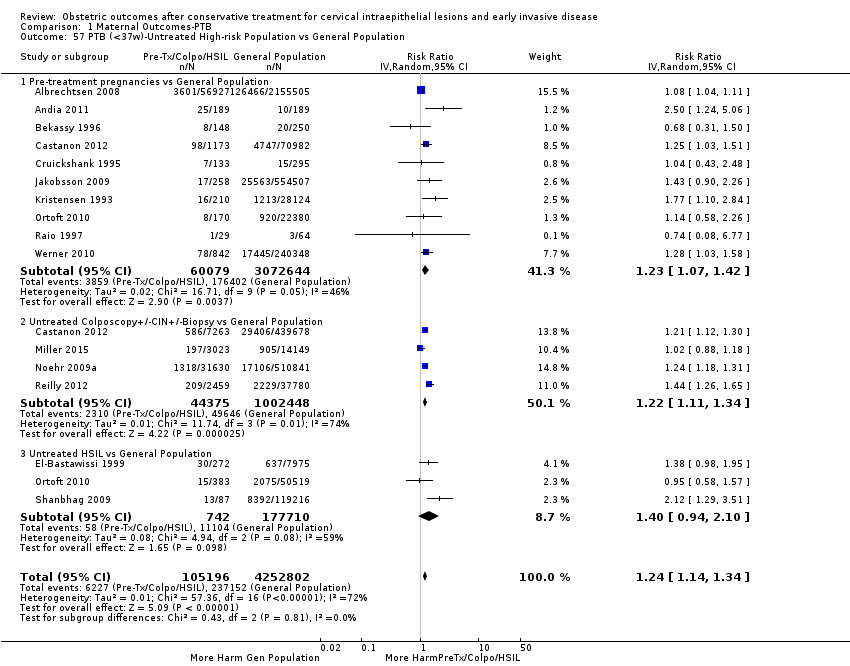
Comparison 1 Maternal Outcomes‐PTB, Outcome 57 PTB (<37w)‐Untreated High‐risk Population vs General Population.
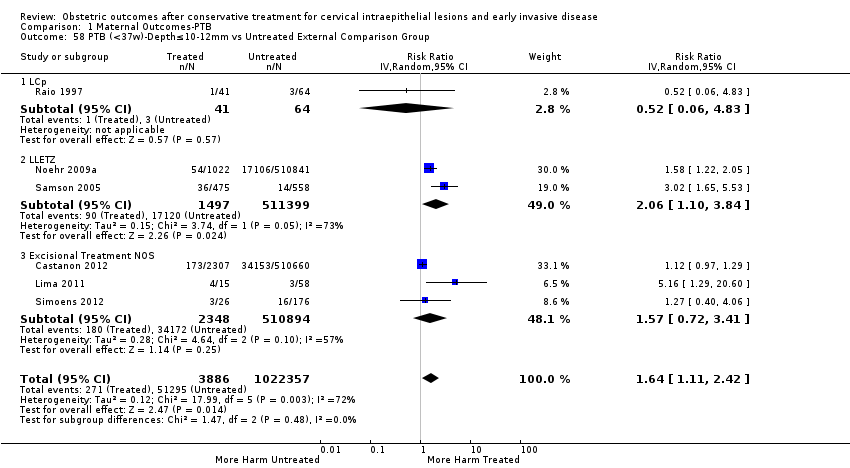
Comparison 1 Maternal Outcomes‐PTB, Outcome 58 PTB (<37w)‐Depth≤10‐12mm vs Untreated External Comparison Group.

Comparison 1 Maternal Outcomes‐PTB, Outcome 59 PTB (<37w)‐Depth≤10‐12mm vs Untreated Internal Comparison Group.
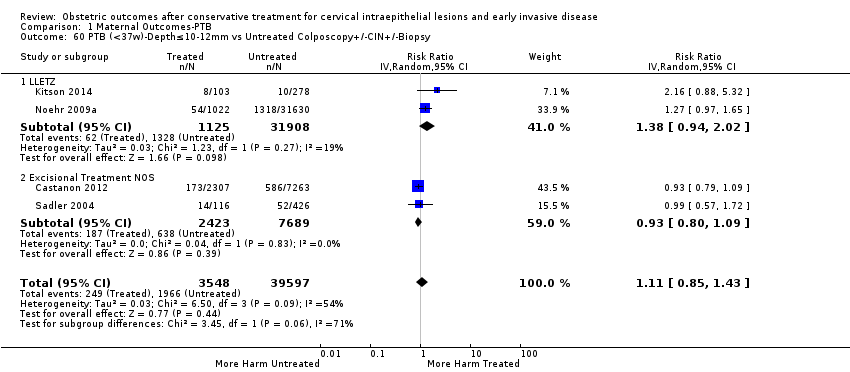
Comparison 1 Maternal Outcomes‐PTB, Outcome 60 PTB (<37w)‐Depth≤10‐12mm vs Untreated Colposcopy+/‐CIN+/‐Biopsy.

Comparison 1 Maternal Outcomes‐PTB, Outcome 61 PTB (<37w)‐Depth≤15‐17mm vs Untreated External Comparison Group.

Comparison 1 Maternal Outcomes‐PTB, Outcome 62 PTB (<37w)‐Depth≤15‐17mm vs Untreated Colposcopy+/‐CIN+/‐Biopsy.
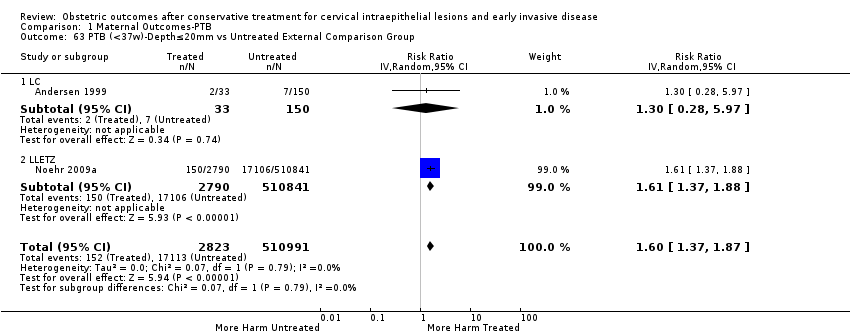
Comparison 1 Maternal Outcomes‐PTB, Outcome 63 PTB (<37w)‐Depth≤20mm vs Untreated External Comparison Group.
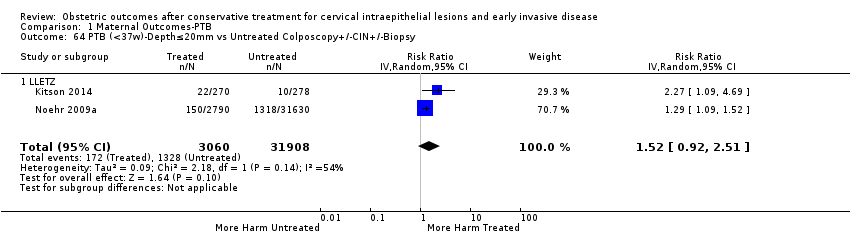
Comparison 1 Maternal Outcomes‐PTB, Outcome 64 PTB (<37w)‐Depth≤20mm vs Untreated Colposcopy+/‐CIN+/‐Biopsy.

Comparison 1 Maternal Outcomes‐PTB, Outcome 65 PTB (<37w)‐Depth≥10‐12mm vs Untreated External Comparison Group.

Comparison 1 Maternal Outcomes‐PTB, Outcome 66 PTB (<37w)‐Depth≥10‐12mm vs Untreated Internal Comparison Group.

Comparison 1 Maternal Outcomes‐PTB, Outcome 67 PTB (<37w)‐Depth≥10‐12mm vs Untreated Colposcopy+/‐CIN+/‐Biopsy.

Comparison 1 Maternal Outcomes‐PTB, Outcome 68 PTB (<37w)‐Depth≥15‐17mm vs Untreated External Comparison Group.
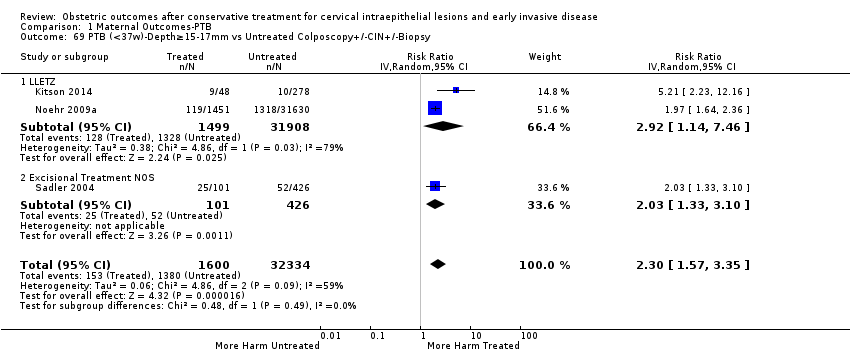
Comparison 1 Maternal Outcomes‐PTB, Outcome 69 PTB (<37w)‐Depth≥15‐17mm vs Untreated Colposcopy+/‐CIN+/‐Biopsy.

Comparison 1 Maternal Outcomes‐PTB, Outcome 70 PTB (<37w)‐Depth≥20mm vs Untreated External Comparison Group.

Comparison 1 Maternal Outcomes‐PTB, Outcome 71 PTB (<37w)‐Depth≥20mm vs Untreated Colposcopy+/‐CIN+/‐Biopsy.

Comparison 1 Maternal Outcomes‐PTB, Outcome 72 PTB (<37w)‐Depth 10/13‐15/16mm vs Untreated External Comparison Group.

Comparison 1 Maternal Outcomes‐PTB, Outcome 73 PTB (<37w)‐Depth 10/13‐15/16mm vs Untreated Colposcopy+/‐CIN+/‐Biopsy.

Comparison 1 Maternal Outcomes‐PTB, Outcome 74 PTB (<37w)‐Depth 15/16‐19/20mm vs Untreated External Comparison Group.

Comparison 1 Maternal Outcomes‐PTB, Outcome 75 PTB (<37w)‐Depth 15/16‐19/20mm vs Untreated Colposcopy+/‐CIN+/‐Biopsy.
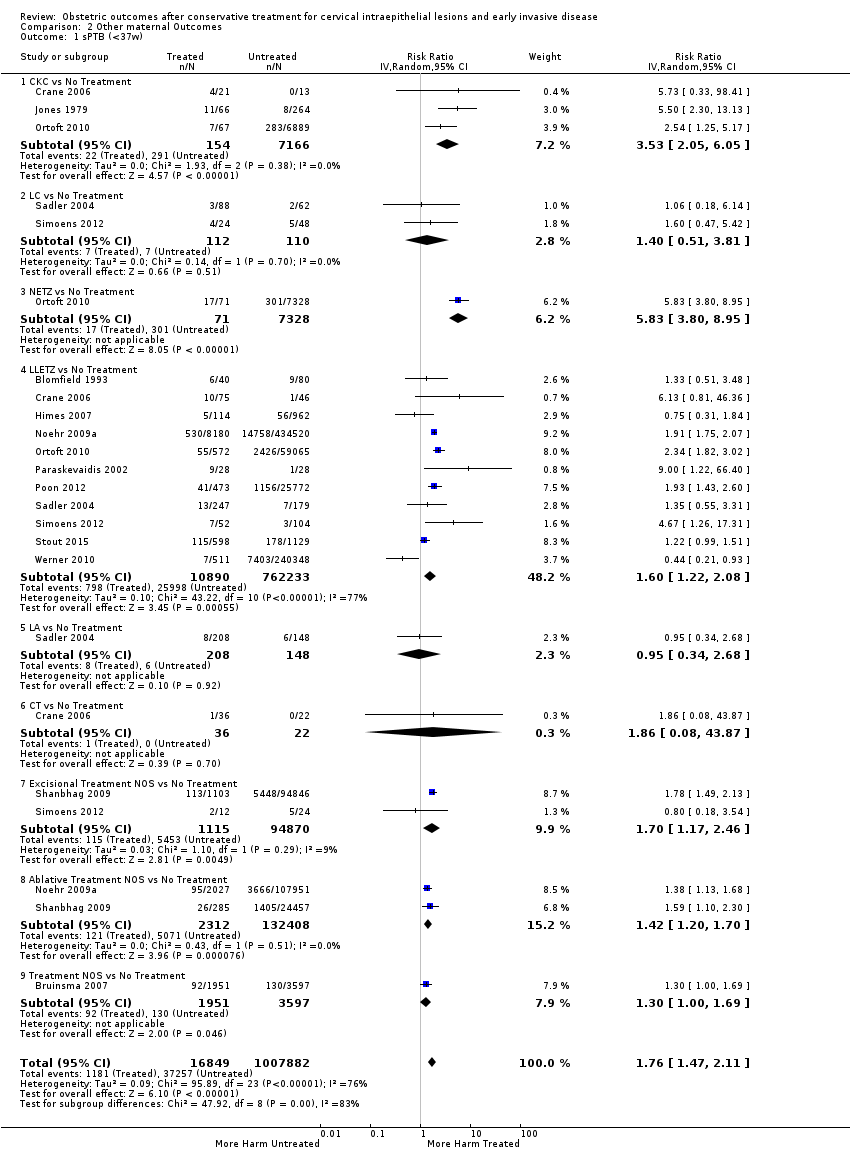
Comparison 2 Other maternal Outcomes, Outcome 1 sPTB (<37w).
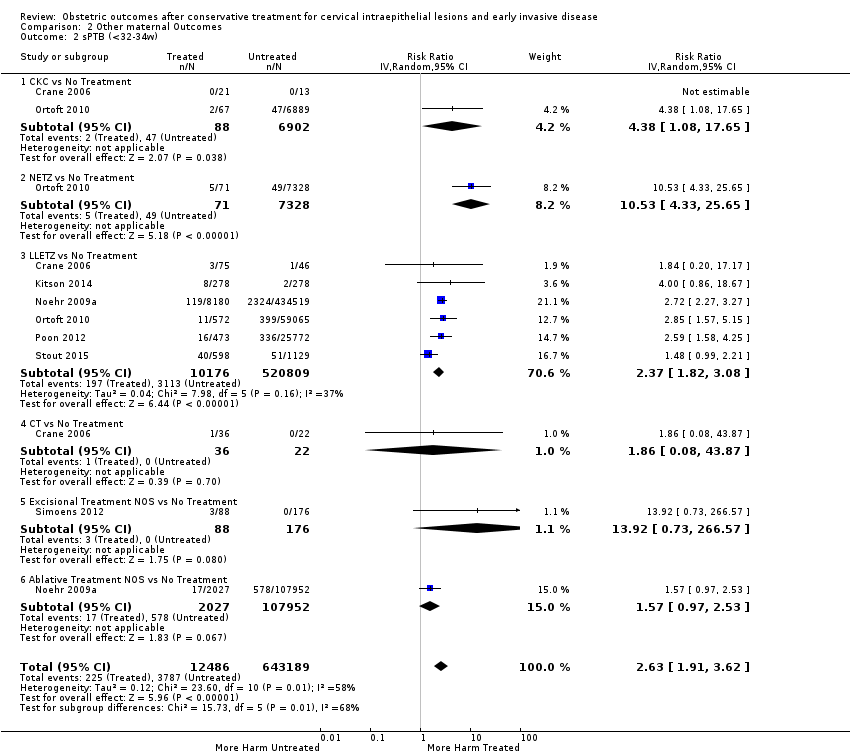
Comparison 2 Other maternal Outcomes, Outcome 2 sPTB (<32‐34w).
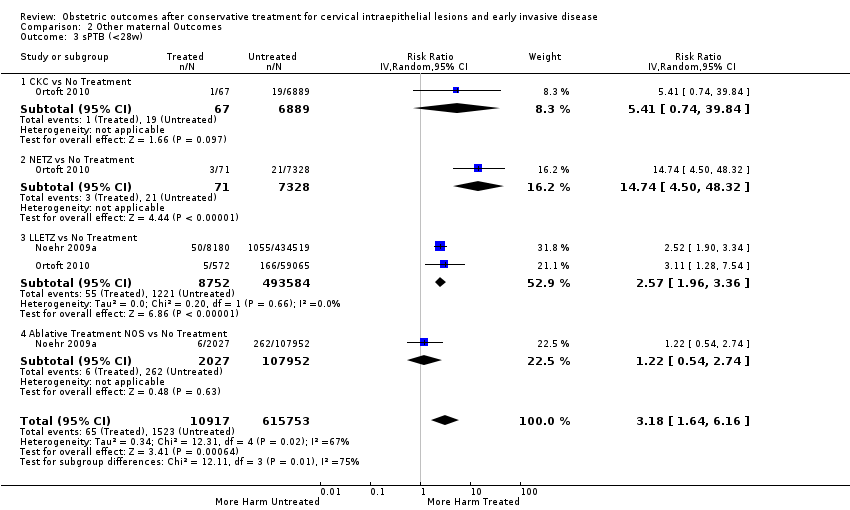
Comparison 2 Other maternal Outcomes, Outcome 3 sPTB (<28w).
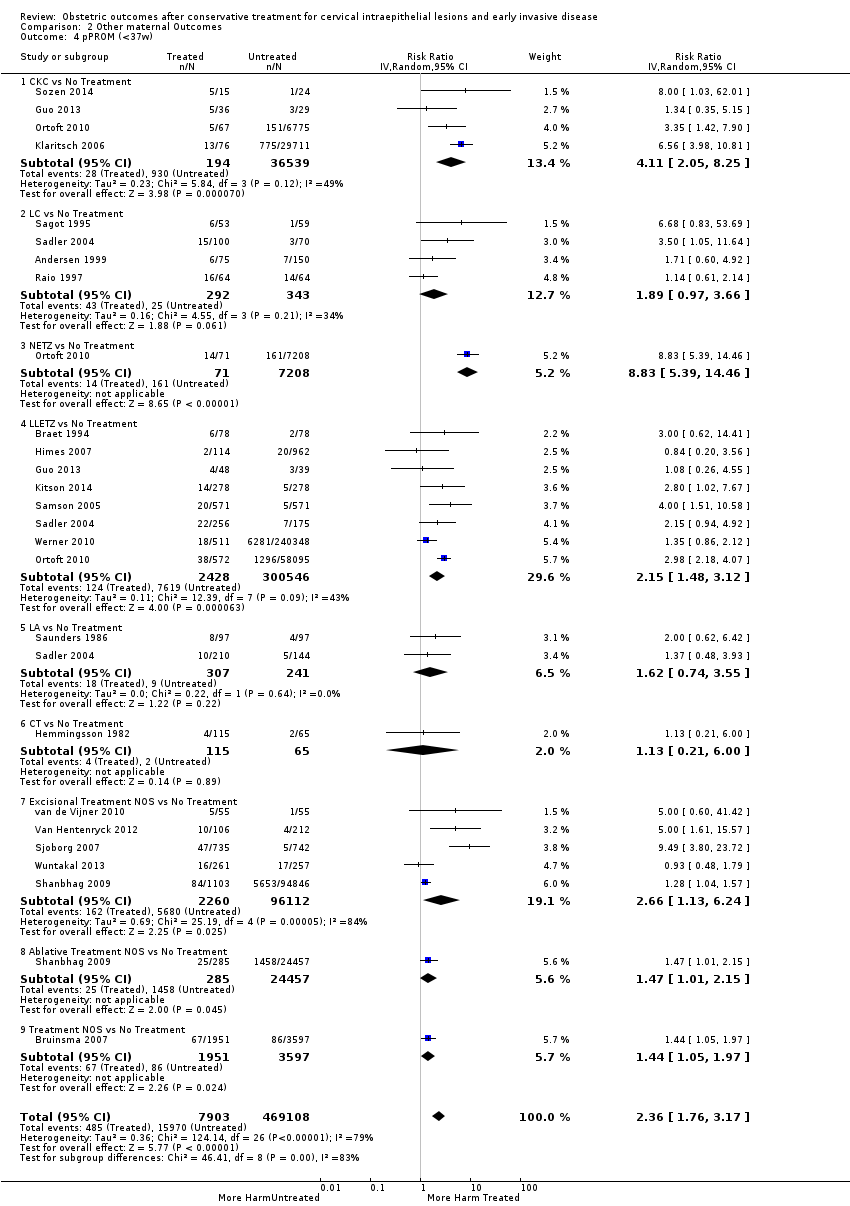
Comparison 2 Other maternal Outcomes, Outcome 4 pPROM (<37w).

Comparison 2 Other maternal Outcomes, Outcome 5 pPROM (<32w).
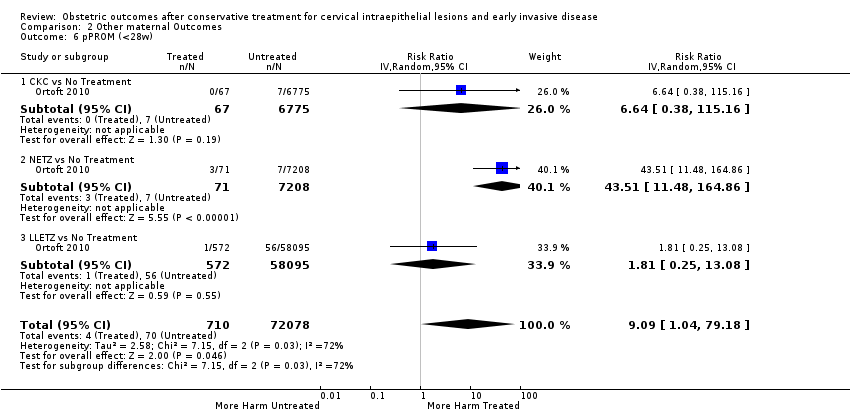
Comparison 2 Other maternal Outcomes, Outcome 6 pPROM (<28w).
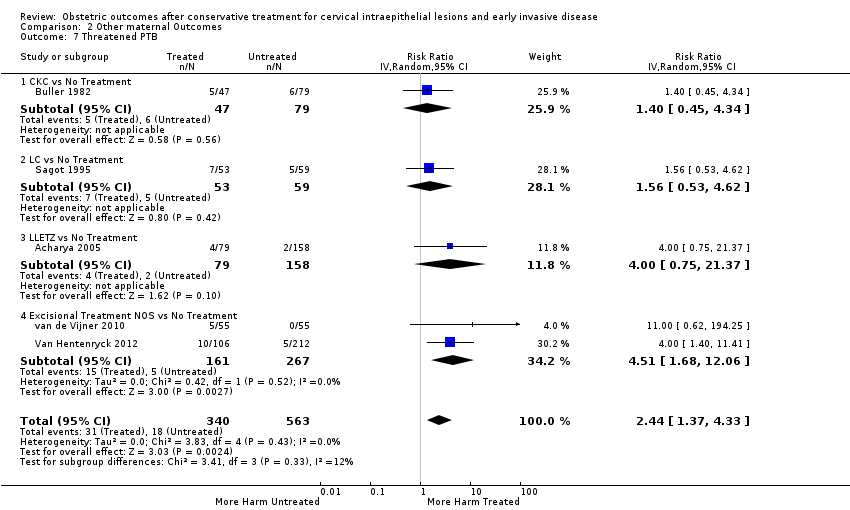
Comparison 2 Other maternal Outcomes, Outcome 7 Threatened PTB.
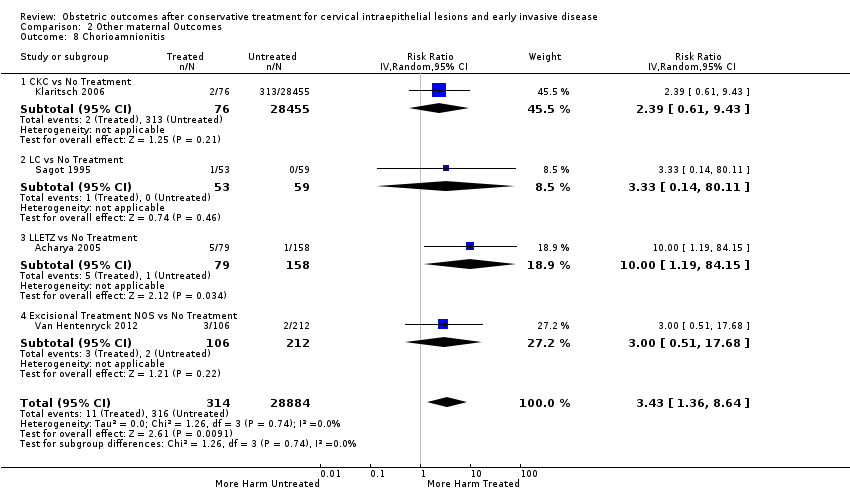
Comparison 2 Other maternal Outcomes, Outcome 8 Chorioamnionitis.
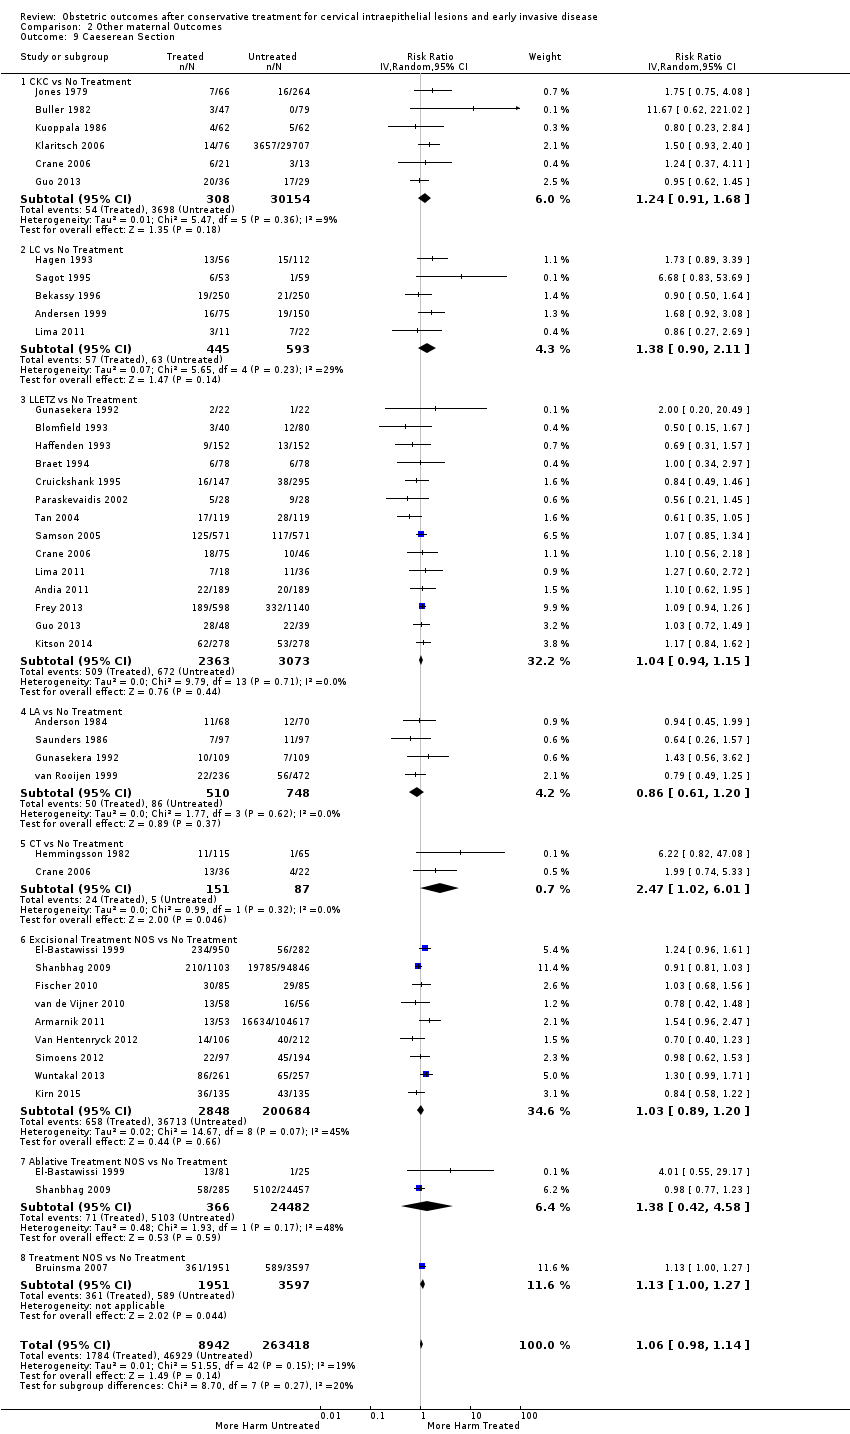
Comparison 2 Other maternal Outcomes, Outcome 9 Caeserean Section.

Comparison 2 Other maternal Outcomes, Outcome 10 Instrumental Deliveries (ventouse/forceps).
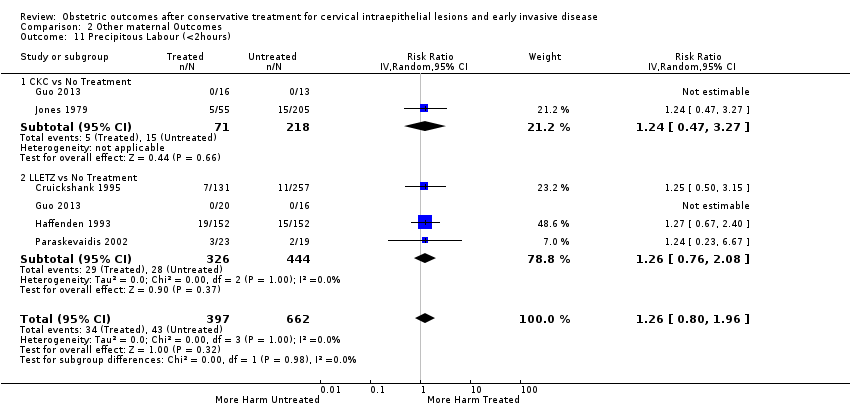
Comparison 2 Other maternal Outcomes, Outcome 11 Precipitous Labour (<2hours).

Comparison 2 Other maternal Outcomes, Outcome 12 Prolonged labour (>12hours).
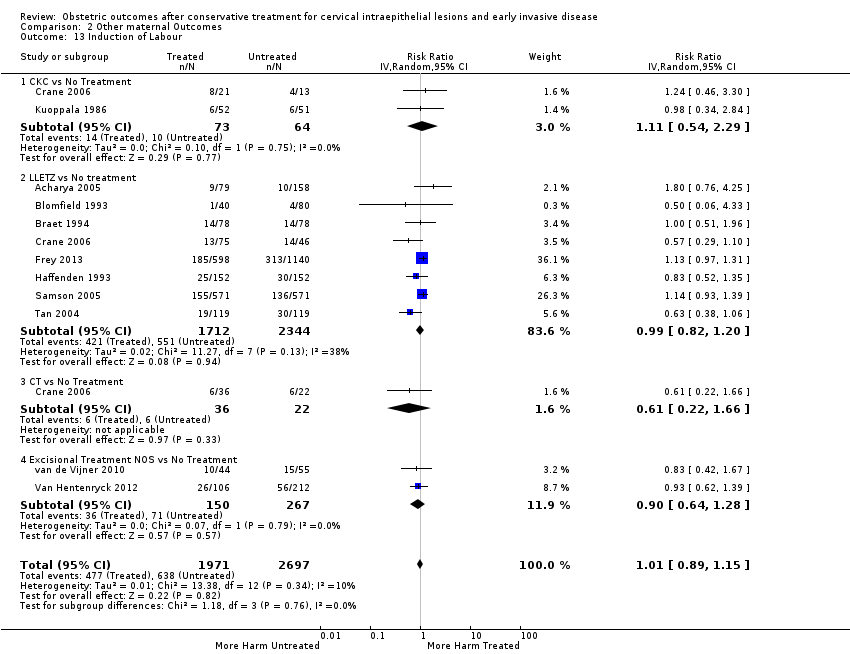
Comparison 2 Other maternal Outcomes, Outcome 13 Induction of Labour.

Comparison 2 Other maternal Outcomes, Outcome 14 Oxytocin Use.

Comparison 2 Other maternal Outcomes, Outcome 15 Epidural Use.

Comparison 2 Other maternal Outcomes, Outcome 16 Pethidine Use.

Comparison 2 Other maternal Outcomes, Outcome 17 Analgesia Use NOS.

Comparison 2 Other maternal Outcomes, Outcome 18 Cervical stenosis.

Comparison 2 Other maternal Outcomes, Outcome 19 Antepartum Haemorrhage.
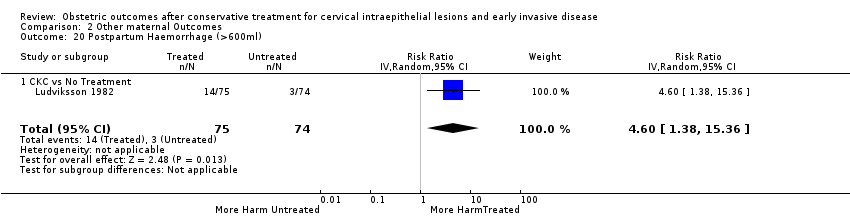
Comparison 2 Other maternal Outcomes, Outcome 20 Postpartum Haemorrhage (>600ml).

Comparison 2 Other maternal Outcomes, Outcome 21 Massive Obstetric Haemorrhage (>1000ml).
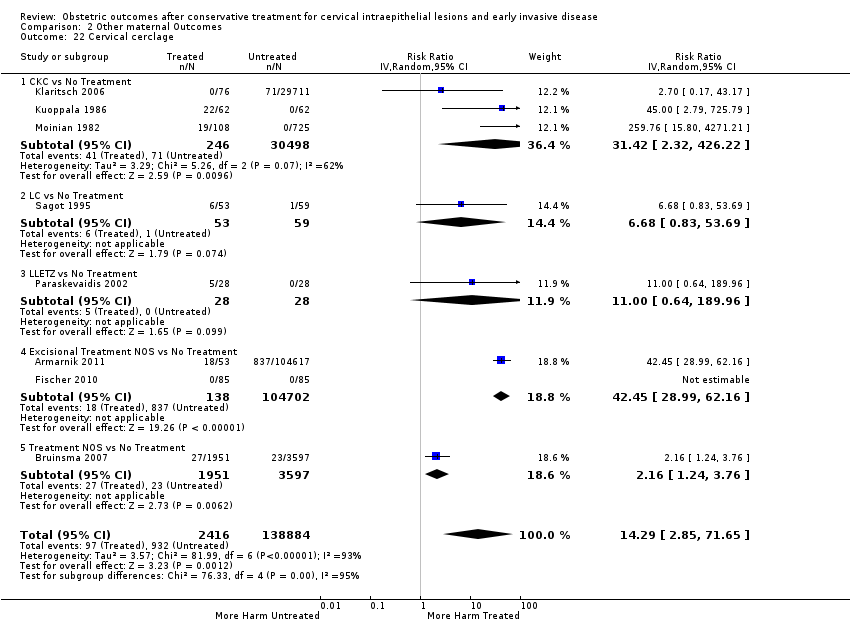
Comparison 2 Other maternal Outcomes, Outcome 22 Cervical cerclage.

Comparison 3 Neonatal Outcomes, Outcome 1 LBW (<2500g).

Comparison 3 Neonatal Outcomes, Outcome 2 LBW (<2000g).
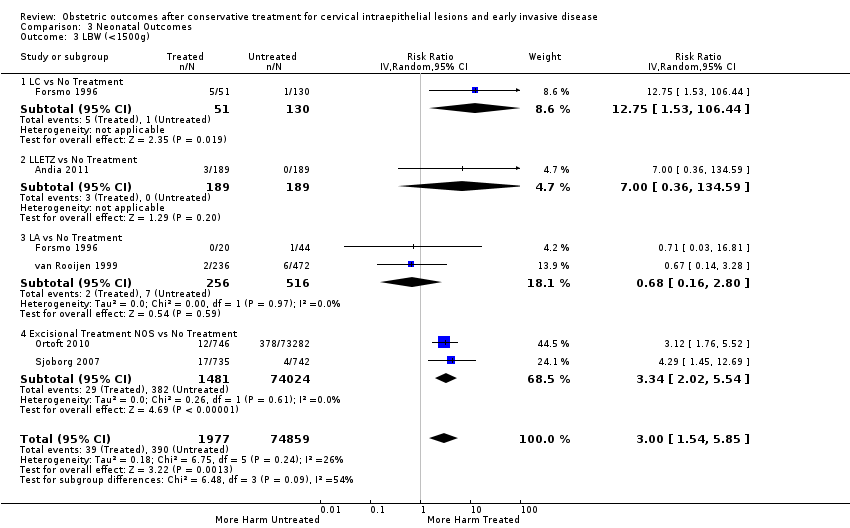
Comparison 3 Neonatal Outcomes, Outcome 3 LBW (<1500g).

Comparison 3 Neonatal Outcomes, Outcome 4 LBW (<1000g).

Comparison 3 Neonatal Outcomes, Outcome 5 NICU Admission.
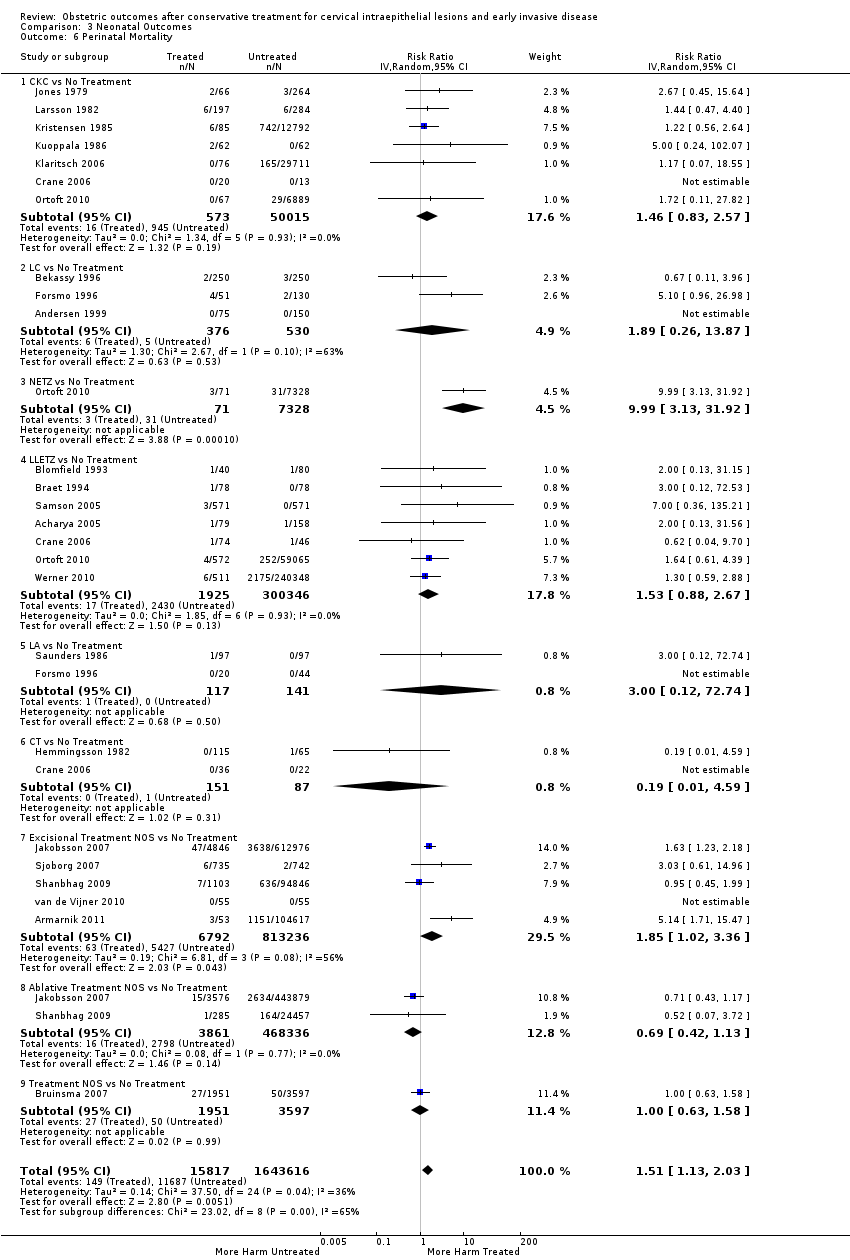
Comparison 3 Neonatal Outcomes, Outcome 6 Perinatal Mortality.
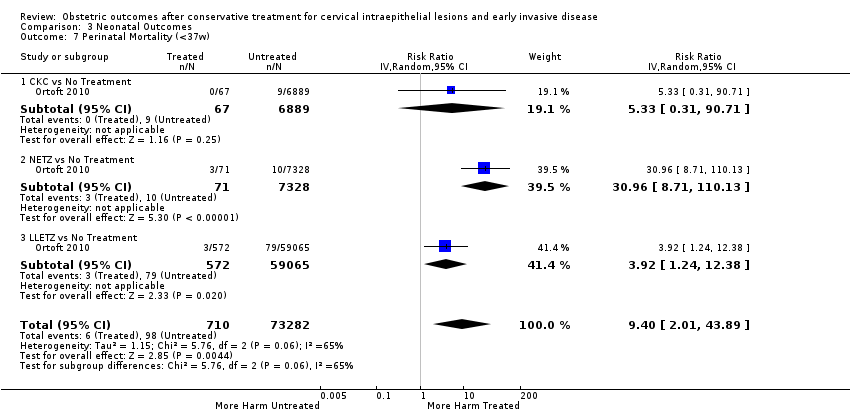
Comparison 3 Neonatal Outcomes, Outcome 7 Perinatal Mortality (<37w).
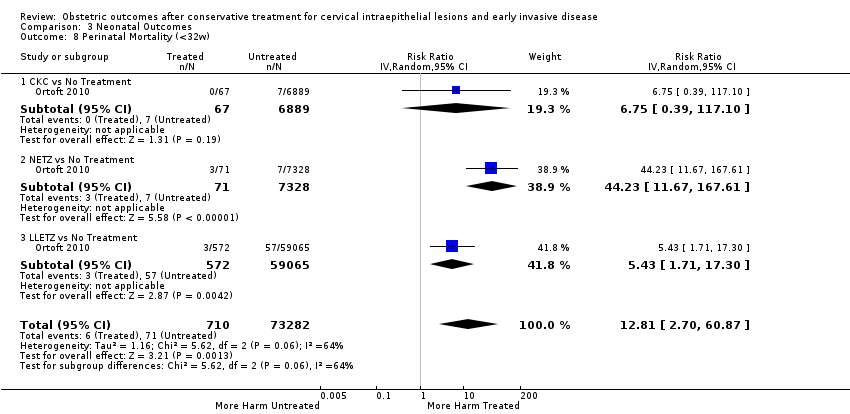
Comparison 3 Neonatal Outcomes, Outcome 8 Perinatal Mortality (<32w).
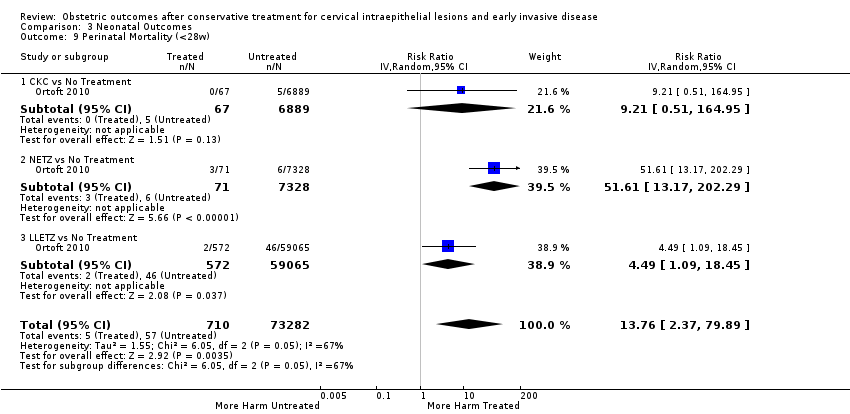
Comparison 3 Neonatal Outcomes, Outcome 9 Perinatal Mortality (<28w).
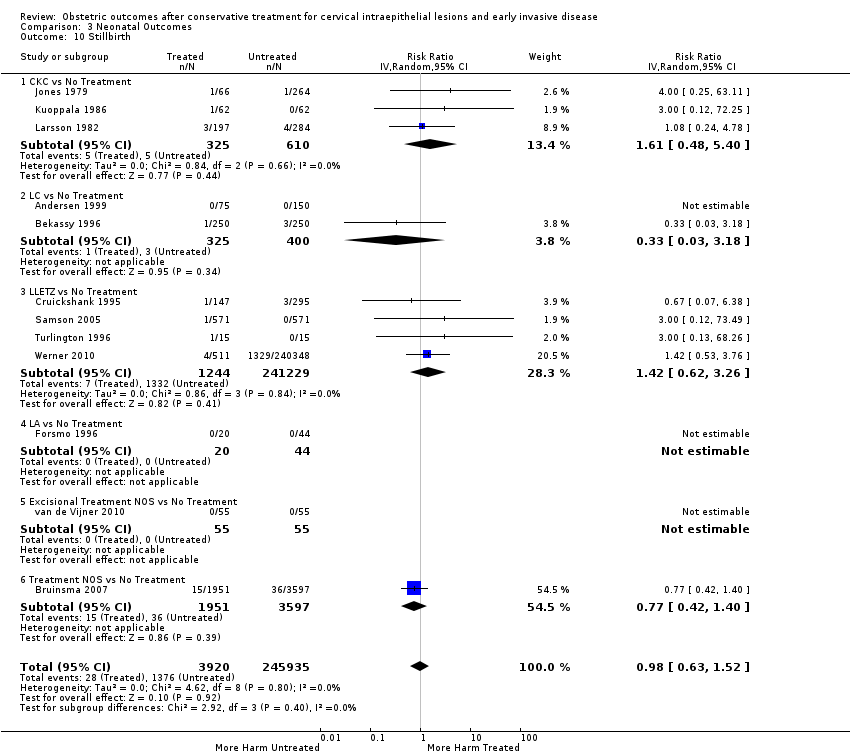
Comparison 3 Neonatal Outcomes, Outcome 10 Stillbirth.
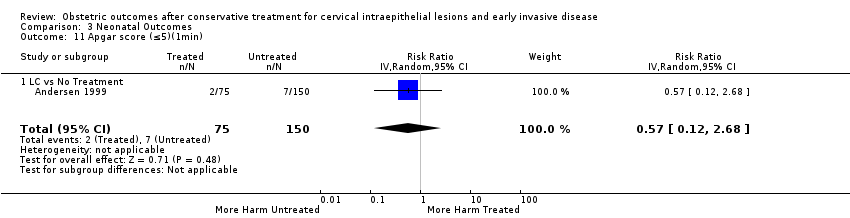
Comparison 3 Neonatal Outcomes, Outcome 11 Apgar score (≤5)(1min).

Comparison 3 Neonatal Outcomes, Outcome 12 Apgar score (<7)(1min).

Comparison 3 Neonatal Outcomes, Outcome 13 Apgar score (<7)(5min).
| The effect of treatment for CIN on maternal outcomes | ||||||
| Patient or population: women with known obstetric outcomes | ||||||
| Outcomes | Anticipated absolute effects* (95% CI) | Relative effect | № of participants | Quality of the evidence | Comments | |
| Risk with [comparison] | Risk with [intervention] | |||||
| PTB (< 37 w) | Study population | RR 1.75 | 5,242,917 | ⊕⊝⊝⊝ | ||
| 54 per 1000 | 95 per 1000 | |||||
| PTB (< 32 to 34 w) | Study population | RR 2.25 | 3,793,874 | ⊕⊝⊝⊝ | ||
| 14 per 1000 | 32 per 1000 | |||||
| PTB (< 28 to 30 w) | Study population | RR 2.23 | 3,910,629 | ⊕⊝⊝⊝ | ||
| 3 per 1000 | 7 per 1000 | |||||
| PTB (< 37 w) ‐ Repeat cones versus No Treatment | Study population | RR 3.78 | 1,317,284 | ⊕⊝⊝⊝ | ||
| 41 per 1000 | 156 per 1000 | |||||
| pPROM (<3 7 w) | Study population | RR 2.36 | 477,011 | ⊕⊝⊝⊝ | ||
| 34 per 1000 | 80 per 1000 | |||||
| PTB (< 37 w) ‐ Depth ≤ 10 mm to 12 mm versus No Treatment | Study population | RR 1.54 | 550,929 | ⊕⊝⊝⊝ | ||
| 34 per 1000 | 53 per 1000 | |||||
| PTB (< 37 w) ‐ PTB (< 37 w) ‐ Depth ≥10 mm to 12 mm versus No Treatment | Study population | RR 1.93 | 552,711 | ⊕⊕⊕⊝ | ||
| 34 per 1000 | 66 per 1000 | |||||
| PTB (< 37w) ‐ PTB (<37w) ‐ Depth ≥15 to 17mm versus No Treatment | Study population | RR 2.77 | 544,986 | ⊕⊕⊕⊕ | ||
| 34 per 1000 | 94 per 1000 | |||||
| PTB (< 37 w) ‐ PTB (< 37 w) ‐ Depth ≥ 20 mm versus No Treatment | Study population | RR 4.91 | 543,750 | ⊕⊕⊕⊕ | ||
| 34 per 1000 | 167 per 1000 | |||||
| *The risk in the intervention group (and its 95% confidence interval) is based on the assumed risk in the comparison group and the relative effect of the intervention (and its 95% CI). | ||||||
| GRADE Working Group grades of evidence | ||||||
| 1 Low‐quality evidence (based on observational studies only) is downgraded one level because of considerable heterogeneity (I2 90%) 2 Low‐quality evidence (based on observational studies only) is downgraded one level because of considerable heterogeneity (I2 83%) and suspected publication bias 3 Low‐quality evidence (based on observational studies only) is downgraded one level because of considerable heterogeneity (I2 84%) 4 Low‐quality evidence (based on observational studies only) is downgraded one level because of considerable heterogeneity (I2 75%) 5 Low‐quality evidence (based on observational studies only) is downgraded one level because of considerable heterogeneity (I2 79%) 6 Low‐quality evidence (based on observational studies only) is downgraded one level because of substantial heterogeneity (I2 67%) 7 Low‐quality evidence (based on observational studies only); heterogeneity was low (I2 37%) 8 Low‐quality evidence (based on observational studies only) is downgraded one level because of moderate heterogeneity (I2 53%) 9 Low‐quality evidence (based on observational studies only) is downgraded one level because of considerable heterogeneity (I2 77%) | ||||||
| The effect of treatment for CIN on neonatal outcomes | ||||||
| Patient or population: women with known obstetric outcomes | ||||||
| Outcomes | Anticipated absolute effects* (95% CI) | Relative effect | № of participants | Quality of the evidence | Comments | |
| Risk with No Treatment | Risk with Treatment | |||||
| LBW (< 2500 g) ‐ Treatment versus No Treatment | Study population | RR 1.81 | 1,348,206 | ⊕⊝⊝⊝ | ||
| 37 per 1000 | 66 per 1000 | |||||
| NICU Admission ‐ Treatment versus No Treatment | Study population | RR 1.45 | 2557 | ⊕⊕⊝⊝ | ||
| 89 per 1000 | 130 per 1000 | |||||
| Perinatal Mortality ‐ Treatment versus No Treatment | Study population | RR 1.51 | 1,659,433 | ⊕⊕⊝⊝ | ||
| 7 per 1000 | 11 per 1000 | |||||
| *The risk in the intervention group (and its 95% confidence interval) is based on the assumed risk in the comparison group and the relative effect of the intervention (and its 95% CI). | ||||||
| GRADE Working Group grades of evidence | ||||||
| 1 Low‐quality evidence (based on observational studies only) is downgraded one level because of substantial heterogeneity (I2 63%) | ||||||
| Outcome or subgroup title | No. of studies | No. of participants | Statistical method | Effect size |
| 1 PTB (<37w) Show forest plot | 59 | 5.242917E6 | Risk Ratio (IV, Random, 95% CI) | 1.75 [1.57, 1.96] |
| 1.1 Excisional Treatment vs No Treatment | 53 | 4.599416E6 | Risk Ratio (IV, Random, 95% CI) | 1.87 [1.64, 2.12] |
| 1.2 Ablative Treatment vs No Treatment | 14 | 602370 | Risk Ratio (IV, Random, 95% CI) | 1.35 [1.20, 1.52] |
| 1.3 Treatment NOS vs No Treatment | 2 | 41131 | Risk Ratio (IV, Random, 95% CI) | 2.57 [1.39, 4.77] |
| 2 PTB (<37w)‐Analysis by treatment modality Show forest plot | 59 | 5.242917E6 | Risk Ratio (IV, Random, 95% CI) | 1.78 [1.60, 1.98] |
| 2.1 CKC vs No Treatment | 12 | 39102 | Risk Ratio (IV, Random, 95% CI) | 2.70 [2.14, 3.40] |
| 2.2 LC vs No Treatment | 9 | 1509 | Risk Ratio (IV, Random, 95% CI) | 2.11 [1.26, 3.54] |
| 2.3 NETZ vs No Treatment | 1 | 7399 | Risk Ratio (IV, Random, 95% CI) | 5.83 [3.80, 8.95] |
| 2.4 LLETZ vs No Treatment | 25 | 1.445104E6 | Risk Ratio (IV, Random, 95% CI) | 1.58 [1.37, 1.81] |
| 2.5 FCBE vs No Treatment | 1 | 71 | Risk Ratio (IV, Random, 95% CI) | 5.22 [1.09, 24.90] |
| 2.6 LA vs No Treatment | 7 | 4710 | Risk Ratio (IV, Random, 95% CI) | 1.04 [0.86, 1.26] |
| 2.7 CT vs No Treatment | 2 | 238 | Risk Ratio (IV, Random, 95% CI) | 1.02 [0.22, 4.77] |
| 2.8 RD vs No Treatment | 1 | 2150 | Risk Ratio (IV, Random, 95% CI) | 1.62 [1.27, 2.06] |
| 2.9 Excisional Treatment NOS vs No Treatment | 15 | 3.106231E6 | Risk Ratio (IV, Random, 95% CI) | 1.90 [1.50, 2.41] |
| 2.10 Ablative Treatment NOS vs No Treatment | 5 | 595272 | Risk Ratio (IV, Random, 95% CI) | 1.46 [1.27, 1.66] |
| 2.11 Treatment NOS vs No Treatment | 2 | 41131 | Risk Ratio (IV, Random, 95% CI) | 2.57 [1.39, 4.77] |
| 3 PTB (<32‐34w) Show forest plot | 24 | 3.793874E6 | Risk Ratio (IV, Random, 95% CI) | 2.25 [1.79, 2.82] |
| 3.1 Excisional Treatment vs No Treatment | 22 | 3.666567E6 | Risk Ratio (IV, Random, 95% CI) | 2.48 [1.92, 3.20] |
| 3.2 Ablative Treatment vs No Treatment | 3 | 120820 | Risk Ratio (IV, Random, 95% CI) | 1.59 [1.08, 2.35] |
| 3.3 Treatment NOS vs No treatment | 2 | 6487 | Risk Ratio (IV, Random, 95% CI) | 1.65 [1.13, 2.42] |
| 4 PTB (<32‐34w)‐Analysis by treatment modality Show forest plot | 24 | 3.793874E6 | Risk Ratio (IV, Random, 95% CI) | 2.35 [1.88, 2.95] |
| 4.1 CKC vs No Treatment | 5 | 36979 | Risk Ratio (IV, Random, 95% CI) | 3.07 [1.72, 5.49] |
| 4.2 NETZ vs No Treatment | 1 | 7399 | Risk Ratio (IV, Random, 95% CI) | 10.53 [4.33, 25.65] |
| 4.3 LLETZ vs No Treatment | 11 | 791554 | Risk Ratio (IV, Random, 95% CI) | 2.13 [1.66, 2.75] |
| 4.4 CT vs No Treatment | 1 | 58 | Risk Ratio (IV, Random, 95% CI) | 1.86 [0.08, 43.87] |
| 4.5 Excisional Treatment NOS vs No Treatment | 9 | 2.830635E6 | Risk Ratio (IV, Random, 95% CI) | 2.94 [1.82, 4.77] |
| 4.6 Ablative Treatment NOS vs No Treatment | 2 | 120762 | Risk Ratio (IV, Random, 95% CI) | 1.59 [1.08, 2.35] |
| 4.7 Treatment NOS vs No treatment | 2 | 6487 | Risk Ratio (IV, Random, 95% CI) | 1.65 [1.13, 2.42] |
| 5 PTB (<28‐30w) Show forest plot | 8 | 3.910629E6 | Risk Ratio (IV, Random, 95% CI) | 2.23 [1.55, 3.22] |
| 5.1 Excisional Treatment vs No Treatment | 7 | 3.337003E6 | Risk Ratio (IV, Random, 95% CI) | 2.81 [1.91, 4.15] |
| 5.2 Ablative Treatment vs No Treatment | 3 | 568217 | Risk Ratio (IV, Random, 95% CI) | 1.38 [0.81, 2.36] |
| 5.3 Treatment NOS vs No Treatment | 1 | 5409 | Risk Ratio (IV, Random, 95% CI) | 1.75 [1.05, 2.91] |
| 6 PTB (<28‐30w)‐Analysis by treatment modality Show forest plot | 8 | 3.910629E6 | Risk Ratio (IV, Random, 95% CI) | 2.43 [1.69, 3.49] |
| 6.1 CKC vs No Treatment | 2 | 7118 | Risk Ratio (IV, Random, 95% CI) | 4.52 [0.83, 24.54] |
| 6.2 NETZ vs No Treatment | 1 | 7399 | Risk Ratio (IV, Random, 95% CI) | 14.74 [4.50, 48.32] |
| 6.3 LLETZ vs No Treatment | 3 | 502778 | Risk Ratio (IV, Random, 95% CI) | 2.57 [1.97, 3.35] |
| 6.4 Excisional Treatment NOS vs No treatment | 3 | 2.819708E6 | Risk Ratio (IV, Random, 95% CI) | 2.54 [1.30, 4.99] |
| 6.5 Ablative Treatment NOS vs No Treatment | 3 | 568217 | Risk Ratio (IV, Random, 95% CI) | 1.38 [0.81, 2.36] |
| 6.6 Treatment NOS vs No Treatment | 1 | 5409 | Risk Ratio (IV, Random, 95% CI) | 1.75 [1.05, 2.91] |
| 7 PTB (≤34w) Show forest plot | 15 | 424567 | Risk Ratio (IV, Random, 95% CI) | 2.59 [1.78, 3.77] |
| 7.1 Excisional Treatment vs No Treatment | 15 | 424509 | Risk Ratio (IV, Random, 95% CI) | 2.61 [1.78, 3.83] |
| 7.2 Ablative Treatment vs No Treatment | 1 | 58 | Risk Ratio (IV, Random, 95% CI) | 1.86 [0.08, 43.87] |
| 8 PTB (≤34w)‐Analysis by treatment modality Show forest plot | 15 | 424567 | Risk Ratio (IV, Random, 95% CI) | 2.56 [1.78, 3.69] |
| 8.1 CKC vs No Treatment | 4 | 30023 | Risk Ratio (IV, Random, 95% CI) | 2.85 [1.50, 5.41] |
| 8.2 LLETZ vs No Treatment | 9 | 289218 | Risk Ratio (IV, Random, 95% CI) | 1.83 [1.41, 2.39] |
| 8.3 CT vs No Treatment | 1 | 58 | Risk Ratio (IV, Random, 95% CI) | 1.86 [0.08, 43.87] |
| 8.4 Excisional Treatment NOS vs No Treatment | 4 | 105268 | Risk Ratio (IV, Random, 95% CI) | 7.30 [4.17, 12.80] |
| 9 PTB (<32‐33w) Show forest plot | 10 | 3.369685E6 | Risk Ratio (IV, Random, 95% CI) | 2.08 [1.55, 2.79] |
| 9.1 Excisional Treatment vs No Treatment | 8 | 3.242436E6 | Risk Ratio (IV, Random, 95% CI) | 2.43 [1.70, 3.47] |
| 9.2 Ablative Treatment vs No Treatment | 2 | 120762 | Risk Ratio (IV, Random, 95% CI) | 1.59 [1.08, 2.35] |
| 9.3 Treatment NOS vs No treatment | 2 | 6487 | Risk Ratio (IV, Random, 95% CI) | 1.65 [1.13, 2.42] |
| 10 PTB (<32‐33w)‐Analysis by treatment modality Show forest plot | 10 | 3.369685E6 | Risk Ratio (IV, Random, 95% CI) | 2.26 [1.70, 3.01] |
| 10.1 CKC vs No Treatment | 1 | 6956 | Risk Ratio (IV, Random, 95% CI) | 4.38 [1.08, 17.65] |
| 10.2 NETZ vs No Treatment | 1 | 7399 | Risk Ratio (IV, Random, 95% CI) | 10.53 [4.33, 25.65] |
| 10.3 LLETZ vs No Treatment | 3 | 502714 | Risk Ratio (IV, Random, 95% CI) | 2.74 [2.30, 3.26] |
| 10.4 Excisional Treatment NOS vs No Treatment | 5 | 2.725367E6 | Risk Ratio (IV, Random, 95% CI) | 2.09 [1.20, 3.63] |
| 10.5 Ablative Treatment NOS vs No Treatment | 2 | 120762 | Risk Ratio (IV, Random, 95% CI) | 1.59 [1.08, 2.35] |
| 10.6 Treatment NOS vs No treatment | 2 | 6487 | Risk Ratio (IV, Random, 95% CI) | 1.65 [1.13, 2.42] |
| 11 PTB (<30w) Show forest plot | 1 | 162 | Risk Ratio (IV, Random, 95% CI) | 2.86 [0.12, 69.11] |
| 11.1 Excisional Treatment vs No Treatment | 1 | 162 | Risk Ratio (IV, Random, 95% CI) | 2.86 [0.12, 69.11] |
| 12 PTB (<30w)‐Analysis by treatment modality Show forest plot | 1 | 162 | Risk Ratio (IV, Random, 95% CI) | 2.86 [0.12, 69.11] |
| 12.1 CKC vs No Treatment | 1 | 162 | Risk Ratio (IV, Random, 95% CI) | 2.86 [0.12, 69.11] |
| 13 PTB (<28w) Show forest plot | 7 | 3.910467E6 | Risk Ratio (IV, Random, 95% CI) | 2.22 [1.54, 3.22] |
| 13.1 Excisional Treatment vs No Treatment | 6 | 3.336841E6 | Risk Ratio (IV, Random, 95% CI) | 2.81 [1.89, 4.18] |
| 13.2 Ablative treatment vs No Treatment | 3 | 568217 | Risk Ratio (IV, Random, 95% CI) | 1.38 [0.81, 2.36] |
| 13.3 Treatment NOS vs No Treatment | 1 | 5409 | Risk Ratio (IV, Random, 95% CI) | 1.75 [1.05, 2.91] |
| 14 PTB (<28w)‐Analysis by treatment modality Show forest plot | 6 | 3.905058E6 | Risk Ratio (IV, Random, 95% CI) | 2.52 [1.71, 3.72] |
| 14.1 CKC vs No Treatment | 1 | 6956 | Risk Ratio (IV, Random, 95% CI) | 5.41 [0.74, 39.84] |
| 14.2 NETZ vs No Treatment | 1 | 7399 | Risk Ratio (IV, Random, 95% CI) | 14.74 [4.50, 48.32] |
| 14.3 LLETZ vs No Treatment | 3 | 502778 | Risk Ratio (IV, Random, 95% CI) | 2.57 [1.97, 3.35] |
| 14.4 Excisional Treatment NOS vs No treatment | 3 | 2.819708E6 | Risk Ratio (IV, Random, 95% CI) | 2.54 [1.30, 4.99] |
| 14.5 Ablative Treatment NOS vs No Treatment | 3 | 568217 | Risk Ratio (IV, Random, 95% CI) | 1.38 [0.81, 2.36] |
| 15 PTB (<37w)‐Nulliparous women Show forest plot | 6 | 245707 | Risk Ratio (IV, Random, 95% CI) | 1.92 [1.23, 2.98] |
| 15.1 LC vs No Treatment | 2 | 267 | Risk Ratio (IV, Random, 95% CI) | 2.18 [1.09, 4.37] |
| 15.2 LLETZ vs No Treatment | 3 | 231344 | Risk Ratio (IV, Random, 95% CI) | 1.51 [0.76, 3.02] |
| 15.3 Treatment NOS versus No Treatment | 1 | 14096 | Risk Ratio (IV, Random, 95% CI) | 3.53 [1.70, 7.33] |
| 16 PTB (<37w)‐Parous women Show forest plot | 5 | 339507 | Risk Ratio (IV, Random, 95% CI) | 2.05 [0.95, 4.43] |
| 16.1 LC vs No Treatment | 2 | 401 | Risk Ratio (IV, Random, 95% CI) | 2.82 [0.16, 49.84] |
| 16.2 LLETZ vs No Treatment | 2 | 324948 | Risk Ratio (IV, Random, 95% CI) | 1.20 [0.22, 6.65] |
| 16.3 Treatment NOS vs No Treatment | 1 | 14158 | Risk Ratio (IV, Random, 95% CI) | 3.73 [2.23, 6.22] |
| 17 PTB (<37w)‐Single cone Show forest plot | 17 | 1.367023E6 | Risk Ratio (IV, Random, 95% CI) | 1.75 [1.49, 2.06] |
| 17.1 CKC vs No Treatment | 3 | 36783 | Risk Ratio (IV, Random, 95% CI) | 2.89 [2.08, 4.03] |
| 17.2 LC vs No Treatment | 2 | 657 | Risk Ratio (IV, Random, 95% CI) | 1.06 [0.54, 2.09] |
| 17.3 NETZ vs No Treatment | 1 | 7399 | Risk Ratio (IV, Random, 95% CI) | 5.83 [3.80, 8.95] |
| 17.4 LLETZ vs No Treatment | 9 | 1.277874E6 | Risk Ratio (IV, Random, 95% CI) | 1.74 [1.45, 2.10] |
| 17.5 LA vs No Treatment | 4 | 1421 | Risk Ratio (IV, Random, 95% CI) | 1.07 [0.66, 1.74] |
| 17.6 Excisional Treatment NOS vs No Treatment | 3 | 32106 | Risk Ratio (IV, Random, 95% CI) | 1.88 [1.20, 2.93] |
| 17.7 Ablative Treatment NOS vs No Treatment | 1 | 10783 | Risk Ratio (IV, Random, 95% CI) | 1.14 [0.82, 1.57] |
| 18 PTB (<37w)‐Repeat cones Show forest plot | 11 | 1.317284E6 | Risk Ratio (IV, Random, 95% CI) | 3.78 [2.65, 5.39] |
| 18.1 CKC/LA vs No Treatment | 1 | 99 | Risk Ratio (IV, Random, 95% CI) | 12.56 [5.11, 30.87] |
| 18.2 LC/LC vs No Treatment | 1 | 270 | Risk Ratio (IV, Random, 95% CI) | 3.75 [1.70, 8.27] |
| 18.3 LLETZ/LLETZ vs No Treatment | 4 | 1.202174E6 | Risk Ratio (IV, Random, 95% CI) | 2.81 [2.33, 3.39] |
| 18.4 LLETZ/Treatment NOS vs No Treatment | 1 | 298 | Risk Ratio (IV, Random, 95% CI) | 9.40 [3.53, 25.03] |
| 18.5 Excisional Treatment NOS/Excisional Treatment NOS vs No Treatment | 3 | 73651 | Risk Ratio (IV, Random, 95% CI) | 5.48 [2.68, 11.24] |
| 18.6 Treatment NOS/Treatment NOS vs No Treatment | 2 | 40792 | Risk Ratio (IV, Random, 95% CI) | 1.71 [1.10, 2.67] |
| 19 PTB (<37w)‐Singleton pregnancies Show forest plot | 32 | 2.18962E6 | Risk Ratio (IV, Random, 95% CI) | 1.76 [1.57, 1.98] |
| 19.1 CKC vs No Treatment | 6 | 37759 | Risk Ratio (IV, Random, 95% CI) | 2.89 [2.22, 3.77] |
| 19.2 LC vs No Treatment | 4 | 545 | Risk Ratio (IV, Random, 95% CI) | 2.54 [1.24, 5.20] |
| 19.3 NETZ vs No Treatment | 1 | 7399 | Risk Ratio (IV, Random, 95% CI) | 5.83 [3.80, 8.95] |
| 19.4 LLETZ vs No Treatment | 18 | 1.444175E6 | Risk Ratio (IV, Random, 95% CI) | 1.61 [1.39, 1.87] |
| 19.5 LA vs No Treatment | 3 | 3420 | Risk Ratio (IV, Random, 95% CI) | 1.10 [0.75, 1.62] |
| 19.6 CT vs No Treatment | 1 | 58 | Risk Ratio (IV, Random, 95% CI) | 1.86 [0.08, 43.87] |
| 19.7 RD vs No Treatment | 1 | 2150 | Risk Ratio (IV, Random, 95% CI) | 1.62 [1.27, 2.06] |
| 19.8 Excisional Treatment NOS vs No Treatment | 7 | 542892 | Risk Ratio (IV, Random, 95% CI) | 1.42 [1.17, 1.72] |
| 19.9 Ablative Treatment NOS vs No Treatment | 2 | 110091 | Risk Ratio (IV, Random, 95% CI) | 1.14 [0.56, 2.32] |
| 19.10 Treatment NOS vs No Treatment | 2 | 41131 | Risk Ratio (IV, Random, 95% CI) | 2.57 [1.39, 4.77] |
| 20 PTB (<37w)‐Multiple pregnancies Show forest plot | 5 | 10797 | Risk Ratio (IV, Random, 95% CI) | 1.14 [0.95, 1.35] |
| 20.1 CKC vs No Treatment | 2 | 84 | Risk Ratio (IV, Random, 95% CI) | 0.95 [0.49, 1.83] |
| 20.2 LLETZ vs No Treatment | 3 | 10199 | Risk Ratio (IV, Random, 95% CI) | 1.27 [1.09, 1.47] |
| 20.3 Excisional Treatment NOS vs No Treatment | 1 | 4 | Risk Ratio (IV, Random, 95% CI) | 3.5 [0.31, 39.71] |
| 20.4 Ablative Treatment NOS vs No Treatment | 1 | 510 | Risk Ratio (IV, Random, 95% CI) | 0.93 [0.72, 1.20] |
| 21 PTB (<32‐34w)‐Multiple pregnancies Show forest plot | 3 | 10789 | Risk Ratio (IV, Random, 95% CI) | 1.68 [0.95, 2.98] |
| 21.1 CKC vs No Treatment | 1 | 80 | Risk Ratio (IV, Random, 95% CI) | 3.5 [1.29, 9.52] |
| 21.2 LLETZ vs No Treatment | 3 | 10199 | Risk Ratio (IV, Random, 95% CI) | 1.76 [0.88, 3.50] |
| 21.3 Ablative Treatment NOS vs No Treatment | 1 | 510 | Risk Ratio (IV, Random, 95% CI) | 0.85 [0.38, 1.91] |
| 22 PTB (<28w)‐Multiple pregnancies Show forest plot | 2 | 10744 | Risk Ratio (IV, Random, 95% CI) | 2.43 [1.40, 4.22] |
| 22.1 CKC vs No Treatment | 1 | 80 | Risk Ratio (IV, Random, 95% CI) | 2.15 [0.09, 49.56] |
| 22.2 LLETZ vs No Treatment | 2 | 10154 | Risk Ratio (IV, Random, 95% CI) | 2.45 [1.34, 4.47] |
| 22.3 Ablative Treatment NOS vs No Treatment | 1 | 510 | Risk Ratio (IV, Random, 95% CI) | 2.32 [0.48, 11.26] |
| 23 PTB (<37w)‐Depth≤10‐12mm Show forest plot | 8 | 550929 | Risk Ratio (IV, Random, 95% CI) | 1.54 [1.09, 2.18] |
| 23.1 LC vs No Treatment | 1 | 105 | Risk Ratio (IV, Random, 95% CI) | 0.52 [0.06, 4.83] |
| 23.2 LLETZ vs No Treatment | 3 | 544907 | Risk Ratio (IV, Random, 95% CI) | 2.01 [1.28, 3.15] |
| 23.3 Excisional Treatment NOS vs No Treatment | 4 | 5917 | Risk Ratio (IV, Random, 95% CI) | 1.20 [0.78, 1.85] |
| 24 PTB (<37w)‐Depth≥10‐12mm Show forest plot | 8 | 552711 | Risk Ratio (IV, Random, 95% CI) | 1.93 [1.62, 2.31] |
| 24.1 LC vs No Treatment | 1 | 87 | Risk Ratio (IV, Random, 95% CI) | 4.64 [1.20, 17.88] |
| 24.2 LLETZ vs No Treatment | 3 | 546134 | Risk Ratio (IV, Random, 95% CI) | 2.29 [1.57, 3.34] |
| 24.3 Excisional Treatment NOS vs No Treatment | 4 | 6490 | Risk Ratio (IV, Random, 95% CI) | 1.68 [1.41, 1.99] |
| 25 PTB (<37w)‐Depth≥15‐17mm Show forest plot | 4 | 544986 | Risk Ratio (IV, Random, 95% CI) | 2.77 [1.95, 3.93] |
| 25.1 LC vs No Treatment | 1 | 211 | Risk Ratio (IV, Random, 95% CI) | 4.92 [2.09, 11.59] |
| 25.2 LLETZ vs No Treatment | 2 | 544248 | Risk Ratio (IV, Random, 95% CI) | 3.16 [1.54, 6.48] |
| 25.3 Excisional Treatment NOS vs No Treatment | 1 | 527 | Risk Ratio (IV, Random, 95% CI) | 2.03 [1.33, 3.10] |
| 26 PTB (<37w)‐Depth≥20mm Show forest plot | 3 | 543750 | Risk Ratio (IV, Random, 95% CI) | 4.91 [2.06, 11.68] |
| 26.1 LC vs No Treatment | 1 | 192 | Risk Ratio (IV, Random, 95% CI) | 6.12 [2.57, 14.57] |
| 26.2 LLETZ vs No Treatment | 2 | 543558 | Risk Ratio (IV, Random, 95% CI) | 4.72 [1.25, 17.80] |
| 27 PTB (<37w)‐Volume<6cc Show forest plot | 1 | 550 | Risk Ratio (IV, Random, 95% CI) | 2.25 [1.09, 4.66] |
| 27.1 LLETZ vs No Treatment | 1 | 550 | Risk Ratio (IV, Random, 95% CI) | 2.25 [1.09, 4.66] |
| 28 PTB (<37w)‐Volume>6cc Show forest plot | 1 | 284 | Risk Ratio (IV, Random, 95% CI) | 13.90 [5.09, 37.98] |
| 28.1 LLETZ (Volume>6cc) vs No Treatment | 1 | 284 | Risk Ratio (IV, Random, 95% CI) | 13.90 [5.09, 37.98] |
| 29 PTB (<37w)‐Depth≤10mm Show forest plot | 7 | 7436 | Risk Ratio (IV, Random, 95% CI) | 1.60 [0.99, 2.59] |
| 29.1 LC vs No Treatment | 1 | 105 | Risk Ratio (IV, Random, 95% CI) | 0.52 [0.06, 4.83] |
| 29.2 LLETZ vs No Treatment | 2 | 1414 | Risk Ratio (IV, Random, 95% CI) | 2.72 [1.65, 4.50] |
| 29.3 Excisional Treatment NOS vs No Treatment | 4 | 5917 | Risk Ratio (IV, Random, 95% CI) | 1.20 [0.78, 1.85] |
| 30 PTB (<37w)‐Depth≤12mm Show forest plot | 1 | 543493 | Risk Ratio (IV, Random, 95% CI) | 1.56 [1.20, 2.02] |
| 30.1 LLETZ vs No Treatment | 1 | 543493 | Risk Ratio (IV, Random, 95% CI) | 1.56 [1.20, 2.02] |
| 31 PTB (<37w)‐Depth≤15mm Show forest plot | 3 | 545283 | Risk Ratio (IV, Random, 95% CI) | 1.44 [1.20, 1.73] |
| 31.1 LC vs No Treatment | 1 | 164 | Risk Ratio (IV, Random, 95% CI) | 0.67 [0.04, 11.18] |
| 31.2 LLETZ vs No Treatment | 2 | 545119 | Risk Ratio (IV, Random, 95% CI) | 1.44 [1.20, 1.73] |
| 32 PTB (<37w)‐Depth≤17mm Show forest plot | 1 | 656 | Risk Ratio (IV, Random, 95% CI) | 1.14 [0.76, 1.72] |
| 32.1 Excisional Treatment NOS vs No Treatment | 1 | 656 | Risk Ratio (IV, Random, 95% CI) | 1.14 [0.76, 1.72] |
| 33 PTB (<37w)‐Depth≤15‐17mm Show forest plot | 4 | 545939 | Risk Ratio (IV, Random, 95% CI) | 1.38 [1.17, 1.64] |
| 33.1 LC vs No Treatment | 1 | 164 | Risk Ratio (IV, Random, 95% CI) | 0.67 [0.04, 11.18] |
| 33.2 LLETZ vs No Treatment | 2 | 545119 | Risk Ratio (IV, Random, 95% CI) | 1.44 [1.20, 1.73] |
| 33.3 Excisional Treatment NOS vs No Treatment | 1 | 656 | Risk Ratio (IV, Random, 95% CI) | 1.14 [0.76, 1.72] |
| 34 PTB (<37w)‐Depth≤20mm Show forest plot | 3 | 545992 | Risk Ratio (IV, Random, 95% CI) | 1.60 [1.38, 1.87] |
| 34.1 LC vs No Treatment | 1 | 183 | Risk Ratio (IV, Random, 95% CI) | 1.30 [0.28, 5.97] |
| 34.2 LLETZ vs No Treatment | 2 | 545809 | Risk Ratio (IV, Random, 95% CI) | 1.61 [1.38, 1.87] |
| 35 PTB (<37w)‐Depth≥10mm Show forest plot | 7 | 7671 | Risk Ratio (IV, Random, 95% CI) | 2.12 [1.58, 2.85] |
| 35.1 LC vs No Treatment | 1 | 87 | Risk Ratio (IV, Random, 95% CI) | 4.64 [1.20, 17.88] |
| 35.2 LLETZ vs No Treatment | 2 | 1094 | Risk Ratio (IV, Random, 95% CI) | 3.16 [1.80, 5.55] |
| 35.3 Excisional Treatment NOS vs No Treatment | 4 | 6490 | Risk Ratio (IV, Random, 95% CI) | 1.68 [1.41, 1.99] |
| 36 PTB (<37w)‐Depth≥12mm Show forest plot | 1 | 545040 | Risk Ratio (IV, Random, 95% CI) | 1.93 [1.66, 2.23] |
| 36.1 LLETZ vs No Treatment | 1 | 545040 | Risk Ratio (IV, Random, 95% CI) | 1.93 [1.66, 2.23] |
| 37 PTB (<37w)‐Depth≥15mm Show forest plot | 3 | 544459 | Risk Ratio (IV, Random, 95% CI) | 3.49 [1.94, 6.26] |
| 37.1 LC vs No Treatment | 1 | 211 | Risk Ratio (IV, Random, 95% CI) | 4.92 [2.09, 11.59] |
| 37.2 LLETZ vs No Treatment | 2 | 544248 | Risk Ratio (IV, Random, 95% CI) | 3.16 [1.54, 6.48] |
| 38 PTB (<37w)‐Depth≥17mm Show forest plot | 1 | 527 | Risk Ratio (IV, Random, 95% CI) | 2.03 [1.33, 3.10] |
| 38.1 Excisional Treatment NOS vs No Treatment | 1 | 527 | Risk Ratio (IV, Random, 95% CI) | 2.03 [1.33, 3.10] |
| 39 PTB (<37w)‐Depth 10/13‐15/16mm Show forest plot | 3 | 544534 | Risk Ratio (IV, Random, 95% CI) | 1.32 [1.04, 1.66] |
| 39.1 LLETZ vs No Treatment | 2 | 543994 | Risk Ratio (IV, Random, 95% CI) | 1.32 [1.02, 1.72] |
| 39.2 Excisional Treatment NOS vs No Treatment | 1 | 540 | Risk Ratio (IV, Random, 95% CI) | 1.29 [0.79, 2.12] |
| 40 PTB (<37w)‐Depth 15/16‐19/20mm Show forest plot | 3 | 543608 | Risk Ratio (IV, Random, 95% CI) | 2.24 [1.73, 2.91] |
| 40.1 LC vs No Treatment | 1 | 169 | Risk Ratio (IV, Random, 95% CI) | 2.26 [0.50, 10.08] |
| 40.2 LLETZ vs No Treatment | 2 | 543439 | Risk Ratio (IV, Random, 95% CI) | 2.53 [1.42, 4.51] |
| 41 PTB (<37w)‐Volume<3cc Show forest plot | 1 | 496 | Risk Ratio (IV, Random, 95% CI) | 2.04 [0.94, 4.41] |
| 41.1 LLETZ vs No Treatment | 1 | 496 | Risk Ratio (IV, Random, 95% CI) | 2.04 [0.94, 4.41] |
| 42 PTB (<37w)‐Volume>3cc Show forest plot | 1 | 338 | Risk Ratio (IV, Random, 95% CI) | 4.17 [1.77, 9.82] |
| 42.1 LLETZ vs No Treatment | 1 | 338 | Risk Ratio (IV, Random, 95% CI) | 4.17 [1.77, 9.82] |
| 43 PTB (<37w)‐Depth≥10‐12mm vs ≤10‐12mm Show forest plot | 7 | 6359 | Risk Ratio (IV, Random, 95% CI) | 1.54 [1.31, 1.80] |
| 43.1 LC | 1 | 64 | Risk Ratio (IV, Random, 95% CI) | 8.91 [1.11, 71.73] |
| 43.2 LLETZ | 2 | 836 | Risk Ratio (IV, Random, 95% CI) | 1.26 [0.74, 2.17] |
| 43.3 Excision NOS | 4 | 5459 | Risk Ratio (IV, Random, 95% CI) | 1.55 [1.31, 1.83] |
| 44 PTB (<37w)‐Depth≥15‐17mm vs ≤15‐17mm Show forest plot | 4 | 4275 | Risk Ratio (IV, Random, 95% CI) | 1.82 [1.47, 2.26] |
| 44.1 LC | 1 | 75 | Risk Ratio (IV, Random, 95% CI) | 7.02 [0.44, 111.10] |
| 44.2 LLETZ | 2 | 3869 | Risk Ratio (IV, Random, 95% CI) | 1.86 [1.36, 2.55] |
| 44.3 Excisional Treatment NOS | 1 | 331 | Risk Ratio (IV, Random, 95% CI) | 1.78 [1.11, 2.84] |
| 45 PTB (<37w)‐Depth≥20mm vs ≤20mm Show forest plot | 3 | 3944 | Risk Ratio (IV, Random, 95% CI) | 2.79 [1.24, 6.27] |
| 45.1 LC | 1 | 75 | Risk Ratio (IV, Random, 95% CI) | 4.71 [1.13, 19.62] |
| 45.2 LLETZ | 2 | 3869 | Risk Ratio (IV, Random, 95% CI) | 2.47 [0.94, 6.51] |
| 46 PTB (<37w)‐Volume>3cc vs <3cc Show forest plot | 1 | 278 | Risk Ratio (IV, Random, 95% CI) | 2.04 [0.95, 4.39] |
| 46.1 LLETZ | 1 | 278 | Risk Ratio (IV, Random, 95% CI) | 2.04 [0.95, 4.39] |
| 47 PTB (<37w)‐Volume>6cc vs <6cc Show forest plot | 1 | 278 | Risk Ratio (IV, Random, 95% CI) | 6.18 [2.53, 15.13] |
| 47.1 LLETZ | 1 | 278 | Risk Ratio (IV, Random, 95% CI) | 6.18 [2.53, 15.13] |
| 48 PTB (<37w)‐Depth 11/13‐15/16mm vs ≤10‐12mm Show forest plot | 3 | 2600 | Risk Ratio (IV, Random, 95% CI) | 0.92 [0.67, 1.25] |
| 48.1 LLETZ | 2 | 2370 | Risk Ratio (IV, Random, 95% CI) | 0.83 [0.58, 1.17] |
| 48.2 Excisional Treatment NOS | 1 | 230 | Risk Ratio (IV, Random, 95% CI) | 1.31 [0.68, 2.50] |
| 49 PTB (<37w)‐Depth 16‐19mm vs 13‐15mm Show forest plot | 1 | 1768 | Risk Ratio (IV, Random, 95% CI) | 1.65 [1.12, 2.43] |
| 49.1 LLETZ | 1 | 1768 | Risk Ratio (IV, Random, 95% CI) | 1.65 [1.12, 2.43] |
| 50 PTB (<37w)‐Depth≥20mm vs 15/16‐19/20mm Show forest plot | 3 | 1560 | Risk Ratio (IV, Random, 95% CI) | 1.46 [0.95, 2.23] |
| 50.1 LC | 1 | 61 | Risk Ratio (IV, Random, 95% CI) | 2.71 [0.67, 10.96] |
| 50.2 LLETZ | 2 | 1499 | Risk Ratio (IV, Random, 95% CI) | 1.40 [0.84, 2.36] |
| 51 PTB (<37w)‐Untreated External Comparison Group Show forest plot | 44 | 5.192047E6 | Risk Ratio (IV, Random, 95% CI) | 1.92 [1.70, 2.16] |
| 51.1 CKC | 7 | 37370 | Risk Ratio (IV, Random, 95% CI) | 3.28 [2.44, 4.42] |
| 51.2 LC | 6 | 1126 | Risk Ratio (IV, Random, 95% CI) | 2.39 [1.24, 4.61] |
| 51.3 NETZ | 1 | 7361 | Risk Ratio (IV, Random, 95% CI) | 5.82 [3.79, 8.94] |
| 51.4 LLETZ | 19 | 1.414769E6 | Risk Ratio (IV, Random, 95% CI) | 1.72 [1.48, 2.00] |
| 51.5 LA] | 4 | 1258 | Risk Ratio (IV, Random, 95% CI) | 1.27 [0.67, 2.40] |
| 51.6 CT | 1 | 58 | Risk Ratio (IV, Random, 95% CI) | 1.86 [0.08, 43.87] |
| 51.7 Excisional Treatment NOS | 12 | 3.100025E6 | Risk Ratio (IV, Random, 95% CI) | 1.91 [1.50, 2.44] |
| 51.8 Ablative Treatment NOS | 5 | 588949 | Risk Ratio (IV, Random, 95% CI) | 1.45 [1.26, 1.67] |
| 51.9 Treatment NOS | 2 | 41131 | Risk Ratio (IV, Random, 95% CI) | 2.57 [1.39, 4.77] |
| 52 PTB (<37w)‐Untreated Internal Comparison Group (self‐matching) Show forest plot | 8 | 2987 | Risk Ratio (IV, Random, 95% CI) | 1.59 [1.19, 2.13] |
| 52.1 LC | 2 | 354 | Risk Ratio (IV, Random, 95% CI) | 1.30 [0.56, 3.06] |
| 52.2 LLETZ | 1 | 516 | Risk Ratio (IV, Random, 95% CI) | 1.82 [1.04, 3.21] |
| 52.3 FCBE | 1 | 71 | Risk Ratio (IV, Random, 95% CI) | 5.22 [1.09, 24.90] |
| 52.4 Excisional Treatment NOS | 3 | 1922 | Risk Ratio (IV, Random, 95% CI) | 1.46 [0.89, 2.39] |
| 52.5 Treatment NOS | 1 | 124 | Risk Ratio (IV, Random, 95% CI) | 2.0 [0.73, 5.51] |
| 53 PTB (<37w)‐Untreated Internal Comparison Group (pre‐treatment pregnancies) Show forest plot | 13 | 83404 | Risk Ratio (IV, Random, 95% CI) | 1.39 [0.98, 1.96] |
| 53.1 CKC | 3 | 1430 | Risk Ratio (IV, Random, 95% CI) | 1.79 [0.81, 3.95] |
| 53.2 LC | 2 | 161 | Risk Ratio (IV, Random, 95% CI) | 1.65 [0.11, 23.58] |
| 53.3 LLETZ | 4 | 3207 | Risk Ratio (IV, Random, 95% CI) | 1.13 [0.66, 1.94] |
| 53.4 LA | 1 | 226 | Risk Ratio (IV, Random, 95% CI) | 1.20 [0.57, 2.53] |
| 53.5 CT | 1 | 180 | Risk Ratio (IV, Random, 95% CI) | 0.85 [0.15, 4.94] |
| 53.6 Excisional NOS | 3 | 78200 | Risk Ratio (IV, Random, 95% CI) | 1.65 [0.88, 3.08] |
| 54 PTB (<37w)‐Untreated Colposcopy+/‐CIN+/‐Biopsy Comparison Group Show forest plot | 13 | 74958 | Risk Ratio (IV, Random, 95% CI) | 1.27 [1.14, 1.41] |
| 54.1 CKC | 2 | 265 | Risk Ratio (IV, Random, 95% CI) | 1.76 [1.01, 3.08] |
| 54.2 LC | 1 | 177 | Risk Ratio (IV, Random, 95% CI) | 1.52 [0.74, 3.15] |
| 54.3 LLETZ | 9 | 39249 | Risk Ratio (IV, Random, 95% CI) | 1.33 [1.11, 1.60] |
| 54.4 LA | 2 | 3326 | Risk Ratio (IV, Random, 95% CI) | 1.05 [0.84, 1.31] |
| 54.5 RD | 1 | 2150 | Risk Ratio (IV, Random, 95% CI) | 1.62 [1.27, 2.06] |
| 54.6 Excisional Treatment NOS | 5 | 20321 | Risk Ratio (IV, Random, 95% CI) | 1.23 [1.07, 1.41] |
| 54.7 Ablative Treatment NOS | 2 | 9470 | Risk Ratio (IV, Random, 95% CI) | 1.00 [0.74, 1.36] |
| 55 PTB (<37w)‐Untreated HSIL Comparison Group Show forest plot | 3 | 3764 | Risk Ratio (IV, Random, 95% CI) | 1.37 [0.85, 2.19] |
| 55.1 CKC | 1 | 103 | Risk Ratio (IV, Random, 95% CI) | 3.76 [0.48, 29.39] |
| 55.2 NETZ | 1 | 109 | Risk Ratio (IV, Random, 95% CI) | 4.55 [1.11, 18.66] |
| 55.3 LLETZ | 1 | 881 | Risk Ratio (IV, Random, 95% CI) | 2.48 [1.35, 4.55] |
| 55.4 Excisional Treatment NOS | 2 | 2274 | Risk Ratio (IV, Random, 95% CI) | 1.06 [0.71, 1.59] |
| 55.5 Ablative Treatment NOS | 2 | 397 | Risk Ratio (IV, Random, 95% CI) | 0.68 [0.28, 1.68] |
| 56 PTB (<37w)‐All Comparison Groups Show forest plot | 58 | 5.292724E6 | Risk Ratio (IV, Random, 95% CI) | 1.76 [1.58, 1.97] |
| 56.1 Treatment vs Untreated External Comparison Group | 43 | 5.165466E6 | Risk Ratio (IV, Random, 95% CI) | 1.97 [1.71, 2.26] |
| 56.2 Treatment vs Untreated Internal Comparison Group (pre‐treatment pregnancies) | 13 | 62519 | Risk Ratio (IV, Random, 95% CI) | 1.66 [1.24, 2.22] |
| 56.3 Treatment vs Untreated Internal Comparison Group (self‐matching) | 6 | 1263 | Risk Ratio (IV, Random, 95% CI) | 1.91 [1.19, 3.08] |
| 56.4 Treatment vs Untreated Colposcopy+/‐CIN+/‐Biopsy Comparison Group | 12 | 62702 | Risk Ratio (IV, Random, 95% CI) | 1.33 [1.17, 1.50] |
| 56.5 Treatment vs Untreated HSIL Comparison Group | 3 | 774 | Risk Ratio (IV, Random, 95% CI) | 1.46 [0.62, 3.42] |
| 57 PTB (<37w)‐Untreated High‐risk Population vs General Population Show forest plot | 15 | 4.357998E6 | Risk Ratio (IV, Random, 95% CI) | 1.24 [1.14, 1.34] |
| 57.1 Pre‐treatment pregnancies vs General Population | 10 | 3.132723E6 | Risk Ratio (IV, Random, 95% CI) | 1.23 [1.07, 1.42] |
| 57.2 Untreated Colposcopy+/‐CIN+/‐Biopsy vs General Population | 4 | 1.046823E6 | Risk Ratio (IV, Random, 95% CI) | 1.22 [1.11, 1.34] |
| 57.3 Untreated HSIL vs General Population | 3 | 178452 | Risk Ratio (IV, Random, 95% CI) | 1.40 [0.94, 2.10] |
| 58 PTB (<37w)‐Depth≤10‐12mm vs Untreated External Comparison Group Show forest plot | 6 | 1.026243E6 | Risk Ratio (IV, Random, 95% CI) | 1.64 [1.11, 2.42] |
| 58.1 LCp | 1 | 105 | Risk Ratio (IV, Random, 95% CI) | 0.52 [0.06, 4.83] |
| 58.2 LLETZ | 2 | 512896 | Risk Ratio (IV, Random, 95% CI) | 2.06 [1.10, 3.84] |
| 58.3 Excisional Treatment NOS | 3 | 513242 | Risk Ratio (IV, Random, 95% CI) | 1.57 [0.72, 3.41] |
| 59 PTB (<37w)‐Depth≤10‐12mm vs Untreated Internal Comparison Group Show forest plot | 2 | 3550 | Risk Ratio (IV, Random, 95% CI) | 0.90 [0.71, 1.14] |
| 59.1 LC | 1 | 70 | Risk Ratio (IV, Random, 95% CI) | 0.71 [0.05, 10.85] |
| 59.2 Excisional Treatment NOS | 1 | 3480 | Risk Ratio (IV, Random, 95% CI) | 0.90 [0.71, 1.14] |
| 60 PTB (<37w)‐Depth≤10‐12mm vs Untreated Colposcopy+/‐CIN+/‐Biopsy Show forest plot | 4 | 43145 | Risk Ratio (IV, Random, 95% CI) | 1.11 [0.85, 1.43] |
| 60.1 LLETZ | 2 | 33033 | Risk Ratio (IV, Random, 95% CI) | 1.38 [0.94, 2.02] |
| 60.2 Excisional Treatment NOS | 2 | 10112 | Risk Ratio (IV, Random, 95% CI) | 0.93 [0.80, 1.09] |
| 61 PTB (<37w)‐Depth≤15‐17mm vs Untreated External Comparison Group Show forest plot | 2 | 513145 | Risk Ratio (IV, Random, 95% CI) | 1.43 [1.19, 1.73] |
| 61.1 LC | 1 | 164 | Risk Ratio (IV, Random, 95% CI) | 0.67 [0.04, 11.18] |
| 61.2 LLETZ | 1 | 512981 | Risk Ratio (IV, Random, 95% CI) | 1.44 [1.19, 1.74] |
| 62 PTB (<37w)‐Depth≤15‐17mm vs Untreated Colposcopy+/‐CIN+/‐Biopsy Show forest plot | 3 | 34934 | Risk Ratio (IV, Random, 95% CI) | 1.18 [1.00, 1.40] |
| 62.1 LLETZ | 2 | 34278 | Risk Ratio (IV, Random, 95% CI) | 1.30 [0.85, 1.98] |
| 62.2 Excisional Treatment NOS | 1 | 656 | Risk Ratio (IV, Random, 95% CI) | 1.14 [0.76, 1.72] |
| 63 PTB (<37w)‐Depth≤20mm vs Untreated External Comparison Group Show forest plot | 2 | 513814 | Risk Ratio (IV, Random, 95% CI) | 1.60 [1.37, 1.87] |
| 63.1 LC | 1 | 183 | Risk Ratio (IV, Random, 95% CI) | 1.30 [0.28, 5.97] |
| 63.2 LLETZ | 1 | 513631 | Risk Ratio (IV, Random, 95% CI) | 1.61 [1.37, 1.88] |
| 64 PTB (<37w)‐Depth≤20mm vs Untreated Colposcopy+/‐CIN+/‐Biopsy Show forest plot | 2 | 34968 | Risk Ratio (IV, Random, 95% CI) | 1.52 [0.92, 2.51] |
| 64.1 LLETZ | 2 | 34968 | Risk Ratio (IV, Random, 95% CI) | 1.52 [0.92, 2.51] |
| 65 PTB (<37w)‐Depth≥10‐12mm vs Untreated External Comparison Group Show forest plot | 6 | 1.027812E6 | Risk Ratio (IV, Random, 95% CI) | 1.96 [1.66, 2.32] |
| 65.1 LC | 1 | 87 | Risk Ratio (IV, Random, 95% CI) | 4.64 [1.20, 17.88] |
| 65.2 LLETZ | 2 | 514051 | Risk Ratio (IV, Random, 95% CI) | 2.40 [1.30, 4.43] |
| 65.3 Excisional Treatment NOS | 3 | 513674 | Risk Ratio (IV, Random, 95% CI) | 1.82 [1.49, 2.22] |
| 66 PTB (<37w)‐Depth≥10‐12mm vs Untreated Internal Comparison Group Show forest plot | 2 | 3944 | Risk Ratio (IV, Random, 95% CI) | 2.05 [0.56, 7.48] |
| 66.1 LC | 1 | 52 | Risk Ratio (IV, Random, 95% CI) | 6.30 [0.79, 50.27] |
| 66.2 Excisional Treatment NOS | 1 | 3892 | Risk Ratio (IV, Random, 95% CI) | 1.39 [1.12, 1.73] |
| 67 PTB (<37w)‐Depth≥10‐12mm vs Untreated Colposcopy+/‐CIN+/‐Biopsy Show forest plot | 4 | 45275 | Risk Ratio (IV, Random, 95% CI) | 1.52 [1.37, 1.68] |
| 67.1 LLETZ | 2 | 34652 | Risk Ratio (IV, Random, 95% CI) | 1.80 [1.13, 2.87] |
| 67.2 Excisional Treatment NOS | 2 | 10623 | Risk Ratio (IV, Random, 95% CI) | 1.46 [1.29, 1.65] |
| 68 PTB (<37w)‐Depth≥15‐17mm vs Untreated External Comparison Group Show forest plot | 2 | 512503 | Risk Ratio (IV, Random, 95% CI) | 3.04 [1.62, 5.73] |
| 68.1 LC | 1 | 211 | Risk Ratio (IV, Random, 95% CI) | 4.92 [2.09, 11.59] |
| 68.2 LLETZ | 1 | 512292 | Risk Ratio (IV, Random, 95% CI) | 2.45 [2.06, 2.91] |
| 69 PTB (<37w)‐Depth≥15‐17mm vs Untreated Colposcopy+/‐CIN+/‐Biopsy Show forest plot | 3 | 33934 | Risk Ratio (IV, Random, 95% CI) | 2.30 [1.57, 3.35] |
| 69.1 LLETZ | 2 | 33407 | Risk Ratio (IV, Random, 95% CI) | 2.92 [1.14, 7.46] |
| 69.2 Excisional Treatment NOS | 1 | 527 | Risk Ratio (IV, Random, 95% CI) | 2.03 [1.33, 3.10] |
| 70 PTB (<37w)‐Depth≥20mm vs Untreated External Comparison Group Show forest plot | 2 | 511834 | Risk Ratio (IV, Random, 95% CI) | 3.63 [1.67, 7.90] |
| 70.1 LC | 1 | 192 | Risk Ratio (IV, Random, 95% CI) | 6.12 [2.57, 14.57] |
| 70.2 LLETZ | 1 | 511642 | Risk Ratio (IV, Random, 95% CI) | 2.68 [2.15, 3.35] |
| 71 PTB (<37w)‐Depth≥20mm vs Untreated Colposcopy+/‐CIN+/‐Biopsy Show forest plot | 2 | 32717 | Risk Ratio (IV, Random, 95% CI) | 4.32 [0.93, 20.03] |
| 71.1 LLETZ | 2 | 32717 | Risk Ratio (IV, Random, 95% CI) | 4.32 [0.93, 20.03] |
| 72 PTB (<37w)‐Depth 10/13‐15/16mm vs Untreated External Comparison Group Show forest plot | 1 | 511959 | Risk Ratio (IV, Random, 95% CI) | 1.31 [0.99, 1.72] |
| 72.1 LLETZ | 1 | 511959 | Risk Ratio (IV, Random, 95% CI) | 1.31 [0.99, 1.72] |
| 73 PTB (<37w)‐Depth 10/13‐15/16mm vs Untreated Colposcopy+/‐CIN+/‐Biopsy Show forest plot | 3 | 33693 | Risk Ratio (IV, Random, 95% CI) | 1.14 [0.90, 1.44] |
| 73.1 LLETZ | 2 | 33153 | Risk Ratio (IV, Random, 95% CI) | 1.12 [0.80, 1.57] |
| 73.2 Excisional Treatment NOS | 1 | 540 | Risk Ratio (IV, Random, 95% CI) | 1.29 [0.79, 2.12] |
| 74 PTB (<37w)‐Depth 15/16‐19/20mm vs Untreated External Comparison Group Show forest plot | 2 | 511660 | Risk Ratio (IV, Random, 95% CI) | 2.16 [1.65, 2.84] |
| 74.1 LC | 1 | 169 | Risk Ratio (IV, Random, 95% CI) | 2.26 [0.50, 10.08] |
| 74.2 LLETZ | 1 | 511491 | Risk Ratio (IV, Random, 95% CI) | 2.16 [1.64, 2.84] |
| 75 PTB (<37w)‐Depth 15/16‐19/20mm vs Untreated Colposcopy+/‐CIN+/‐Biopsy Show forest plot | 2 | 32598 | Risk Ratio (IV, Random, 95% CI) | 2.38 [1.04, 5.42] |
| 75.1 LLETZ | 2 | 32598 | Risk Ratio (IV, Random, 95% CI) | 2.38 [1.04, 5.42] |
| Outcome or subgroup title | No. of studies | No. of participants | Statistical method | Effect size |
| 1 sPTB (<37w) Show forest plot | 14 | 1.024731E6 | Risk Ratio (IV, Random, 95% CI) | 1.76 [1.47, 2.11] |
| 1.1 CKC vs No Treatment | 3 | 7320 | Risk Ratio (IV, Random, 95% CI) | 3.53 [2.05, 6.05] |
| 1.2 LC vs No Treatment | 2 | 222 | Risk Ratio (IV, Random, 95% CI) | 1.40 [0.51, 3.81] |
| 1.3 NETZ vs No Treatment | 1 | 7399 | Risk Ratio (IV, Random, 95% CI) | 5.83 [3.80, 8.95] |
| 1.4 LLETZ vs No Treatment | 11 | 773123 | Risk Ratio (IV, Random, 95% CI) | 1.60 [1.22, 2.08] |
| 1.5 LA vs No Treatment | 1 | 356 | Risk Ratio (IV, Random, 95% CI) | 0.95 [0.34, 2.68] |
| 1.6 CT vs No Treatment | 1 | 58 | Risk Ratio (IV, Random, 95% CI) | 1.86 [0.08, 43.87] |
| 1.7 Excisional Treatment NOS vs No Treatment | 2 | 95985 | Risk Ratio (IV, Random, 95% CI) | 1.70 [1.17, 2.46] |
| 1.8 Ablative Treatment NOS vs No Treatment | 2 | 134720 | Risk Ratio (IV, Random, 95% CI) | 1.42 [1.20, 1.70] |
| 1.9 Treatment NOS vs No Treatment | 1 | 5548 | Risk Ratio (IV, Random, 95% CI) | 1.30 [1.00, 1.69] |
| 2 sPTB (<32‐34w) Show forest plot | 7 | 655675 | Risk Ratio (IV, Random, 95% CI) | 2.63 [1.91, 3.62] |
| 2.1 CKC vs No Treatment | 2 | 6990 | Risk Ratio (IV, Random, 95% CI) | 4.38 [1.08, 17.65] |
| 2.2 NETZ vs No Treatment | 1 | 7399 | Risk Ratio (IV, Random, 95% CI) | 10.53 [4.33, 25.65] |
| 2.3 LLETZ vs No Treatment | 6 | 530985 | Risk Ratio (IV, Random, 95% CI) | 2.37 [1.82, 3.08] |
| 2.4 CT vs No Treatment | 1 | 58 | Risk Ratio (IV, Random, 95% CI) | 1.86 [0.08, 43.87] |
| 2.5 Excisional Treatment NOS vs No Treatment | 1 | 264 | Risk Ratio (IV, Random, 95% CI) | 13.92 [0.73, 266.57] |
| 2.6 Ablative Treatment NOS vs No Treatment | 1 | 109979 | Risk Ratio (IV, Random, 95% CI) | 1.57 [0.97, 2.53] |
| 3 sPTB (<28w) Show forest plot | 2 | 626670 | Risk Ratio (IV, Random, 95% CI) | 3.18 [1.64, 6.16] |
| 3.1 CKC vs No Treatment | 1 | 6956 | Risk Ratio (IV, Random, 95% CI) | 5.41 [0.74, 39.84] |
| 3.2 NETZ vs No Treatment | 1 | 7399 | Risk Ratio (IV, Random, 95% CI) | 14.74 [4.50, 48.32] |
| 3.3 LLETZ vs No Treatment | 2 | 502336 | Risk Ratio (IV, Random, 95% CI) | 2.57 [1.96, 3.36] |
| 3.4 Ablative Treatment NOS vs No Treatment | 1 | 109979 | Risk Ratio (IV, Random, 95% CI) | 1.22 [0.54, 2.74] |
| 4 pPROM (<37w) Show forest plot | 21 | 477011 | Risk Ratio (IV, Random, 95% CI) | 2.36 [1.76, 3.17] |
| 4.1 CKC vs No Treatment | 4 | 36733 | Risk Ratio (IV, Random, 95% CI) | 4.11 [2.05, 8.25] |
| 4.2 LC vs No Treatment | 4 | 635 | Risk Ratio (IV, Random, 95% CI) | 1.89 [0.97, 3.66] |
| 4.3 NETZ vs No Treatment | 1 | 7279 | Risk Ratio (IV, Random, 95% CI) | 8.83 [5.39, 14.46] |
| 4.4 LLETZ vs No Treatment | 8 | 302974 | Risk Ratio (IV, Random, 95% CI) | 2.15 [1.48, 3.12] |
| 4.5 LA vs No Treatment | 2 | 548 | Risk Ratio (IV, Random, 95% CI) | 1.62 [0.74, 3.55] |
| 4.6 CT vs No Treatment | 1 | 180 | Risk Ratio (IV, Random, 95% CI) | 1.13 [0.21, 6.00] |
| 4.7 Excisional Treatment NOS vs No Treatment | 5 | 98372 | Risk Ratio (IV, Random, 95% CI) | 2.66 [1.13, 6.24] |
| 4.8 Ablative Treatment NOS vs No Treatment | 1 | 24742 | Risk Ratio (IV, Random, 95% CI) | 1.47 [1.01, 2.15] |
| 4.9 Treatment NOS vs No Treatment | 1 | 5548 | Risk Ratio (IV, Random, 95% CI) | 1.44 [1.05, 1.97] |
| 5 pPROM (<32w) Show forest plot | 1 | 72788 | Risk Ratio (IV, Random, 95% CI) | 8.30 [2.03, 33.98] |
| 5.1 CKC vs No Treatment | 1 | 6842 | Risk Ratio (IV, Random, 95% CI) | 5.32 [0.72, 39.19] |
| 5.2 NETZ vs No Treatment | 1 | 7279 | Risk Ratio (IV, Random, 95% CI) | 25.38 [9.80, 65.74] |
| 5.3 LLETZ vs No Treatment | 1 | 58667 | Risk Ratio (IV, Random, 95% CI) | 3.74 [1.66, 8.41] |
| 6 pPROM (<28w) Show forest plot | 1 | 72788 | Risk Ratio (IV, Random, 95% CI) | 9.09 [1.04, 79.18] |
| 6.1 CKC vs No Treatment | 1 | 6842 | Risk Ratio (IV, Random, 95% CI) | 6.64 [0.38, 115.16] |
| 6.2 NETZ vs No Treatment | 1 | 7279 | Risk Ratio (IV, Random, 95% CI) | 43.51 [11.48, 164.86] |
| 6.3 LLETZ vs No Treatment | 1 | 58667 | Risk Ratio (IV, Random, 95% CI) | 1.81 [0.25, 13.08] |
| 7 Threatened PTB Show forest plot | 5 | 903 | Risk Ratio (IV, Random, 95% CI) | 2.44 [1.37, 4.33] |
| 7.1 CKC vs No Treatment | 1 | 126 | Risk Ratio (IV, Random, 95% CI) | 1.40 [0.45, 4.34] |
| 7.2 LC vs No Treatment | 1 | 112 | Risk Ratio (IV, Random, 95% CI) | 1.56 [0.53, 4.62] |
| 7.3 LLETZ vs No Treatment | 1 | 237 | Risk Ratio (IV, Random, 95% CI) | 4.0 [0.75, 21.37] |
| 7.4 Excisional Treatment NOS vs No Treatment | 2 | 428 | Risk Ratio (IV, Random, 95% CI) | 4.51 [1.68, 12.06] |
| 8 Chorioamnionitis Show forest plot | 4 | 29198 | Risk Ratio (IV, Random, 95% CI) | 3.43 [1.36, 8.64] |
| 8.1 CKC vs No Treatment | 1 | 28531 | Risk Ratio (IV, Random, 95% CI) | 2.39 [0.61, 9.43] |
| 8.2 LC vs No Treatment | 1 | 112 | Risk Ratio (IV, Random, 95% CI) | 3.33 [0.14, 80.11] |
| 8.3 LLETZ vs No Treatment | 1 | 237 | Risk Ratio (IV, Random, 95% CI) | 10.00 [1.19, 84.15] |
| 8.4 Excisional Treatment NOS vs No Treatment | 1 | 318 | Risk Ratio (IV, Random, 95% CI) | 3.0 [0.51, 17.68] |
| 9 Caeserean Section Show forest plot | 36 | 272360 | Risk Ratio (IV, Random, 95% CI) | 1.06 [0.98, 1.14] |
| 9.1 CKC vs No Treatment | 6 | 30462 | Risk Ratio (IV, Random, 95% CI) | 1.24 [0.91, 1.68] |
| 9.2 LC vs No Treatment | 5 | 1038 | Risk Ratio (IV, Random, 95% CI) | 1.38 [0.90, 2.11] |
| 9.3 LLETZ vs No Treatment | 14 | 5436 | Risk Ratio (IV, Random, 95% CI) | 1.04 [0.94, 1.15] |
| 9.4 LA vs No Treatment | 4 | 1258 | Risk Ratio (IV, Random, 95% CI) | 0.86 [0.61, 1.20] |
| 9.5 CT vs No Treatment | 2 | 238 | Risk Ratio (IV, Random, 95% CI) | 2.47 [1.02, 6.01] |
| 9.6 Excisional Treatment NOS vs No Treatment | 9 | 203532 | Risk Ratio (IV, Random, 95% CI) | 1.03 [0.89, 1.20] |
| 9.7 Ablative Treatment NOS vs No Treatment | 2 | 24848 | Risk Ratio (IV, Random, 95% CI) | 1.38 [0.42, 4.58] |
| 9.8 Treatment NOS vs No Treatment | 1 | 5548 | Risk Ratio (IV, Random, 95% CI) | 1.13 [1.00, 1.27] |
| 10 Instrumental Deliveries (ventouse/forceps) Show forest plot | 16 | 9588 | Risk Ratio (IV, Random, 95% CI) | 0.97 [0.88, 1.08] |
| 10.1 CKC vs No Treatment | 2 | 454 | Risk Ratio (IV, Random, 95% CI) | 1.33 [0.66, 2.70] |
| 10.2 LC vs No Treatment | 2 | 668 | Risk Ratio (IV, Random, 95% CI) | 1.16 [0.65, 2.07] |
| 10.3 LLETZ vs No Treatment | 6 | 1418 | Risk Ratio (IV, Random, 95% CI) | 0.89 [0.68, 1.17] |
| 10.4 LA vs No Treatment | 3 | 550 | Risk Ratio (IV, Random, 95% CI) | 0.94 [0.62, 1.41] |
| 10.5 Excisional Treatment NOS vs No Treatment | 3 | 950 | Risk Ratio (IV, Random, 95% CI) | 0.71 [0.46, 1.10] |
| 10.6 Treatment NOS vs No Treatment | 1 | 5548 | Risk Ratio (IV, Random, 95% CI) | 1.01 [0.89, 1.15] |
| 11 Precipitous Labour (<2hours) Show forest plot | 5 | 1059 | Risk Ratio (IV, Random, 95% CI) | 1.26 [0.80, 1.96] |
| 11.1 CKC vs No Treatment | 2 | 289 | Risk Ratio (IV, Random, 95% CI) | 1.24 [0.47, 3.27] |
| 11.2 LLETZ vs No Treatment | 4 | 770 | Risk Ratio (IV, Random, 95% CI) | 1.26 [0.76, 2.08] |
| 12 Prolonged labour (>12hours) Show forest plot | 7 | 1854 | Risk Ratio (IV, Random, 95% CI) | 1.25 [0.92, 1.69] |
| 12.1 CKC vs No Treatment | 2 | 325 | Risk Ratio (IV, Random, 95% CI) | 1.99 [0.89, 4.45] |
| 12.2 LC vs No Treatment | 1 | 500 | Risk Ratio (IV, Random, 95% CI) | 0.92 [0.41, 2.04] |
| 12.3 LLETZ vs No Treatment | 4 | 673 | Risk Ratio (IV, Random, 95% CI) | 0.96 [0.55, 1.70] |
| 12.4 LA vs No Treatment | 2 | 356 | Risk Ratio (IV, Random, 95% CI) | 1.41 [0.88, 2.26] |
| 13 Induction of Labour Show forest plot | 11 | 4668 | Risk Ratio (IV, Random, 95% CI) | 1.01 [0.89, 1.15] |
| 13.1 CKC vs No Treatment | 2 | 137 | Risk Ratio (IV, Random, 95% CI) | 1.11 [0.54, 2.29] |
| 13.2 LLETZ vs No treatment | 8 | 4056 | Risk Ratio (IV, Random, 95% CI) | 0.99 [0.82, 1.20] |
| 13.3 CT vs No Treatment | 1 | 58 | Risk Ratio (IV, Random, 95% CI) | 0.61 [0.22, 1.66] |
| 13.4 Excisional Treatment NOS vs No Treatment | 2 | 417 | Risk Ratio (IV, Random, 95% CI) | 0.90 [0.64, 1.28] |
| 14 Oxytocin Use Show forest plot | 6 | 2006 | Risk Ratio (IV, Random, 95% CI) | 0.90 [0.64, 1.26] |
| 14.1 CKC vs No Treatment | 1 | 103 | Risk Ratio (IV, Random, 95% CI) | 0.98 [0.59, 1.63] |
| 14.2 LLETZ vs No Treatment | 4 | 1804 | Risk Ratio (IV, Random, 95% CI) | 0.76 [0.43, 1.34] |
| 14.3 Excisional Treatment NOS vs No Treatment | 1 | 99 | Risk Ratio (IV, Random, 95% CI) | 1.18 [0.67, 2.05] |
| 15 Epidural Use Show forest plot | 5 | 105488 | Risk Ratio (IV, Random, 95% CI) | 1.02 [0.68, 1.53] |
| 15.1 LLETZ vs No Treatment | 4 | 818 | Risk Ratio (IV, Random, 95% CI) | 0.86 [0.64, 1.16] |
| 15.2 Excisional Treatment NOS vs No Treatment | 1 | 104670 | Risk Ratio (IV, Random, 95% CI) | 1.79 [1.29, 2.50] |
| 16 Pethidine Use Show forest plot | 2 | 394 | Risk Ratio (IV, Random, 95% CI) | 0.94 [0.72, 1.24] |
| 16.1 LLETZ vs No treatment | 2 | 394 | Risk Ratio (IV, Random, 95% CI) | 0.94 [0.72, 1.24] |
| 17 Analgesia Use NOS Show forest plot | 1 | 103 | Risk Ratio (IV, Random, 95% CI) | 1.11 [0.62, 1.98] |
| 17.1 CKC vs No Treatment | 1 | 103 | Risk Ratio (IV, Random, 95% CI) | 1.11 [0.62, 1.98] |
| 18 Cervical stenosis Show forest plot | 2 | 680 | Risk Ratio (IV, Random, 95% CI) | 2.26 [0.24, 21.59] |
| 18.1 LC vs No Treatment | 1 | 500 | Risk Ratio (IV, Random, 95% CI) | 3.0 [0.12, 73.29] |
| 18.2 CT vs No Treatment | 1 | 180 | Risk Ratio (IV, Random, 95% CI) | 1.71 [0.07, 41.31] |
| 19 Antepartum Haemorrhage Show forest plot | 4 | 1245 | Risk Ratio (IV, Random, 95% CI) | 1.11 [0.40, 3.12] |
| 19.1 CKC vs No Treatment | 1 | 34 | Risk Ratio (IV, Random, 95% CI) | 1.24 [0.26, 5.83] |
| 19.2 LC vs No Treatment | 1 | 168 | Risk Ratio (IV, Random, 95% CI) | 17.84 [0.98, 325.68] |
| 19.3 LLETZ vs No Treatment | 2 | 277 | Risk Ratio (IV, Random, 95% CI) | 0.52 [0.16, 1.67] |
| 19.4 LA vs No Treatment | 1 | 708 | Risk Ratio (IV, Random, 95% CI) | 8.00 [0.90, 71.18] |
| 19.5 CT vs No Treatment | 1 | 58 | Risk Ratio (IV, Random, 95% CI) | 0.41 [0.07, 2.25] |
| 20 Postpartum Haemorrhage (>600ml) Show forest plot | 1 | 149 | Risk Ratio (IV, Random, 95% CI) | 4.60 [1.38, 15.36] |
| 20.1 CKC vs No Treatment | 1 | 149 | Risk Ratio (IV, Random, 95% CI) | 4.60 [1.38, 15.36] |
| 21 Massive Obstetric Haemorrhage (>1000ml) Show forest plot | 1 | 149 | Risk Ratio (IV, Random, 95% CI) | 3.95 [0.45, 34.48] |
| 21.1 CKC vs No Treatment | 1 | 149 | Risk Ratio (IV, Random, 95% CI) | 3.95 [0.45, 34.48] |
| 22 Cervical cerclage Show forest plot | 8 | 141300 | Risk Ratio (IV, Random, 95% CI) | 14.29 [2.85, 71.65] |
| 22.1 CKC vs No Treatment | 3 | 30744 | Risk Ratio (IV, Random, 95% CI) | 31.42 [2.32, 426.22] |
| 22.2 LC vs No Treatment | 1 | 112 | Risk Ratio (IV, Random, 95% CI) | 6.68 [0.83, 53.69] |
| 22.3 LLETZ vs No Treatment | 1 | 56 | Risk Ratio (IV, Random, 95% CI) | 11.00 [0.64, 189.96] |
| 22.4 Excisional Treatment NOS vs No Treatment | 2 | 104840 | Risk Ratio (IV, Random, 95% CI) | 42.45 [28.99, 62.16] |
| 22.5 Treatment NOS vs No Treatment | 1 | 5548 | Risk Ratio (IV, Random, 95% CI) | 2.16 [1.24, 3.76] |
| Outcome or subgroup title | No. of studies | No. of participants | Statistical method | Effect size |
| 1 LBW (<2500g) Show forest plot | 30 | 1.348206E6 | Risk Ratio (IV, Random, 95% CI) | 1.81 [1.58, 2.07] |
| 1.1 CKC vs No Treatment | 5 | 30304 | Risk Ratio (IV, Random, 95% CI) | 2.51 [1.78, 3.53] |
| 1.2 LC vs No Treatment | 4 | 786 | Risk Ratio (IV, Random, 95% CI) | 1.76 [0.72, 4.35] |
| 1.3 LLETZ vs No Treatment | 12 | 3357 | Risk Ratio (IV, Random, 95% CI) | 2.11 [1.51, 2.94] |
| 1.4 LA vs No Treatment | 4 | 1104 | Risk Ratio (IV, Random, 95% CI) | 1.07 [0.59, 1.92] |
| 1.5 CT vs No Treatment | 1 | 58 | Risk Ratio (IV, Random, 95% CI) | 3.67 [0.47, 28.47] |
| 1.6 Excisional Treatment NOS vs No Treatment | 10 | 823648 | Risk Ratio (IV, Random, 95% CI) | 2.01 [1.62, 2.49] |
| 1.7 Ablative Treatment NOS vs No Treatment | 4 | 483402 | Risk Ratio (IV, Random, 95% CI) | 1.36 [1.19, 1.55] |
| 1.8 Treatment NOS vs No Treatment | 1 | 5547 | Risk Ratio (IV, Random, 95% CI) | 1.35 [1.14, 1.60] |
| 2 LBW (<2000g) Show forest plot | 3 | 74981 | Risk Ratio (IV, Random, 95% CI) | 2.49 [0.97, 6.36] |
| 2.1 LC vs No Treatment | 1 | 181 | Risk Ratio (IV, Random, 95% CI) | 4.46 [1.36, 14.59] |
| 2.2 LA vs No Treatment | 2 | 772 | Risk Ratio (IV, Random, 95% CI) | 0.95 [0.39, 2.29] |
| 2.3 Excisional Treatment NOS vs No Treatment | 1 | 74028 | Risk Ratio (IV, Random, 95% CI) | 4.60 [3.32, 6.37] |
| 3 LBW (<1500g) Show forest plot | 5 | 76836 | Risk Ratio (IV, Random, 95% CI) | 3.00 [1.54, 5.85] |
| 3.1 LC vs No Treatment | 1 | 181 | Risk Ratio (IV, Random, 95% CI) | 12.75 [1.53, 106.44] |
| 3.2 LLETZ vs No Treatment | 1 | 378 | Risk Ratio (IV, Random, 95% CI) | 7.0 [0.36, 134.59] |
| 3.3 LA vs No Treatment | 2 | 772 | Risk Ratio (IV, Random, 95% CI) | 0.68 [0.16, 2.80] |
| 3.4 Excisional Treatment NOS vs No Treatment | 2 | 75505 | Risk Ratio (IV, Random, 95% CI) | 3.34 [2.02, 5.54] |
| 4 LBW (<1000g) Show forest plot | 2 | 2185 | Risk Ratio (IV, Random, 95% CI) | 2.09 [0.06, 74.71] |
| 4.1 LA vs No Treatment | 1 | 708 | Risk Ratio (IV, Random, 95% CI) | 0.29 [0.01, 5.50] |
| 4.2 Excisional Treatment NOS vs No Treatment | 1 | 1477 | Risk Ratio (IV, Random, 95% CI) | 11.10 [1.44, 85.79] |
| 5 NICU Admission Show forest plot | 8 | 2557 | Risk Ratio (IV, Random, 95% CI) | 1.45 [1.16, 1.81] |
| 5.1 CKC vs No Treatment | 2 | 71 | Risk Ratio (IV, Random, 95% CI) | 1.40 [0.52, 3.75] |
| 5.2 LLETZ vs No Treatment | 5 | 1994 | Risk Ratio (IV, Random, 95% CI) | 1.42 [1.01, 1.99] |
| 5.3 CT vs No Treatment | 1 | 58 | Risk Ratio (IV, Random, 95% CI) | 2.44 [0.29, 20.49] |
| 5.4 Excisional Treatment NOS vs No Treatment | 2 | 434 | Risk Ratio (IV, Random, 95% CI) | 1.76 [1.13, 2.75] |
| 6 Perinatal Mortality Show forest plot | 23 | 1.659433E6 | Risk Ratio (IV, Random, 95% CI) | 1.51 [1.13, 2.03] |
| 6.1 CKC vs No Treatment | 7 | 50588 | Risk Ratio (IV, Random, 95% CI) | 1.46 [0.83, 2.57] |
| 6.2 LC vs No Treatment | 3 | 906 | Risk Ratio (IV, Random, 95% CI) | 1.89 [0.26, 13.87] |
| 6.3 NETZ vs No Treatment | 1 | 7399 | Risk Ratio (IV, Random, 95% CI) | 9.99 [3.13, 31.92] |
| 6.4 LLETZ vs No Treatment | 7 | 302271 | Risk Ratio (IV, Random, 95% CI) | 1.53 [0.88, 2.67] |
| 6.5 LA vs No Treatment | 2 | 258 | Risk Ratio (IV, Random, 95% CI) | 3.0 [0.12, 72.74] |
| 6.6 CT vs No Treatment | 2 | 238 | Risk Ratio (IV, Random, 95% CI) | 0.19 [0.01, 4.59] |
| 6.7 Excisional Treatment NOS vs No Treatment | 5 | 820028 | Risk Ratio (IV, Random, 95% CI) | 1.85 [1.02, 3.36] |
| 6.8 Ablative Treatment NOS vs No Treatment | 2 | 472197 | Risk Ratio (IV, Random, 95% CI) | 0.69 [0.42, 1.13] |
| 6.9 Treatment NOS vs No Treatment | 1 | 5548 | Risk Ratio (IV, Random, 95% CI) | 1.00 [0.63, 1.58] |
| 7 Perinatal Mortality (<37w) Show forest plot | 1 | 73992 | Risk Ratio (IV, Random, 95% CI) | 9.40 [2.01, 43.89] |
| 7.1 CKC vs No Treatment | 1 | 6956 | Risk Ratio (IV, Random, 95% CI) | 5.33 [0.31, 90.71] |
| 7.2 NETZ vs No Treatment | 1 | 7399 | Risk Ratio (IV, Random, 95% CI) | 30.96 [8.71, 110.13] |
| 7.3 LLETZ vs No Treatment | 1 | 59637 | Risk Ratio (IV, Random, 95% CI) | 3.92 [1.24, 12.38] |
| 8 Perinatal Mortality (<32w) Show forest plot | 1 | 73992 | Risk Ratio (IV, Random, 95% CI) | 12.81 [2.70, 60.87] |
| 8.1 CKC vs No Treatment | 1 | 6956 | Risk Ratio (IV, Random, 95% CI) | 6.75 [0.39, 117.10] |
| 8.2 NETZ vs No Treatment | 1 | 7399 | Risk Ratio (IV, Random, 95% CI) | 44.23 [11.67, 167.61] |
| 8.3 LLETZ vs No Treatment | 1 | 59637 | Risk Ratio (IV, Random, 95% CI) | 5.43 [1.71, 17.30] |
| 9 Perinatal Mortality (<28w) Show forest plot | 1 | 73992 | Risk Ratio (IV, Random, 95% CI) | 13.76 [2.37, 79.89] |
| 9.1 CKC vs No Treatment | 1 | 6956 | Risk Ratio (IV, Random, 95% CI) | 9.21 [0.51, 164.95] |
| 9.2 NETZ vs No Treatment | 1 | 7399 | Risk Ratio (IV, Random, 95% CI) | 51.61 [13.17, 202.29] |
| 9.3 LLETZ vs No Treatment | 1 | 59637 | Risk Ratio (IV, Random, 95% CI) | 4.49 [1.09, 18.45] |
| 10 Stillbirth Show forest plot | 12 | 249855 | Risk Ratio (IV, Random, 95% CI) | 0.98 [0.63, 1.52] |
| 10.1 CKC vs No Treatment | 3 | 935 | Risk Ratio (IV, Random, 95% CI) | 1.61 [0.48, 5.40] |
| 10.2 LC vs No Treatment | 2 | 725 | Risk Ratio (IV, Random, 95% CI) | 0.33 [0.03, 3.18] |
| 10.3 LLETZ vs No Treatment | 4 | 242473 | Risk Ratio (IV, Random, 95% CI) | 1.42 [0.62, 3.26] |
| 10.4 LA vs No Treatment | 1 | 64 | Risk Ratio (IV, Random, 95% CI) | 0.0 [0.0, 0.0] |
| 10.5 Excisional Treatment NOS vs No Treatment | 1 | 110 | Risk Ratio (IV, Random, 95% CI) | 0.0 [0.0, 0.0] |
| 10.6 Treatment NOS vs No Treatment | 1 | 5548 | Risk Ratio (IV, Random, 95% CI) | 0.77 [0.42, 1.40] |
| 11 Apgar score (≤5)(1min) Show forest plot | 1 | 225 | Risk Ratio (IV, Random, 95% CI) | 0.57 [0.12, 2.68] |
| 11.1 LC vs No Treatment | 1 | 225 | Risk Ratio (IV, Random, 95% CI) | 0.57 [0.12, 2.68] |
| 12 Apgar score (<7)(1min) Show forest plot | 1 | 152 | Risk Ratio (IV, Random, 95% CI) | 0.63 [0.07, 5.71] |
| 12.1 LLETZ vs No Treatment | 1 | 87 | Risk Ratio (IV, Random, 95% CI) | 0.16 [0.01, 3.30] |
| 12.2 CKC vs No Treatment | 1 | 65 | Risk Ratio (IV, Random, 95% CI) | 1.61 [0.15, 16.90] |
| 13 Apgar score (<7)(5min) Show forest plot | 2 | 297 | Risk Ratio (IV, Random, 95% CI) | 0.82 [0.19, 3.59] |
| 13.1 CKC vs No Treatment | 1 | 32 | Risk Ratio (IV, Random, 95% CI) | 0.0 [0.0, 0.0] |
| 13.2 LLETZ vs No Treatment | 1 | 120 | Risk Ratio (IV, Random, 95% CI) | 0.93 [0.16, 5.37] |
| 13.3 CT vs No Treatment | 1 | 58 | Risk Ratio (IV, Random, 95% CI) | 0.61 [0.04, 9.28] |
| 13.4 Excisional Treatment NOS vs No Treatment | 1 | 87 | Risk Ratio (IV, Random, 95% CI) | 0.0 [0.0, 0.0] |