Ecografía, TC, RM o TEP‐TC para el estadiaje y reestadiaje de adultos con melanoma cutáneo
Appendices
Appendix 1. Current content and structure of the Programme Grant
| LIST OF REVIEWS | Number of studies | |
| Diagnosis of melanoma | ||
| 1 | Visual inspection | 49 |
| 2 | Dermoscopy ± visual inspection | 104 |
| 3 | Teledermatology | 22 |
| 4 | Smartphone applications | 2 |
| 5a | Computer‐aided diagnosis – dermoscopy‐based techniques | 42 |
| 5b | Computer‐aided diagnosis – spectroscopy‐based techniques | Review amalgamated into 5a |
| 6 | Reflectance confocal microscopy | 18 |
| 7 | High frequency ultrasound | 5 |
| Diagnosis of keratinocyte skin cancer (BCC and cSCC) | ||
| 8 | Visual inspection ± Dermoscopy | 24 |
| 5c | Computer‐aided diagnosis – dermoscopy‐based techniques | Review amalgamated into 5a |
| 5d | Computer‐aided diagnosis – spectroscopy‐based techniques | Review amalgamated into 5a |
| 9 | Optical coherence tomography | 5 |
| 10 | Reflectance confocal microscopy | 10 |
| 11 | Exfoliative cytology | 9 |
| Staging of melanoma | ||
| 12 | Imaging tests (ultrasound, CT, MRI, PET‐CT) | 39 |
| 13 | Sentinel lymph node biopsy | 155 |
| Staging of cSCC | ||
| 14 | Imaging tests review | Review dropped; only 1 study identified |
| 15 | Sentinel lymph node biopsy | Review amalgamated into 13 above (n = 15 studies) |
Appendix 2. Glossary of terms
| Term | Definition |
| Adjuvant therapy or treatment | A treatment given after the main treatment for cancer to reduce the risk of recurrence. |
| Adverse event | Detrimental change in health occurring in a person receiving the treatment whether or not it has been caused by the treatment. |
| Axillary | In the armpit. |
| Biopsy | Removal of a sample of tissue from the body to assist in diagnosis or inform the choice of treatment of a disease. |
| BRAF V600 mutation | BRAF is a human gene that makes a protein called B‐Raf, which is involved in the control of cell growth. BRAF mutations (damaged DNA) occur in around 40% of melanomas, which can then be treated with particular drugs. |
| BRAF inhibitors | Therapeutic agents that inhibit the serine‐threonine protein kinase BRAF mutated metastatic melanoma. |
| Breslow thickness | A scale for measuring the thickness of melanomas by the pathologist using a microscope, measured in mm from the top layer of skin to the bottom of the tumour. |
| Cervical (lymph nodes) | Lymph nodes found in the neck area of the body. |
| Computed tomography (CT) | Imaging technique in which the person lies on a table within an X‐ray gantry. The images are acquired using a spiral (helical) path and banks of detectors, allowing presentation of the internal organs and blood vessels in different projections including 3D views. |
| Coronal | Frontal plane dividing the body into front and back. |
| False negative | An individual who is truly positive for a disease, but whom a diagnostic test classifies as disease‐free. |
| False positive | An individual who is truly disease‐free, but whom a diagnostic test classifies as having the disease. |
| Histopathology | The study of tissue, usually obtained by biopsy or excision, for example under a microscope. |
| Incidence | The number of new cases of a disease in a given time period. |
| Inguinal | Lymph nodes in or just above or just below the groin. |
| Isolated limb perfusion | A medical procedure that directly delivers a drug through the bloodstream in a limb to the site affected by melanoma. |
| Local recurrence | Re‐growth of a tumour in the area from which it was originally removed. |
| Locoregional recurrence | Re‐growth of a tumour in the area from which it was originally removed or in the regional lymph nodes (usually nearest to the original tumour site). |
| Lymph node | Lymph nodes filter the lymphatic fluid (clear fluid containing white blood cells) that travels around the body to help fight disease; they are located throughout the body often in clusters (nodal basins). |
| Lymph node dissection | Surgical removal or 1 or more lymph nodes in the absence of proven involvement with melanoma. |
| Lymphadenectomy | Lymphadenectomy or lymph node dissection is a surgical operation to remove 1 or more groups of lymph nodes. |
| Lymphoscintigraphy | An imaging technique used to identify the lymph drainage basin, determine the number of sentinel nodes, differentiate sentinel nodes from subsequent nodes, locate the sentinel node in an unexpected location, and mark the sentinel node over the skin for biopsy. It requires the injection of a radioisotope into the skin around the biopsy scar and a scan some hours later to determine to which lymph nodes the tracer has travelled. |
| Lymphovascular invasion | Tumour cells that have spread to involve the blood vessels and lymphatic vessels within the skin. |
| Magnetic resonance imaging (MRI) | A type of scan that uses a magnetic field and radio waves to produce images of sections of the body. |
| Mediastinal and hilar adenopathy | Enlargement of the pulmonary lymph nodes. |
| MEK inhibitors | Drugs that inhibit the mitogen‐activated protein kinase enzymes, which are often upregulated in melanoma. |
| Meta‐analysis | A form of statistical analysis used to synthesise results from a collection of individual studies. |
| Metastases/metastatic disease | Spread of cancer away from the primary site to somewhere else through the bloodstream or the lymphatic system. |
| Micro‐metastases | Micro‐metastases are metastases so small that they can be seen only under a microscope. |
| Mitotic rate | Microscopic evaluation of the number of cells actively dividing in a tumour. |
| Morbidity | Detrimental effects on health. |
| Mortality | Either (1) the condition of being subject to death; or (2) the death rate, which reflects the number of deaths per unit of population in relation to any specific region, age group, disease, treatment, or other classification, usually expressed as deaths per 100, 1000, 10,000, or 100,000 people. |
| Multi‐disciplinary team | A team with members from different healthcare professions and specialties (e.g. urology, oncology, pathology, radiology, nursing). Cancer care in the National Health Service (NHS) uses this system to ensure that all relevant health professionals are engaged to discuss the best possible care for a patient. |
| Nodal basin | Cluster of lymph nodes that filter lymphatic fluid as it travels around the body; clusters are located under the arm (axilla) and in the groin, neck, chest, and abdomen. |
| Oncology | The study of cancers. This term also refers to the medical specialty of cancer care, with particular reference to the use of radiotherapy or drugs to treat cancer. The medical specialty is often split into clinical oncology (doctors who use radiotherapy and drug treatment) and medical oncology (doctors who use drug treatment). |
| Palpation | Feeling with the fingers or hands as part of a clinical examination of the body. |
| Positron emission tomography (PET) | A nuclear medicine imaging technique whereby a radioactive glucose (usually 18FDG) is administered intravenously before a scan is conducted to create an image using colours to show where the FDG (or other radioactive tracer) has been taken up in the body. |
| Prevalence | The proportion of a population found to have a condition. |
| Prognostic factors/indicators | Specific characteristics of a cancer or the person who has it that might affect the patient’s prognosis. |
| Radiotherapy | The use of radiation, usually high‐energy X‐rays, to control the growth of cancer cells. |
| RAS‐RAF‐MEK‐ERK signalling pathway | A chain of proteins that allow signals from a receptor on the surface of a cell to be sent to the DNA in the cell nucleus; a mutation in one of the proteins in the pathway is associated with the development of many cancers. |
| Recurrence | Recurrence occurs when new cancer cells are detected following treatment. This can occur either at the site of the original tumour or at other sites in the body. |
| Relapse | Where cancer starts to grow again after treatment. |
| Sagittal | Median plane dividing the body into left and right. |
| Sensitivity | In this context, the term is used to mean the proportion of individuals with a disease who have that disease correctly identified by the study test. |
| Sentinel lymph node biopsy (SLNB) | A radioactive tracer and blue dye are injected into the skin surrounding the primary lesion and the 'sentinel' lymph nodes to which the tracer drains are located by imaging (usually lymphoscintigraphy) and then are removed and examined for nodal metastatic spread that cannot be detected clinically or on imaging. |
| Signal transduction | Occurs when extracellular signalling molecules activate a specific receptor, which then triggers cellular pathways. |
| Staging | Clinical description of the size and spread of a patient’s tumour, fitting into internationally agreed categories. |
| Stereotactic radiotherapy | A technique for delivering high‐dose radiotherapy very accurately to small areas inside the body, which reduces damage done by radiotherapy to adjacent healthy tissues. |
| Subclinical (disease) | Disease that usually is asymptomatic and is not easily observable (e.g. by clinical or physical examination). |
| Systemic treatment | Treatment, usually given by mouth or by injection, that reaches and affects cancer cells throughout the body rather than targeting one specific area. |
| Ultrasound | A type of scan in which high‐frequency sound waves are used to outline a part of the body. |
Appendix 3. Table of acronyms
| Acronym | Definition |
| μm | micrometre |
| AK | actinic keratosis |
| ANN | artificial neural network |
| BCC | basal cell carcinoma |
| BD | Bowen’s disease |
| BPC | between‐person comparison (of tests) |
| CAD | computer‐assisted diagnosis |
| CCS | case‐control study |
| CS | case series |
| cSCC | cutaneous squamous cell carcinoma |
| D‐ | disease negative |
| D+ | disease positive |
| Derm–CAD | digital dermoscopy‐based computer‐assisted diagnosis |
| DF | dermatofibroma |
| DRS | diffuse reflectance spectroscopy |
| DRSi | diffuse reflectance spectroscopy imaging |
| Dx | diagnosis |
| EIS | electrical impedance spectroscopy |
| FN | false negative |
| FP | false positive |
| FU | follow‐ up |
| GP | general practitioner |
| H&E | haematoxylin and eosin stain |
| HFUS | high‐frequency ultrasound |
| Hz | hertz |
| KHz | kilohertz |
| K–NN | k nearest neighbour |
| MHz | megahertz |
| MiS | melanoma in situ (or lentigo maligna) |
| MM | malignant melanoma |
| mm | millimetre |
| MSI | multi‐spectral imaging |
| N/A | not applicable |
| NC | non‐comparative |
| nm | nanometre |
| NPV | negative predictive value |
| NR | not reported |
| P | prospective |
| PPV | positive predictive value |
| PSL | pigmented skin lesion |
| R | retrospective |
| RCM | reflectance confocal microscopy |
| RCT | randomised controlled trial |
| SCC | squamous cell carcinoma |
| SD | standard deviation |
| se | sensitivity |
| sp | specificity |
| spectro–CAD | spectroscopy‐based computer–assisted diagnosis |
| SK | seborrhoeic keratosis |
| SSM | superficial spreading melanoma |
| SVM | support vector machine |
| TN | true negative |
| TS | telespectrophotometry system |
| VI | visual inspection |
| UNREF | unreferred population |
| WPC | within‐person comparison (of tests) |
| WPC‐algs | within‐person comparison (of algorithms) |
Appendix 4. Proposed sources of heterogeneity
These may vary between reviews but may include the following.
i. Population characteristics
-
AJCC stage of disease
-
Sentinel lymph node status (for imaging studies only)
-
Clinical nodal status (for imaging studies only)
-
Primary tumour site (head and neck, trunk, limb, and other)
ii. Index test characteristics
-
Differences in test positivity thresholds (e.g. for SLNB, the tracer threshold for a 'hot' vs 'cold' node)
-
Other relevant test characteristics as appropriate to the test under consideration
iii. Reference standard characteristics
-
Reference standard used (histology, clinical, or imaging‐based follow‐up; concurrent imaging‐based reference standard)
iv. Study quality
-
Consecutive or random sample of participants recruited
-
Index test interpreted, blinded to the reference standard result
-
Index test interpreted, blinded to the result of any other index test
-
Presence of partial or differential verification bias (whereby only a sample of those subject to the index test are verified by the reference test or by the same reference test, with selection dependent on the index test result)
-
Use of an adequate reference standard
-
Overall risk of bias
Appendix 5. Final search strategies
Melanoma search strategies to August 2016
Database: Ovid MEDLINE(R) 1946 to August Week 3 2016
Search strategy:
1 exp melanoma/
2 exp skin cancer/
3 exp basal cell carcinoma/
4 basalioma$1.ti,ab.
5 ((basal cell or skin) adj2 (cancer$1 or carcinoma$1 or mass or masses or tumour$1 or tumor$1 or neoplasm$1 or adenoma$1 or epithelioma$1 or lesion$1 or malignan$ or nodule$1)).ti,ab.
6 (pigmented adj2 (lesion$1 or mole$ or nevus or nevi or naevus or naevi or skin)).ti,ab.
7 (melanom$1 or nonmelanoma$1 or non‐melanoma$1 or melanocyt$ or non‐melanocyt$ or nonmelanocyt$ or keratinocyt$).ti,ab.
8 nmsc.ti,ab.
9 (squamous cell adj2 (cancer$1 or carcinoma$1 or mass or masses or tumor$1 or tumour$1 or neoplasm$1 or adenoma$1 or epithelioma$1 or epithelial or lesion$1 or malignan$ or nodule$1) adj2 (skin or epiderm$ or cutaneous)).ti,ab.
10 (BCC or CSCC or NMSC).ti,ab.
11 keratinocy$.ti,ab.
12 Keratinocytes/
13 or/1‐12
14 dermoscop$.ti,ab.
15 dermatoscop$.ti,ab.
16 photomicrograph$.ti,ab.
17 exp epiluminescence microscopy/
18 (epiluminescence adj2 microscop$).ti,ab.
19 (confocal adj2 microscop$).ti,ab.
20 (incident light adj2 microscop$).ti,ab.
21 (surface adj2 microscop$).ti,ab.
22 (visual adj (inspect$ or examin$)).ti,ab.
23 ((clinical or physical) adj examin$).ti,ab.
24 3 point.ti,ab.
25 three point.ti,ab.
26 pattern analys$.ti,ab.
27 ABCD$.ti,ab.
28 menzies.ti,ab.
29 7 point.ti,ab.
30 seven point.ti,ab.
31 (digital adj2 (dermoscop$ or dermatoscop$)).ti,ab.
32 artificial intelligence.ti,ab.
33 AI.ti,ab.
34 computer assisted.ti,ab.
35 computer aided.ti,ab.
36 neural network$.ti,ab.
37 exp diagnosis, computer‐assisted/
38 MoleMax.ti,ab.
39 image process$.ti,ab.
40 automatic classif$.ti,ab.
41 image analysis.ti,ab.
42 SIAscop$.ti,ab.
43 Aura.ti,ab.
44 (optical adj2 scan$).ti,ab.
45 MelaFind.ti,ab.
46 SIMSYS.ti,ab.
47 MoleMate.ti,ab.
48 SolarScan.ti,ab.
49 VivaScope.ti,ab.
50 (high adj3 ultraso$).ti,ab.
51 (canine adj2 detect$).ti,ab.
52 ((mobile or cell or cellular or smart) adj ((phone$1 adj2 app$1) or application$1)).ti,ab.
53 smartphone$.ti,ab.
54 (DermoScan or SkinVision or DermLink or SpotCheck).ti,ab.
55 Mole Detective.ti,ab.
56 Spot Check.ti,ab.
57 (mole$1 adj2 map$).ti,ab.
58 (total adj2 body).ti,ab.
59 exfoliative cytolog$.ti,ab.
60 digital analys$.ti,ab.
61 (image$1 adj3 software).ti,ab.
62 (teledermatolog$ or tele‐dermatolog$ or telederm or tele‐derm or teledermoscop$ or tele‐dermoscop$ or teledermatoscop$ or tele‐dermatoscop$).ti,ab.
63 (optical coherence adj (technolog$ or tomog$)).ti,ab.
64 (computer adj2 diagnos$).ti,ab.
65 exp sentinel lymph node biopsy/
66 (sentinel adj2 node).ti,ab.
67 nevisense.mp. or HFUS.ti,ab.
68 electrical impedance spectroscopy.ti,ab.
69 history taking.ti,ab.
70 patient history.ti,ab.
71 (naked eye adj (exam$ or assess$)).ti,ab.
72 (skin adj exam$).ti,ab.
73 physical examination/
74 ugly duckling.mp. or UD.ti,ab.
75 ((physician$ or clinical or physical) adj (exam$ or triage or recog$)).ti,ab.
76 ABCDE.mp. or VOC.ti,ab.
77 clinical accuracy.ti,ab.
78 Family Practice/ or Physicians, Family/ or clinical competence/
79 (confocal adj2 microscop$).ti,ab.
80 diagnostic algorithm$1.ti,ab.
81 checklist$.ti,ab.
82 virtual imag$1.ti,ab.
83 volatile organic compound$1.ti,ab.
84 dog$1.ti,ab.
85 gene expression analy$.ti,ab.
86 reflex transmission imag$.ti,ab.
87 thermal imaging.ti,ab.
88 elastography.ti,ab.
89 or/14‐88
90 (CT or PET).ti,ab.
91 PET‐CT.ti,ab.
92 (FDG or F18 or Fluorodeoxyglucose or radiopharmaceutical$).ti,ab.
93 exp Deoxyglucose/
94 deoxy‐glucose.ti,ab.
95 deoxyglucose.ti,ab.
96 CATSCAN.ti,ab.
97 exp Tomography, Emission‐Computed/
98 exp Tomography, X‐ray computed/
99 positron emission tomograph$.ti,ab.
100 exp magnetic resonance imaging/
101 (MRI or fMRI or NMRI or scintigraph$).ti,ab.
102 exp echography/
103 Doppler echography.ti,ab.
104 sonograph$.ti,ab.
105 ultraso$.ti,ab.
106 doppler.ti,ab.
107 magnetic resonance imag$.ti,ab.
108 or/90‐107
109 (stage$ or staging or metasta$ or recurrence or sensitivity or specificity or false negative$ or thickness$).ti,ab.
110 "Sensitivity and Specificity"/
111 exp cancer staging/
112 or/109‐111
113 108 and 112
114 89 or 113
115 13 and 114
Database: Ovid MEDLINE(R) In‐Process & Other Non‐Indexed Citations August 29, 2016
Search strategy:
1 basalioma$1.ti,ab.
2 ((basal cell or skin) adj2 (cancer$1 or carcinoma$1 or mass or masses or tumour$1 or tumor$1 or neoplasm$1 or adenoma$1 or epithelioma$1 or lesion$1 or malignan$ or nodule$1)).ti,ab.
3 (pigmented adj2 (lesion$1 or mole$ or nevus or nevi or naevus or naevi or skin)).ti,ab.
4 (melanom$1 or nonmelanoma$1 or non‐melanoma$1 or melanocyt$ or non‐melanocyt$ or nonmelanocyt$ or keratinocyt$).ti,ab.
5 nmsc.ti,ab.
6 (squamous cell adj2 (cancer$1 or carcinoma$1 or mass or masses or tumor$1 or tumour$1 or neoplasm$1 or adenoma$1 or epithelioma$1 or epithelial or lesion$1 or malignan$ or nodule$1) adj2 (skin or epiderm$ or cutaneous)).ti,ab.
7 (BCC or CSCC or NMSC).ti,ab.
8 keratinocy$.ti,ab.
9 or/1‐8
10 dermoscop$.ti,ab.
11 dermatoscop$.ti,ab.
12 photomicrograph$.ti,ab.
13 (epiluminescence adj2 microscop$).ti,ab.
14 (confocal adj2 microscop$).ti,ab.
15 (incident light adj2 microscop$).ti,ab.
16 (surface adj2 microscop$).ti,ab.
17 (visual adj (inspect$ or examin$)).ti,ab.
18 ((clinical or physical) adj examin$).ti,ab.
19 3 point.ti,ab.
20 three point.ti,ab.
21 pattern analys$.ti,ab.
22 ABCD$.ti,ab.
23 menzies.ti,ab.
24 7 point.ti,ab.
25 seven point.ti,ab.
26 (digital adj2 (dermoscop$ or dermatoscop$)).ti,ab.
27 artificial intelligence.ti,ab.
28 AI.ti,ab.
29 computer assisted.ti,ab.
30 computer aided.ti,ab.
31 neural network$.ti,ab.
32 MoleMax.ti,ab.
33 image process$.ti,ab.
34 automatic classif$.ti,ab.
35 image analysis.ti,ab.
36 SIAscop$.ti,ab.
37 Aura.ti,ab.
38 (optical adj2 scan$).ti,ab.
39 MelaFind.ti,ab.
40 SIMSYS.ti,ab.
41 MoleMate.ti,ab.
42 SolarScan.ti,ab.
43 VivaScope.ti,ab.
44 (high adj3 ultraso$).ti,ab.
45 (canine adj2 detect$).ti,ab.
46 ((mobile or cell or cellular or smart) adj ((phone$1 adj2 app$1) or application$1)).ti,ab.
47 smartphone$.ti,ab.
48 (DermoScan or SkinVision or DermLink or SpotCheck).ti,ab.
49 Mole Detective.ti,ab.
50 Spot Check.ti,ab.
51 (mole$1 adj2 map$).ti,ab.
52 (total adj2 body).ti,ab.
53 exfoliative cytolog$.ti,ab.
54 digital analys$.ti,ab.
55 (image$1 adj3 software).ti,ab.
56 (teledermatolog$ or tele‐dermatolog$ or telederm or tele‐derm or teledermoscop$ or tele‐dermoscop$ or teledermatoscop$ or tele‐dermatoscop$).ti,ab.
57 (optical coherence adj (technolog$ or tomog$)).ti,ab.
58 (computer adj2 diagnos$).ti,ab.
59 (sentinel adj2 node).ti,ab.
60 nevisense.mp. or HFUS.ti,ab.
61 electrical impedance spectroscopy.ti,ab.
62 history taking.ti,ab.
63 patient history.ti,ab.
64 (naked eye adj (exam$ or assess$)).ti,ab.
65 (skin adj exam$).ti,ab.
66 ugly duckling.mp. or UD.ti,ab.
67 ((physician$ or clinical or physical) adj (exam$ or triage or recog$)).ti,ab.
68 ABCDE.mp. or VOC.ti,ab.
69 clinical accuracy.ti,ab.
70 (Family adj (Practice or Physicians)).ti,ab.
71 (confocal adj2 microscop$).ti,ab.
72 clinical competence.ti,ab.
73 diagnostic algorithm$1.ti,ab.
74 checklist$.ti,ab.
75 virtual imag$1.ti,ab.
76 volatile organic compound$1.ti,ab.
77 dog$1.ti,ab.
78 gene expression analy$.ti,ab.
79 reflex transmission imag$.ti,ab.
80 thermal imaging.ti,ab.
81 elastography.ti,ab.
82 or/10‐81
83 (CT or PET).ti,ab.
84 PET‐CT.ti,ab.
85 (FDG or F18 or Fluorodeoxyglucose or radiopharmaceutical$).ti,ab.
86 deoxy‐glucose.ti,ab.
87 deoxyglucose.ti,ab.
88 CATSCAN.ti,ab.
89 positron emission tomograph$.ti,ab.
90 (MRI or fMRI or NMRI or scintigraph$).ti,ab.
91 Doppler echography.ti,ab.
92 sonograph$.ti,ab.
93 ultraso$.ti,ab.
94 doppler.ti,ab.
95 magnetic resonance imag$.ti,ab.
96 or/83‐95
97 (stage$ or staging or metasta$ or recurrence or sensitivity or specificity or false negative$ or thickness$).ti,ab.
98 96 and 97
99 82 or 98
100 9 and 99
Database: Embase 1974 to 2016 August 29
Search strategy:
1 *melanoma/
2 *skin cancer/
3 *basal cell carcinoma/
4 basalioma$.ti,ab.
5 ((basal cell or skin) adj2 (cancer$1 or carcinoma$1 or mass or masses or tumour$1 or tumor$1 or neoplasm$ or adenoma$ or epithelioma$ or lesion$ or malignan$ or nodule$)).ti,ab.
6 (pigmented adj2 (lesion$1 or mole$ or nevus or nevi or naevus or naevi or skin)).ti,ab.
7 (melanom$1 or nonmelanoma$1 or non‐melanoma$1 or melanocyt$ or non‐melanocyt$ or nonmelanocyt$ or keratinocyt$).ti,ab.
8 nmsc.ti,ab.
9 (squamous cell adj2 (cancer$1 or carcinoma$1 or mass or tumor$1 or tumour$1 or neoplasm$1 or adenoma$1 or epithelioma$1 or epithelial or lesion$1 or malignan$ or nodule$1) adj2 (skin or epiderm$ or cutaneous)).ti,ab.
10 (BCC or cscc).mp. or NMSC.ti,ab.
11 keratinocyte.ti,ab.
12 keratinocy$.ti,ab.
13 or/1‐12
14 dermoscop$.ti,ab.
15 dermatoscop$.ti,ab.
16 photomicrograph$.ti,ab.
17 *epiluminescence microscopy/
18 (epiluminescence adj2 microscop$).ti,ab.
19 (confocal adj2 microscop$).ti,ab.
20 (incident light adj2 microscop$).ti,ab.
21 (surface adj2 microscop$).ti,ab.
22 (visual adj (inspect$ or examin$)).ti,ab.
23 ((clinical or physical) adj examin$).ti,ab.
24 3 point.ti,ab.
25 three point.ti,ab.
26 pattern analys$.ti,ab.
27 ABCD$.ti,ab.
28 menzies.ti,ab.
29 7 point.ti,ab.
30 seven point.ti,ab.
31 (digital adj2 (dermoscop$ or dermatoscop$)).ti,ab.
32 artificial intelligence.ti,ab.
33 AI.ti,ab.
34 computer assisted.ti,ab.
35 computer aided.ti,ab.
36 neural network$.ti,ab.
37 MoleMax.ti,ab.
38 exp diagnosis, computer‐assisted/
39 image process$.ti,ab.
40 automatic classif$.ti,ab.
41 image analysis.ti,ab.
42 SIAscop$.ti,ab.
43 (optical adj2 scan$).ti,ab.
44 Aura.ti,ab.
45 MelaFind.ti,ab.
46 SIMSYS.ti,ab.
47 MoleMate.ti,ab.
48 SolarScan.ti,ab.
49 VivaScope.ti,ab.
50 confocal microscop$.ti,ab.
51 (high adj3 ultraso$).ti,ab.
52 (canine adj2 detect$).ti,ab.
53 ((mobile or cell$ or cellular or smart) adj ((phone$1 adj2 app$1) or application$1)).ti,ab.
54 smartphone$.ti,ab.
55 (DermoScan or SkinVision or DermLink or SpotCheck).ti,ab.
56 Spot Check.ti,ab.
57 Mole Detective.ti,ab.
58 (mole$1 adj2 map$).ti,ab.
59 (total adj2 body).ti,ab.
60 exfoliative cytolog$.ti,ab.
61 digital analys$.ti,ab.
62 (image$1 adj3 software).ti,ab.
63 (optical coherence adj (technolog$ or tomog$)).ti,ab.
64 (teledermatolog$ or tele‐dermatolog$ or telederm or tele‐derm or teledermoscop$ or tele‐dermoscop$ or teledermatoscop$).mp. or tele‐dermatoscop$.ti,ab.
65 (computer adj2 diagnos$).ti,ab.
66 *sentinel lymph node biopsy/
67 (sentinel adj2 node).ti,ab.
68 nevisense.ti,ab.
69 HFUS.ti,ab.
70 electrical impedance spectroscopy.ti,ab.
71 history taking.ti,ab.
72 patient history.ti,ab.
73 (naked eye adj (exam$ or assess$)).ti,ab.
74 (skin adj exam$).ti,ab.
75 *physical examination/
76 ugly duckling.ti,ab.
77 UD sign$.ti,ab.
78 ((physician$ or clinical or physical) adj (exam$ or recog$ or triage)).ti,ab.
79 ABCDE.ti,ab.
80 clinical accuracy.ti,ab.
81 *general practice/
82 (confocal adj2 microscop$).ti,ab.
83 clinical competence/
84 diagnostic algorithm$.ti,ab.
85 checklist$1.ti,ab.
86 virtual image$1.ti,ab.
87 volatile organic compound$1.ti,ab.
88 VOC.ti,ab.
89 dog$1.ti,ab.
90 gene expression analys$.ti,ab.
91 reflex transmission imaging.ti,ab.
92 thermal imaging.ti,ab.
93 elastography.ti,ab.
94 dog$1.ti,ab.
95 gene expression analys$.ti,ab.
96 reflex transmission imaging.ti,ab.
97 thermal imaging.ti,ab.
98 elastography.ti,ab.
99 or/14‐93
100 PET‐CT.ti,ab.
101 (CT or PET).ti,ab.
102 (FDG or F18 or Fluorodeoxyglucose or radiopharmaceutical$).ti,ab.
103 exp Deoxyglucose/
104 CATSCAN.ti,ab.
105 deoxyglucose.ti,ab.
106 deoxy‐glucose.ti,ab.
107 *positron emission tomography/
108 *computer assisted tomography/
109 positron emission tomograph$.ti,ab.
110 *nuclear magnetic resonance imaging/
111 (MRI or fMRI or NMRI or scintigraph$).ti,ab.
112 *echography/
113 Doppler.ti,ab.
114 sonograph$.ti,ab.
115 ultraso$.ti,ab.
116 magnetic resonance imag$.ti,ab.
117 or/100‐116
118 (stage$ or staging or metasta$ or recurrence or sensitivity or specificity or false negative$ or thickness$).ti,ab.
119 "Sensitivity and Specificity"/
120 *cancer staging/
121 or/118‐120
122 117 and 121
123 99 or 122
124 13 and 123
Database: Cochrane Library (Wiley) 2016 searched 30 August 2016 CDSR issue 8 of 12 2016 CENTRAL Issue 7 of 12 2016 HTA Issue 3 of 4 July 2016 DARE Issue 3 of 4 2015
Search strategy:
#1 melanoma* or nonmelanoma* or non‐melanoma* or melanocyt* or non‐melanocyt* or nonmelanocyt* or keratinocyte*
#2 MeSH descriptor: [Melanoma] explode all trees
#3 "skin cancer*"
#4 MeSH descriptor: [Skin Neoplasms] explode all trees
#5 skin near/2 (cancer* or carcinoma* or mass or masses or tumour* or tumor* or neoplasm* or adenoma* or epithelioma* or lesion* or malignan* or nodule*)
#6 nmsc
#7 "squamous cell" near/2 (cancer* or carcinoma* or mass or masses or tumour* or tumor* or neoplasm* or adenoma* or epithelioma* or lesion* or malignan* or nodule*) near/2 (skin or epiderm* or cutaneous)
#8 "basal cell" near/2 (cancer* or carcinoma* or mass or masses or tumour* or tumor* or neoplasm* or adenoma* or epithelioma* or lesion* or malignan* or nodule*)
#9 pigmented near/2 (lesion* or nevus or mole* or naevi or naevus or nevi or skin)
#10 #1 or #2 or #3 or #4 or #5 or #6 or #7 or #8 or #9
#11 dermoscop*
#12 dermatoscop*
#13 Photomicrograph*
#14 MeSH descriptor: [Dermoscopy] explode all trees
#15 confocal near/2 microscop*
#16 epiluminescence near/2 microscop*
#17 incident next light near/2 microscop*
#18 surface near/2 microscop*
#19 "visual inspect*"
#20 "visual exam*"
#21 (clinical or physical) next (exam*)
#22 "3 point"
#23 "three point"
#24 "pattern analys*"
#25 ABDC
#26 menzies
#27 "7 point"
#28 "seven point"
#29 digital near/2 (dermoscop* or dermatoscop*)
#30 "artificial intelligence"
#31 "AI"
#32 "computer assisted"
#33 "computer aided"
#34 AI
#35 "neural network*"
#36 MoleMax
#37 "computer diagnosis"
#38 "image process*"
#39 "automatic classif*"
#40 SIAscope
#41 "image analysis"
#42 "optical near/2 scan*"
#43 Aura
#44 MelaFind
#45 SIMSYS
#46 MoleMate
#47 SolarScan
#48 Vivascope
#49 "confocal microscopy"
#50 high near/3 ultraso*
#51 canine near/2 detect*
#52 Mole* near/2 map*
#53 total near/2 body
#54 mobile* or smart near/2 phone*
#55 cell next phone*
#56 smartphone*
#57 "mitotic index"
#58 DermoScan or SkinVision or DermLink or SpotCheck
#59 "Mole Detective"
#60 "Spot Check"
#61 mole* near/2 map*
#62 total near/2 body
#63 "exfoliative cytolog*"
#64 "digital analys*"
#65 image near/3 software
#66 teledermatolog* or tele‐dermatolog* or telederm or tele‐derm or teledermoscop* or tele‐dermoscop* or teledermatoscop* or tele‐dermatolog*
#67 "optical coherence" next (technolog* or tomog*)
#68 computer near/2 diagnos*
#69 sentinel near/2 node*
#70 #11 or #12 or #13 or #14 or #15 or #16 or #17 or #18 or #19 or #20 or #21 or #22 or #23 or #24 or #25 or #26 or #27 or #28 or #29 or #30 or #31 or #32 or #33 or #34 or #35 or #36 or #37 or #38 or #39 or #40 or #41 or #42 or #43 or #44 or #45 or #46 or #47 or #48 or #49 or #50 or #51 or #52 or #53 or #54 or #55 or #56 or #57 or #58 or #59 or #60 or #61 or #62 or #63 or #64 or #65 or #66 or #67 or #68 or #69
#71 ultraso*
#72 sonograph*
#73 MeSH descriptor: [Ultrasonography] explode all trees
#74 Doppler
#75 CT or PET or PET‐CT
#76 "CAT SCAN" or "CATSCAN"
#77 MeSH descriptor: [Positron‐Emission Tomography] explode all trees
#78 MeSH descriptor: [Tomography, X‐Ray Computed] explode all trees
#79 MRI
#80 MeSH descriptor: [Magnetic Resonance Imaging] explode all trees
#81 MRI or fMRI or NMRI or scintigraph*
#82 "magnetic resonance imag*"
#83 MeSH descriptor: [Deoxyglucose] explode all trees
#84 deoxyglucose or deoxy‐glucose
#85 "positron emission tomograph*"
#86 #71 or #72 or #73 or #74 or #75 or #76 or #77 or #78 or #79 or #80 or #81 or #82 or #83 or #84 or #85
#87 stage* or staging or metasta* or recurrence or sensitivity or specificity or "false negative*" or thickness*
#88 MeSH descriptor: [Neoplasm Staging] explode all trees
#89 #87 or #88
#90 #89 and #86
#91 #70 or #90
#92 #10 and #91
#93 BCC or CSCC or NMCS
#94 keratinocy*
#95 #93 or #94
#96 #10 or #95
#97 nevisense
#98 HFUS
#99 "electrical impedance spectroscopy"
#100 "history taking"
#101 "patient history"
#102 naked next eye near/1 (exam* or assess*)
#103 skin next exam*
#104 "ugly duckling" or (UD sign*)
#105 MeSH descriptor: [Physical Examination] explode all trees
#106 (physician* or clinical or physical) near/1 (exam* or recog* or triage*)
#107 ABCDE
#108 "clinical accuracy"
#109 MeSH descriptor: [General Practice] explode all trees
#110 confocal near microscop*
#111 "diagnostic algorithm*"
#112 MeSH descriptor: [Clinical Competence] explode all trees
#113 checklist*
#114 "virtual image*"
#115 "volatile organic compound*"
#116 dog or dogs
#117 VOC
#118 "gene expression analys*"
#119 "reflex transmission imaging"
#120 "thermal imaging"
#121 elastography
#122 #97 or #98 or #99 or #100 or #101 or #102 or #103 or #104 or #105 or #106 or #107 or #108 or #109 or #110 or #111 or #112 or #113 or #114 or #115 or #116 or #117 or #118 or #119 or #120 or #121
#123 #70 or #122
#124 #96 and #123
#125 #96 and #90
#126 #125 or #124
#127 #10 and #126
Database: CINAHL Plus (EBSCO) 1937 to 30 August 2016
Search strategy:
S1 (MH "Melanoma") OR (MH "Nevi and Melanomas+")
S2 (MH "Skin Neoplasms+")
S3 (MH "Carcinoma, Basal Cell+")
S4 basalioma*
S5 (basal cell) N2 (cancer* or carcinoma* or mass or masses or tumor* or tumour* or neoplasm* or adenoma* or epithelioma* or lesion* or malignan* or nodule*)
S6 (pigmented) N2 (lesion* or mole* or nevus or nevi or naevus or naevi or skin)
S7 melanom* or nonmelanoma* or non‐melanoma* or melanocyt* or non‐melanocyt* or nonmelanocyt*
S8 nmsc
S9 TX BCC or cscc or NMSC
S10 (MH "Keratinocytes")
S11 keratinocyt*
S12 S1 OR S2 OR S3 OR S4 OR S5 OR S6 OR S7 OR S8 OR S9 OR S10 OR S11
S13 dermoscop* or dermatoscop* or photomicrograph* or (3 point) or (three point) or ABCD* or menzies or (7 point) or (seven point) or AI or Molemax or SIASCOP* or Aura or MelaFind or SIMSYS or MoleMate or SolarScan or smartphone* or DermoScan or SkinVision or DermLink or SpotCheck
S14 (epiluminescence or confocal or incident or surface) N2 (microscop*)
S15 visual N1 (inspect* or examin*)
S16 (clinical or physical) N1 (examin*)
S17 pattern analys*
S18 (digital) N2 (dermoscop* or dermatoscop*)
S19 (artificial intelligence)
S20 (computer) N2 (assisted or aided)
S21 (neural network*)
S22 (MH "Diagnosis, Computer Assisted+")
S23 (image process*)
S24 (automatic classif*)
S25 (image analysis)
S26 SIAScop*
S27 (optical) N2 (scan*)
S28 (high) N3 (ultraso*)
S29 elastography
S30 (mobile or cell or cellular or smart) N2 (phone*) N2 (app or application*)
S31 (mole*) N2 (map*)
S32 total N2 body
S33 exfoliative cytolog*
S34 digital analys*
S35 image N3 software
S36 teledermatolog* or tele‐dermatolog* or telederm or tele‐derm or teledermoscop* or tele‐dermoscop* or teledermatoscop* or tele‐dermatoscop* teledermatolog* or tele‐dermatolog* or telederm or tele‐derm or teledermoscop*
S37 (optical coherence) N1 (technolog* or tomog*)
S38 computer N2 diagnos*
S39 sentinel N2 node
S40 (MH "Sentinel Lymph Node Biopsy")
S41 nevisense or HFUS or checklist* or VOC or dog*
S42 electrical impedance spectroscopy
S43 history taking
S44 "Patient history"
S45 naked eye
S46 skin exam*
S47 physical exam*
S48 ugly duckling
S49 UD sign*
S50 (physician* or clinical or physical) N1 (exam*)
S51 clinical accuracy
S52 general practice
S53 (physician* or clinical or physical) N1 (recog* or triage)
S54 confocal microscop*
S55 clinical competence
S56 diagnostic algorithm*
S57 checklist*
S58 virtual image*
S59 volatile organic compound*
S60 gene expression analys*
S61 reflex transmission imag*
S62 thermal imaging
S63 S13 or S14 or S15 OR S16 OR S17 OR S18 OR S19 OR S20 OR S21 OR S22 OR S23 OR S24 OR S25 OR S26 OR S27 OR S28 OR S29 OR S30 OR S31 OR S32 OR S33 OR S34 OR S35 OR S36 OR S37 OR S38 OR S39 OR S40 OR S41 OR S42 OR S43 OR S44 OR S45 OR S46 OR S47 OR S48 OR S49 OR S50 OR S51 OR S52 OR S53 OR S54 OR S55 OR S56 OR S57 OR S58 OR S59 OR S60 OR S61 OR S62
S64 CT or PET
S65 PET‐CT
S66 FDG or F18 or Fluorodeoxyglucose or radiopharmaceutical*
S67 (MH "Deoxyglucose+")
S68 deoxy‐glucose or deoxyglucose
S69 CATSCAN
S70 CAT‐SCAN
S71 (MH "Deoxyglucose+")
S72 (MH "Tomography, Emission‐Computed+")
S73 (MH "Tomography, X‐Ray Computed")
S74 positron emission tomograph*
S75 (MH "Magnetic Resonance Imaging+")
S76 MRI or fMRI or NMRI or scintigraph*
S77 echography
S78 doppler
S79 sonograph*
S80 ultraso*
S81 magnetic resonance imag*
S82 S64 OR S65 OR S66 OR S67 OR S68 OR S69 OR S70 OR S71 OR S72 OR S73 OR S74 OR S75 OR S76 OR S77 OR S78 OR S79 OR S80 OR S81
S83 stage* or staging or metasta* or recurrence or sensitivity or specificity or (false negative*) or thickness
S84 (MH "Neoplasm Staging")
S85 S83 OR S84
S86 S82 AND S85
S87 S63 OR S86
S88 S12 AND S87
Database: Science Citation Index SCI Expanded (Web of Science) 1900 to 30 August 2016
Conference Proceedings Citation Index (Web of Science) 1900 to 1 September 2016
Search strategy:
#1 (melanom* or nonmelanom* or non‐melanoma* or melanocyt* or non‐melanocyt* or nonmelanocyt* or keratinocyt*)
#2 (basalioma*)
#3 ((skin) near/2 (cancer* or carcinoma or mass or masses or tumour* or tumor* or neoplasm* or adenoma* or epithelioma* or lesion* or malignan* or nodule*))
#4 ((basal) near/2 (cancer* or carcinoma* or mass or masses or tumour* or tumor* or neoplasm* or adenoma* or epithelioma* or lesion* or malignan* or nodule*))
#5 ((pigmented) near/2 (lesion* or mole* or nevus or nevi or naevus or naevi or skin))
#6 (nmsc or BCC or NMSC or keratinocy*)
#7 ((squamous cell (cancer* or carcinoma* or mass or masses or tumour* or tumor* or neoplasm* or adenoma* or epithelioma* or lesion* or malignan* or nodule*))
#8 (skin or epiderm* or cutaneous)
#9 #8 AND #7
#10 #9 OR #6 OR #5 OR #4 OR #3 OR #2 OR #1
#11 ((dermoscop* or dermatoscop* or photomicrograph* or epiluminescence or confocal or "incident light" or "surface microscop*" or "visual inspect*" or "physical exam*" or 3 point or three point or pattern analy* or ABCDE or menzies or 7 point or seven point or dermoscop* or dermatoscop* or AI or artificial or computer aided or computer assisted or neural network* or Molemax or image process* or automatic classif* or image analysis or siascope or optical scan* or Aura or melafind or simsys or molemate or solarscan or vivascope or confocal microscop* or high ultraso* or canine detect* or cellphone* or mobile* or phone* or smartphone or dermoscan or skinvision or dermlink or spotcheck or spot check or mole detective or mole map* or total body or exfoliative psychology or digital or image software or optical coherence or teledermatology or telederm* or teledermoscop* or teledermatoscop* or computer diagnos* or sentinel))
#12 ((nevisense or HFUS or impedance spectroscopy or history taking or patient history or naked eye or skin exam* or physical exam* or ugly duckling or UD sign* or physician* exam* or physical exam* or ABCDE or clinical accuracy or general practice or confocal microscop* or clinical competence or diagnostic algorithm* or checklist* or virtual image* or volatile organic or VOC or dog* or gene expression or reflex transmission or thermal imag* or elastography))
#13 #11 or #12
#14 ((PET or CT or FDG or deoxyglucose or deoxy‐glucose or fluorodeoxy* or radiopharma* or CATSCAN or positron emission or computer assisted or nuclear magnetic or MRI or FMRI or NMRI or scintigraph* or echograph* or Doppler or sonograph* or ultraso* or magnetic reson*))
#15 ((stage* or staging or metast* or recurrence or sensitivity or specificity or false negative* or thickness*))
#16 #14 AND #15
#17 #16 OR #13
#18 #10 AND #17
Refined by: DOCUMENT TYPES: (MEETING ABSTRACT OR PROCEEDINGS PAPER)
Appendix 6. Full text inclusion criteria
| Criterion | Inclusion | Exclusion |
| Study design | For diagnostic and staging reviews
|
|
| Target condition |
|
|
| Population | For diagnostic reviews
For staging reviews
|
|
| Index tests | For diagnosis
For staging
Any test combination and in any order Any test positivity threshold Any variation in testing procedure (e.g. radioisotope used) |
|
| Reference standard | For diagnostic studies
For studies of imaging tests for staging: Histopathology (via LND or SLMB) Clinical/radiological follow‐up A combination of the above For studies of SLNB accuracy for staging : LND of both SLN+ and SLn participants to identify all diseased nodes LND of SLN+ participants and follow‐up of SLN participants to identify a subsequent nodal recurrence in a previously investigated nodal basin | For diagnostic studies
|
| BCC: basal cell carcinoma; cSCC: cutaneous squamous cell carcinoma; CT: computed tomography; FNAC: fine needle aspiration cytology; LND: lymph node dissection; MRI: magnetic resonance imaging; PET: positron emission tomography; PET‐CT: positron emission tomography‐computed tomography; RCT: randomised controlled trial; SCC: squamous cell carcinoma; SLN+: positive sentinel lymph node; SLn: negative sentinel lymph node; SLNB: sentinel lymph node biopsy. | ||
Appendix 7. QUADAS interpretation
| Item | Response (delete as required) |
| PARTICIPANT SELECTION (1) ‐ RISK OF BIAS | |
| 1) Was a consecutive or random sample of participants or images enrolled? | Yes ‐ if paper states consecutive or random No – if paper describes other method of sampling Unclear – if participant sampling not described |
| 2) Was a case‐control design avoided? | Yes ‐ if consecutive or random or case‐control design clearly not used No – if study described as case‐control or describes sampling specific numbers of participants with particular diagnoses Unclear – if not described |
| 3) Did the study avoid inappropriate exclusions both for melanoma and for cutaneous squamous cell carcinoma (cSCC) staging? | Yes ‐ if inappropriate exclusions were avoided No – if lesions were excluded that might affect test accuracy, e.g. indeterminate results or where disagreement between evaluators was observed Unclear – if not clearly reported |
| 4) For between‐person comparative (BPC) studies only (i.e. allocating different tests to different study participants such as randomised controlled trials (RCTs)): | |
|
| Yes ‐ if same selection criteria were used for each index test No – if different selection criteria were used for each index test Unclear – if selection criteria per test were not described N/A – if only 1 index test was evaluated or all participants received all tests |
|
| Yes ‐ if adequate randomisation procedures are described No – if inadequate randomisation procedures are described Unclear – if the method of allocation to groups is not described (a description of ‘random’ or ‘randomised’ is insufficient) N/A – if only 1 index test was evaluated or all participants received all tests |
|
| Yes ‐ if appropriate methods of allocation concealment are described No – if appropriate methods of allocation concealment are not described Unclear – if the method of allocation concealment is not described (sufficient detail to allow a definite judgement is required) N/A – if only 1 index test was evaluated |
| Could the selection of participants have introduced bias? | |
| v FOR NON‐COMPARATIVE (NC) STUDIES | |
| If answers to all of questions 1) and 2) and 3) was ‘Yes’: | Risk is Low |
| If answers to any one of questions 1) or 2) or 3) was ‘No’: | Risk is High |
| If answers to any one of questions 1) or 2) or 3) was ‘Unclear’: | Risk Unclear |
| v FOR BETWEEN‐PERSON COMPARATIVE STUDIES | |
| If answers to all of questions 1) and 2) and 3) and 4) was ‘Yes’: | Risk is Low |
| If answers to any one of questions 1) or 2) or 3) or 4) was ‘No’: | Risk is High |
| If answers to any one of questions 1) or 2) or 3) or 4) was ‘Unclear’: | Risk Unclear |
| PARTICIPANT SELECTION (1) ‐ CONCERNS REGARDING APPLICABILITY | |
| For sentinel lymph node biopsy and imaging tests: | |
| 1) Does the study report results for participants unselected by stage of disease or site of primary lesion, i.e. the study does not focus solely on those with a particular stage of disease such as American Joint Committee on Cancer (AJCC) stage I or melanoma ≤ 1 mm in thickness? | Yes ‐ if an unrestricted group of participants have been included No ‐ if a selected group of study participants have been included, e.g. those with clinical stage I disease or only those with thin melanoma Unclear – if insufficient details are provided to determine the spectrum of included participants |
| 2) Did the study report data on a per patient rather than per lesion basis? | Yes – if a per patient analysis was reported No – if a per lesion analysis only was reported Unclear – if it is not possible to assess whether data are presented on a per patient or per lesion basis |
| For imaging tests only: | |
| 3) Does the study focus primarily on participants undergoing primary staging or those undergoing staging for disease recurrence? | Yes ‐ if at least 80% of study participants are undergoing primary staging following diagnosis of a primary cutaneous melanoma or staging of recurrence No ‐ if less than 80% of study participants are undergoing primary staging following diagnosis of a cutaneous melanoma or staging of recurrence Unclear – if insufficient details are provided to determine the proportion of patients undergoing primary staging vs those undergoing staging of recurrence |
| Is there concern that the included participants do not match the review question? | |
| If the answer to question 1) or 2) (and 3)) was ‘Yes’: | Concern is Low |
| If the answer to question 1) or 2) (and 3)) was ‘No’: | Concern is High |
| If the answer to question 1) or 2) (and 3)) was ‘Unclear’: | Concern is Unclear |
| INDEX TEST (2) ‐ RISK OF BIAS (to be completed per test evaluated) | |
| 1) Was the index test or testing strategy result interpreted without knowledge of the results of the reference standard? | Yes ‐ if index test described as interpreted without knowledge of reference standard result, or for prospective studies, if index test is always conducted and interpreted before the reference standard No – if index test described as interpreted in knowledge of reference standard result Unclear – if index test blinding is not described |
| 2) Was the diagnostic threshold at which the test was considered positive prespecified? | Yes ‐ if threshold was prespecified (i.e. before analysing study results) No ‐ if threshold was not prespecified Unclear ‐ if not possible to tell whether or not diagnostic threshold was prespecified |
| For imaging tests only: | |
| 3) For studies reporting the accuracy of multiple diagnostic thresholds (tumour characteristic or parameter) for the same index test, was each threshold interpreted without knowledge of the results of the others? | Yes ‐ if thresholds were selected prospectively and each was interpreted by a different reader, or if study implements a retrospective (or no) cutoff No ‐ if study uses prospective threshold and report states reported by same reader Unclear ‐ if no mention of number of readers for each threshold or if prespecification of threshold not reported N/A ‐ multiple diagnostic thresholds not reported for the same index test |
| 4) For within‐person comparison (WPC) of index tests or testing strategies (i.e. > 1 index test applied per participant), was each index test result interpreted without knowledge of the results of other index tests or testing strategies? | Yes ‐ if all index tests were described as interpreted without knowledge of the results of the others No ‐ if the index tests were described as interpreted in the knowledge of the results of the others Unclear – if it is not possible to tell whether knowledge of other index tests could have influenced test interpretation N/A – if only 1 index test was evaluated |
| Could the conduct or interpretation of the index test have introduced bias? | |
| v FOR NC and BPC STUDIES item 3) / 4) to be added | |
| If answers to questions 1) and 2) was ‘Yes’: | Risk is Low |
| If answers to either questions 1) or 2) was ‘No’: | Risk is High |
| If answers to either questions 1) or 2) was ‘Unclear’: | Risk is Unclear |
| v FOR WPC STUDIES | |
| If answers to all questions 1), 2) for any index test and 3) was ‘Yes’: | Risk is Low |
| If answers to any one of questions 1) or 2) for any index test or 3) was ‘No’: | Risk is High |
| If answers to any one of questions 1) or 2) for any index test or 3) was ‘Unclear’: | Risk is Unclear |
| INDEX TEST (2) ‐ CONCERN ABOUT APPLICABILITY | |
| 1) Were thresholds or criteria for diagnosis reported in sufficient detail to allow replication? This item applies equally to studies using objective and more subjective approaches to test interpretation. For sentinel lymph node biopsy (SLNB) studies, this requires description of the tracer threshold for identification of the SLN and the histological assessment. | Yes – if the criteria for diagnosis of the target disorder were reported in sufficient detail to allow replication No – if the criteria for diagnosis of the target disorder were not reported in sufficient detail to allow replication Unclear – if some but not sufficient information on criteria for diagnosis to allow replication were provided |
| 2) Was the test interpretation carried out by an experienced examiner? | Yes – if the test was interpreted by an experienced examiner as defined in the review protocol No – if the test was not interpreted by an experienced examiner (see above) Unclear – if the experience of the examiner(s) was not reported in sufficient detail to judge or if examiners described as 'Expert' with no further detail given |
| Is there concern that the index test, its conduct, or interpretation differ from the review question? | |
| If answers to questions 1) and 2) was ‘Yes’: | Concern is Low |
| If answers to questions 1) or 2) was ‘No’: | Concern is High |
| If answers to questions 1) or 2) was ‘Unclear’: | Concern is Unclear |
| REFERENCE STANDARD (3) ‐ RISK OF BIAS | |
| 1) Is the reference standard likely to correctly classify the target condition? | |
| a) DISEASE POSITIVE ‐ 1 or more of: ‐ Histological confirmation of metastases following lymph node dissection (or SLNB or core biopsy for imaging studies) ‐ Clinical/radiological follow‐up to identify clinically detectable disease in a mapped nodal basin (SLNB studies) ‐ Clinical/radiological follow‐up to identify any metastases (imaging studies) subsequently confirmed on histology | Yes – if all disease positive participants underwent 1 of the listed reference standards No – if a final diagnosis for any disease positive participant was reached without histopathology Unclear – if the method of final diagnosis was not reported for any disease positive participant |
| b) DISEASE NEGATIVE ‐ 1 or more of: ‐ Histological confirmation of absence of disease in a mapped nodal basin following lymph node dissection (or following SLNB for imaging studies) ‐ Clinical/radiological follow‐up of test negative participants | Yes – if at least 90% of disease negative participants underwent 1 of the listed reference standards No – if more than 10% of benign diagnoses were reached by concurrent imaging test Unclear – if the method of final diagnosis was not reported for any participant with benign or disease negative diagnosis |
| 2) Were the histology‐based reference standard results interpreted without knowledge of the results of the index test? | Yes – if the histopathologist was described as blinded to the index test result No – if the histopathologist was described as having knowledge of the index test result Unclear – if blinded histology interpretation was not clearly reported |
| 3) Were the reference standard results based on patient follow‐up interpreted without knowledge of the results of the index test? | Yes – if the clinician or radiologist was described as blinded to the index test result No – if the clinician or radiologist was described as having knowledge of the index test result Unclear – if blinded interpretation was not clearly reported |
| Could the reference standard, its conduct, or its interpretation have introduced bias? | |
| If answers to questions 1) and 2) and 3) was ‘Yes’: | Risk is Low |
| If answers to questions 1) or 2) or 3) was ‘No’: | Risk is High |
| If answers to questions 1) or 2) or 3) was ‘Unclear’: | Risk is Unclear |
| REFERENCE STANDARD (3) ‐ CONCERN ABOUT APPLICABILITY | |
| 1) Does the study use the same definition of disease positive as the primary review question, or is it possible to fully disaggregate data such that data matching the review question can be extracted? | Yes – same definition of disease positive used, or patients can be disaggregated and re‐grouped according to review definition No – some patients cannot be disaggregated For SLNB review – disease positive includes participants with any nodal recurrence (not restricted to clinical recurrence in same nodal basin) For imaging reviews – participants with nodal vs distant recurrences cannot be disaggregated Unclear – definition of disease positive not clearly reported |
| For studies of imaging tests: | |
| 2) The result of another imaging test (without patient follow‐up to determine later emergence of disease) was not used as a reference standard | Yes – if imaging‐based diagnosis was not used as a reference standard for any participant No – if imaging‐based diagnosis was used as a reference standard for any participant Unclear – if not clearly reported |
| 3) Item on observer experience could be included? Is there concern that the target condition as defined by the reference standard does not match the review question? | |
| If answers to all questions 1), 2) and 3) was ‘Yes’: | Concern is Low |
| If answers to any one of questions 1) or 2) or 3) was ‘No’: | Concern is High |
| If answers to any one of questions 1) or 2) or 3) was ‘Unclear’: | Concern is Unclear |
| ***For teledermatology studies only: | |
| If answers to questions 1) and 3) was ‘Yes’: | Concern is Low |
| If answers to questions 1) or 3) was ‘No’: | Concern is High |
| If answers to questions 1) or 3) was ‘Unclear’: | Concern is Unclear |
| FLOW AND TIMING (4): RISK OF BIAS | |
| 1) Was there an appropriate interval between index test and reference standard? | |
|
| Yes – if study reports ≤ 1 month between index and histological reference standard No – if study reports > 1 month between index and histological reference standard Unclear – if study does not report interval between index and histological reference standard |
|
| Yes – if study reports a follow‐up visit within 6 months of application of the index test No – if study reports the first follow‐up visit beyond 6 months of the index test Unclear – if study does not report timing of follow‐up visits |
| 2) Did all participants receive the same reference standard? | Yes – if all participants underwent the same reference standard No – if more than 1 reference standard was used Unclear – if not clearly reported |
| 3) Were all participants included in the analysis? | Yes – if all participants were included in the analysis No – if some participants were excluded from the analysis Unclear – if not clearly reported |
| 4) For WITHIN‐PERSON COMPARISON (WPC) of index tests: Was the interval between application of index tests ≤ 1 month? Could the participant flow have introduced bias? | Yes – if study reports ≤ 1 month between index tests No – if study reports > 1 month between index tests Unclear – if study does not report interval between index tests |
| v FOR NON‐COMPARATIVE and BPC STUDIES | |
| If answers to questions 1) and 2) and 3) was ‘Yes’: | Risk is Low |
| If answers to any one of questions 1) or 2) or 3) was ‘No’: | Risk is High |
| If answers to any one of questions 1) or 2) or 3) was ‘Unclear’: | Risk is Unclear |
| v FOR WITHIN‐PERSON COMPARATIVE STUDIES (WPCs) | |
| If answers to all questions 1), 2), 3), and 4) was ‘Yes’: | Risk is Low |
| If answers to any one of questions 1), 2), 3), or 4) was ‘No’: | Risk is High |
| If answers to any one of questions 1), 2), 3), or 4) was ‘Unclear’: | Risk is Unclear |
Appendix 8. Summary characteristics of studies for pre‐SLNB imaging
| Study | Study design | Presentation | Age, gender, site, BT, Clark | Index test | Threshold | Reference Exclusions |
| USA Patients: 56 | NC | Primary (pre‐SLNB) | Mean age: 67; Median age: NR; Range: 26 to 89 years Site: trunk 16, 29%; extremities 28, 50%; HN 12, 21% | PET‐CT. 2D or 3D; CT (U, helical, low dose) | SUV of 2.5 | Histology (54, 96% (48 SLNB and 6 LND)) Exclusions: n = 0; N/A |
| USA Patients: 325 | NC | Primary (pre‐SLNB) | Mean age: NR; Median age: 58; Range: 18 to 86 Site: HN 34 (10.5%) | US. B‐mode; linear array (9 or 12 MHz); US before LS Contrast: N/A | US ‐ classed as ‘‘abnormal,’’ ‘‘suspicious,’’ or ‘‘indeterminate | Histology (325, 100%) Exclusions: n = 8; 1 draining basin identified by LS was not examined with US; plus 7 SLN positive who did not get US |
| Hafner 2004 | WPC | Primary (pre‐SLNB) | Median age: 55; Range: 18 to 79 Site: limbs 49, 49%, trunk 35, 35%, HN 16, 16% | US. B‐mode (5 Mhz); US before LS | NR; 'radiologically suspect' | Histology (100; 100%) Exclusions: n = 4; 1 sentinel node was not found intraoperatively; 3 clinically node positive excluded by Bham team |
| Hinz 2013 Patients: 20 | WPC Data: per pt | Primary (pre‐SLNB) | Mean age: full sample: 55.2; Median age: NR; Range: Full sample: SD 13.3 years | PET‐CT. 2D/3D NR; CE‐CT, helical. Reinhardt 2006 states helical, dual detector (N/A) US. B‐mode (6.0‐ to 11.0‐MHz linear transducer); US pre‐ and post‐LS | PET‐CT: NR US: morphology criteria (Solbiati 1988; Vassalo 1992; Voit 2010d); suspicious LNs were re‐examined with US after LS | Histology (20 (100%)) Exclusions: n = 0 |
| Hinz 2011 | NC | Primary (pre‐SLNB) (? 1 secondary nodular SSM) | Mean age: 52.8; Median age: NR; Range: SD 15.4; node positive given (36 to 62) | US. B‐mode (linear array); Doppler (6.0 to 11.0 MHz linear transducer); US pre‐ and post‐LS | Positive radiological findings according to published criteria | Histology (1) Exclusions: n = 0 |
| Hocevar 2004 Patients: 57 | WPC Data: per pt | Primary (pre‐SLNB) | Mean age: NR; Median age: NR; Range: 1 to 93 | US. B‐mode; linear array transducer with small parts probe (12 and 15 MHz); US before LS US + FNAC for those positive on US | Rounded appearance of the LN, Ioss of the hilar echogenic reflex, and deformed radial nodal vascularity | Histology (CLND; SLNB) Exclusions: n = 0 |
| Kell 2007 Patients: 37 | NC | Primary (pre‐SLNB) | Mean age: 61.4 years; Median age: NR; Range: NR | PET‐CT. 2D/3D NR; CT (U) | Quantitative for areas of abnormally increased 18FDG uptake | Histology (37, 100%) Exclusions: n = 0; 46 with SLNB but no PET‐CT could not be included |
| Klode 2010 | NC | Primary (pre‐SLNB) | Mean age: 58.8; Median age: 61; Range: 31 to 82 | PET‐CT. 2D/3D NR; CE‐CT | NR; hypermetabolic tumour focus | Histology (61, 100%) Exclusions: n = 0; 60 patients with SLNB did not agree to pre‐op PET |
| Kunte 2009 | NC Data: per SLN | Primary (pre‐SLNB) (NR). | Mean age: 54; Median age: NR; Range: NR | US. B‐mode; linear transducer (7.5 to 10MHz); US pre‐ and post‐LS | Qualitative presence of morphological features (described) | Histology (51% n = 35) Exclusions: n = NR |
| Maubec 2007 Primary lesions: 26 | NC Data: per pt | Primary (pre‐SLNB) | Mean age: 60; Range: 14 to 87 | PET‐CT. 3D; CT (U) | Uptake site suspicious for malignancy or not clearly explained by a benign etiology (SUV estimated but does not appear to formally contribute to diagnosis) | Histology (22, 88%; 3 node positive underwent CLND; 19 had SLNB; 3 no surgery) Exclusions: n = 6; 3 clinically N+ underwent CLND (all PET+ and N+); 3 did not undergo any surgery |
| Radzhabova 2009 Patients: 152 | NC | Primary (pre‐SLNB) | Mean age: NR; Median age: NR; Range: NR | US. B‐mode; sectoral and linear (7 to 10 MHz); pre‐LS | High PSV, EDV, Stuart index, and PI < 1000. Mets could not be excluded if PSV and PI were high but EDV = 0, Stuart index was undetectable (PI = pulse index, PSV = peak systolic volume, EDV = end‐diastolic volume, Stuart index) | Histology (52, 100%) Exclusions: n = 100; benign on US did not get SLNB |
| Revel 2010 Patients: 22 | WPC | Primary (pre‐SLNB) | Mean age: 60. Range: 18 to 88 | PET‐CT. 2D/3D NR | Any hypermetabolic focus more intense than the surrounding background, including equivocal foci, compared with the corresponding anatomical structure on coupled CT Info provided: localisation of the initial tumour and the standard clinical and radiological assessment were known | Histology (22, 100%) FNAC (N/A) FU (22/22, 100%): mean 17 months (range 1 to 44)^ Histology interval: 12 days FU interval: NR Exclusions: n = 2; 2 test fails (no SN detected) |
| Sanki 2009 | NC Data: per pt | Primary (pre‐SLNB) | Mean age: NR; Median age: NR; Range: NR | US. B‐mode US; linear array transducer with high‐resolution small‐parts probe 5 to 10 MHz (linear transducer); 10 to 14 MHz (small parts probe); LS before US | Re‐classification of original report as suspicious, or highly probable, e.g. increased vascular signature, rounding of the normal ovoid shape of the nodes, loss of normal hilar echoes, presence of focal low‐level subcapsular space echoes | Histology (716, 100%) Exclusions: n = 0 |
| Sibon 2007 | NC Retrospective (prospective database reported; plus prospective re‐interpretation of US images) | Primary (pre‐SLNB) | Mean age: 56; Range: 17 to 92 years Clark’s level II 8, 6%; III 30, 23%; IV 88, 66%, V 7, 5%; unknown 1, 1% | US. B‐mode; linear transducer (6 to 12 MHz); US before LS | Stringent criteria: circular/oval hypoechoic lymph node with a Solbiati index < 1.5 and no hyperechoic hilum; Non‐stringent criteria included the presence of 1 or 2 stringent criteria | Histology (131, 100%) Exclusions: n = 0; |
| Singh 2008 | NC > 4 mm BT: 7/12 = 58% ≤ 4 mm BT: 7/40 = 18% | Primary (pre‐SLNB) | Mean age: 55; Median age: 61; Range: 17 to 76 | PET‐CT. Helical, CT (CE, dual detector) | Any focal uptake more than background unless it was found to be a false positive focus (physiological accumulation or brown fat tissue) in fusion imaging | Histology (52, 100%) Exclusions: n = 0; |
| van Rijk 2006 | WPC | Primary (pre‐SLNB) | Mean age: 50; Range: 15 to 52 | US. B‐mode linear array (7.5 MHz; 6 to 12 MHz); US before LS US + FNAC for US positive | Suspicious ‐ length–depth ratio < 2, conversion of a fatty hilum to a hypoechoic hilum, substantial cortical asymmetry or a focal area of low‐level echoes in the subcapsular sinus of the node and diameter > 5 mm for LN of the neck | Histology (107, 100%) Exclusions: n = 0; |
| Voit 2014 | WPC | Primary (pre‐SLNB) | Mean age: 59; Median age: 62; Range: 15 to 94 | US. B‐mode & Doppler (1 to 18 MHz); LS before US US + FNAC for US positive | Malignant if total loss of central echoes (LCE) or LN enlarged and balloon shaped (BS); suspicious if peripheral perfusion present or central echo wandering towards the rim | Histology (1000, 100%) Exclusions: n = 0 |
| Wagner 2012 | NC | Primary (pre‐SLNB) | Mean age: NR; Median age: NR; Range: NR | PET‐CT. 2D; CT (NR) | Abnormally increased 18FDG uptake in a lymph node in the drainage territory of the melanoma | Histology (43, 89.6%; 2 CLND only, 1 SLNB + CLND, 40 SLNB only) Exclusions: n = 5; SLNB not performed for technical reasons |
| +: positive; AJCC: American Joint Cancer Committee; AWOSEM: attenuation weighted ordered subsets expectation maximisation; BT: Breslow thickness; CE: contrast enhanced; CLND: complete lymph node dissection; CT: computed tomography; 2D: two‐dimensional; 3D: three‐dimensional; EDV: end‐diastolic volume; 18FDG: 2‐deoxy‐2‐[18F]fluoro‐D‐glucose; FNAC: fine needle aspiration cytology; FORE: Fourier rebinning; FU: follow‐up; HN: head and neck; LN: lymph node; LNB: lymph node basin; LND: lymph node dissection; LS: lymphoscintigraphy; mA: measure of tube current; mets: metastases; MM: malignant melanoma; NC: non‐comparative; OSEM: ordered subsets expectation maximisation algorithm; PET: positron emission tomography; PI: pulse index; PSV: peak systolic volume; prosp: prospective; RF: risk factor; SD: standard deviation; SLN: sentinel lymph node; SLNB: sentinel lymph node biopsy; SSM: superficial spreading melanoma; SUV: standardised uptake value; U: unenhanced; US: ultrasound; WB: whole body. | ||||||
Appendix 9. Characteristics of studies of whole body imaging by population group (primary staging, re‐staging, and mixed or unclear populations)
| Study | Study design | Presentation | Age, gender, site, BT, Clark | Index test | Threshold | Reference Exclusions Other result |
| PRIMARY STAGING OF DISEASE | ||||||
| Arrangoiz 2012 | NC Data: per pt Nodal: 29/56 = 52% Distant mets : 5/56 = 9% | Primary (N/A) | Mean age: 67; Median age: NR; Range: 26 to 89 Site: trunk 16, 29%; extremities 28, 50%; head and neck 12, 21% | PET‐CT. 2D or 3D; CT (U, helical, low dose) | SUV of 2.5 | Histology (54, 96% (48 SNB and 6 LND)) Exclusions: n = 0; N/A |
| Switzerland | WPC Data: per pt | Primary (N/A). | Mean age: NR; Median age: 55; Range: 18 to 79 Site: limbs 49, 49%, trunk 35, 35%, HN 16, 16% | US. B‐mode (5 Mhz); US before LS | NR; 'radiologically suspect' | Histology (100; 100%) Exclusions: n = 1; sentinel node was not found intraoperatively No confirmed distant mets detected at time of imaging; 9 patients with suspicious findings on imaging were negative for progression/recurrence at 12 months |
| S Korea | NC Data: per pt | Primary (N/A) | Mean age: 61.7 years; Median age: NR; Range: 48.1 to 75.3; ± 13.6 years Site: hand/foot 23 (62.1%), trunk 6 (16.2), head/neck 4 (10.8%), extremity 4 (10.8%) | PET‐CT. CT (U, 6 slice or 16 slice) (N/A) | SUVmax ≥ 2.2 Info provided: NR | Histology (6 (16.2%)) Exclusions: n = 0 |
| France | WPC Data: per pt | Primary (N/A). | Mean age: 60; Range: 14 to 87 | PET‐CT. 3D; CT (U) | Uptake site suspicious for malignancy or not clearly explained by a benign etiology (SUV estimated but does not appear to formally contribute to diagnosis) Info provided: NR | Histology (22, 88%; 3 node positive underwent CLND; 19 had SLNB; 3 no surgery) Exclusions: n = 0; all recruited pts can be included in analysis for any mets. 3 PET +ve for distant mets (1 orbital, 1 thyroid, 1 liver) |
| Austria | WPC Data: per pt | Primary | Mean age: 56; Median age: NR; Range: 25 to 82 Site: HN 42, 19%; arm 61, 28%; shoulder 23, 11%; leg 91, 42% | US. B‐mode (7.5 MHz); N/A | Suspicious ‐ circular and oval masses with poor echo; longitudinally configurated LNs with echogenic eccentric hilum regarded as “enlarged reactively” | Histology (29, 13%) Exclusions: n = 0 |
| Veit‐Haibach 2009 | WPC Data: per pt Distant (brain NR): 12/56 = 21% | Primary (N/A) | Mean age: 62 years; Median age: Range: 23 to 86 years Site: trunk 26, 46%; upper extremities 10, 18%; lower extremity 18, 32%; HN 2, 4% | CT. CE; two slice (N/A); NR | CT: Lesion size and central necrosis for malignancy; fatty hilum and calcifications for benign. For size: short‐axis diameter threshold of 1.5 cm for jugulodigastric and precarinal LNs and threshold of 1 cm for all other LNs of the neck, thorax, and abdomen [16] PET‐CT: increased glucose metabolism and independent of their size Info provided: provided patient‐specific clinical background (first diagnosis of melanoma, postsurgical resection status, location of the resection site) but blinded to clinical exam and histopathology of primary tumour | Histology (unclear; 14 with SLNB, 25%) Exclusions: n = 0 |
| RE‐STAGING OF DISEASE | ||||||
| USA | WPC Data: per pt 56/106 = 53% (all tests) Data: per lesion 87/139 = 63% | Re‐staging (all patients had the study requested for disease re‐staging) | Mean age: 56.8 ± 15.9 Median age: nr; Range: 20 to 87 Site: NR | CT. U, multislice helical (N/A) PET‐CT. 2D; CT (U, multi‐slice helical) (N/A) | CT: NR PET‐CT: SUVmax ≥ 2.5 Info provided: NR for original interpretation or for re‐interpretation | Histology (97, 91.5%) Exclusions: n = 0; N/A |
| Rubaltelli 2011 | WPC Data: per pt | Re‐staging (all undergoing postoperative follow‐up designed to ensure the early identification of lymph node metastases) | Mean age: 54; Median age: 58; Range: 27 to 81 years Site: NR | US. B‐mode; linear array transducers (7.5 to 13 MHz) US. contrast‐enhanced US (7.5 to 13 MHz) | US: focal hypoechoic cortical thickening ‐ a focal area of cortex at least twice as thick as the cortex in the remainder of the same lymph node CE‐US: perfusion defects corresponding to the cortical focal thickening; homogeneous intense enhancement of the cortex considered benign Info provided: NR | Histology (13, 3%) Exclusions: n = 24; definite signs of malignancy on B‐mode US |
| Switzerland | NC Data: per pt | Re‐staging (all pts followed up according to updated Swiss melanoma guidelines) | Mean age: 58.4 years; Median age: Range: 20 to 83 years | PET‐CT. 2D PET, CT (CE, multi‐slice, helical) | FDG uptake clearly greater than background and established morphological CT criteria; if a focal FDG‐active lesion was detected, the exact anatomical localisation was determined on the fused PET‐CT images. Lesions with 18F‐FDG uptake in physiological sites or benign variants, e.g. muscles, brown fatty tissue or pulmonary infiltrations, were determined as benign | Histology (29, 62%; 20 distant mets and 9 LN mets) Exclusions: n = 0; N/A |
| STAGING IN MIXED OR UNCLEAR POPULATIONS | ||||||
| Abbott 2011 | NC Data: per pt | Mixed (primary/FU) | Mean age: NR; Median age: microscopic group: 50; macroscopic group: 63 Range: microscopic group: 19 to 74 years | PET‐CT. 2D; CT (NR) | Clearly indicative/highly suspicious for malignancy considered positive | Histology (5, 15%) Exclusions: n = 0 |
| Netherlands | NC Data: per pt | Mixed (imaged on recurrence or after primary melanoma treatment) | Mean age: 59; Median age: ; Range: 25 to 93 years Site: NR | PET‐CT. NR; CT (U) (N/A) | NR; "hypermetabolic lesions" | Histology (13, 28.3%) Exclusions: n = NR Other result: "MRI revealed 2 brain metastases of 2 and 4 mm in 1 patient (2%). This patient also had other distant metastases that were detected by PET‐CT" |
| Netherlands | NC Data: per pt | Unclear (N). | Mean age: 58; Median age: NR; Range: NR Site: upper extremity 4, 6%; lower extremity 37, 53%; trunk 19, 27%; head/neck 9, 13%; unknown primary 1, 1% | PET‐CT. 2D ; CT (U) (N/A) | NR; "metabolically active" | Histology (NR; 11 with histology or cytology) Exclusions: n = 0 Other result: MRI detected brain mets in 5 pts, no reference standard reported |
| Bastiaannet 2009 | WPC Data: per pt | Mixed (primary (LN mets diagnosed at time of primary diagnosis) 39, 15.5%; recurrence (LN mets identified ≤ 3 years since primary dx) 145, 57.8%; recurrence > 3 years since primary dx 67, 26.7%) | Mean age: 56.9 years (n = 253); Median age: NR; Range: 19 to 93 years (reported in Bastiannet 2012) Site: HN 29, 11.6%; upper extremities 26, 10.4%; trunk 93, 37.0%; lower extremities 88, 35.0%; unknown primary 15, 6.0% | CT. CE, spiral, multi‐slice | NR (presence/absence of mets) | Histology (NR) Exclusions: n = 8; excluded due to follicular structure (n = 1), > 13 years between primary and lymph nodes (n = 3), incidence abroad (n = 1), mucosal melanoma (n = 2), and primary melanoma treated as benign lesion (n = 1) |
| France | NC Data: per pt Data: per lesion Nodal: 20/39 = 51% Distant (incl brain): 65/137 = 47% Bone: 14/34 = 41% Lung: 10/27 = 37% Soft tissue: 16/25 = 64% Skin: 7/9 = 78% Brain: 7/9 = 78% | Mixed (states imaging was for staging or for re‐staging ). | Mean age: NR; Median age: NR; Range: NR Site: NR | PET‐CT. NR; SPECT used in 4 of 8 centres | PET. Positive if there was focal uptake greater than mediastinal or liver uptake that could not clearly be related to physiological processes. Negative when a normal distribution of tracer was observed, even if the CT scan showed abnormalities. Bone accumulations were considered positive when the uptake was higher than in normal bone marrow. Any instance of equivocal PET uptake was considered positive | Histology (25; 28.7%) Exclusions: n = 20; 12 did not undergo FDG PET due to imaging cancellation; 8 are unaccounted for (text describes 75 having PET but reports results for only 67) |
| Dellestable 2011 | WPC 72/119 = 61% (CT) 70/117 = 60% (MRI) 72/119 = 61% (PET‐CT) Nodal: 31/39 = 79% (CT) 31/40 = 78% (MRI) 31/38 = 82% (PET‐CT) Bone: 14/17 = 82% (CT) 14/16 = 88% (MRI) 14/17 = 82% (PET‐CT) Liver: 4/21 = 19% (CT) 4/26 = 15% (MRI) 4/25 = 16% (PET‐CT) Lung: 13/16 = 81% (CT) 13/14 = 93% (MRI) 13/15 = 87% (PET‐CT) | Mixed (both primary staging and FU; breakdown reported but not legible on pdf) Inclusion: PET‐CT for primary staging or follow‐up of MM, regardless of AJCC stage or indication for examination | Mean age: 57 years; Median age: Range: 27 to 85 years | CT. CT (N/A); NR MRI. WB, DW, T2STIR, CE 3D gradient echo (N/A); NR PET‐CT. NR; CT (CE) (N/A); NR | CT: NR MRI: NR PET‐CT: focal uptake; unusual location or visual or quantitative intensity (SUV measurement) Info provided: NR | Histology (36 lesions, 28% of 128) Exclusions: n = 20 lesions; 4 lesions with indeterminate reference and 16 not picked up by CT |
| Germany | WPC Data: per lesion Nodal: 192/379 = 51% Distant: 263/445 = 59% Liver: 33/67 = 49% Lung: 145/197 = 74% Subcutaneous: 33/46 = 72% Other (authors' 'Other' category plus Adrenal, Kidney, Muscle and spleen sites): 51/118 = 43% Adrenal: 2/5 = 40% Bone: 1/17 = 6% Kidney: 2/32 = 6% Muscle: 22/26 = 85% Spleen: 4/24 = 17% | Unclear (Pts described as having undergone a previous assessment of tumour spread based on ADO (German) guidelines but staging/re‐staging not described | Mean age: full sample only: 59.6; Median age: Range: full sample only: 26 to 86 Site: NR | CT. U + CE, multi‐detector (N/A) MRI. U + CE; 'standard sequences' (N/A) | CT: NR (presence/absence of mets) MRI: NR (presence/absence of mets) | Histology (NR) Exclusions: n = 17; no WB‐CT follow‐up undertaken. |
| Jouvet 2014 | WPC 115/209 = 55% (CT) 125/218 = 57% (MRI) Any mets (excl brain): 95/186 = 51% (CT) 105/195 = 54% (MRI) 104/191 = 54% (PET‐CT) Nodal: 23/53 = 43% (all tests) Bone: 15/33 = 45% (CT/MRI) 16/35 = 46% (PET‐CT) Liver: 12/27 = 44% (all tests) Lung: 31/45 = 69% (all tests) Subcutaneous: 2/15 = 13% (CT) 10/22 = 45% (MRI) 7/15 = 47% (PET‐CT) | Unclear (NR) Inclusion: | Mean age: NR; Median age: NR; Range: NR Site: NR | CT. CE; Helical; 16 row (N/A) (2) DW, VIBE ‐ 3D echo gradient CE, T1 ‐ skull (N/A) | CT and MRI: NR (presence/absence of mets) | Histology (0) Exclusions: n = 0; N/A |
| Germany | WPC Data: per pt | Mixed (primary (n = 8), follow‐up (n = 75)) | Mean age: NR; Median age: NR; Range: NR Site: NR | US. B‐mode US; high resolution linear array (5 to 10 MHz); N/A | Suspicious/indeterminate/benign based on diameter, shape, echogenicity, and vascularisation pattern Info provided: unclear; could be same examiner as for LN palpation | Histology (17, 20%) Exclusions: n = 4; 4 were indeterminate on follow‐up so that a final diagnosis could not be made |
| Pfannenberg 2007 2007 | WPC Data: per lesion Any metastases (excl brain): 297/420 = 71% (all tests) Nodal: 102/158 = 65% (CT) Distant (excl brain): 195/262 = 74% (all tests) Bone: 35/50 = 70% (all tests) Liver: 35/37 = 95% (all tests) Lung: 59/80 = 74% (all tests) Local: 53/70 = 76% (all tests) Other viscera: 13/25 = 52% (all tests) | Mixed (pre‐surgery; investigation of abnormal findings; surveillance) | Mean age: 57.8 years; Median age: Range: 23.3 to 79.1 years Site: NR | CT. CT (CE, 16 row multi‐slice) (NA); N/A MRI. CE; multiple phased‐array; axial and coronal (NA); N/A PET‐CT. 3D; CT (CE, 16 row multi‐slice) (NA); N/A FDG: 370 MBq F‐FDG IV 55 to 65 minutes before scanning | CT: based on morphological characteristics and enhancement pattern; region‐specific nodal size criteria based on measurement of the small axis diameter MRI: based on morphological characteristics and enhancement pattern; detected lymph nodes smaller than 10 mm but with brighter signal on T1 sequences, due to the paramagnetic effect of melanin, also were rated as suspicious PET: any focal tracer uptake exceeding normal regional tracer accumulation was assessed as a malignant lesion. Lesions rated malignant or probably malignant were considered to be malignant | Histology (65 (15%)) Exclusions: n = 36; no wbMRI (n = 25; due to metallic implants or claustrophobia (5 patients), refuse of a second whole body examination on the same day (17 patients) or abortion of the examination (3 patients); no evidence of tumour spread (3 patients) or lack of follow‐up data for lesion characterisation (8 patients) |
| Pfluger 2011 | WPC Data: per lesion | Mixed (PET‐CT was done for primary staging and for follow‐up) | Mean age: 57; Median age: Range: 29 to 85 years Site: NR | CT. (1) CE, dual slice, helical (N/A); NR (2) U, dual slice, helical (N/A); NR PET‐CT (1) 3D; CT (CE, dual slice, helical) (N/A); NR (2) 3D‐ CT (U, dual slice, helical) (N/A); NR | CT ‐ abnormal soft tissue masses and/or enlarged LNs (diameter > 1.0 cm) plus degree of contrast enhancement for CE CT only PET alone ‐ non‐physiologically increased uptake of FDG with SUVmax > 2.5. For lesions with discrepant findings on both modalities, the finding of the modality with the higher diagnostic confidence score was accepted. If results from both modalities were discrepant and had the same diagnostic confidence score value, the lesion was judged positive Info provided: knowledge of clinical data | Histology (41, 17.7%) n = NR; ** In cases of new tumour lesions during the follow‐up period, these lesions were not included in the study. The reason given for not including these lesions was the fact that non‐detectable lesions in CT or 18F‐FDG PET cannot be distinguished from non‐existent lesions in the case of a newly detected tumour lesion during follow‐up |
| Germany | WPC Data: per pt Nodal mets: 78/250 = 31% Distant mets (excl brain): 84/250 = 34% | Mixed (primary staging after sentinel node biopsy (n = 75); therapy control after chemotherapy of metastatic disease (n = 42), staging of clinically suspected recurrent disease (n = 65), during follow‐up within 5 years of primary treatment (n = 68) Excluded if inadequate reference standard (no histology or FU < 1 year) | Mean age: 58; Median age: Range: ±16 Site: NR | CT. CE, helical, dual detector (N/A); N/A PET‐CT. CT (CE), helical, dual detector (N/A); N/A | NR for any test; states only that accuracy was assessed according to according to the current AJCC staging classification Info provided: routine clinical fashion; same clinical information about each patient | Histology (100, 40% for N‐staging (including 15 with SLNB) Exclusions: n = 0 |
| Switzerland | NC Data: per pt | Unclear (NR; PET‐CT for depiction or exclusion of metastases) | Mean age: 54.4 years; Median age: Range: 15 to 82 years | PET‐CT. CT (CE, multi‐slice, helical) (N/A); NR | Mets present if detected by 1 or both readers. FDG uptake clearly greater than background; if a focal FDG‐active lesion was detected, the exact anatomical localisation was determined on the fused PET‐CT images. Lesions with 18F‐FDG uptake in physiological sites or benign variants, e.g. muscles, brown fatty tissue or pulmonary infiltrations, were determined as benign. Semi‐quatitative analysis of FDG uptake in terms of SUVmax also conducted Info provided: blinded to serum S100B | Histology (20, 16.1%) Exclusions: n = 3; chemotherapy before PET‐CT |
| Netherlands | NC Data: per pt | Mixed (NR; but interval between treatment of the primary and neck dissection ranged from 0 to 8.8 years (mean 21 months)) | Mean age: 54.5 years; Median age: Range: 55 to 83 years | CT. CE (N/A); NR | Presence of necrosis or axial diameter > 10 or > 11 mm | Histology (26, 100%) Exclusions: n = 0 |
| van Wissen 2016 | NC Data: per pt Nodal (deep groin mets only): 24/67 = 36% | Mixed (NR. Discussion states "large proportion of our patients were initially treated for their primary tumour at other hospitals, and sometimes years prior to the current groin dissection") | Mean age: NR; Median age: 58; Range: 24 to 83 Site: leg 58, 83%; trunk 6, 9%; arm 0, 0%; unknown 6, 9% | PET‐CT. CT (U) (NA) | FDG uptake (qualitative assessment) | Histology (70, 100%) Exclusions: n = 1; missing pathology 7/10 disease negative had a diagnostic resection of a lymph node before lymph node dissection potentially leading to FPs |
| + ‐ positive; AJCC: American Joint Cancer Committee; AWOSEM: attenuation weighted ordered subsets expectation maximisation; BT: Breslow thickness; CE: contrast enhanced; CLND: complete lymph node dissection; CT: computed tomography; 2D: two‐dimensional; 3D: three‐dimensional; DW: diffusion weighted; EDV: end‐diastolic volume; 18FDG: 2‐deoxy‐2‐[18F]fluoro‐D‐glucose; FNAC: fine needle aspiration cytology; FORE: Fourier rebinning; FU: follow‐up; GE: gradient echo; HN: head and neck; LN: lymph node; LNB: lymph node basin; LND: lymph node dissection; LS: lymphoscintigraphy; mA: measure of tube current; mets: metastases; MM: malignant melanoma; MRI: magnetic resonance imaging; NC: non‐comparative; OSEM: ordered subsets expectation maximisation algorithm; PET: positron emission tomography; PI: pulse index; PSV: peak systolic volume; prosp: RF: risk factor; SD: standard deviation; SLN: sentinel lymph node; SLNB: sentinel lymph node biopsy; SSM: superficial spreading melanoma; SUV: standardised uptake value; SUVmax: maximum standardised uptake value; U: unenhanced; US: ultrasound; WB: whole body. | ||||||
Appendix 10. Descriptive synthesis of all included studies of whole body imaging
Study design and setting
Twelve of the 24 studies (50%) were prospective case series (Aukema 2010b; Bastiaannet 2009; Cachin 2014; Dellestable 2011; Hafner 2004; Hausmann 2011; Jouvet 2014; Klebl 2003; Maubec 2007; Pfannenberg 2007; Strobel 2007b; Veit‐Haibach 2009), ten (40%) were retrospective in design (Abbott 2011; Arrangoiz 2012; Aukema 2010a; Iagaru 2007; Kang 2011; Pfluger 2011; Reinhardt 2006; Strobel 2007a; van den Brekel 1998; van Wissen 2016), and in two, the direction of the design was not clear (Prayer 1990; Rubaltelli 2011). All studies were conducted in Europe apart from two US‐based studies ‐ Arrangoiz 2012; Iagaru 2007 ‐ and one conducted in South Korea (Kang 2011).
Participants
Primary staging. Of the six studies conducted in participants undergoing primary staging, two included any participant following diagnosis of melanoma (Kang 2011; Veit‐Haibach 2009); two excluded those with distant metastases on diagnosis (Hafner 2004; Maubec 2007) (Maubec 2007 was restricted to those with melanomas at least 4 mm in thickness); one included clinically node positive participants but did not report exclusion of those with distant metastases (Prayer 1990); and one included only clinically node negative participants with melanomas of at least 4 mm Breslow thickness (Arrangoiz 2012). Three studies also reported data for pre‐SLNB imaging (Arrangoiz 2012; Hafner 2004; Maubec 2007), two of which reported subgroup data for clinically node negative participants who underwent SLNB (Hafner 2004; Maubec 2007). All six studies reported accuracy data on a per patient basis; no per lesion data were identified.
A total of 492 participants were included with sample sizes ranging from 25 in Maubec 2007 to 217 in Prayer 1990. When reported (n = 5), the ages of included participants ranged from 18 years in Hafner 2004 to 89 years in Arrangoiz 2012. The mean age of included participants was reported in five studies (the median of reported means was 61 years, range 56 to 67 years) and median age in one study (median 55 years in Hafner 2004). Fifty‐two per cent of included participants were male. The percentage of participants with head and neck melanoma ranged from 4% in Veit‐Haibach 2009 to 36% in Maubec 2007 (median 15%) and melanoma of the extremities, including the hands or feet where documented, from 32% in Maubec 2007 to 73% in Kang 2011 (median 50%).
Re‐staging. Of the three studies conducted in participants undergoing re‐staging of disease, one included any participant having imaging for re‐staging purposes (Iagaru 2007); and two included clinically node negative participants either undergoing ultrasound of the regional lymph nodes as part of a follow‐up program, as in Rubaltelli 2011, or with raised S100 during follow‐up, as in Strobel 2007a.
A total of 589 participants were included with sample sizes of 47 in Strobel 2007a, 106 in Iagaru 2007, and 460 in Rubaltelli 2011. The ages of included participants ranged from 20 years to 87 years. The median of reported mean ages was 55 years. Fifty‐three per cent of included participants were male. The site of the primary melanoma was not reported in any study. All three studies reported accuracy data on a per patient basis, and one study also reported data per lesion (139 lesions identified in 30 participants; Iagaru 2007).
Mixed or unclear. The 15 studies conducted in mixed or not clearly described population groups are described in Table 3 according to the reported indication for imaging and participant stage of disease on recruitment.
Two studies clearly included participants at any stage of disease (Dellestable 2011; Reinhardt 2006). In Dellestable 2011, 27% of participants had stage I or II melanoma and 73% had stage III or IV disease; imaging was undertaken for primary staging or follow‐up. In Reinhardt 2006, 44% of participants had stage I or II melanoma and the remaining participants had stage III or IV disease. Imaging was undertaken for primary staging after SLNB (30%); therapy control after chemotherapy of metastatic disease (17%), staging of clinically suspected recurrent disease (26%), and imaging during follow‐up within five years of primary treatment (27%). Insufficient data were available from this study to allow 2×2 contingency tables to be estimated for each subgroup of participants, despite author contact.
Stage of disease on recruitment was not reported in four studies, and these were judged to have included ‘any’ stage of disease (Aukema 2010a; Cachin 2014; Klebl 2003; Strobel 2007b). Aukema 2010a included asymptomatic patients with raised S100 either judged to be high risk after primary melanoma treatment (56%) or undergoing follow‐up after surgical treatment of regional (33%) or distant (11%) metastases. Cachin 2014 described imaging for staging or for re‐staging but did not give a breakdown of the number of participants in each group. Klebl 2003 restricted inclusion to those with Clark level IV or V melanomas, with 10% of participants having primary staging and 90% undergoing follow‐up, and Strobel 2007b included those with melanomas at least 4 mm in thickness, Clark level III or IV, or known resected metastases, further reporting only that imaging was used for depiction or exclusion of metastases.
The remaining nine studies in mixed or not clearly described population groups included only participants with stage III disease (Abbott 2011; Aukema 2010b; Bastiaannet 2009; Pfluger 2011; van den Brekel 1998; van Wissen 2016), stage IV disease (Jouvet 2014), or both (Hausmann 2011; Pfannenberg 2007) (Table 3). In the two studies including participants with stage III and IV melanoma, the percentage with stage III disease was 38% in Hausmann 2011 and 39% in Pfannenberg 2007. Four studies in mixed population groups included those having primary staging or follow‐up but did not report the number of participants with each indication for imaging (Abbott 2011; Pfluger 2011; van den Brekel 1998; van Wissen 2016). Bastiaannet 2009 included those with nodal disease identified at the time of primary diagnosis (15%), or with recurrence up to three years from diagnosis (58%) or more than three years since primary diagnosis (27%). In Pfannenberg 2007, imaging was undertaken to exclude widespread disease and before surgical resection (14%); to characterise abnormal radiological, clinical, and laboratory findings (75%); or as part of routine surveillance in high‐risk patients (11%). The remaining three studies did not clearly describe the indication for imaging and were conducted in patients with palpable and pathology proven lymph node metastases and no signs of distant metastases (Aukema 2010b); participants with positive sentinel node biopsy or suspicious lesions on ultrasound or X‐ray studies (Hausmann 2011); or patients with stage IV melanoma (Jouvet 2014).
A total of 1265 participants were included in the 15 studies with sample sizes ranging from 26 in van den Brekel 1998 to 251 in Bastiaannet 2009. When reported (n = 10), the ages of included participants ranged from 15 years in Strobel 2007b to 93 years in Aukema 2010a. The mean age of included participants was reported in nine studies (the median of reported means was 57 years, range 54 to 59 years) and median age in two studies (Abbott 2011 reporting a median age of 50 for those with microscopic disease and 63 for those with macroscopic disease; and van Wissen 2016 reporting a median age of 58 years). Forty‐eight per cent of included participants were male. The site of the primary melanoma was reported in only five of the 16 studies (Abbott 2011; Aukema 2010b; Bastiaannet 2009; van den Brekel 1998; van Wissen 2016), one of which included only head and neck melanoma (van den Brekel 1998), and one of which included only those undergoing combined groin dissection for melanomas of the trunk (17%) or extremities (83%) (van Wissen 2016). Excluding van den Brekel 1998 and van Wissen 2016, the percentage of participants with head and neck melanoma ranged from 3% in Abbott 2011 to 13% in Aukema 2010b, and melanoma of the extremities, including the hands or feet where documented from 38% in Abbott 2011 to 59% in Aukema 2010b.
Index tests
Sixteen studies contributed data for a single index test (Abbott 2011; Arrangoiz 2012; Aukema 2010a; Aukema 2010b; Bastiaannet 2009; Cachin 2014; Hafner 2004; Kang 2011; Klebl 2003; Maubec 2007; Prayer 1990; Rubaltelli 2011; Strobel 2007a; Strobel 2007b; van den Brekel 1998; van Wissen 2016), and eight compared the accuracy of one or more index tests (Dellestable 2011; Hausmann 2011; Iagaru 2007; Jouvet 2014; Pfannenberg 2007; Pfluger 2011; Reinhardt 2006; Veit‐Haibach 2009) (Table 1). Two studies also provided data for PET alone (ineligible index test) (Bastiaannet 2009; Hafner 2004), and two reported data for MRI of the brain in all patients but 2×2 contingency table data could not be included because of small patient or lesion numbers (Aukema 2010a; Aukema 2010b). However, available information on MRI of the brain has been separately summarised as an additional result.
Ultrasound. Five studies evaluated ultrasound as a staging tool (Hafner 2004; Jouvet 2014; Klebl 2003; Prayer 1990; Rubaltelli 2011). All studies employed B‐mode ultrasound, three at single frequencies of 5 MHz (Hafner 2004), 7.5 MHz (Prayer 1990), and 12.5 MHz (Jouvet 2014), and two using variable frequencies of 5 to 10 MHz (Klebl 2003), and 7.5 to 13 MHz (Rubaltelli 2011). One study of ultrasound used in potential SLNB candidates performed ultrasound before lymphoscintigraphy. Lymph node basins were imaged according to the site of the primary melanoma in all studies. The criteria for the detection of nodal metastases were described in all studies apart from Hafner 2004 (Appendix 9). Ultrasound was performed by radiologists (Hafner 2004; Jouvet 2014; Prayer 1990), was performed by a sonologist (Rubaltelli 2011), or was not reported (Klebl 2003).
CT. Ten studies evaluated CT ‐ unenhanced (Iagaru 2007), contrast enhanced (Bastiaannet 2009; Dellestable 2011; Jouvet 2014; Pfannenberg 2007; Pfluger 2011; Reinhardt 2006; van den Brekel 1998; Veit‐Haibach 2009), or both (Hausmann 2011). CT parameters (tube current (mA), tube voltage (kV), and slice thickness (mm)) were not reported in four studies (Bastiaannet 2009; Dellestable 2011; Hausmann 2011; Veit‐Haibach 2009), and ranged from 40 mA in Iagaru 2007 and Reinhardt 2006; to 250 mA in Jouvet 2014; 120 kV in Jouvet 2014,Pfannenberg 2007, and Pfluger 2011; to 140 kV in Iagaru 2007, with slice thicknesses from 1.25 mm in Jouvet 2014 to 5 mm in Iagaru 2007,Pfannenberg 2007,Reinhardt 2006, and van den Brekel 1998 (reported per study in Appendix 9).
Scan coverage included the skull (Dellestable 2011; Iagaru 2007; Jouvet 2014; Pfluger 2011), or specifically excluded the skull (Bastiaannet 2009; Hausmann 2011; Pfannenberg 2007; Reinhardt 2006), and it extended to the abdominal or pelvic area (Bastiaannet 2009; Dellestable 2011; Jouvet 2014; Pfluger 2011), or it also included the lower limbs (Iagaru 2007; Pfannenberg 2007; Pfluger 2011; Reinhardt 2006). van den Brekel 1998 imaged the neck area only, and Veit‐Haibach 2009 did not clearly document the scan coverage, describing whole body imaging in a caudocranial direction. The criteria for the detection of metastases were not reported in six studies (Bastiaannet 2009; Dellestable 2011; Hausmann 2011; Iagaru 2007; Jouvet 2014; Reinhardt 2006). Four studies reported the use of morphological characteristics (Pfannenberg 2007; van den Brekel 1998), soft tissue masses (Pfluger 2011; Veit‐Haibach 2009), contrast enhancement (Pfannenberg 2007; Pfluger 2011; Veit‐Haibach 2009), and nodal size criteria (Pfannenberg 2007; Pfluger 2011; van den Brekel 1998).
Test interpretation was provided by radiologists (Hausmann 2011; Jouvet 2014; Veit‐Haibach 2009), nuclear medicine physicians (Bastiaannet 2009), or both (Iagaru 2007), or by dermato‐oncologists and radiologists (Pfannenberg 2007). Four studies did not report observer qualifications (Dellestable 2011; Pfluger 2011; Reinhardt 2006; van den Brekel 1998). Half of studies reported providing test interpreters with clinical information including the diagnosis, age, and sex of the patient (Hausmann 2011), clinical status (Pfannenberg 2007), clinical data (Pfluger 2011), routine clinical information (Reinhardt 2006), or patient‐specific clinical background (Veit‐Haibach 2009). All studies apart from two ‐ Iagaru 2007 and van den Brekel 1998 ‐ reported blinding to the results of other imaging tests.
MRI. Four studies evaluated 1.5 T MRI using a variety of different sequences before and after gadolinium contrast enhancement (Dellestable 2011; Hausmann 2011; Jouvet 2014; Pfannenberg 2007), including diffusion weighting (Dellestable 2011; Jouvet 2014), as well as ultrafast gradient echo (described as VIBE in the study reports) sequences (Jouvet 2014;Pfannenberg 2007). Scan coverage in three studies was from the head to the feet (Jouvet 2014; Pfannenberg 2007; Laurent 2010), and from the neck to the pelvis only in Hausmann 2011. Two studies did not report the criteria used to assess the presence of metastases (Hausmann 2011; Jouvet 2014); one reported a qualitative assessment of signal intensity (Dellestable 2011), and one reported use of morphological characteristics, enhancement pattern, and lymph node size and signal (Pfannenberg 2007). Four studies reported test interpretation by radiologists (Dellestable 2011; Hausmann 2011; Jouvet 2014; Pfannenberg 2007). Two studies reported providing test interpreters with clinical information including the diagnosis, age, and sex of the patient (Hausmann 2011), or clinical status (Pfannenberg 2007). All studies reported blinding to the results of other imaging tests.
PET‐CT. Seventeen studies examined the use of PET‐CT for staging purposes, combining PET with unenhanced CT (Arrangoiz 2012; Aukema 2010a; Aukema 2010b; Dellestable 2011; Iagaru 2007; Kang 2011; Maubec 2007; van Wissen 2016), contrast enhanced CT (Jouvet 2014; Pfannenberg 2007; Reinhardt 2006; Strobel 2007a; Strobel 2007b; Veit‐Haibach 2009), or evaluating both (Pfluger 2011). Two studies did not report whether or not the CT component was contrast enhanced (Abbott 2011; Cachin 2014). CT was clearly described as used for attenuation correction (Arrangoiz 2012; Aukema 2010a; Aukema 2010b; Pfannenberg 2007; Reinhardt 2006; Strobel 2007a; Strobel 2007b; van Wissen 2016; Veit‐Haibach 2009), or for anatomical localisation (Cachin 2014; Kang 2011), or for both (Abbott 2011; Dellestable 2011; Iagaru 2007), or it was not clearly described (Jouvet 2014; Maubec 2007; Pfluger 2011).
Where reported (n = 8), studies employed 2D PET (Abbott 2011; Aukema 2010b; Iagaru 2007; Strobel 2007a), 3D PET (Maubec 2007; Pfannenberg 2007; Pfluger 2011), or either 2D or 3D PET (Arrangoiz 2012). CT parameters were not reported in four studies (Abbott 2011; Cachin 2014; Dellestable 2011; Veit‐Haibach 2009). In 14 studies, parameters ranged from 40 mA ‐ Aukema 2010a; Aukema 2010b; Iagaru 2007; Reinhardt 2006; Strobel 2007a; Strobel 2007b; van Wissen 2016 ‐ to 160 mA ‐ Kang 2011; Pfannenberg 2007, or from 110 kV ‐ Maubec 2007 ‐ to 140 kV ‐ Arrangoiz 2012; Iagaru 2007; Jouvet 2014; Kang 2011; Strobel 2007a; Strobel 2007b ‐ and slice thickness from 2.5 mm ‐ Kang 2011; Pfluger 2011 ‐ to 6.5 mm ‐ Jouvet 2014 ‐ and are reported in Appendix 9.
Scan coverage included the skull (Arrangoiz 2012; Dellestable 2011; Iagaru 2007; Kang 2011; Maubec 2007; Pfluger 2011; Strobel 2007a; Strobel 2007b), or specifically excluded the skull (Abbott 2011; Jouvet 2014; Pfannenberg 2007; Reinhardt 2006), and it extended to the upper thigh (Abbott 2011), or to the lower limbs (Arrangoiz 2012; Dellestable 2011; Iagaru 2007; Jouvet 2014; Kang 2011; Maubec 2007; Pfannenberg 2007; Pfluger 2011; Reinhardt 2006; Strobel 2007a; Strobel 2007b). Five studies did not clearly document the scan coverage, describing whole body imaging (Aukema 2010a; Cachin 2014; van Wissen 2016), imaging according to the primary lesion site (Aukema 2010b), or imaging in a caudocranial direction (Veit‐Haibach 2009).
The criteria for the detection of metastases were not reported in three studies (Abbott 2011; Jouvet 2014; Reinhardt 2006), or they were described as the presence of metabolically active lesions with no further detail in two (Aukema 2010a; Aukema 2010b). Six studies reported assessment of focal FDG uptake relative to background (Cachin 2014; Strobel 2007a), as supported by SUVmax assessment (Dellestable 2011; Maubec 2007; Pfannenberg 2007; Pfluger 2011; Strobel 2007b; van Wissen 2016; Veit‐Haibach 2009). Three studies reported the use of SUVmax alone (≥ 2.2 in Kang 2011 and ≥ 2.5 in Arrangoiz 2012 and Iagaru 2007).
Test interpretation was provided by nuclear medicine physicians alone (Abbott 2011; Arrangoiz 2012; Aukema 2010a; Aukema 2010b; Cachin 2014; Jouvet 2014; Kang 2011; Strobel 2007a; Strobel 2007b; van Wissen 2016), or teamed with radiologists (Iagaru 2007; Veit‐Haibach 2009), or by dermato‐oncologists and radiologists (Pfannenberg 2007). Four studies did not report observer qualifications (Dellestable 2011; Maubec 2007; Pfluger 2011; Reinhardt 2006). Four studies reported providing test interpreters with some form of clinical patient information (Pfannenberg 2007; Pfluger 2011; Reinhardt 2006; Veit‐Haibach 2009). Seven studies reported blinding to the results of other imaging tests (Dellestable 2011; Jouvet 2014; Pfannenberg 2007; Reinhardt 2006; Strobel 2007a; Strobel 2007b; Veit‐Haibach 2009).
Reference standards
Four of the 24 studies (17%) evaluated the accuracy of imaging in comparison to histology alone, using samples from SLNB or CLND (Hafner 2004;Maubec 2007), or from neck (van den Brekel 1998), or from groin (van Wissen 2016) dissection, and in two studies, the reference standard combined histology based on CLND or SLNB with follow‐up to determine any false negative results on imaging (Arrangoiz 2012; Prayer 1990). The remaining studies used a combination of histology or follow‐up (Abbott 2011; Bastiaannet 2009; Cachin 2014; Dellestable 2011; Hausmann 2011; Iagaru 2007; Kang 2011; Klebl 2003; Pfannenberg 2007; Pfluger 2011; Reinhardt 2006; Veit‐Haibach 2009), FNAC or follow‐up (Jouvet 2014), or histology, FNAC, or follow‐up as a reference standard (Aukema 2010a; Aukema 2010b; Rubaltelli 2011; Strobel 2007a; Strobel 2007b).
Across the 20 studies reporting some form of follow‐up, two did not report the length of follow‐up, but more than 90% of included participants had a histological reference standard reported (Arrangoiz 2012; Iagaru 2007). Eighteen studies reported or required minimum follow‐up periods of at least three months (n = 11) or reported the mean or median follow‐up with a range that was at least three months (n = 7). Minimum follow‐up was between three and six months (Aukema 2010a; Dellestable 2011; Hausmann 2011; Pfannenberg 2007; Veit‐Haibach 2009), from six months to a year (Aukema 2010b; Bastiaannet 2009; Cachin 2014; Jouvet 2014; Kang 2011; Pfluger 2011; Prayer 1990; Rubaltelli 2011; Strobel 2007a; Strobel 2007b), or one year or longer (Abbott 2011; Klebl 2003; Reinhardt 2006). Where reported, median follow‐up times ranged from 10 months in Rubaltelli 2011 to 24.3 months in Kang 2011, and mean follow‐up from 8.3 months to 34 months (Abbott 2011).
Follow‐up schedules were documented in eight studies (Abbott 2011; Hausmann 2011; Kang 2011; Klebl 2003; Pfannenberg 2007; Prayer 1990; Reinhardt 2006; Strobel 2007a). Tests used during follow‐up were mentioned in 16 studies (Abbott 2011; Aukema 2010a; Aukema 2010b; Bastiaannet 2009; Cachin 2014; Dellestable 2011; Hausmann 2011; Jouvet 2014; Kang 2011; Pfannenberg 2007; Pfluger 2011; Reinhardt 2006; Rubaltelli 2011; Strobel 2007a; Strobel 2007b; Veit‐Haibach 2009), although the detail provided varied considerably, for example from ‘clinical or radiological follow‐up’ in Dellestable 2011 to ‘physical examination, blood tests, ultrasound studies, X‐rays, and CT scans of the body from the neck to the pelvis (WB‐CT) as well as an MRI of the head (MRI‐CR)’ in Hausmann 2011 (Appendix 9).
Exclusions
Ten studies reported the exclusion of between 1 and 36 study participants (Bastiaannet 2009; Cachin 2014; Hausmann 2011; Klebl 2003; Pfannenberg 2007; Rubaltelli 2011; Strobel 2007b; van Wissen 2016), or lesions (Dellestable 2011). Pfluger 2011 further reported that new lesions detected during the follow‐up period were not included as false negative on imaging on the basis that they may have been newly emergent lesions.
Appendix 11. Sensitivities and specificities of imaging tests from studies reporting data for more than one target condition
| Test Study Population group No. patients/cases a [Lesions/cases] | Imaging detail | Sensitivity [95% CI] % TP/Diseased | Specificity [95% CI] % TN/Non‐Diseased | ||||||||
| Any metastasis | Nodal metastasis | Distant metastasis | Any metastasis | Nodal metastasis | Distant metastasis | ||||||
| Including brain | Excluding brain | Including brain | Excluding brain | Including brain | Excluding brain | Including brain | Excluding brain | ||||
| CT | |||||||||||
| Primary Per patient data 56 | CT (CE) | Not assessed | Not assessed | 23 [5 to 54] 3/13 | Not assessed | Brain NR 25 [5 to 57] 3/12 | Not assessed | Not assessed | 100 [92 to 100] 43/43 | Not assessed | Brain NR 93 [81 to 99] 41/46 |
| Mixed Per patient data 250/116 | CT (CE) | 81 [73 to 88] 94/116 | Not assessed | 85 [75 to 92] 66/78 | 74 [63 to 83] 62/84 | Not assessed | 77 103/134 | Not assessed | 87 150/172 | 88 146/166 | Not assessed |
| Mixed Per lesion data 40 [118 / 72] | CT (CE) | 80 [69 to 89] 53/66 | Not assessed | 94 [79 to 99] 29/31 | 59 [42 to 74] 24/41 | Not assessed | 95 40/42 | Not assessed | 100 8/8 | 87 34/39 | Not assessed |
| Unclear Per lesion data 33 [824 /455] | CT (CE) | Not assessed | 78 [74 to 82] 356/455 | 86 [81 to 91] 166 /192 | Not assessed | 71 [65 to 76] 186/263 | Not assessed | 50 183/369 | 29 54/187 | Not assessed | 71 129/182 |
| Unclear Per lesion data 37 [218 / 125] | CT (CE) | 90 [82 to 94] 103/115 | 88 [80 to 94] 84/95 | 96 [78 to 100] 22/23 | 88 [80 to 94] 81/92 | 86 [76 to 93] 62/72 | 70 66/94 | 69 63/91 | 63 19/30 | 73 47/63 | 72 44/61 |
| Mixed Per lesion data 64 [420/297] | CT (CE) | Not assessed | 77 [72 to 82] 229/297 | 76 [67 to 84] 78/102 | Not assessed | 77 [71 to 83] 151/195 | Not assessed | 70 86/123 | 77 43/56 | Not assessed | 64 43/67 |
| MRI | |||||||||||
| Mixed Per lesion data 40 [118 / 72] | MRI (DW) | 83 58/70 | Not assessed | 90 28/31 | 77 30/39 | Not assessed | 96 45/47 | Not assessed | 89 8/9 | 97 37/38 | Not assessed |
| Unclear Per lesion data 33 [824 / 455 ] | MRI (NR) | Not assessed | 73 334/455 | 82 157/192 | Not assessed | 67 177/263 | Not assessed | 84 309/369 | 77 144/187 | Not assessed | 91 165/182 |
| Unclear Per lesion data 37 [218 / 125 ] | MRI (DW) | 68 85/125 | 69 72/105 | 96 22/23 | 62 63/102 | 61 50/82 | 73 68/93 | 72 65/90 | 80 24/30 | 70 44/63 | 68 41/60 |
| MRI (DW+ VIBE) | 84 105/125 | 81 85/105 | 87 20/23 | 83 85/102 | 79 65/82 | 87 81/93 | 87 78/90 | 100 30/30 | 81 51/63 | 80 48/60 | |
| Mixed Per lesion data 64 [420/297 ] | MRI (DW+ VIBE) | Not assessed | 80 237/297 | 66 67/102 | Not assessed | 87 170/195 | Not assessed | 76 94/123 | 77 43/56 | Not assessed | 76 51/67 |
| PET‐CT | |||||||||||
| Primary 56/32 | CT (NR) | 47 [29 to 65] 15/32 | Not assessed | Not assessed | 100 [48 to 100] 5/0 | Not assessed | 88 [68 to 97] 21/24 | Not assessed | Not assessed | 94 [84 to 99] 48/51 | Not assessed |
| Mixed Per patient data 250/116 | CT (CE) | 97 [91 to 99] 112/116 | Not assessed | 95 [87 to 99] 74/78 | 99 [94 to 100] 83/84 | Not assessed | 98 131/134 | Not assessed | 100 172/172 | 98 162/166 | Not assessed |
| Primary Per patient data 56/13 Nodal; 12 Distant | CT (CE) | 38 [14 to 68] 5/13 | Brain NR 42 [15 to 72] 5/12 | 100 [92 to 100] 43/43 | Brain NR 93 [81 to 99] 41/44 | ||||||
| Mixed Per lesion data 87 [176 / 85] | CT (NR) | 80 68/85 | Not assessed | 85 17/20 | 78 51/65 | Not assessed | 54 49/91 | Not assessed | 37 7/19 | 58 42/72 | Not assessed |
| Mixed Per lesion data 40 [118 / 72] | CT (CE) | 74 53/72 | Not assessed | 84 26/31 | 66 27/45 | Not assessed | 89 42/47 | Not assessed | 100 7/7 | 88 35/40 | Not assessed |
| Unclear Per lesion data 37 [218 / 125] | CT (CE) | Not assessed | 80 83/104 | 96 22/23 | PET‐CT did not cover skull | 75 61/81 | Not assessed | 93 81/87 | 97 29/30 | PET‐CT did not cover skull | 91 52/57 |
| Mixed Per lesion data 64 [420/297] | CT (CE) | Not assessed | 91 269/297 | 85 87/102 | PET‐CT did not cover skull | 93 182/195 | Not assessed | 77 95/123 | 89 50/56 | PET‐CT did not cover skull | 67 45/67 |
| a studies with per patient data denoted in bold type CE: contrast enhanced; CT: computed tomography; DW: diffusion weighted; GE: gradient echo; MRI: magnetic resonance imaging; NR: not reported; PET: positron emission tomography; SLNB: sentinel lymph node biopsy; TN: true negative; TP: true positive; U: unenhanced; US: ultrasound; WB: whole body. | |||||||||||
Appendix 12. Findings from studies conducted in mixed or not clearly reported populations
Sensitivities and specificities from studies evaluating more than one target condition (any metastasis, nodal metastasis or distant metastasis) are tabulated in Appendix 11. Summary estimates of sensitivities and specificities are presented in Appendix 13.
Results: detection of any metastases
Eleven studies reported accuracy data for the detection of any metastasis in mixed study populations (Abbott 2011;Aukema 2010a;Aukema 2010b;Cachin 2014;Dellestable 2011;Hausmann 2011;Jouvet 2014;Pfannenberg 2007;Pfluger 2011;Reinhardt 2006;Strobel 2007b) (Table 1).
Forest plots of study data are provided in Figure 10 (per patient) and Figure 11 (per lesion). Summary estimates for indirect and direct comparisons of tests are presented in Appendix 13 and ROC plots of direct comparisons between tests in Figure 12, Figure 13, and Figure 14 (per lesion data only).

Forest plot of tests for the detection of any metastases (mixed populations ‐ per patient data).

Forest plot of tests for the detection of any metastases (mixed populations ‐ per lesion data).

ROC plot of direct comparisons between CT and MRI for the detection of any metastases in mixed population group studies (per lesion data).

ROC plot of direct comparisons between CT and PET‐CT for the detection of any metastases in mixed population group studies (per lesion data).

ROC plot of direct comparisons between MRI and PET‐CT for the detection of any metastases in mixed population group studies (per lesion data).
Per patient data
Six studies reported per patient data for a total of 553 study participants and 268 cases of metastases (Abbott 2011;Aukema 2010a;Aukema 2010bCachin 2014;Reinhardt 2006;Strobel 2007b) (Figure 10); prevalence ranged from 21% in Abbott 2011) to 58% in Cachin 2014.
CT. CT was evaluated in one study of 250 participants with mixed indications for imaging, including over 40% with stage I or II disease on presentation (Reinhardt 2006); scan coverage did not include the skull in this study. Observed sensitivity was 81% (95% CI 73, 88%) and specificity 77% (95% CI 69, 84%) (250 participants; 166 cases).
MRI. No per patient data for MRI were identified.
PET‐CT. Six studies provided per patient data for PET‐CT for the detection of any metastasis (Abbott 2011;Aukema 2010a;Aukema 2010bCachin 2014;Reinhardt 2006;Strobel 2007b). The sensitivity of PET‐CT ranged from 71% (95% CI 29% to 96%) in Abbott 2011 to 100% (95% CI 85% to 100%) in Aukema 2010a and specificity from 71% (95% CI 41% to 87%) in Cachin 2014 to 98% (95% CI 94% to 100%) in Reinhardt 2006.
Summary sensitivity from the six studies was 91.1% (95% CI 83.6% to 95.3%) and specificity 93.8% (95% CI 85.1% to 97.6%) (591 patients, 268 cases) (Appendix 13; Table A).
Observed sensitivity in Strobel 2007b increased from 85% (95% CI 72% to 93%) to 98% (95% CI 90% to 100%) (seven additional metastases detected) when PET‐CT interpretation was combined with a separate dedicated CT interpretation, with one additional false positive result (specificities 96% and 94%, respectively).
Reinhardt 2006 provided a direct comparison of the accuracy of contrast enhanced CT with PET‐CT, which found PET‐CT to be significantly more sensitive (97%, 95% CI 91% to 99%) and specific (98%, 95% CI 94% to 100%) in comparison to CT alone (increases of 16% and 22%, respectively).
Per lesion data
Six studies reported per lesion data for a total of 311 study participants, 1989 lesions, and 1185 confirmed metastases (Cachin 2014;Dellestable 2011;Hausmann 2011;Jouvet 2014;Pfannenberg 2007;Pfluger 2011) (Figure 11). The prevalence of metastases on a lesion basis ranged from 48% in Cachin 2014 to 71% in Pfannenberg 2007. The average number of confirmed metastatic lesions per study participant ranged from 1 in Cachin 2014 to 14 in Hausmann 2011, with a median of 3.
CT. Five studies presented data for contrast enhanced CT for the detection of any metastases (Dellestable 2011;Hausmann 2011;Jouvet 2014;Pfannenberg 2007;Pfluger 2011). Sensitivity ranged from 77% (95% CI 72% to 82%) in Pfannenberg 2007 to 88% (95% CI 80% to 94%) in Jouvet 2014, and specificity from 50% (95% CI 44% to 55%) in Hausmann 2011 to 95% (95% CI 84% to 99%) in Dellestable 2011.
Summary sensitivity from the five studies was 81.3% (95% CI 76.8% to 85.1%) and specificity 71.2% (95% CI 53.9% to 83.9%) (1770 lesions, 1064 metastases) (Appendix 13; Table B).
A single study providing a direct comparison of the accuracy of contrast enhanced CT with unenhanced CT found contrast enhanced CT to be significantly more sensitive (85%, 95% CI 79% to 85%) compared to unenhanced CT (62%, 95% CI 53% to 69%), with a smaller decrease (11%) in specificity for unenhanced CT (52%, 95% CI 40% to 63%) (232 lesions, 151 confirmed metastases) (Figure 11) (Pfluger 2011).
MRI. Four studies presented data for MRI for the detection of any metastases (Dellestable 2011;Hausmann 2011;Jouvet 2014;Pfannenberg 2007). Sensitivity ranged from 69% (95% CI 59% to 77%) in Jouvet 2014 to 83% (95% CI 72% to 91%) in Dellestable 2011, and specificity from 72% (95% CI 62% to 81%) in Jouvet 2014 to 96% (95% CI 85% to 99%) in Dellestable 2011.
Summary sensitivity from the four studies was 76.4% (95% CI 70.6% to 81.4%) and specificity 83.0% (95% CI 71.9% to 90.3%) (1556 lesions, 927 metastases) (Appendix 13; Table B). Sensitivity and specificity in Jouvet 2014 were both increased (by 13% and 15%, respectively) with the addition of ultrafast gradient echo (VIBE) sequences to the MRI protocol.
PET‐CT. Five studies evaluated PET‐CT for the detection of any metastasis (Cachin 2014;Dellestable 2011;Jouvet 2014;Pfluger 2011;Pfannenberg 2007). Sensitivity ranged from 74% (95% CI 62% to 83%) in Dellestable 2011 to 100% (95% CI 98% to 100%) in Pfluger 2011, and specificity from 54% (95% CI 43% to 64%) in Cachin 2014 to 93% (95% CI 86% to 97%) in Jouvet 2014.
Summary sensitivity from the five studies was 90.7% (95% CI 69.0% to 97.7%) and specificity 84.5% (95% CI 69.7% to 92.9%) (1138 lesions, 709 metastases) (Appendix 13; Table B).
Pfluger 2011 showed only marginal differences in accuracy between PET‐CT using contrast enhanced CT versus unenhanced CT; sensitivity for unenhanced PET‐CT (97%, 95% CI 92% to 99%) compared to enhanced PET‐CT (100%, 95% CI 98% to 100%) (232 lesions; 151 confirmed metastases).
Comparisons between tests. The statistical model comparing the three sets of pooled estimates showed no statistically significant differences in sensitivity (P = 0.17) or specificity (P = 0.29) between tests (Appendix 13; Table B).
Three of the studies provided a direct comparison of CT, MRI, and PET‐CT (Dellestable 2011;Jouvet 2014;Pfannenberg 2007), Hausmann 2011 compared CT and MRI, and Pfluger 2011 compared CT and PET‐CT. The direct comparisons between tests in these studies are plotted ROC space in Figure 12,Figure 13, and Figure 14. None of the differences in sensitivity and specificity between tests reached statistical significance (Appendix 13; Table C).
Results: detection of nodal metastases
Ten studies reported accuracy data for the detection of nodal metastases (Cachin 2014; Dellestable 2011; Hausmann 2011; Jouvet 2014; Klebl 2003; Pfannenberg 2007; Reinhardt 2006; Rubaltelli 2011; van den Brekel 1998; van Wissen 2016).
Forest plots of study data are provided in Figure 15 (per patient) and Figure 16 (per lesion).

Forest plot of tests for the detection of nodal metastases (mixed populations ‐ per patient data).

Forest plot of tests for the detection of nodal metastases (mixed populations ‐ per lesion data).
Per patient data
Four studies reported per patient data for a total of 355 study participants and 175 cases of nodal metastases (Klebl 2003; Reinhardt 2006; Van den Brekel 1998; van Wissen 2016) (Figure 15); the prevalence of nodal metastases ranged from 22% in Klebl 2003 to 86% in van Wissen 2016.
Ultrasound. One study evaluated ultrasound for nodal metastases in participants with Clark level IV or V melanoma following primary treatment (n = 8) or during follow‐up (n = 75) (Klebl 2003). All 17 participants with nodal metastases were identified on ultrasound (sensitivity 100%, 95% CI 80% to 100%) with 21 false positives (specificity 66%, 95% CI 53% to 78%); 11 of the 17 true positive results were also detected on palpation, with a total of 12 false positive results (Klebl 2003).
CT. CT was evaluated for the detection of nodal metastases in two studies. In Reinhardt 2006, 78 of the 166 participants with confirmed metastatic disease had nodal metastases (prevalence 78/250; 31%). Sensitivity was 85% (95% CI 75% to 92%) and specificity 87% (95% CI 81% to 92%). Similarly high sensitivity was reported in a high prevalence study of CT before therapeutic or elective dissection of the lymph nodes of the neck in participants with head and neck melanoma (86%, 95% CI 64% to 97%), with specificity of 100% (95% CI 48% to 100%) (26 participants; 21 cases of nodal metastases) (van den Brekel 1998).
MRI. No per patient data were identified for MRI in this patient group.
PET‐CT. PET‐CT was evaluated for the detection of nodal metastases in two studies. In a direct comparison with CT alone, PET‐CT was more sensitive (95%, 95% CI 87% to 99%) than CT alone but with overlapping confidence intervals, and was significantly more specific (100%, 95% CI 98% to 100%) (250 participants; 78 cases of nodal metastases) (Reinhardt 2006).
van Wissen 2016 evaluated the use of PET‐CT in 69 participants scheduled for combined superficial and deep groin dissection due to palpable groin metastases. Results showed that although PET‐CT was highly sensitive for the detection of superficial groin metastases (98%, 95% CI 91% to 100%) (59 cases), six participants with deep groin metastases were missed by PET‐CT even when indeterminate PET‐CT results were considered test positive (sensitivity 75%, 95% CI 53% to 90%) (24 cases). Specificity was 81% (95% CI 76% to 92%), with eight false positive results.
Per lesion data
Per lesion data were reported in five studies for a total of 241 study participants, 669 lesions, and 338 confirmed metastases(Cachin 2014;Dellestable 2011;Hausmann 2011;Jouvet 2014;Pfannenberg 2007) (Figure 16). The prevalence of metastases on a lesion basis ranged from 43% in Hausmann 2011 to 78% in Dellestable 2011. Summary estimates for indirect and direct comparisons of tests are presented in Appendix 13, and ROC plots of direct comparisons between tests in Figure 17, Figure 18, and Figure 19 (per lesion data only).

ROC plot of direct comparisons between CT and MRI for the detection of nodal metastases in mixed population group studies (per lesion data).

ROC plot of direct comparisons between CT and PET‐CT for the detection of nodal metastases in mixed population group studies (per lesion data).

ROC plot of direct comparisons between MRI and PET‐CT for the detection of nodal metastases in mixed population group studies (per lesion data).
CT. Four studies evaluated contrast enhanced CT for the detection of nodal metastasis (Dellestable 2011;Hausmann 2011;Jouvet 2014;Pfannenberg 2007). Sensitivity ranged from 76% (95% CI 67% to 84%) in Pfannenberg 2007 to 96% (95% CI 78% to 100%) in Jouvet 2014, and specificity from 29% (95% CI 22% to 36%) in Hausmann 2011 to 100% (95% CI 63% to 100%) in Dellestable 2011.
Summary sensitivity from the four studies was 87.2% (95% CI 76.5% to 93.4%) and specificity 69.2% (95% CI 34.6% to 90.5%) (629 lesions, 348 metastases) (Appendix 13; Table B).
MRI. The same four studies considered MRI for the detection of nodal metastasis using a number of different MRI protocols (Dellestable 2011;Hausmann 2011;Jouvet 2014;Pfannenberg 2007). Sensitivity ranged from 66% (95% CI 56% to 75%) in Pfannenberg 2007 to 96% (95% CI 78% to 100%) in Jouvet 2014, and specificity from 77% (95% CI 64% to 87%) in Pfannenberg 2007 to 77% (95% CI 70% to 83%) in Hausmann 2011 to 89% (95% CI 52% to 100%) in Dellestable 2011. Summary sensitivity from the four studies was 83.9% (95% CI 68.9% to 92.5%) and specificity 78.1% (95% CI 72.1% to 83.1%) (630 lesions, 348 metastases) (Appendix 13; Table B).
The direct comparison of diffusion weighted MRI compared with diffusion weighted plus VIBE sequences in Jouvet 2014 found the addition of VIBE to be less sensitive but more specific, but with small lesion numbers (53 nodal lesions and 23 malignancies), the differences were not statistically significant.
PET‐CT. Four studies evaluated PET‐CT for the detection of nodal metastasis (Cachin 2014;Dellestable 2011;Jouvet 2014;Pfannenberg 2007). Sensitivities ranged from 84% (95% CI 66% to 95%) in Dellestable 2011 to 96% (95% CI 83% to 100%) in Jouvet 2014, and specificities from 37% (95% CI 16% to 62%) in Cachin 2014 to 100% (95% CI 59% to 100%) in Dellestable 2011.
Summary sensitivity from the four studies was 86.4% (95% CI 80.5% to 90.7%) and specificity 89.1% (95% CI 53.1% to 98.3%) (288 lesions, 176 metastases) (Appendix 13; Table B).
Comparison between tests. The statistical model comparing the three sets of pooled estimates showed no statistically significant differences in sensitivity (P = 0.22) or specificity (P = 0.89) between tests (Appendix 13; Table B).
Three studies in mixed population groups provided a direct comparison of CT, MRI, and PET‐CT (Dellestable 2011;Jouvet 2014;Pfannenberg 2007); Hausmann 2011 also compared CT and MRI. Three studies included the same total numbers of nodal lesions and metastases per test, while the number detected per test varied for Dellestable 2011. ROC plots show direct comparisons between tests in Figure 17, Figure 18, and Figure 19 (per lesion data only). No statistically significant differences in sensitivity were observed in any of the direct comparisons, but the specificity of PET‐CT (92.5%, 95% CI 85.0% to 96.4%) was significantly higher than both MRI (by 13.5%, 95% CI 3.73% to 23.3%; P = 0.007) and CT alone (by 18.0%, 95% CI 7.69% to 28.3%; P = 0.001) (Appendix 13; Table C).
Results: detection of distant metastases
Nine studies considered the detection of distant metastases (Arrangoiz 2012;Bastiaannet 2009;Cachin 2014;Dellestable 2011;Hausmann 2011;Jouvet 2014;Pfannenberg 2007;Reinhardt 2006;Veit‐Haibach 2009).
Forest plots of study data are provided in Figure 20 (per patient) and Figure 21 (per lesion).

Forest plot of tests for the detection of distant metastases (mixed populations ‐ per patient data only).

Forest plot of tests for the detection of distant metastases (per lesion data).
Per patient data
Two studies reported per patient data for a total of 501 study participants and 162 cases of distant metastases (Bastiaannet 2009;Reinhardt 2006) (Figure 20); the prevalence of nodal metastases was 31% (Bastiaannet 2009) and 34% (Reinhardt 2006).
CT.Reinhardt 2006 reported sensitivity of 74% (95% CI 63% to 83%) and specificity of 88% (95% CI 84% to 99%) in participants at any stage of disease and with mixed indications for imaging (250 participants; 84 cases of distant metastases). Bastiaannet 2009 included participants with palpable, confirmed lymph node metastases who were considered candidates for regional lymph node dissection. Sensitivity was 78% (95% CI 67% to 87%) and specificity 94% (95% CI 89% to 97%) (251 participants; 78 cases of distant metastases).
MRI. No per patient data were identified for MRI in this patient group.
PET‐CT.Reinhardt 2006 reported a direct comparison of CT with PET‐CT (Figure 20). Both sensitivity and specificity increased significantly with PET‐CT (sensitivity 99%, 95% CI 94% to 100% and specificity 98%, 95% CI 94% to 99%).
Per lesion data
Per lesion data were reported in five studies for a total of 501 study participants, 1090 lesions, and 666 confirmed metastases (Cachin 2014;Dellestable 2011;Hausmann 2011;Jouvet 2014;Pfannenberg 2007) (Figure 21). The prevalence of distant metastases on a lesion basis ranged from 47% in Cachin 2014 to 74% in Pfannenberg 2007.
CT. Four studies evaluated contrast enhanced CT for the detection of distant metastasis (Dellestable 2011;Hausmann 2011;Jouvet 2014;Pfannenberg 2007). Sensitivity ranged from 59% (95% CI 42% to 74%) in Dellestable 2011 to 86% (95% CI 76% to 93%) in Jouvet 2014, and specificity from 64% (95% CI 52% to 76%) in Pfannenberg 2007 to 87% (95% CI 73% to 96%) in Dellestable 2011 (Figure 21).
Summary sensitivity from the four studies was 73.4% (95% CI 63.6% to 81.3%) and specificity 71.9% (95% CI 64.3% to 78.5%) (920 lesions, 571 metastases) (Appendix 13; Table B).
MRI. The same four studies considered MRI for the detection of distant metastasis (Dellestable 2011;Hausmann 2011;Jouvet 2014;Pfannenberg 2007). Sensitivity ranged from 61% (95% CI 50% to 72%) in Jouvet 2014, to 87% (95% CI 82% to 92%) in Pfannenberg 2007, and specificity from 68% (95% CI 64% to 87%) in Jouvet 2014 to 97% (95% CI 70% to 83%) in Dellestable 2011 (Figure 21).
Summary sensitivity from the four studies was 74.5% (95% CI 62.1% to 83.9%) and specificity 85.8% (95% CI 70.4% to 93.9%) (926 lesions, 579 metastases) (Appendix 13; Table B).
The low sensitivity and specificity observed in Jouvet 2014 were improved to 79% (95% CI 69% to 87%) and 80% (95% CI 68% to 89%) with the addition of VIBE sequences but with overlapping confidence intervals.
PET‐CT. Four studies evaluated PET‐CT for the detection of nodal metastasis (Cachin 2014;Dellestable 2011;Jouvet 2014;Pfannenberg 2007). Sensitivities ranged from 66% (95% CI 49% to 80%) in Dellestable 2011 to 93% (95% CI 89% to 96%) in Pfannenberg 2007, and specificities from 58% (95% CI 46% to 70%) in Cachin 2014 to 91% (95% CI 81% to 97%) in Jouvet 2014 (Figure 21).
Summary sensitivity from the four studies was 81.0% (95% CI 67.5% to 90.0%) and specificity 78.5% (95% CI 61.0% to 89.5%) (618 lesions, 382 metastases) (Appendix 13; Table B).
Comparison between tests. The statistical model comparing the three sets of pooled estimates showed no statistically significant differences in sensitivity (P = 0.22) or specificity (P = 0.89) between tests (Appendix 13; Table B).
Three studies in mixed population groups provided a direct comparison of CT, MRI, and PET‐CT (Dellestable 2011;Jouvet 2014;Pfannenberg 2007); Hausmann 2011 also compared CT and MRI. Two studies included the same total numbers of lesions and metastases per test (Hausmann 2011;Pfannenberg 2007), and two included only those lesions detected by each test so that the number of lesions varied per test (Dellestable 2011;Jouvet 2014). The direct comparisons between tests in these studies are plotted as ROC space in Figure 22,Figure 23, and Figure 24. No statistically significant differences in sensitivity were observed in any of the direct comparisons, but the specificity of MRI (85.8%, 95% CI 70.4% to 93.9%) was significantly higher than CT (by 13.9%, 95% CI 0.43% to 27.3%; P = 0.043) (Appendix 13; Table C).

ROC plot of direct comparisons between CT and MRI for the detection of distant metastases in mixed population group studies (per lesion data).

ROC plot of direct comparisons between CT and PET‐CT for the detection of distant metastases in mixed population group studies (per lesion data).

ROC plot of direct comparisons between MRI and PET‐CT for the detection of distant metastases in mixed population group studies (per lesion data).
Results: detection of distant metastases by metastatic site
Four studies conducted in mixed or not clearly described population groups reported per lesion data according to metastatic site (Cachin 2014; Dellestable 2011; Jouvet 2014; Pfannenberg 2007). Appendix 14 presents sensitivities and specificities for all metastatic sites according to test for ease of comparison of accuracy across different sites. Sensitivity and specificity were not estimated for sites with fewer than five malignant or benign lesions. Forest plots of study data for each test by metastatic site are presented in Figure 25, Figure 26, Figure 27, and Figure 28. Summary estimates for indirect and direct comparisons of tests are presented in Appendix 13.

Forest plot of tests for the detection of bone metastasis in mixed population groups (per lesion data).

Forest plot of tests for the detection of lung metastasis in mixed population groups (per lesion data).

Forest plot of tests for the detection of liver metastasis in mixed population groups (per lesion data).

Forest plot of tests: 75 soft tissue metastasis ‐ PET‐CT ‐ MIXED (per lesion), 76 local/subcutaneous metastasis ‐ CT ‐ MIXED (per lesion), 77 local/subcutaneous metastasis ‐ MRI ‐ MIXED (per lesion), 78 local/subcutaneous metastasis ‐ MRI (DW + VIBE) ‐ MIXED (per lesion), 79 local/subcutaneous metastasis ‐ PET‐CT ‐ MIXED (per lesion).
Bone metastases
For the detection of metastases in the bone, CT performed the poorest in terms of sensitivity, which ranged from 50% (95% CI 23% to 77%) in Dellestable 2011 to 67% (95% CI 38% to 88%) in Jouvet 2014 in three studies, compared to 93% (95% CI 66% to 100%) in Dellestable 2011 to 100% in Jouvet 2014 and Pfannenberg 2007 for MRI, and 71% (95% CI 42% to 92%) in Dellestable 2011 to 91% (95% CI 77% to 98%) in Pfannenberg 2007 for PET‐CT (Figure 25).
Data could be pooled for CT and PET‐CT for two studies with more than five metastases and more than five benign lesions (Jouvet 2014;Pfannenberg 2007). For PET‐CT (85 lesions and 51 metastases), summary sensitivity was 90.2% (95% CI 78.5% to 95.9%) and specificity 88.2% (95% CI 72.5% to 95.5%) (Appendix 13). Summary sensitivity for CT was 26.2% lower (P = 0.001) at 64.0% (95% CI 49.9% to 76.0%) and specificity non‐significantly higher at 94.0% (95% CI 49.5% to 99.6%), (P = 0.56).
Lung metastases
For the detection of lung metastases (four studies), CT performed the best in terms of sensitivity, which ranged from 78% (95% CI 27% to 84%) in Hausmann 2011 to 100% (95% CI 75% to 100%) in Dellestable 2011 compared to 47% (95% CI 39% to 55%) in Hausmann 2011 to 87% (95% CI 75% to 95%) in Pfannenberg 2007 for MRI and 31% (95% CI 09% to 61%) in Dellestable 2011 to 100% (95% CI 69% to 100%) in Cachin 2014 for PET‐CT (Figure 26). For those studies with more than five disease negative lesions identified, specificities were consistently poor for CT compared to MRI or PET‐CT.
Data were pooled for CT and for MRI for three studies with more than five metastases and more than five benign lesions (Jouvet 2014;Pfannenberg 2007). For CT (312 lesions and 229 metastases), summary sensitivity was 90.6% (95% CI 75.7% to 96.8%) and specificity 43.8% (29.5% to 59.1%) (Appendix 13). Summary sensitivity for MRI was 34.9% lower (P = 0.054) at 55.7% (95% CI 24.0% to 83.4%) and specificity significantly higher at 91.3% (95% CI 77.3% to 97.0%) (P < 0.001).
Liver metastases
For liver metastases, only three studies included more than five metastatic lesions to allow comparison of sensitivities (Hausmann 2011;Jouvet 2014;Pfannenberg 2007). Both MRI ‐ Hausmann 2011;Jouvet 2014;Pfannenberg 2007 ‐ and PET‐CT ‐ Jouvet 2014;Pfannenberg 2007 ‐ had higher sensitivities compared to CT, but differences were significant only for Hausmann 2011 due to small numbers (Figure 27).
Three studies included more than five benign lesions to allow comparison of specificities. Specificities were 90% or more for CT, MRI, and PET‐CT in Dellestable 2011, but the number of benign lesions detected by each test varied from 17 (for CT) to 22 (for MRI). Hausmann 2011 reported specificity to be higher for MRI (100%) compared to CT (50%), but specificities were consistently high for CT, MRI, and PET‐CT (87% to 100%) in Jouvet 2014.
No statistical pooling could be undertaken for this target condition.
Local or subcutaneous metastases and soft tissue metastases
The detection of local or subcutaneous metastases was reported in three studies. Overall PET‐CT appeared more sensitive than MRI (sensitivities 90% ‐ Pfannenberg 2007 ‐ and 100% ‐ Jouvet 2014 ‐ compared to 70% and 78% for MRI, respectively) and MRI more sensitive in comparison to CT (sensitivities 78% ‐ Pfannenberg 2007 ‐ and 100% ‐ Hausmann 2011 ‐ compared to CT (sensitivities 64% ‐ Pfannenberg 2007 ‐ and 82% ‐ Hausmann 2011), but lesion numbers were small and confidence intervals overlapping. No clear differences in specificities were observed (Figure 28).
Brain metastases
Only two studies included sufficient numbers of imaging abnormalities of the brain to allow sensitivity to be estimated for CT and MRI (Jouvet 2014), and for PET‐CT (Cachin 2014). The lowest sensitivity was observed for diffusion weighted MRI (65%, 95% CI 41% to 85%); however the addition of VIBE sequences increased sensitivity to 100% (95% CI 83% to 100%) (23 lesions identified, 20 confirmed metastases). In comparison, the sensitivity of CT was 95% (95% CI 75% to 100%).
In Cachin 2014, the sensitivity of PET‐CT for detection of brain metastases was 22% (95% CI 3% to 60%) (nine lesions identified, seven confirmed metastases).
Three additional studies conducted in mixed or unclear populations reported some data on the detection of brain metastases, but numbers were insufficient to include 2×2 contingency tables. In Strobel 2007b, a single confirmed brain metastasis was described as detected on PET‐CT. Two studies evaluated whole body PET‐CT in combination with MRI of the brain (Aukema 2010a;Aukema 2010b). In Aukema 2010a, MRI detected two confirmed brain metastases in one patient, and in Aukema 2010b, five confirmed brain metastases were detected ‐ four in patients with multiple metastases detected by PET‐CT and one solitary brain metastasis. Neither study reported the detection of any benign imaging abnormalities.
Appendix 13. Summary estimates of sensitivities and specificities from mixed or unclear population studies
Table A Summary estimates for tests evaluated in mixed study populations, per patient data
| Test Target condition | Studies | Participants (cases) | Sensitivity (95% CI) % | Specificity (95% CI) % |
| Any metastasis | ||||
| PET‐CT | 6 | 591 (268) | 91.1 (83.6 to 95.3) | 93.8 (85.1 to 97.6) |
Table B Indirect comparison of imaging tests from mixed study populations, per lesion data
| Test Target condition | Studies | Participants (cases) | Sensitivity (95% CI) % | Specificity (95% CI) % |
| Detection of any metastasis | ||||
| CT | 5 | 1770 (1064) | 81.3 (76.8 to 85.1) | 71.2 (53.9 to 83.9) |
| MRI | 4 | 1556 (927) | 76.4 (70.6 to 81.4) | 83.0 (71.9 to 90.3) |
| PET‐CT | 5 | 1138 (709) | 90.7 (69.0 to 97.7) | 84.5 (69.7 to 92.9) |
| Difference (P value) | 0.17 | 0.29 | ||
| Detection of nodal metastasis | ||||
| CT | 4 | 629 (348) | 87.2 (76.5 to 93.4) | 69.2 (34.6 to 90.5) |
| MRI | 4 | 630 (348) | 83.9 (68.9 to 92.5) | 78.1 (72.1 to 83.1) |
| PET‐CT | 4 | 288 (176) | 86.4 (80.5 to 90.7) | 89.1 (53.1 to 98.3) |
| Difference (P value) | 0.22 | 0.89 | ||
| Detection of distant metastasis | ||||
| CT | 4 | 920 (571) | 73.4 (63.6 to 81.3) | 71.9 (64.3 to 78.5) |
| MRI | 4 | 926 (579) | 74.5 (62.1 to 83.9) | 85.8 (70.4 to 93.9) |
| PET‐CT | 4 | 618 (382) | 81.0 (67.5 to 90.0) | 78.5 (61.0 to 89.5) |
| Difference (P value) | 0.58 | 0.21 | ||
Table C Direct comparisons of imaging tests from mixed study populations, per lesion data
| Test Target condition | Studies | Participants (cases) | Sensitivity (95% CI) % | Specificity (95% CI) % |
| Detection of any metastasis | ||||
| CT | 4 | 1538 (913) | 79.6 (76.0 to 82.8) | 73.8 (51.5 to 88.2) |
| MRI | 4 | 1556 (927) | 76.4 (70.6 to 81.4) | 83.0 (71.9 to 90.3) |
| Difference % (95% CI), P value | 3.19 (‐3.25 to 9.64), P = 0.33 | ‐9.21 (‐30.1 to 11.7), P = 0.39 | ||
| Detection of any metastasis | ||||
| PET‐CT | 4 | 962 (624) | 93.2 (63.9 to 99.1) | 88.8 (80.6 to 93.8) |
| CT | 4 | 946 (609) | 82.3 (76.6 to 86.9) | 75.8 (58.9 to 87.2) |
| Difference % (95% CI), P value | 10.9 (‐3.08 to 24.8), P = 0.13 | 13.0 (‐2.66 to 28.7), P = 0.10 | ||
| Detection of any metastasis | ||||
| PET‐CT | 3 | 730 (473) | 83.1 (65.3 to 92.8) | 87.3 (76.7 to 93.5) |
| MRI | 3 | 732 (472) | 77.4 (70.6 to 82.9) | 83.1 (72.9 to 90.0) |
| Difference % (95% CI), P value | 5.79 (‐4.67 to 16.3), P = 0.28 | 4.20 (‐11.6 to 20.0), P = 0.60 | ||
| Detection of nodal metastasis | ||||
| CT | 4 | 629 (348) | 87.2 (76.5 to 93.4) | 69.2 (34.6 to 90.5) |
| MRI | 4 | 630 (348) | 83.7 (68.8 to 92.3) | 77.7 (72.4 to 82.1) |
| Difference % (95% CI), P value | 3.41 (‐10.8 to 17.6), P = 0.64 | ‐8.45 (‐39.7 to 22.8), P = 0.60 | ||
| Detection of nodal metastasis | ||||
| PET‐CT | 3 | 249 (156) | 86.5 (80.2 to 91.1) | 92.5 (85.0 to 96.4) |
| CT | 3 | 250 (156) | 89.0 (71.9 to 96.2) | 74.5 (64.7 to 82.3) |
| Difference % (95% CI), P value | ‐2.44 (‐14.9 to 10.0), P = 0.70 | 18.0 (7.69 to 28.3), P = 0.001 | ||
| Detection of nodal metastasis | ||||
| PET‐CT | 3 | 249 (156) | 86.5 (80.2 to 91.1) | 92.5 (85.0 to 96.4) |
| MRI | 3 | 251 (156) | 86.1 (63.1 to 95.7) | 78.9 (69.6 to 86.0) |
| Difference % (95% CI), P value | 0.48 (‐15.8 to 16.8), P = 0.95 | 13.5 (3.73 to 23.3), P = 0.007 | ||
| Detection of distant metastasis | ||||
| CT | 4 | 920 (571) | 73.4 (63.6 to 81.3) | 72.0 (64.3 to 78.5) |
| MRI | 4 | 926 (579) | 74.5 (62.1 to 83.9) | 85.8 (70.4 to 93.9) |
| Difference % (95% CI), P value | ‐1.10 (‐15.2 to 13.0), P = 0.88 | ‐13.9 (‐27.3 to ‐0.43), P = 0.043 | ||
| Detection of distant metastasis | ||||
| PET‐CT | 3 | 481 (317) | 81.8 (63.1 to 92.2) | 83.5 (68.0 to 92.3) |
| CT | 3 | 475 (308) | 76.0 (62.6 to 85.7) | 74.2 (61.9 to 83.6) |
| Difference % (95% CI), P value | 5.77 (‐12.7 to 24.2), P = 0.54 | 9.35 (‐6.85 to 25.5), P = 0.26 | ||
| Detection of distant metastasis | ||||
| PET‐CT | 3 | 481 (317) | 81.8 (63.1 to 92.2) | 83.5 (68.0 to 92.3) |
| MRI | 3 | 481 (316) | 77.0 (61.7 to 87.4) | 83.8 (59.8 to 94.8) |
| Difference % (95% CI), P value | 4.78 (‐14.6 to 24.1), P = 0.63 | ‐0.33 (‐21.1 to 20.4), P = 0.98 | ||
Table D Direct comparisons of tests by metastatic site
| Test | Studies | Participants (cases) | Sensitivity (95% CI) % | Specificity (95% CI) % |
| Detection of bone metastasis | ||||
| PET‐CT | 2 | 85 (51) | 90.2(78.5 to 95.9) | 88.2 (72.5 to 95.5) |
| CT | 2 | 83 (50) | 64.0 (49.9 to 76.0) | 94.0 (49.5 to 99.6) |
| Difference % (95% CI), P value | 26.2 (10.6 to 41.8), P=.001 | ‐5.73(‐24.8 to 13.3), P=0.56 | ||
| Detection of lung metastasis | ||||
| CT | 3 | 312 (229) | 90.6 (75.7 to 96.8) | 43.8 (29.5 to 59.1) |
| MRI | 3 | 312 (229) | 55.7 (24.0 to 83.4) | 91.3 (77.3 to 97.0) |
| Difference % (95% CI), P value | 34.9 (‐0.61 to 70.4 ), P=0.054 | ‐47.5 (‐65.2 to ‐29.8), P<0.001 | ||
| Detection of local or subcutaneous metastasis | ||||
| CT | 2 | 126 (92) | 71.8 (57.6 to.82.7 ) | 64.7 (47.6 to 78.7) |
| MRI | 2 | 126 (92) | 96.2 (31.1 to 99.9) | 70.6 (53.4 to 83.3) |
| Difference % (95% CI), P value | ‐24.4 (‐43.9 to ‐4.86), P=0.01 | ‐5.88 (‐28.1 to 16.3), P=0.60 | ||
| Detection of local or subcutaneous metastasis | ||||
| PET‐CT | 2 | 95 (66) | 90.9 (81.2 to 95.9) | 65.5 (46.9 to 80.3) |
| MRI | 2 | 102 (69) | 76.8 (65.4 to 85.2) | 69.7 (52.3 to 82.9) |
| Difference % (95% CI), P value | 14.1 (1.96 to 26.2), P=0.02 | ‐4.18 (‐27.5 to 19.2), P=0.73 | ||
| Detection of local or subcutaneous metastasis | ||||
| MRI | 3 | 148 (102) | 89.7 (53.7–98.5) | 71.7 (57.2–82.8) |
Appendix 14. Sensitivity and specificity of imaging tests by metastatic site
| Study Population group | No. pts Lesions/ cases | Test | Distant | Bone | Lung | Liver | Skin/subcutaneous | Other | ||||
| Sensitivity: [95% CI]% TP/Dis Specificity: [95% CI]% TN/No Dis | Sensitivity [95% CI] % TP/Dis | Specificity [95% CI] % TN/No Dis | Sensitivity [95% CI] % TP/Dis | Specificity [95% CI] % TN/No Dis | Sensitivity [95% CI] % TP/Dis | Specificity [95% CI] % TN/No Dis | Sensitivity [95% CI] % TP/Dis | Specificity [95% CI] % TN/No Dis | Sensitivity: [95% CI] % Specificity: [95% CI]% TN/No Dis | |||
| CT | ||||||||||||
| Mixed | 40 118/72 (no. varies per test) | CT (CE) | Incl brain: Se: 59 [42 to 74] 24/41 Sp: 87 [73 to 96] 34/39 | 50 [23 to 77] 7/14 | Insufficient data (3/3 detected) | 100 [75 to 100] 13/13 | Insufficient data (2/3 detected) | Insufficient data (2/4 detected) | 100 17/17 | Distant minus bone, lung, liver mets Se: 20 [3 to 56] 2/10 Sp: 75 [48 to 93] 12/16 | ||
| Unclear | 33 824/455 (all detected by ≥ 1 test) | CT (CE) | Excl brain: Se: 71 [65 to 76] 186/263 Sp: 71 [64 to 77] 129/182 | (n = 1) | (n = 1) | 78 [70 to 84] 113/145 | 52 27/52 | 39 [23 to 58] 13/33 | 50 17/34 | Subcutaneous: 82 [65 to 93] 27/33 | Subcutaneous: 54 7/13 | Adrenal, spleen, muscle, kidney plus ‘other’a: Se: 63 [49 to 76] 33/52 Sp: 94 [86 to 98] 78/83 |
| Unclear | 37 218/125 (no. varies per test) | CT (CE) | Incl brain: Se: 88 [80 to 94] 81/92 Sp: 73 [61 to 84] 47/63 Excl brain: Se: 86 [76 to 93] 62/72 Sp: 72 [59 to 83] 44/61 | 67 [38 to 88] 10/15 | 100 18/18 | 94 [79 to 99] 29/31 | 36 5/14 | 83 [52 to 98] 10/12 | 87 13/15 | Subcutaneous: 2/2 | Subcutaneous: 62 [32 to 86] 8/13 | Brain: Se: 95 [75 to 100] 19/20 Sp: 3/3 lesions correctly identified as benign Otherb: 13/13 correctly identified; 1 (small bowel) missed by CT |
| Pfannenberg 2007 Mixed | 64 420/297 (all suspicious on ≥ 1 test) | CT (CE) | Excl brain: Se: 77 [71 to 83] 151/195 Sp: 64 [52 to 76] 43/67 | 63 [45 to 79] 22/35 | 80 12/15 | 96 [87 to 100] 51/53 | 29 5/17 | 80 [63 to 92] 28/34 | Insufficient data (1/2 detected) | 64 [51 to 76] 38/59 | 71 15/21 | ‘Other viscera’c: Se: 92 [64 to 100] 12/13 Sp: 83 [52 to 98] 10/12 Brain metastases excludedd |
| MRI | ||||||||||||
| Mixed | 40 118/72 (no. varies per test) | MRI (DW) | Incl brain: Se: 77 [61 to 89] 30/39 Sp: 97 37/38 | 93 13/14 | Insufficient data (2/0 detected) | 62 8/13 | Insufficient data (1/1 detected) | Insufficient data (4/4 detected) | 100 22/22 | Distant minus bone, lung, liver mets Se: 63 [24 to 91] 5/8 Sp: 92 [64 to 100] 12/13 | ||
| Unclear | 33 824/455 (all detected by ≥ 1 test) | MRI (NR) | Excl brain: Se: 67 [61 to 73] 177/263 Sp: 91 [85 to 94] 165/182 | Insufficient data (1/1 detected) | Insufficient data (1/1 detected) | 47 68/145 | 96 50/52 | 85 28/33 | 100 34/34 | Subcutaneous: 100 33/33 | Subcutaneous: 77 10/13 | Adrenal, spleen, muscle, kidney plus ‘other’a: sensitivity: Se: 92 [81 to 98] 48/52 Sp: 86 [76 to 92] 71/83 |
| Unclear | 37 218/125 (no. varies per test) | MRI (DW) | Incl brain: Se: 62 [52 to 71] 63/102 Sp: 70 [57 to 81] 44/63 Excl brain: Se: 61[50 to 72] 50/82 Sp: 68 [55 to 80] 41/60 | 100 16/16 | 47 9/19 | 26 8/31 | 93 13/14 | 92 11/12 | 67 10/15 | Subcutaneous: 70 7/10 | Subcutaneous: 75 9/12 | Brain: Se: 65 [41 to 85] 13/20 Sp: 3/3 benign correctly identified Other 2: 13/13 correctly identified; 1 (small bowel) missed by MRI |
| MRI (DW + VIBE) | Incl brain: Se: 83 [75 to 90] 85/102 Sp: 81 [69 to 90] 51/63 Excl brain: Se: 79 [69 to 87] 65/82 Sp: 80 [68 to 89] 48/60 | 100 16/16 | 74 14/19 | 52 16/31 | 79 11/14 | 100 12/12 | 93 14/15 | Subcutaneous: 90 9/10 | Subcutaneous: 75 9/12 | Brain: Se: 100 [83 to 100] 20/20 Sp: 3/3 benign correctly identified Otherb: 13/13 correctly identified; 1 (small bowel) missed by MRI | ||
| Mixed | 64 420/297 (all suspicious on ≥ 1 test) | MRI (DW + VIBE) | Excl brain: Se: 87 [82 to 92] 170/195 Sp: 76 [64 to 86] 51/67 | 100 35/35 | 73 11/15 | 87 46/53 | 76 13/17 | 100 [90 to 100] 35/35 | Insufficient data (2/2 detected) | 78 46/59 | 67 14/21 | ‘Other viscera: sensitivity: 62 [32 to 86] 8/13 Sp: 92 [62 to 100] 11/12 Brain metastases excludedd |
| PET‐CT | ||||||||||||
| Mixed | 87 176/85 | PET‐CT (NR) | Incl brain: Se: 78 [67 to 88] 51/65 Sp: 58 [46 to 70] 42/72 | 86 12/14 | 86 12/14 | 100 10/10 | 100 10/10 | 2/2 | 71 [29 to 96] 5/7 | Skin: 86 [42 to 100] 6/7 | 0/2 | Brain: Se: 22 [3 to 60] 2/7 Sp: 2/7 Soft tissue metastasis: Sp: 75 [48 to 93] 12/16 Sp: 6/7 |
| Mixed | 40 118/72 (no. varies per test) | PET‐CT (CE) | Incl brain: Se: 66 [49 to 80] 27/45 Sp: 88 [73 to 96] 35/40 | 71 10/14 | 3/3 | 31 4/13 | 2/2 | 2/4 | 90 19/21 | Distant minus bone, lung, liver mets: Se: 92 [62 to 100] 11/12 Sp: 79 [49 to 95] 11/14 | ||
| Unclear | 37 218/125 (no. varies per test) | PET‐CT (CE) | Excl brain: Se: 75 [64 to 84] 61/81 Sp: 91 [81 to 97] 52/57 | 88 14/16 | 75 18/19 | 48 15/31 | 100 14/14 | 100 12/12 | 100 15/15 | 100 | 63 5/8 | Other2: 13/13 correctly identified; 1 (small bowel) missed by CT |
| Mixed | 64 420/297 (all suspicious on ≥ 1 test) | PET‐CT (CE) | Excl brain: Se: 93[89 to 96] 182/195 Sp: 67 [55 to 78] 45/67 | 91 32/35 | 80 12/15 | 96 51/53 | 35 6/17 | 94 [81 to 99] 33/35 | 2/2 | 90 53/59 | 67 14/21 | ‘Other viscera’c: Se: 100 [75 to 100 13/13 Sp: 92 [62 to 100] 11/12 Brain metastases excludedd |
| a‘Other’ not further defined (Hausmann 2011). bFourteen ‘other metastatic sites described’, all assumed (by us) to be malignant adrenal (4), heart (2), spleen (2), peritoneal carcinosis (2), breast (1), pleura (1), vagina (1), and small intestine (1). cother visceral metastases such as bowel or peritoneal lesion (Pfannenberg 2007). dBrain metastases excluded from comparison of accuracy; reports 15 patients with cerebral metastases, “exclusively diagnosed by wbMRI” (Pfannenberg 2007). CE: contrast enhanced; CI: confidence interval; CT: computed tomography; Dis: diseased group; DW: diffusion weighted; excl: excluding; GE: gradient echo; incl: including; MRI: magnetic resonance imaging; No Dis: non‐diseased group; NR: not reported; PET: positron emission tomography; Se: sensitivity; Sp: specificity; TN: true negative; TP: true positive; U: unenhanced; US: ultrasound; WB: whole body. | ||||||||||||

Sample photographs of superficial spreading melanoma (left) and nodular melanoma (right). Copyright © 2010 Dr. Rubeta Matin: reproduced with permission.

Summary of 2015 NICE guideline recommendations for the management of cutaneous melanoma following primary diagnosis (NICE 2015a); not necessarily reflective of current practice.
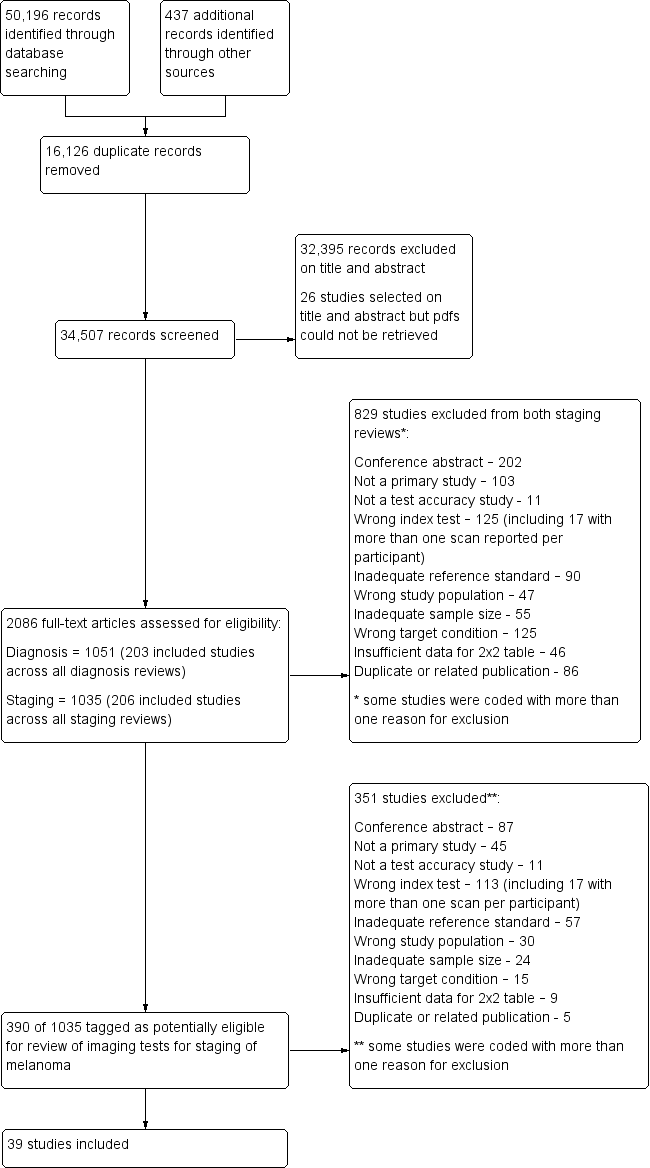
PRISMA flow diagram.

Risk of bias and applicability concerns graph: review authors' judgements about each domain presented as percentages across included studies.
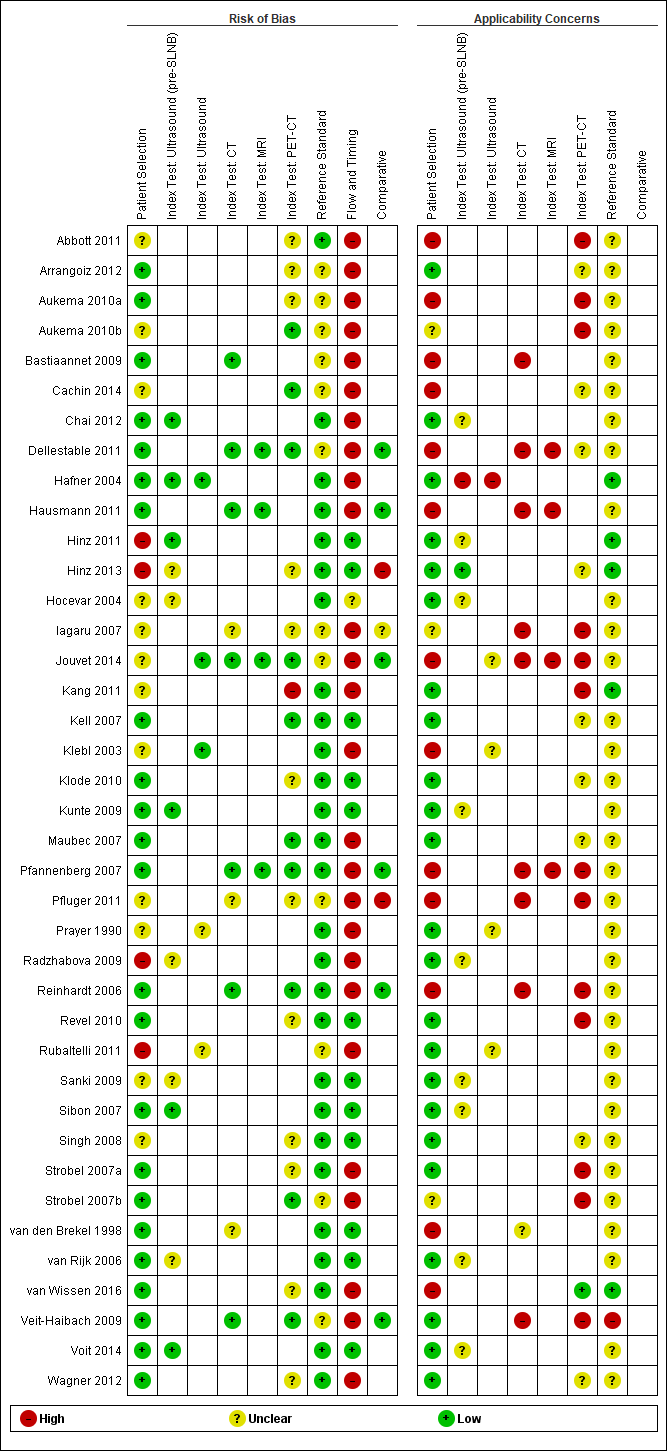
Risk of bias and applicability concerns summary: review authors' judgements about each domain for each included study.

Forest plot of all data for pre‐SLNB ultrasound, ultrasound plus FNAC, or PET‐CT for the detection of nodal metastasis.
(HN MM ‐ head and neck only malignant melanoma.)

Summary ROC plot comparing pre‐SLNB ultrasound vs ultrasound plus FNAC vs PET‐CT.

Forest plot of imaging for primary staging, for the detection of any metastases, nodal metastases, and distant metastases (per patient and per lesion data).

Forest plot of imaging for re‐staging of melanoma, for the detection of any metastases or nodal metastases (per patient and per lesion data).

Forest plot of tests for the detection of any metastases (mixed populations ‐ per patient data).

Forest plot of tests for the detection of any metastases (mixed populations ‐ per lesion data).

ROC plot of direct comparisons between CT and MRI for the detection of any metastases in mixed population group studies (per lesion data).

ROC plot of direct comparisons between CT and PET‐CT for the detection of any metastases in mixed population group studies (per lesion data).
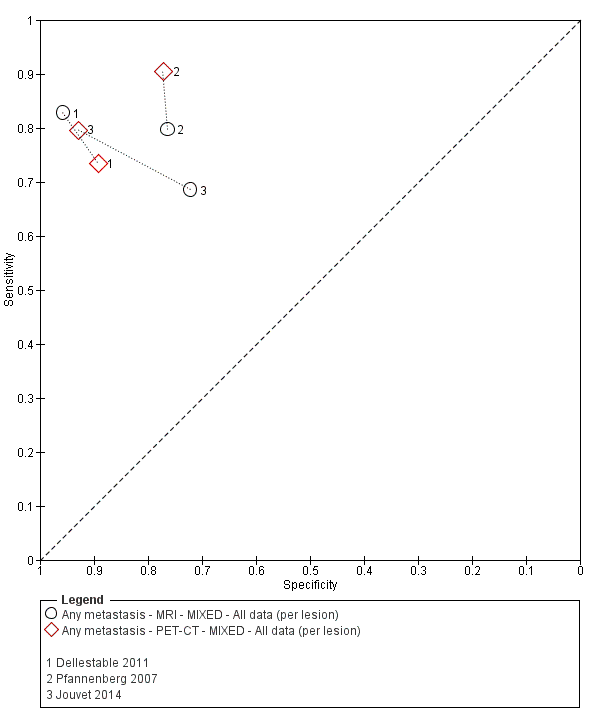
ROC plot of direct comparisons between MRI and PET‐CT for the detection of any metastases in mixed population group studies (per lesion data).

Forest plot of tests for the detection of nodal metastases (mixed populations ‐ per patient data).

Forest plot of tests for the detection of nodal metastases (mixed populations ‐ per lesion data).

ROC plot of direct comparisons between CT and MRI for the detection of nodal metastases in mixed population group studies (per lesion data).

ROC plot of direct comparisons between CT and PET‐CT for the detection of nodal metastases in mixed population group studies (per lesion data).

ROC plot of direct comparisons between MRI and PET‐CT for the detection of nodal metastases in mixed population group studies (per lesion data).

Forest plot of tests for the detection of distant metastases (mixed populations ‐ per patient data only).
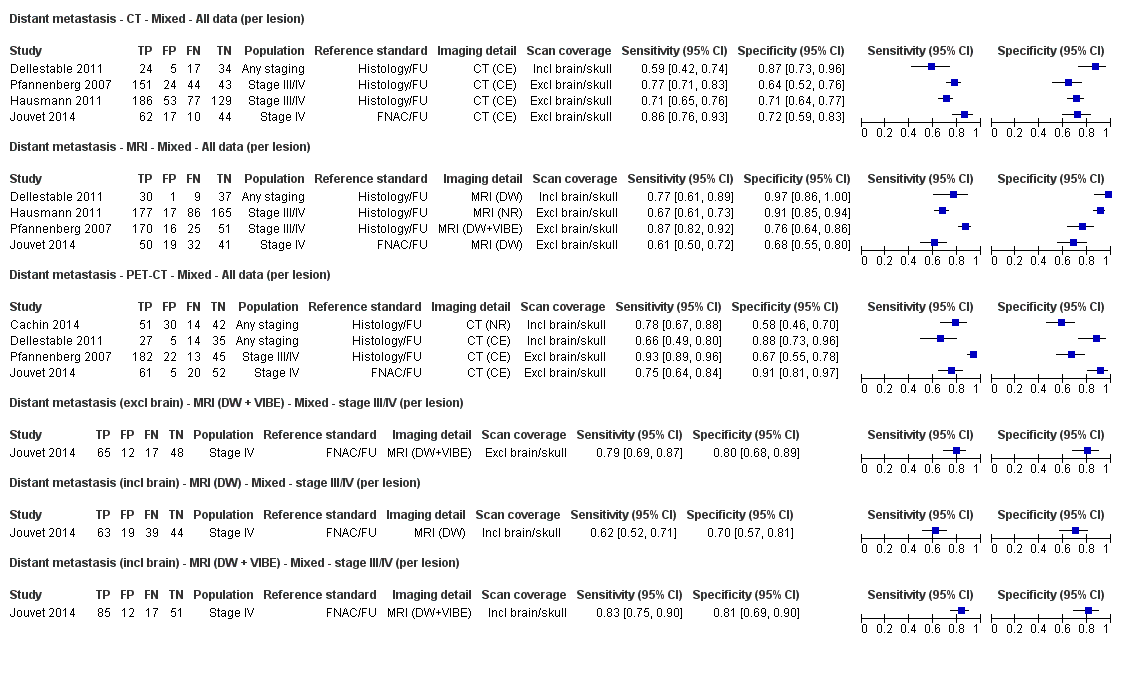
Forest plot of tests for the detection of distant metastases (per lesion data).

ROC plot of direct comparisons between CT and MRI for the detection of distant metastases in mixed population group studies (per lesion data).

ROC plot of direct comparisons between CT and PET‐CT for the detection of distant metastases in mixed population group studies (per lesion data).
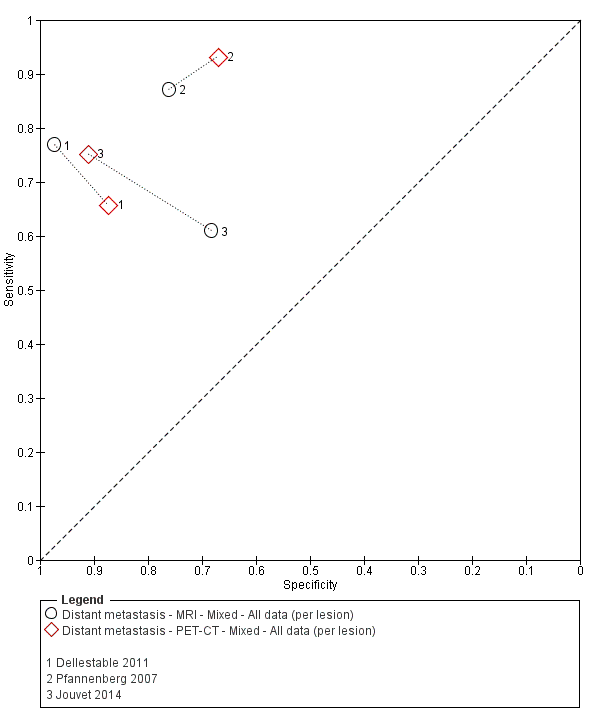
ROC plot of direct comparisons between MRI and PET‐CT for the detection of distant metastases in mixed population group studies (per lesion data).
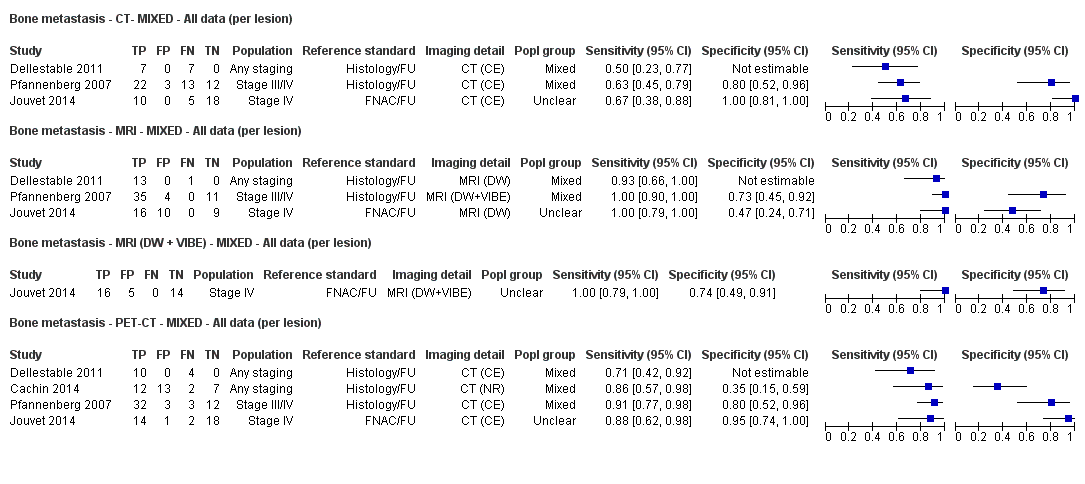
Forest plot of tests for the detection of bone metastasis in mixed population groups (per lesion data).
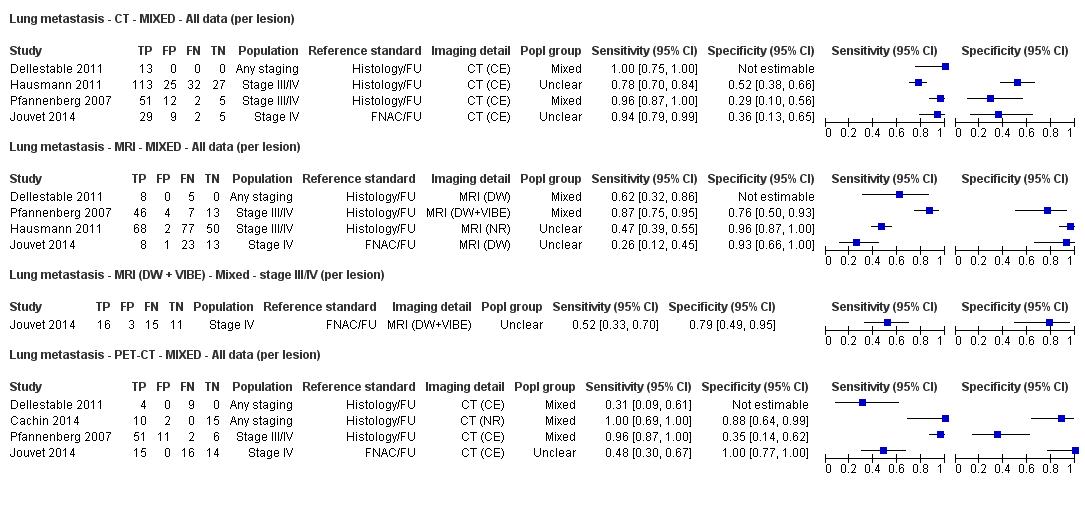
Forest plot of tests for the detection of lung metastasis in mixed population groups (per lesion data).
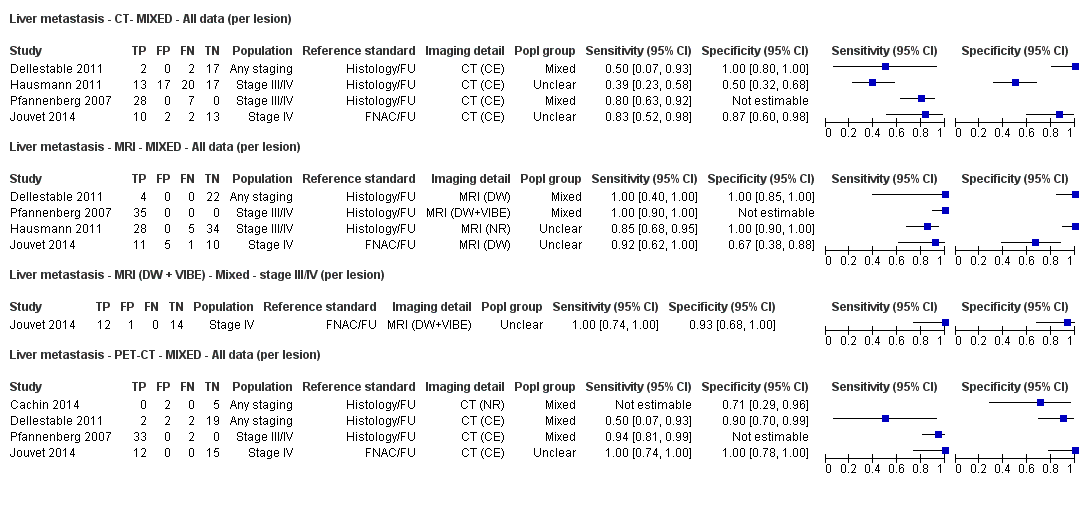
Forest plot of tests for the detection of liver metastasis in mixed population groups (per lesion data).

Forest plot of tests: 75 soft tissue metastasis ‐ PET‐CT ‐ MIXED (per lesion), 76 local/subcutaneous metastasis ‐ CT ‐ MIXED (per lesion), 77 local/subcutaneous metastasis ‐ MRI ‐ MIXED (per lesion), 78 local/subcutaneous metastasis ‐ MRI (DW + VIBE) ‐ MIXED (per lesion), 79 local/subcutaneous metastasis ‐ PET‐CT ‐ MIXED (per lesion).
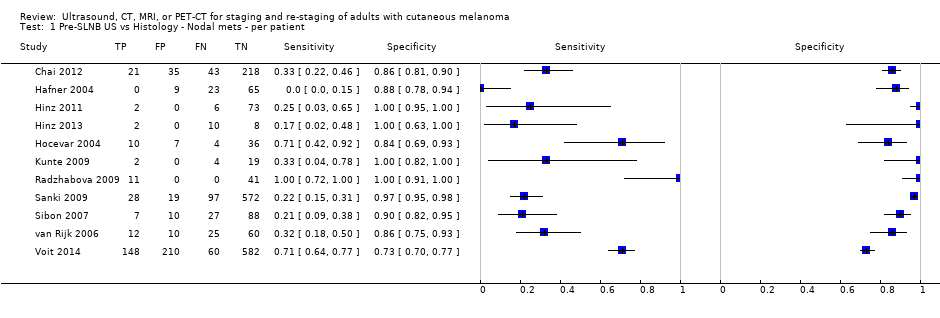
Pre‐SLNB US vs Histology ‐ Nodal mets ‐ per patient.
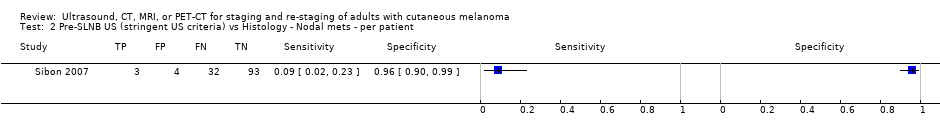
Pre‐SLNB US (stringent US criteria) vs Histology ‐ Nodal mets ‐ per patient.

Pre‐SLNB US‐FNAC ‐ Nodal mets ‐ per patient.

Pre‐SLNB PET‐CT vs Histology ‐ Nodal mets ‐ all SLNB ‐ per patient.
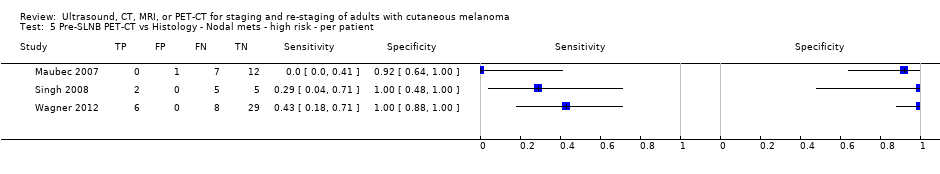
Pre‐SLNB PET‐CT vs Histology ‐ Nodal mets ‐ high risk ‐ per patient.

Pre‐SLNB PET‐CT vs Histology ‐ Nodal mets ‐ head and neck only ‐ per patient.

Pre‐SLNB PET‐CT vs Histology/FU ‐ Nodal mets ‐ high risk ‐ per patient.
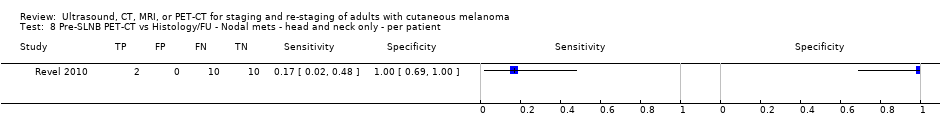
Pre‐SLNB PET‐CT vs Histology/FU ‐ Nodal mets ‐ head and neck only ‐ per patient.
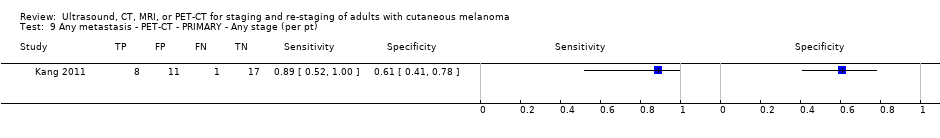
Any metastasis ‐ PET‐CT ‐ PRIMARY ‐ Any stage (per pt).
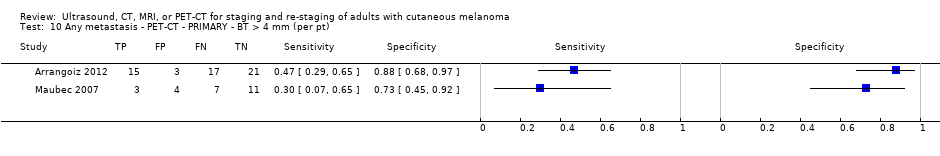
Any metastasis ‐ PET‐CT ‐ PRIMARY ‐ BT > 4 mm (per pt).
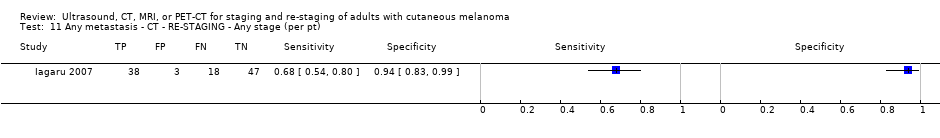
Any metastasis ‐ CT ‐ RE‐STAGING ‐ Any stage (per pt).
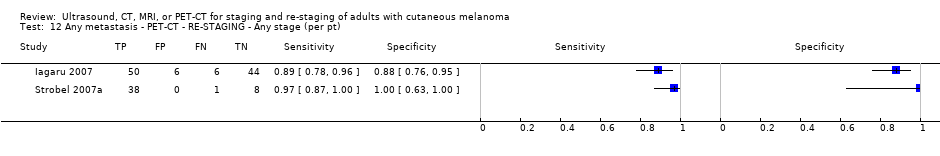
Any metastasis ‐ PET‐CT ‐ RE‐STAGING ‐ Any stage (per pt).

Any metastasis ‐ PET‐CT ‐ RE‐STAGING ‐ Stage IIIb or less (per pt).
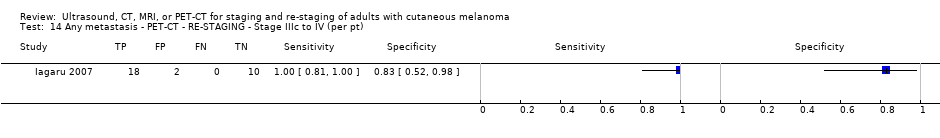
Any metastasis ‐ PET‐CT ‐ RE‐STAGING ‐ Stage IIIc to IV (per pt).

Any metastasis ‐ CT‐ MIXED ‐ All data (per pt).

Any metastasis ‐ PET‐CT ‐ MIXED ‐ All data (per pt).

Any metastasis ‐ PET‐CT (plus CT) ‐ Mixed ‐ Any stage (per pt).

Any metastasis ‐ PET‐CT ‐ RE‐STAGING ‐ Any stage (per lesion).

Any metastasis ‐ CT‐ MIXED ‐ All data (per lesion).

Any metastasis (incl brain) ‐ CT (U) ‐ MIXED (per lesion).

Any metastasis (incl brain) ‐ CT (CE) ‐ MIXED (per lesion).

Any metastasis ‐ MRI ‐ MIXED ‐ All data (per lesion).

Any metastasis (excl brain) ‐ MRI (DW + VIBE) ‐ MIXED (per lesion).

Any metastasis (incl brain) ‐ MRI (DW) ‐ MIXED (per lesion).

Any metastasis (incl brain) ‐ MRI (DW + VIBE) ‐ MIXED (per lesion).
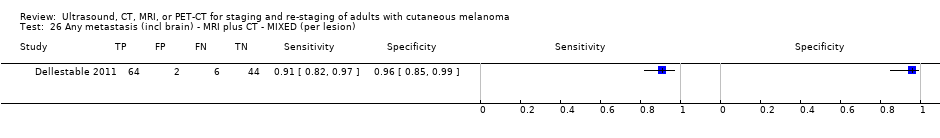
Any metastasis (incl brain) ‐ MRI plus CT ‐ MIXED (per lesion).

Any metastasis ‐ PET‐CT ‐ MIXED ‐ All data (per lesion).

Any metastasis (incl brain) ‐ PET‐CT (U) ‐ MIXED (per lesion).

Any metastasis (direct test comparisons) ‐ CT ‐ Mixed ‐ Stage III/IV (per lesion).

Any metastasis (direct test comparisons) ‐ MRI ‐ Mixed ‐ Stage III/IV (per lesion).
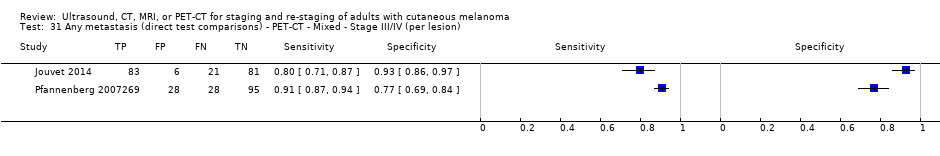
Any metastasis (direct test comparisons) ‐ PET‐CT ‐ Mixed ‐ Stage III/IV (per lesion).
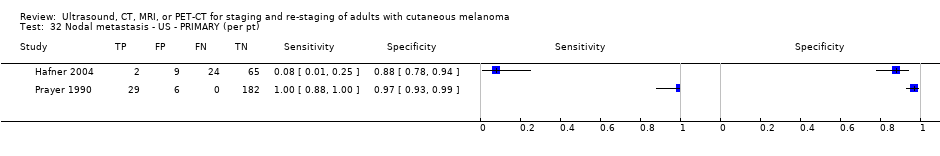
Nodal metastasis ‐ US ‐ PRIMARY (per pt).

Nodal metastasis ‐ CT ‐ PRIMARY (per pt).
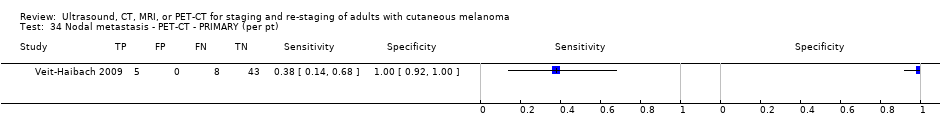
Nodal metastasis ‐ PET‐CT ‐ PRIMARY (per pt).
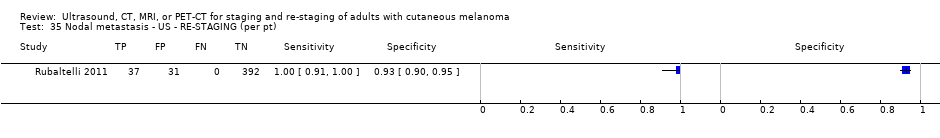
Nodal metastasis ‐ US ‐ RE‐STAGING (per pt).

Nodal metastasis ‐ US plus US (CE) ‐ RE‐STAGING (per pt).
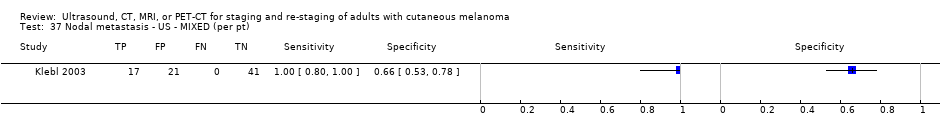
Nodal metastasis ‐ US ‐ MIXED (per pt).

Nodal metastasis ‐ CT ‐ MIXED (per pt).

Nodal metastasis (superficial groin) ‐ PET‐CT (indeterminate test positive) ‐ MIXED (per pt).
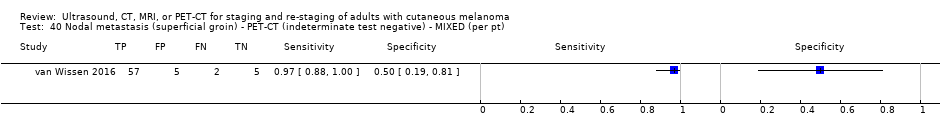
Nodal metastasis (superficial groin) ‐ PET‐CT (indeterminate test negative) ‐ MIXED (per pt).

Nodal metastasis (deep groin) ‐ PET‐CT (indeterminate test positive) ‐ MIXED (per pt).
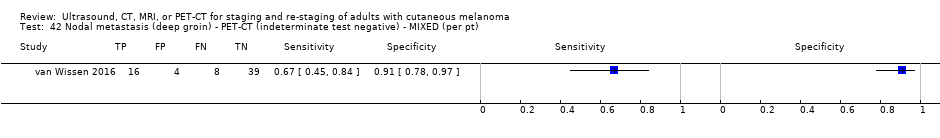
Nodal metastasis (deep groin) ‐ PET‐CT (indeterminate test negative) ‐ MIXED (per pt).

Nodal metastasis ‐ PET‐CT ‐ MIXED (per pt).

Nodal metastasis ‐ CT ‐ MIXED ‐ All data (per lesion).

Nodal metastasis ‐ MRI ‐ MIXED ‐ All data (per lesion).

Nodal metastasis ‐ MRI (DW + VIBE) ‐ MIXED (per lesion).
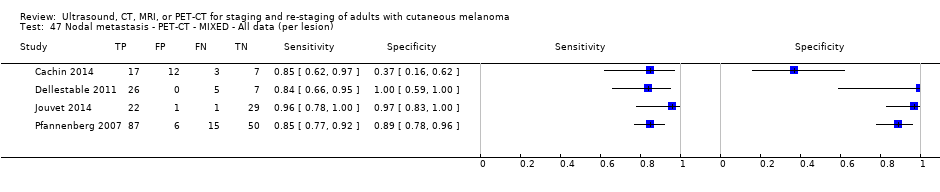
Nodal metastasis ‐ PET‐CT ‐ MIXED ‐ All data (per lesion).

Superficial nodal metastasis ‐ US ‐ Mixed ‐ stage IV (per LNB).
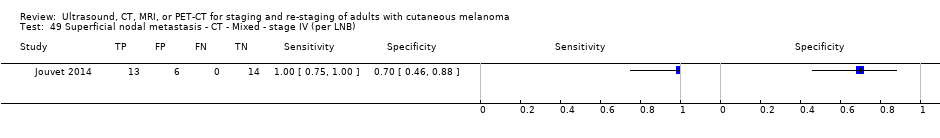
Superficial nodal metastasis ‐ CT ‐ Mixed ‐ stage IV (per LNB).

Superficial nodal metastasis ‐ MRI ‐ Mixed ‐ stage IV (per LNB).

Superficial nodal metastasis ‐ MRI (DW + VIBE) ‐ Mixed ‐ Stage IV (per lesion).

Superficial nodal metastasis ‐ PET‐CT ‐ Mixed ‐ stage IV (per LNB).

Distant metastasis ‐ CT ‐ PRIMARY (per pt).

Distant metastasis ‐ PET‐CT ‐ PRIMARY (per pt).
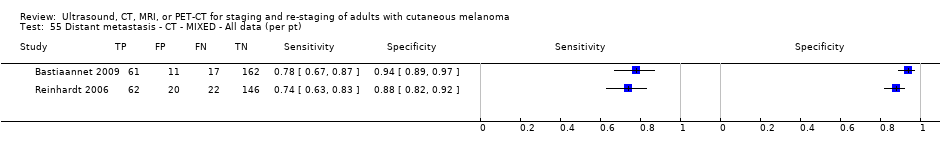
Distant metastasis ‐ CT ‐ MIXED ‐ All data (per pt).

Distant metastasis ‐ PET‐CT ‐ MIXED ‐ All data (per pt).

Distant metastasis ‐ CT ‐ Mixed ‐ All data (per lesion).

Distant metastasis ‐ MRI ‐ Mixed ‐ All data (per lesion).
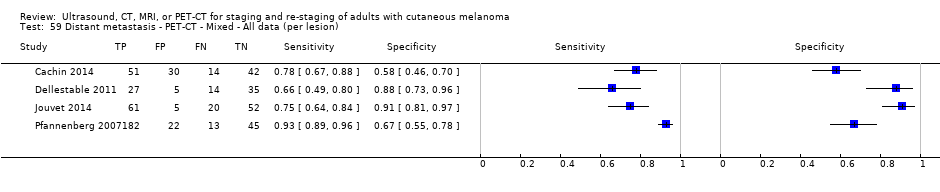
Distant metastasis ‐ PET‐CT ‐ Mixed ‐ All data (per lesion).
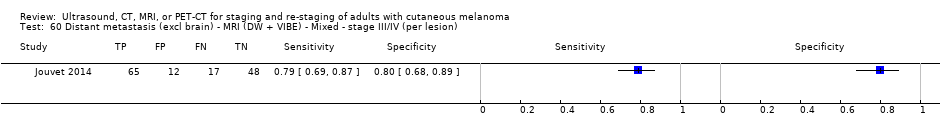
Distant metastasis (excl brain) ‐ MRI (DW + VIBE) ‐ Mixed ‐ stage III/IV (per lesion).
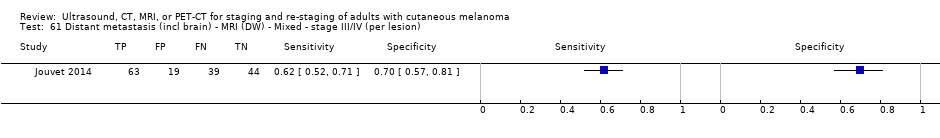
Distant metastasis (incl brain) ‐ MRI (DW) ‐ Mixed ‐ stage III/IV (per lesion).

Distant metastasis (incl brain) ‐ MRI (DW + VIBE) ‐ Mixed ‐ stage III/IV (per lesion).
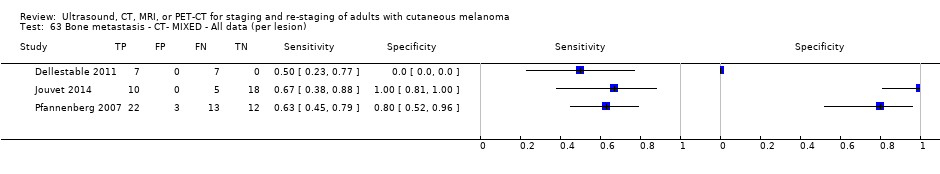
Bone metastasis ‐ CT‐ MIXED ‐ All data (per lesion).

Bone metastasis ‐ MRI ‐ MIXED ‐ All data (per lesion).
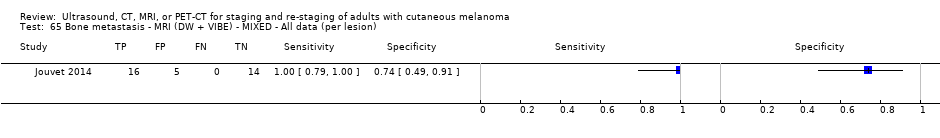
Bone metastasis ‐ MRI (DW + VIBE) ‐ MIXED ‐ All data (per lesion).
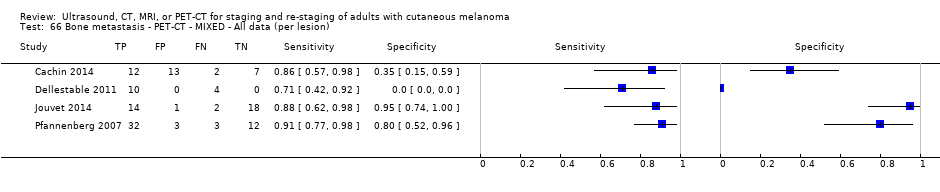
Bone metastasis ‐ PET‐CT ‐ MIXED ‐ All data (per lesion).

Liver metastasis ‐ CT‐ MIXED ‐ All data (per lesion).

Liver metastasis ‐ MRI ‐ MIXED ‐ All data (per lesion).
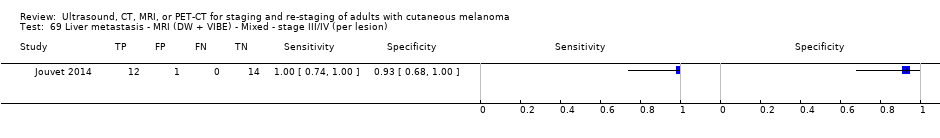
Liver metastasis ‐ MRI (DW + VIBE) ‐ Mixed ‐ stage III/IV (per lesion).

Liver metastasis ‐ PET‐CT ‐ MIXED ‐ All data (per lesion).
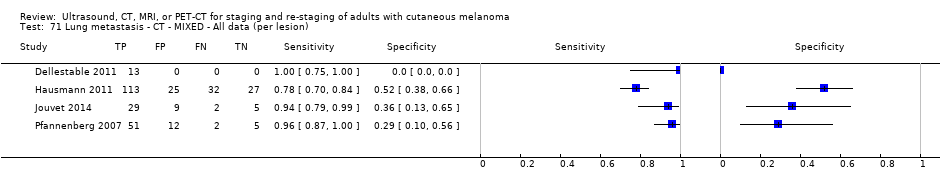
Lung metastasis ‐ CT ‐ MIXED ‐ All data (per lesion).

Lung metastasis ‐ MRI ‐ MIXED ‐ All data (per lesion).
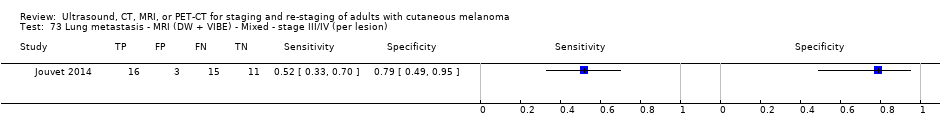
Lung metastasis ‐ MRI (DW + VIBE) ‐ Mixed ‐ stage III/IV (per lesion).
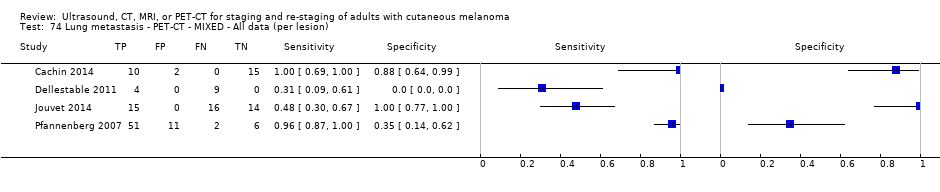
Lung metastasis ‐ PET‐CT ‐ MIXED ‐ All data (per lesion).

Soft tissue metastasis ‐ PET‐CT ‐ MIXED (per lesion).

Local/subcutaneous metastasis ‐ CT ‐ MIXED (per lesion).
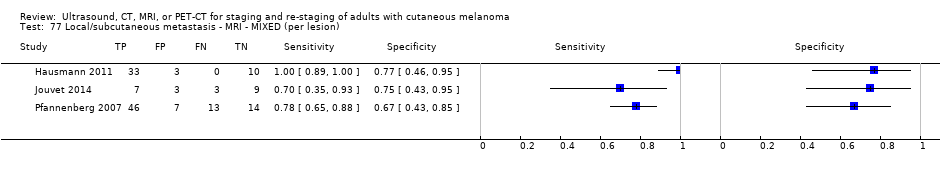
Local/subcutaneous metastasis ‐ MRI ‐ MIXED (per lesion).

Local/subcutaneous metastasis ‐ MRI (DW + VIBE) ‐ MIXED (per lesion).

Local/subcutaneous metastasis ‐ PET‐CT ‐ MIXED (per lesion).
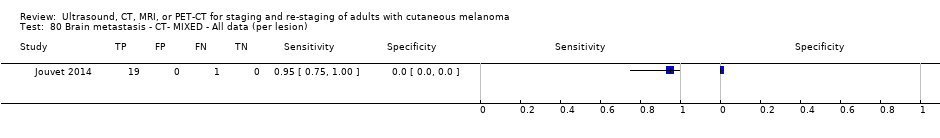
Brain metastasis ‐ CT‐ MIXED ‐ All data (per lesion).

Brain metastasis ‐ MRI (DW) ‐ MIXED ‐ All data (per lesion).
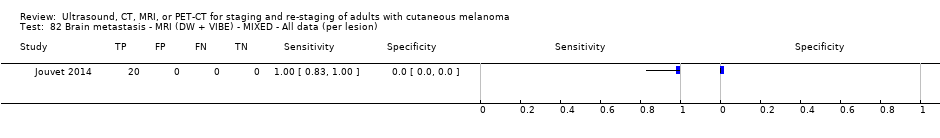
Brain metastasis ‐ MRI (DW + VIBE) ‐ MIXED ‐ All data (per lesion).

Brain metastasis ‐ PET‐CT ‐ MIXED ‐ All data (per lesion).

'Other' metastasis ‐ CT ‐ Mixed ‐ Any stage (per lesion).

'Other' metastasis ‐ MRI ‐ Mixed ‐ Any stage (per lesion).
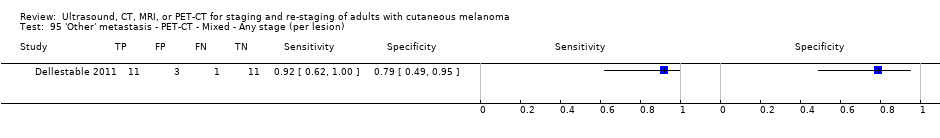
'Other' metastasis ‐ PET‐CT ‐ Mixed ‐ Any stage (per lesion).

'Other' metastasis ‐ CT ‐ Mixed ‐ stage III/IV (per lesion).
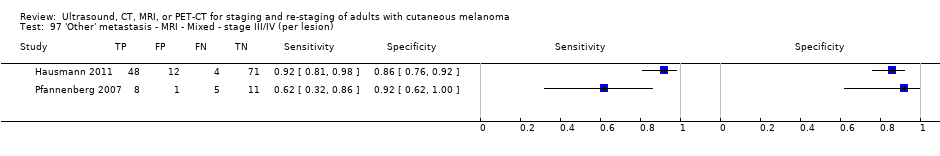
'Other' metastasis ‐ MRI ‐ Mixed ‐ stage III/IV (per lesion).

'Other' metastasis ‐ PET‐CT ‐ Mixed ‐ stage III/IV (per lesion).
| Question | How accurate is ultrasound, CT, MRI, or PET‐CT for staging or re‐staging of cutaneous invasive melanoma in adults? | ||||||
| Population: | Adults with a confirmed diagnosis of melanoma undergoing imaging for staging purposes:
| ||||||
| Index test(s): | Ultrasound with or without fine needle aspiration cytology (FNAC) Computed tomography (CT) Magnetic resonance imaging (MRI) Positron emission tomography–computed tomography (PET‐CT) | ||||||
| Comparator test: | All of the index tests may be used in comparison to each other | ||||||
| Target condition: | For pre‐SLNB imaging: detection of nodal metastases For all other imaging: detection of any metastases | ||||||
| Reference standard: | Histology plus clinical or imaging follow‐up | ||||||
| Action: | If accurate, positive results of imaging before SLNB in some circumstances could allow patients with nodal metastases to proceed directly to commence adjuvant therapy and avoid an additional invasive procedure (SLNB). Accurate whole body imaging will allow appropriate locoregional and systemic therapies to be initiated in a timely manner | ||||||
| Quantity of evidence (n = 39 studies) | Number of studies | Number of participants | Number of cases | ||||
| Per patient data: | 34 | 4980 | 1265 | ||||
| Per lesion data: | 7 | 417 (1846 lesions) | 1061 metastases | ||||
| Limitations | |||||||
| Risk of bias: | Some concerns due to poor reporting across almost all domains. Unclear risk for participant selection method (11/39) or exclusions not clearly described (3/39). High risk from exclusions on the basis of index test results (4/39). Low risk for the index test for pre‐SLNB ultrasound (6/11), other ultrasound evaluation (3/5), CT (7/10), and MRI (4/4). For PET‐CT, unclear risk from lack of description of blinded case note review to ascertain imaging results for retrospective studies (13/23) and high risk from data driven selection of test threshold (1/23). Unclear risk for reference standard from lack of detail on participant follow‐up schedules (12/39). Lack of blinding of the histological diagnosis (2/39) or data collection on follow‐up (3/39) to the index result. High risk from differential verification (20/39) and participant exclusions (13/39). Low risk for comparisons between tests (6/9) | ||||||
| Applicability of evidence to question: | High or unclear concern for applicability for almost all domains. High concern for participant selection from mixed populations (11/39) or data presented per lesion (5/39). Unclear concern from lack of clarity regarding study population. High concern for index tests from poor description of test thresholds (pre‐SLNB ultrasound (1/11), other ultrasound (1/5), CT (5/10), MRI (3/4), PET‐CT (4/23)) or consensus test interpretation (CT (6/10), MRI (2/4), PET‐CT (11/23)). Unclear concern for application and interpretation of the index test (pre‐SLNB US (10/11), CT (3/10), MRI (2/4), PET‐CT (6/23)) or unclear observer expertise (pre‐SLNB ultrasound (6/11), CT (3), MRI (2/4), PET‐CT (6/23)). Unclear concern for applicability of the reference standard from lack of description of the target condition or no breakdown of cases according to nodal or distant metastases. Expertise of the histopathologist poorly described (6/39) | ||||||
| Findings | |||||||
| Thirty‐nine studies reporting accuracy data for pre‐SLNB imaging (n = 18) or for whole body imaging (n = 24) were included. The 24 studies of whole body imaging were of primary staging (n = 6) or staging for potential recurrence of disease (n = 3), or were conducted in mixed or not clearly described populations (n = 15). As we are unable to make clear statements regarding the expected accuracy of imaging at any particular point on the clinical pathway for the mixed population group, the findings presented are based on results for pre‐SLNB imaging, and for primary staging and re‐staging of melanoma only. | |||||||
| Test: pre‐SLNB imaging | |||||||
| Test | Studies: patients (cases) | Sensitivity (95% CI) | Specificity (95% CI) | Numbers in a cohort of 1000 lesions at a median prevalence of 23.7%a | |||
| TP (95% CI) | FN (95% CI) | FP (95% CI) | TN (95% CI) | ||||
| US | 11: 2614 (542) | 35.4 (17.0 to 59.4) | 93.9 (86.1 to 97.5) | 84 (40 to 141) | 153 (197 to 96) | 47 (106 to 19) | 716 (657 to 744) |
| US + FNAC | 3: 1164 (259) | 18.0 (3.58 to 56.5) | 99.8 (99.1 to 99.9) | 43 (8 to 134) | 194 (229 to 103) | 2 (7 to 1) | 761 (756 to 762) |
| PET‐CT | 4: 170 (49) | 10.2 (4.31 to 22.3) | 96.5 (87.1 to 99.1) | 24 (10 to 53) | 213 (227 to 184) | 27 (98 to 7) | 736 (665 to 756) |
| Whole bodyimaging for primary staging of melanoma | |||||||
| Quantity of evidence (n = 6 studies) | Number of studies | Number of participants | Number of cases | ||||
| Any metastases | 3 | 81 | 51 | ||||
| Nodal metastases | 3 | 373 | 68 | ||||
| Distant metastases | 2 | 112 | 17 | ||||
| Findings | |||||||
| Four of the six studies evaluated PET‐CT, one in comparison to CT.
No data for MRI were identified. Results for ultrasound for the detection of nodal metastases (2 studies) were highly variable and likely subject to bias. | |||||||
| Whole bodyimaging for re‐staging of melanoma | |||||||
| Quantity of evidence (n = 3 studies) | Number of studies | Number of participants (lesions) | Number of cases (metastases) | ||||
| Any metastases: | 2 (1) | 153 (139) | 95 (87) | ||||
| Nodal metastases: | 1 | 460 | 37 | ||||
| Distant metastases: | 0 | N/A | N/A | ||||
| Findings: | |||||||
|
No data for MRI were identified. | |||||||
| aMedian prevalence observed across 11 studies of pre‐SLNB ultrasound (interquartile range: 25th percentile 20.5%, 75th percentile 25.4%). CT: computed tomography; FN: false negative; FNAC: fine needle aspiration cytology; FP: false positive; MRI: magnetic resonance imaging; PET: positron emission tomography; SLNB: sentinel lymph node biopsy; TN: true negative; TP: true positive. | |||||||
| Study | US | US‐ FNAC | CT | MRI | PET‐CT | Population group | Population detail | Reference standard | Any metastases | Distant metastases | Nodal metastases | Other sites |
| PRIMARY STAGING | ||||||||||||
| ‐ | ‐ | ‐ | ‐ | X | Primary (any); primary (pre‐SLNB) | BT > 4 mm | SLNB/CLND/FU | Per patient | Per patient | Per patient/ Pre‐SLNB | ‐ | |
| X | ‐ | ‐ | ‐ | ‐ | Primary (pre‐SLNB) | Standard SLNB | SLNB/CLND ± FU | ‐ | ‐ | Pre‐SLNB | ‐ | |
| X | ‐ | ‐ | ‐ | (X) | Primary (pre‐SLNB); primary | Standard SLNB | SLNB/CLND | ‐ | ‐ | Per patient/ | ‐ | |
| X | ‐ | ‐ | ‐ | ‐ | Primary (pre‐SLNB) | Standard SLNB | SLNB | ‐ | ‐ | Pre‐SLNB | ‐ | |
| X | ‐ | ‐ | ‐ | X | Primary (pre‐SLNB) | High risk (BT ≥ 2.0 mm or other RF) | SLNB | ‐ | ‐ | Pre‐SLNB | ‐ | |
| X | X | ‐ | ‐ | ‐ | Primary (pre‐SLNB) | Standard SLNB | SLNB/CLND | ‐ | ‐ | Pre‐SLNB | ‐ | |
| ‐ | ‐ | ‐ | ‐ | X | Primary (any) | All staging (incl N+) | Histology/FU | per patient | ‐ | ‐ | ‐ | |
| X | Primary (pre‐SLNB) | Standard SLNB | SLNB | ‐ | ‐ | Pre‐SLNB | ‐ | |||||
| ‐ | ‐ | ‐ | ‐ | X | Primary (pre‐SLNB) | Standard SLNB | SLNB | ‐ | ‐ | Pre‐SLNB | ‐ | |
| X | ‐ | ‐ | ‐ | ‐ | Primary (pre‐SLNB) | Standard SLNB | SLNB | ‐ | ‐ | Pre‐SLNB | ‐ | |
| ‐ | ‐ | ‐ | ‐ | X | Primary (any); primary (pre‐SLNB) | BT > 4 mm | SLNB/CLND ± FU | Per patient | ‐ | Pre‐SLNB | ‐ | |
| X | ‐ | ‐ | ‐ | ‐ | Primary (any) | All staging (incl N+) | CLND/FU | ‐ | ‐ | Per patient | ‐ | |
| X | ‐ | ‐ | ‐ | ‐ | Primary (pre‐SLNB) | Standard SLNB; any (incl N+) | SLNB ± FU | ‐ | ‐ | Pre‐SLNB | ‐ | |
| ‐ | ‐ | ‐ | ‐ | X | Primary (pre‐SLNB) | HN MM | SLNB | ‐ | ‐ | Pre‐SLNB | ‐ | |
| X | ‐ | ‐ | ‐ | ‐ | Primary (pre‐SLNB) | Standard SLNB | SLNB | Pre‐SLNB | ||||
| X | ‐ | ‐ | ‐ | ‐ | Primary (pre‐SLNB) | Standard SLNB | SLNB | ‐ | ‐ | Pre‐SLNB | ‐ | |
| ‐ | ‐ | ‐ | ‐ | X | Primary (pre‐SLNB) | Standard SLNB/BT > 4 mm | SLNB | ‐ | ‐ | Pre‐SLNB | ‐ | |
| X | X | ‐ | ‐ | ‐ | Primary (pre‐SLNB) | Standard SLNB | SLNB/CLND | ‐ | ‐ | pre‐SLNB | ‐ | |
| ‐ | ‐ | X | ‐ | X | Primary (any) | All staging (incl N+) | Histology/FU | ‐ | Per patient | Per patient | ‐ | |
| X | X | ‐ | ‐ | ‐ | Primary (pre‐SLNB) | Standard SLNB | SLNB/CLND | ‐ | ‐ | Pre‐SLNB | ‐ | |
| ‐ | ‐ | ‐ | ‐ | X | Primary (pre‐SLNB) | High risk (BT ≥ 4 mm or > 1 mm and ulcerated) | SLNB/CLND | ‐ | ‐ | Pre‐SLNB | ‐ | |
| RE‐STAGING | ||||||||||||
| ‐ | ‐ | X | ‐ | X | Re‐staging | Any re‐staging | Histology/FU | Per patient /Per lesion | ‐ | ‐ | ‐ | |
| X | ‐ | ‐ | ‐ | ‐ | Re‐staging | Any FU and suspicious on B‐mode US | FNAC/Histology/FU | ‐ | ‐ | Per patient | ‐ | |
| ‐ | ‐ | ‐ | ‐ | X | Re‐staging | High risk (BT > 4 mm, etc.), elevated S100 | Histology/Cytology/FU | Per patient | ‐ | ‐ | ‐ | |
| MIXED OR UNCLEARLY REPORTED | ||||||||||||
| ‐ | ‐ | ‐ | ‐ | X | Mixed | Stage III | Histology/FU | Per patient | ‐ | ‐ | ‐ | |
| ‐ | ‐ | ‐ | (X ‐ Brain) | X | Mixed | S100 positive | FNAC/Histology/Imaging FU | Per patient | ‐ | ‐ | ‐ | |
| ‐ | ‐ | ‐ | (X ‐ Brain) | X | Unclear | Node positive | FNAC/Histology/FU | Per patient | ‐ | ‐ | ‐ | |
| ‐ | ‐ | X | ‐ | (X) | Mixed | All node positive | Histology/FU | ‐ | Per patient | ‐ | ‐ | |
| ‐ | ‐ | ‐ | ‐ | X | Mixed | Stage III | Histology/Imaging/FU | Per patient/Per lesion | Per lesion | Per lesion | Per lesion | |
| ‐ | ‐ | X | X | X | Mixed | All staging | Histology/FU | Per lesion | Per lesion | Per lesion | Per lesion | |
| ‐ | ‐ | X | X | ‐ | Unclear | Stage III/IV | Histology/FU | Per lesion | Per lesion | Per lesion | Per lesion | |
| X | ‐ | X | X | X | Unclear | Stage IV | FNAC/FU | Per lesion | Per lesion | Per lesion | Per lesion | |
| X | ‐ | ‐ | ‐ | ‐ | Mixed | Clark IV/V in FU | Histology/FU | ‐ | ‐ | per patient | ‐ | |
| ‐ | ‐ | X | X | X | Mixed | Stage III/IV | Histology/Imaging/FU | Per lesion | Per patient | Per lesion | Per lesion | |
| ‐ | ‐ | X | ‐ | X | Mixed | All stage III | Histology/FU | Per patient | ‐ | ‐ | ‐ | |
| ‐ | ‐ | X | ‐ | X | Mixed | All staging (incl N+) | Histology/FU | Per patient | Per patient | Per patient | ‐ | |
| ‐ | ‐ | ‐ | ‐ | X | Unclear | High risk (BT > 4 mm, etc.) | Histology/Cytology/FU | Per patient | ‐ | ‐ | ‐ | |
| X | ‐ | ‐ | Mixed | HN MM and N+ | Histology | ‐ | ‐ | Per patient | ‐ | |||
| ‐ | ‐ | ‐ | ‐ | X | Mixed | Stage IIIB/IIIC palpable groin mets | Histology (combined groin dissection) | ‐ | ‐ | Per patient | ‐ | |
| BT: Breslow thickness; CLND: complete lymph node dissection; CT: computed tomography; FNAC: fine needle aspiration cytology; FU: follow‐up; HN: head and neck; MM: malignant melanoma; MRI: magnetic resonance imaging; mm: millimetre; N+: node positive; PET: positron emission tomography; RF: risk factor; SLNB: sentinel lymph node biopsy; US: ultrasound. | ||||||||||||
| Test | Studies | Participants (cases) | Sensitivity (95% CI), % | Specificity (95% CI), % |
| Comparison of imaging tests before SLNB | ||||
| Indirect comparison of imaging tests for detection of nodal metastasis (per patient data) | ||||
| US | 11 | 2614 (542) | 35.4 (17.0 to 59.4) | 93.9 (86.1 to 97.5) |
| US‐FNAC | 3 | 1164 (259) | 18.0 (3.58 to 56.5) | 99.8 (99.1 to 99.9) |
| PET‐CT | 4 | 170 (49) | 10.2 (4.31 to 22.3) | 96.5 (87.1 to 99.1) |
| Difference | P = 0.07 | P < 0.001 | ||
| Direct comparison of imaging tests for detection of nodal metastasis (per patient data) | ||||
| US | 3 | 1164 (259) | 58.7 (36.5 to 77.9) | 79.4 (70.0 to 86.4) |
| US‐FNAC | 3 | 1164 (259) | 18.0 (3.58 to 56.5) | 99.8 (99.1 to 99.9) |
| Difference | ‐40.7 (‐75.0 to ‐6.50), P = 0.02 | +20.4 (+12.2 to +28.6), P < 0.001 | ||
| Whole body imaging | ||||
| Imaging for re‐staging for the detection of any metastasis (per patient data) | ||||
| PET‐CT | 2a | 153 (95) | 92.6 (85.3 to 96.4) | 89.7 (78.8 to 95.3) |
| CI: confidence interval; CT: computed tomography; FNAC: fine needle aspiration cytology; PET: positron emission tomography; SLNB: sentinel lymph node biopsy; US: ultrasound. aWhere there were only two studies, estimates of summary sensitivity and summary specificity were obtained by using univariate fixed‐effect logistic regression models to pool sensitivities and specificities separately. | ||||
| Study Population group | Participant inclusion criteria and reported indications for imaging | Stage of disease on presentation | Imaging tests | Patients/cases (prevalence) [lesions/metastases (prevalence)] | Average no. metastases per patient |
| PER PATIENT DATA | |||||
| Mixed – primary or follow‐up | Undergoing FU after prior SLNB/CLND for micro‐metastases or presenting with clinically detectable nodal disease at or subsequent to initial diagnosis | Stage: IIIA 18, 53% | PET‐CT (NR) | 34/7 (21%) | N/A |
| Mixed – primary or re‐staging | Asymptomatic S100 positive. Previously treated for locoregional recurrence (n = 15) or distant metastases (n = 5); or with unfavourable primary tumour (n = 6), primary melanoma with simultaneous nodal metastases (n = 20) | Any (stage NR) | PET‐CT (U) | 46/23 (50%) | N/A |
| Unclear | Palpable and pathology proven lymph node metastases and no signs of distant metastases. Imaging to identify further ‘undetected’ disease | Stage III: 100% | PET‐CT (U) | 70/30 (43%) | N/A |
| Mixed – primary or re‐staging | Node positive (clinical or histology/cytology proven) candidates for CLND; imaging to identify further disease. Includes those with LN mets diagnosed at time of primary diagnosis 39, 15.5%; LN metastases identified ≤ 3 years since primary diagnosis 145, 57.8%; recurrence > 3 years since primary diagnosis 67, 26.7% | Stage III (100%) | CT (CE) | 251/78 (31%) distant metastases | N/A |
| Mixed ‐ staging or re‐staging | Any primary MM, visceral metastases, or cutaneous metastases from unknown primary | Any; 51% with metastases | PET‐CT (NR) | 67/39 (58%) [176/85 (48%)] | N/A |
| Mixed | Clark level IV or V undergoing FU after primary surgery. Reports primary (n = 8) and imaging during follow‐up (n = 75) | Any (NR) | US | 79/17 (22%) nodal | N/A |
| Mixed – primary, re‐staging, FU, disease response | All with PET‐CT for primary staging after sentinel node biopsy (n = 75); therapy control after chemotherapy of metastatic disease (n = 42); staging of clinically suspected recurrent disease (n = 65); during follow‐up within 5 years of primary treatment (n = 68) | Stage I 22, 9% Stage II 88, 35% Stage III 108, 43% Stage IV 32, 13% | CT (CE) PET‐CT (CE) | 250/116 (46%) | N/A |
| Unclear | High risk melanoma (BT > 4 mm, or Clark level III or IV, or known resected metastases) with PET‐CT for depiction or exclusion of metastases | Any (NR) | PET‐CT (CE) | 124/53 (43%) | N/A |
| Mixed ‐ primary and recurrence | Head and neck MM with CT before neck dissection, including therapeutic and elective (negative on palpation). "Interval between the treatment of the primary and the neck dissection ranged from 0 to 8.8 years (mean: 21 months)" | Stage I to II 8, 31% Stage III 18, 69% | CT (CE) | 26/21 (81%) nodal | N/A |
| Mixed ‐ primary and recurrence | Stage IIIB or IIIC MM with palpable groin metastases; selected for therapeutic combined groin dissection. Discussion states: "large proportion of our patients were initially treated for their primary tumour at other hospitals, and sometimes years prior to the current groin dissection" | All stage IIIB and C | PET‐CT (U) | 69/59 (superficial nodes 86%) 67/24 (deep nodes 36%) | N/A |
| PER LESION DATA | |||||
| Mixed ‐ staging or re‐staging | Any primary MM, visceral metastases, or cutaneous metastases from unknown primary. Lesions with equivocal focal uptake considered test positive Only 1 eligible index test | Any: 51% with metastases | CT (NR) | 67/39 (58%) [176/85 (48%)] | 1 (85/67) |
| Mixed ‐ primary or follow‐up | All with PET‐CT regardless of AJCC stage or indication for examination Number of lesions included varies per test | Stage I to II: 27.5% Stage III to IV: 72.5% | CT (CE) MRI (DW) PET‐CT | 40 [108/66 (61%)] [117/70 (60%)] [119/72 (61%)] | 2 (72/40) |
| Unclear | AJCC stage III or IV with positive SLNB or suspicious lesions on ultrasound or X‐ray studies Number of lesions included same per test | Stage III 38% Stage IV 62% | CT (CE) MRI (NR) | 33 All tests [824/455 (55%)] | 14 (455/33) |
| Unclear | AJCC stage IV. Number of lesions included varies per test | Stage IV: 100% | CT (CE) MRI (DW) MRI (DW + ultrafast GE) PET‐CT | 37 (218 lesions) [209/115 (55%)] [218/125 (57%)] [191/104 excl brain (54%)] | 3 (125/37) |
| Mixed – incl primary, FU, and NR | Stage III or IV imaged before surgery due to abnormal radiological, clinical, and laboratory findings, or routine surveillance in high risk Number of lesions included same per test | Stage III: 39% Stage IV: 61% | CT (CE) MRI (DW + ultrafast GE) PET‐CT | 64 All tests [420/297 (71%)] | 5 (297/64) |
| Mixed ‐ primary or follow‐up | Melanoma with regional lymph node metastases; excluded any lesions newly arising during follow‐up Number of lesions included same per test | Stage III: 100% | CT (CE); CT (U) PET‐CT (CE); (U) | 50 All tests [232/151 (65%)] | 3 (151/50) |
| AJCC: American Joint Cancer Committee; BT: Breslow thickness; CE: contrast enhanced; CLND: complete lymph node dissection; CT: computed tomography; DW: diffusion weighted; FNAC: fine needle aspiration cytology; FU: follow‐up; GE: gradient echo; HN: head and neck; LN: lymph node; MM: malignant melanoma; MRI: magnetic resonance imaging; mm: millimetre; N+: node positive; N/A: not applicable; NR: not reported; PET: positron emission tomography; SLNB: sentinel lymph node biopsy; U: unenhanced; US: ultrasound; VIBE: MRI sequence. | |||||
| Test | No. of studies | No. of participants |
| 1 Pre‐SLNB US vs Histology ‐ Nodal mets ‐ per patient Show forest plot | 11 | 2604 |
| 2 Pre‐SLNB US (stringent US criteria) vs Histology ‐ Nodal mets ‐ per patient Show forest plot | 1 | 132 |
| 3 Pre‐SLNB US‐FNAC ‐ Nodal mets ‐ per patient Show forest plot | 3 | 1164 |
| 4 Pre‐SLNB PET‐CT vs Histology ‐ Nodal mets ‐ all SLNB ‐ per patient Show forest plot | 4 | 170 |
| 5 Pre‐SLNB PET‐CT vs Histology ‐ Nodal mets ‐ high risk ‐ per patient Show forest plot | 3 | 75 |
| 6 Pre‐SLNB PET‐CT vs Histology ‐ Nodal mets ‐ head and neck only ‐ per patient Show forest plot | 1 | 20 |
| 7 Pre‐SLNB PET‐CT vs Histology/FU ‐ Nodal mets ‐ high risk ‐ per patient Show forest plot | 2 | 76 |
| 8 Pre‐SLNB PET‐CT vs Histology/FU ‐ Nodal mets ‐ head and neck only ‐ per patient Show forest plot | 1 | 22 |
| 9 Any metastasis ‐ PET‐CT ‐ PRIMARY ‐ Any stage (per pt) Show forest plot | 1 | 37 |
| 10 Any metastasis ‐ PET‐CT ‐ PRIMARY ‐ BT > 4 mm (per pt) Show forest plot | 2 | 81 |
| 11 Any metastasis ‐ CT ‐ RE‐STAGING ‐ Any stage (per pt) Show forest plot | 1 | 106 |
| 12 Any metastasis ‐ PET‐CT ‐ RE‐STAGING ‐ Any stage (per pt) Show forest plot | 2 | 153 |
| 13 Any metastasis ‐ PET‐CT ‐ RE‐STAGING ‐ Stage IIIb or less (per pt) Show forest plot | 1 | 76 |
| 14 Any metastasis ‐ PET‐CT ‐ RE‐STAGING ‐ Stage IIIc to IV (per pt) Show forest plot | 1 | 30 |
| 15 Any metastasis ‐ CT‐ MIXED ‐ All data (per pt) Show forest plot | 1 | 250 |
| 16 Any metastasis ‐ PET‐CT ‐ MIXED ‐ All data (per pt) Show forest plot | 6 | 591 |
| 17 Any metastasis ‐ PET‐CT (plus CT) ‐ Mixed ‐ Any stage (per pt) Show forest plot | 1 | 124 |
| 18 Any metastasis ‐ PET‐CT ‐ RE‐STAGING ‐ Any stage (per lesion) Show forest plot | 1 | 139 |
| 19 Any metastasis ‐ CT‐ MIXED ‐ All data (per lesion) Show forest plot | 5 | 1770 |
| 20 Any metastasis (incl brain) ‐ CT (U) ‐ MIXED (per lesion) Show forest plot | 1 | 232 |
| 21 Any metastasis (incl brain) ‐ CT (CE) ‐ MIXED (per lesion) Show forest plot | 1 | 209 |
| 22 Any metastasis ‐ MRI ‐ MIXED ‐ All data (per lesion) Show forest plot | 4 | 1556 |
| 23 Any metastasis (excl brain) ‐ MRI (DW + VIBE) ‐ MIXED (per lesion) Show forest plot | 1 | 195 |
| 24 Any metastasis (incl brain) ‐ MRI (DW) ‐ MIXED (per lesion) Show forest plot | 1 | 218 |
| 25 Any metastasis (incl brain) ‐ MRI (DW + VIBE) ‐ MIXED (per lesion) Show forest plot | 1 | 218 |
| 26 Any metastasis (incl brain) ‐ MRI plus CT ‐ MIXED (per lesion) Show forest plot | 1 | 116 |
| 27 Any metastasis ‐ PET‐CT ‐ MIXED ‐ All data (per lesion) Show forest plot | 5 | 1138 |
| 28 Any metastasis (incl brain) ‐ PET‐CT (U) ‐ MIXED (per lesion) Show forest plot | 1 | 232 |
| 29 Any metastasis (direct test comparisons) ‐ CT ‐ Mixed ‐ Stage III/IV (per lesion) Show forest plot | 3 | 1430 |
| 30 Any metastasis (direct test comparisons) ‐ MRI ‐ Mixed ‐ Stage III/IV (per lesion) Show forest plot | 3 | 1439 |
| 31 Any metastasis (direct test comparisons) ‐ PET‐CT ‐ Mixed ‐ Stage III/IV (per lesion) Show forest plot | 2 | 611 |
| 32 Nodal metastasis ‐ US ‐ PRIMARY (per pt) Show forest plot | 2 | 317 |
| 33 Nodal metastasis ‐ CT ‐ PRIMARY (per pt) Show forest plot | 1 | 56 |
| 34 Nodal metastasis ‐ PET‐CT ‐ PRIMARY (per pt) Show forest plot | 1 | 56 |
| 35 Nodal metastasis ‐ US ‐ RE‐STAGING (per pt) Show forest plot | 1 | 460 |
| 36 Nodal metastasis ‐ US plus US (CE) ‐ RE‐STAGING (per pt) Show forest plot | 1 | 460 |
| 37 Nodal metastasis ‐ US ‐ MIXED (per pt) Show forest plot | 1 | 79 |
| 38 Nodal metastasis ‐ CT ‐ MIXED (per pt) Show forest plot | 2 | 276 |
| 39 Nodal metastasis (superficial groin) ‐ PET‐CT (indeterminate test positive) ‐ MIXED (per pt) Show forest plot | 1 | 69 |
| 40 Nodal metastasis (superficial groin) ‐ PET‐CT (indeterminate test negative) ‐ MIXED (per pt) Show forest plot | 1 | 69 |
| 41 Nodal metastasis (deep groin) ‐ PET‐CT (indeterminate test positive) ‐ MIXED (per pt) Show forest plot | 1 | 67 |
| 42 Nodal metastasis (deep groin) ‐ PET‐CT (indeterminate test negative) ‐ MIXED (per pt) Show forest plot | 1 | 67 |
| 43 Nodal metastasis ‐ PET‐CT ‐ MIXED (per pt) Show forest plot | 1 | 250 |
| 44 Nodal metastasis ‐ CT ‐ MIXED ‐ All data (per lesion) Show forest plot | 4 | 629 |
| 45 Nodal metastasis ‐ MRI ‐ MIXED ‐ All data (per lesion) Show forest plot | 4 | 630 |
| 46 Nodal metastasis ‐ MRI (DW + VIBE) ‐ MIXED (per lesion) Show forest plot | 1 | 53 |
| 47 Nodal metastasis ‐ PET‐CT ‐ MIXED ‐ All data (per lesion) Show forest plot | 4 | 288 |
| 48 Superficial nodal metastasis ‐ US ‐ Mixed ‐ stage IV (per LNB) Show forest plot | 1 | 33 |
| 49 Superficial nodal metastasis ‐ CT ‐ Mixed ‐ stage IV (per LNB) Show forest plot | 1 | 33 |
| 50 Superficial nodal metastasis ‐ MRI ‐ Mixed ‐ stage IV (per LNB) Show forest plot | 1 | 33 |
| 51 Superficial nodal metastasis ‐ MRI (DW + VIBE) ‐ Mixed ‐ Stage IV (per lesion) Show forest plot | 1 | 33 |
| 52 Superficial nodal metastasis ‐ PET‐CT ‐ Mixed ‐ stage IV (per LNB) Show forest plot | 1 | 33 |
| 53 Distant metastasis ‐ CT ‐ PRIMARY (per pt) Show forest plot | 1 | 56 |
| 54 Distant metastasis ‐ PET‐CT ‐ PRIMARY (per pt) Show forest plot | 2 | 112 |
| 55 Distant metastasis ‐ CT ‐ MIXED ‐ All data (per pt) Show forest plot | 2 | 501 |
| 56 Distant metastasis ‐ PET‐CT ‐ MIXED ‐ All data (per pt) Show forest plot | 1 | 250 |
| 57 Distant metastasis ‐ CT ‐ Mixed ‐ All data (per lesion) Show forest plot | 4 | 920 |
| 58 Distant metastasis ‐ MRI ‐ Mixed ‐ All data (per lesion) Show forest plot | 4 | 926 |
| 59 Distant metastasis ‐ PET‐CT ‐ Mixed ‐ All data (per lesion) Show forest plot | 4 | 618 |
| 60 Distant metastasis (excl brain) ‐ MRI (DW + VIBE) ‐ Mixed ‐ stage III/IV (per lesion) Show forest plot | 1 | 142 |
| 61 Distant metastasis (incl brain) ‐ MRI (DW) ‐ Mixed ‐ stage III/IV (per lesion) Show forest plot | 1 | 165 |
| 62 Distant metastasis (incl brain) ‐ MRI (DW + VIBE) ‐ Mixed ‐ stage III/IV (per lesion) Show forest plot | 1 | 165 |
| 63 Bone metastasis ‐ CT‐ MIXED ‐ All data (per lesion) Show forest plot | 3 | 97 |
| 64 Bone metastasis ‐ MRI ‐ MIXED ‐ All data (per lesion) Show forest plot | 3 | 99 |
| 65 Bone metastasis ‐ MRI (DW + VIBE) ‐ MIXED ‐ All data (per lesion) Show forest plot | 1 | 35 |
| 66 Bone metastasis ‐ PET‐CT ‐ MIXED ‐ All data (per lesion) Show forest plot | 4 | 133 |
| 67 Liver metastasis ‐ CT‐ MIXED ‐ All data (per lesion) Show forest plot | 4 | 150 |
| 68 Liver metastasis ‐ MRI ‐ MIXED ‐ All data (per lesion) Show forest plot | 4 | 155 |
| 69 Liver metastasis ‐ MRI (DW + VIBE) ‐ Mixed ‐ stage III/IV (per lesion) Show forest plot | 1 | 27 |
| 70 Liver metastasis ‐ PET‐CT ‐ MIXED ‐ All data (per lesion) Show forest plot | 4 | 94 |
| 71 Lung metastasis ‐ CT ‐ MIXED ‐ All data (per lesion) Show forest plot | 4 | 325 |
| 72 Lung metastasis ‐ MRI ‐ MIXED ‐ All data (per lesion) Show forest plot | 4 | 325 |
| 73 Lung metastasis ‐ MRI (DW + VIBE) ‐ Mixed ‐ stage III/IV (per lesion) Show forest plot | 1 | 45 |
| 74 Lung metastasis ‐ PET‐CT ‐ MIXED ‐ All data (per lesion) Show forest plot | 4 | 155 |
| 75 Soft tissue metastasis ‐ PET‐CT ‐ MIXED (per lesion) Show forest plot | 1 | 25 |
| 76 Local/subcutaneous metastasis ‐ CT ‐ MIXED (per lesion) Show forest plot | 3 | 139 |
| 77 Local/subcutaneous metastasis ‐ MRI ‐ MIXED (per lesion) Show forest plot | 3 | 148 |
| 78 Local/subcutaneous metastasis ‐ MRI (DW + VIBE) ‐ MIXED (per lesion) Show forest plot | 1 | 22 |
| 79 Local/subcutaneous metastasis ‐ PET‐CT ‐ MIXED (per lesion) Show forest plot | 3 | 102 |
| 80 Brain metastasis ‐ CT‐ MIXED ‐ All data (per lesion) Show forest plot | 1 | 20 |
| 81 Brain metastasis ‐ MRI (DW) ‐ MIXED ‐ All data (per lesion) Show forest plot | 1 | 20 |
| 82 Brain metastasis ‐ MRI (DW + VIBE) ‐ MIXED ‐ All data (per lesion) Show forest plot | 1 | 20 |
| 83 Brain metastasis ‐ PET‐CT ‐ MIXED ‐ All data (per lesion) Show forest plot | 1 | 9 |
| 93 'Other' metastasis ‐ CT ‐ Mixed ‐ Any stage (per lesion) Show forest plot | 1 | 26 |
| 94 'Other' metastasis ‐ MRI ‐ Mixed ‐ Any stage (per lesion) Show forest plot | 1 | 21 |
| 95 'Other' metastasis ‐ PET‐CT ‐ Mixed ‐ Any stage (per lesion) Show forest plot | 1 | 26 |
| 96 'Other' metastasis ‐ CT ‐ Mixed ‐ stage III/IV (per lesion) Show forest plot | 2 | 160 |
| 97 'Other' metastasis ‐ MRI ‐ Mixed ‐ stage III/IV (per lesion) Show forest plot | 2 | 160 |
| 98 'Other' metastasis ‐ PET‐CT ‐ Mixed ‐ stage III/IV (per lesion) Show forest plot | 1 | 25 |