Mindfulness‐based stress reduction for family carers of people with dementia
Información
- DOI:
- https://doi.org/10.1002/14651858.CD012791.pub2Copiar DOI

- Base de datos:
-
- Cochrane Database of Systematic Reviews
- Versión publicada:
-
- 14 agosto 2018see what's new
- Tipo:
-
- Intervention
- Etapa:
-
- Review
- Grupo Editorial Cochrane:
-
Grupo Cochrane de Demencia y trastornos cognitivos
- Copyright:
-
- Copyright © 2018 The Cochrane Collaboration. Published by John Wiley & Sons, Ltd.
Cifras del artículo
Altmetric:
Citado por:
Autores
Contributions of authors
ZL: designed the study and drafted the full review.
YYS and BLZ: took part in the study design, data collection, and analysis.
Sources of support
Internal sources
-
Department of Psychiatry, the Chinese University of Hong Kong, China.
-
School of Public Health, Peking University, China.
External sources
-
NIHR, UK.
This review was supported by the National Institute for Health Research (NIHR), via Cochrane Infrastructure funding to the Cochrane Dementia and Cognitive Improvement group. The views and opinions expressed therein are those of the authors and do not necessarily reflect those of the Systematic Reviews Programme, NIHR, National Health Service or the Department of Health
Declarations of interest
Zheng Liu: none known
Yu‐Ying Sun: none known
Bao‐liang Zhong: none known
Acknowledgements
We would like to thank the following people from the Department of Psychiatry, the Chinese University of Hong Kong: Prof Linda Chiu‐Wa Lam, Prof Sing Lee, and Prof Arthur Dun‐Ping Mak for their patient guidance and continuous support throughout the period of study design.
Version history
| Published | Title | Stage | Authors | Version |
| 2018 Aug 14 | Mindfulness‐based stress reduction for family carers of people with dementia | Review | Zheng Liu, Yu‐Ying Sun, Bao‐liang Zhong | |
| 2017 Sep 05 | Mindfulness‐based stress reduction for family carers of people with dementia | Protocol | Zheng Liu, Yu‐Ying Sun, Bao‐liang Zhong | |
Differences between protocol and review
-
Due to the paucity of information on adverse events, we described our study objectives as "to assess the effectiveness of MBSR in reducing the stress of family carers of people with dementia."
-
Due to the variability of control groups, we regrouped outcomes into two comparisons: MBSR versus active controls, and MBSR versus inactive controls.
-
As no included studies evaluated the effects of MBSR on institutionalisation, we did not report this outcome in the 'Summary of findings' tables.
-
We reported adverse events as one of main results in the review.
Keywords
MeSH
Medical Subject Headings (MeSH) Keywords
Medical Subject Headings Check Words
Adult; Humans;
PICO
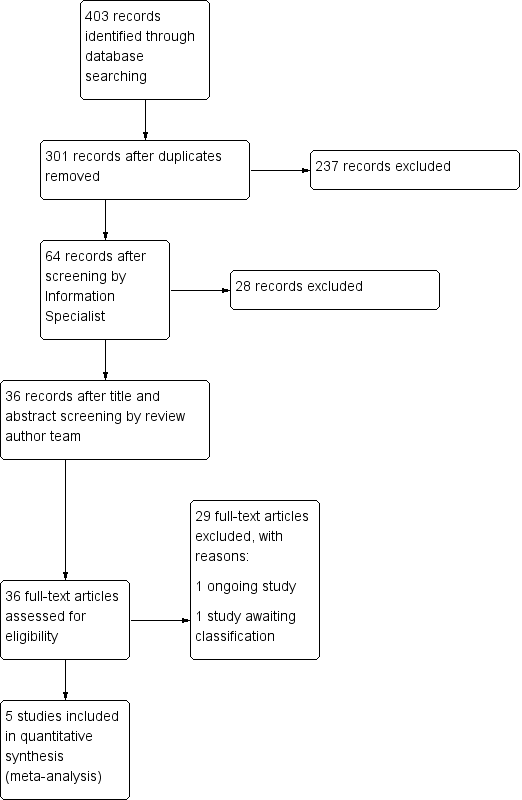
Study flow diagram.
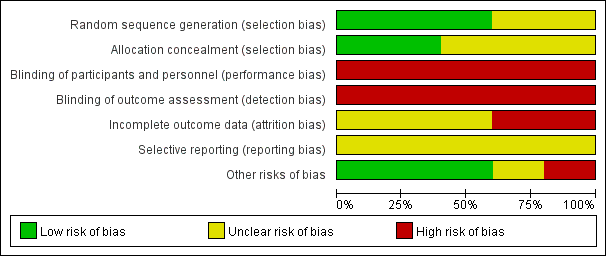
Risk of bias graph: review authors' judgements about each risk of bias item presented as percentages across all included studies.
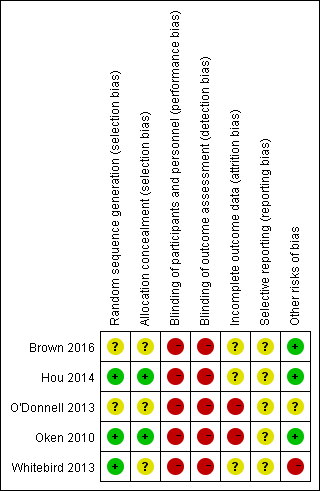
Risk of bias summary: review authors' judgements about each risk of bias item for each included study.

Forest plot of comparison: 1 MBSR versus active control at immediately postintervention, outcome: 1.1 Depressive symptoms.

Forest plot of comparison: 1 MBSR versus active control at immediately postintervention, outcome: 1.4 Carer burden.

Forest plot of comparison: 1 MBSR versus active control at immediately postintervention, outcome: 1.7 Dropout rates.
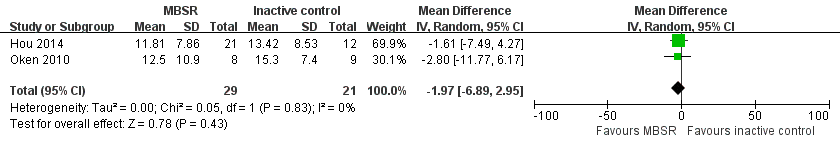
Forest plot of comparison: 2 MBSR versus inactive control at immediately postintervention, outcome: 2.1 Depressive symptoms.

Comparison 1 MBSR versus active control immediately postintervention, Outcome 1 Depressive symptoms.

Comparison 1 MBSR versus active control immediately postintervention, Outcome 2 Clinically significant depressive symptoms.

Comparison 1 MBSR versus active control immediately postintervention, Outcome 3 Anxiety.

Comparison 1 MBSR versus active control immediately postintervention, Outcome 4 Carer burden.

Comparison 1 MBSR versus active control immediately postintervention, Outcome 5 Coping style.

Comparison 1 MBSR versus active control immediately postintervention, Outcome 6 Dropout rates.

Comparison 2 MBSR versus inactive control immediately postintervention, Outcome 1 Depressive symptoms.

Comparison 2 MBSR versus inactive control immediately postintervention, Outcome 2 Clinically significant depressive symptoms.

Comparison 2 MBSR versus inactive control immediately postintervention, Outcome 3 Anxiety.

Comparison 2 MBSR versus inactive control immediately postintervention, Outcome 4 Carer burden.

Comparison 2 MBSR versus inactive control immediately postintervention, Outcome 5 Coping style.

Comparison 2 MBSR versus inactive control immediately postintervention, Outcome 6 Dropout rates.
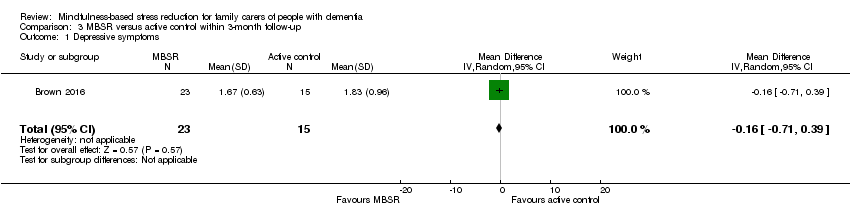
Comparison 3 MBSR versus active control within 3‐month follow‐up, Outcome 1 Depressive symptoms.
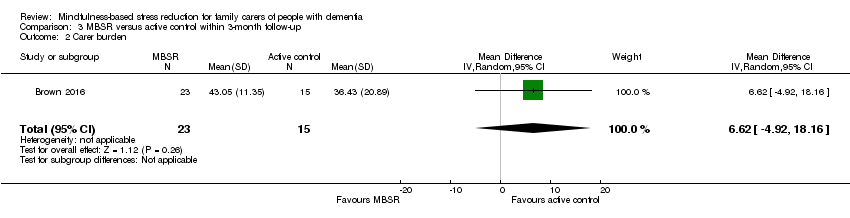
Comparison 3 MBSR versus active control within 3‐month follow‐up, Outcome 2 Carer burden.
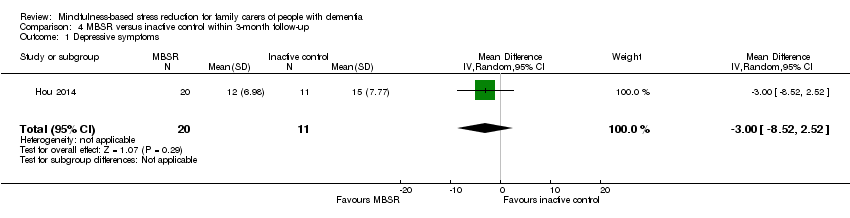
Comparison 4 MBSR versus inactive control within 3‐month follow‐up, Outcome 1 Depressive symptoms.

Comparison 4 MBSR versus inactive control within 3‐month follow‐up, Outcome 2 Clinically significant depressive symptoms.
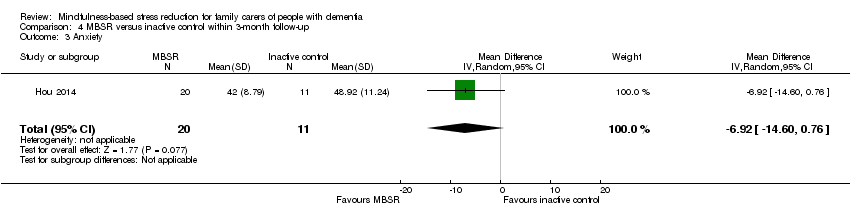
Comparison 4 MBSR versus inactive control within 3‐month follow‐up, Outcome 3 Anxiety.
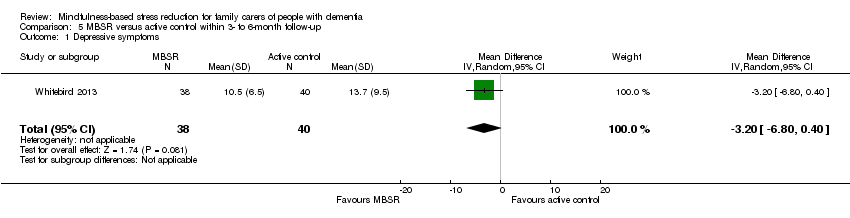
Comparison 5 MBSR versus active control within 3‐ to 6‐month follow‐up, Outcome 1 Depressive symptoms.

Comparison 5 MBSR versus active control within 3‐ to 6‐month follow‐up, Outcome 2 Clinically significant depressive symptoms.

Comparison 5 MBSR versus active control within 3‐ to 6‐month follow‐up, Outcome 3 Anxiety.

Comparison 5 MBSR versus active control within 3‐ to 6‐month follow‐up, Outcome 4 Carer burden.
| MBSR (mindfulness‐based stress reduction) compared to active control for family carers of people with dementia | ||||||
| Patient or population: family carers of people with dementia | ||||||
| Outcomes | Anticipated absolute effects* (95% CI) | Relative effect | № of participants | Quality of the evidence | Comments | |
| Risk with active control | Risk with MBSR | |||||
| Depressive symptoms | ‐ | SMD 0.63 SD lower | ‐ | 135 | ⊕⊕⊝⊝ | Moderate effect size;c lower score represents lower depressive symptoms |
| Anxiety | The mean anxiety was 47.4 score. | MD 7.5 score lower | ‐ | 78 | ⊕⊕⊝⊝ | Moderate effect size;c lower score represents lower level of anxiety |
| Carer burden | ‐ | SMD 0.24 SD higher | ‐ | 135 | ⊕⊕⊝⊝ | Small effect size;c lower score represents lower level of carer burden |
| Dropout rates | Study population | RR 1.39 | 166 | ⊕⊝⊝⊝ | Important effect sizee | |
| 88 per 1000 | 122 per 1000 | |||||
| *The risk in the intervention group (and its 95% confidence interval) is based on the assumed risk in the comparison group and the relative effect of the intervention (and its 95% CI). | ||||||
| GRADE Working Group grades of evidence | ||||||
| aWe downgraded the quality of evidence by one level due to serious concern about high risk of bias in blinding of participants and personnel. | ||||||
| MBSR (mindfulness‐based stress reduction) compared to inactive control for family carers of people with dementia | ||||||
| Patient or population: family carers of people with dementia | ||||||
| Outcomes | Anticipated absolute effects* (95% CI) | Relative effect | № of participants | Quality of the evidence | Comments | |
| Risk with inactive control | Risk with MBSR | |||||
| Depressive symptoms | The mean depressive symptoms was 14.2 score. | MD 1.97 score lower | ‐ | 50 | ⊕⊕⊝⊝ | Small effect size;c lower score represents lower depressive symptoms |
| Anxiety | The mean anxiety was 47.8 score. | MD 7.27 score lower | ‐ | 33 | ⊕⊕⊝⊝ | Moderate effect size;c lower score represents lower level of anxiety |
| Carer burden | The mean carer burden was 26.4 score. | MD 1.6 score lower | ‐ | 17 | ⊕⊕⊝⊝ | Small effect size;c lower score represents lower level of carer burden |
| Dropout rates | Study population | RR 2.00 | 20 | ⊕⊝⊝⊝ | Important effect sizee | |
| 100 per 1000 | 200 per 1000 | |||||
| *The risk in the intervention group (and its 95% confidence interval) is based on the assumed risk in the comparison group and the relative effect of the intervention (and its 95% CI). | ||||||
| GRADE Working Group grades of evidence | ||||||
| aAs suggested by Ryan 2016a, we downgraded the quality of evidence by one level due to serious concern about imprecision. | ||||||
| Outcome or subgroup title | No. of studies | No. of participants | Statistical method | Effect size |
| 1 Depressive symptoms Show forest plot | 3 | 135 | Std. Mean Difference (IV, Random, 95% CI) | ‐0.63 [‐0.98, ‐0.28] |
| 2 Clinically significant depressive symptoms Show forest plot | 1 | 24 | Risk Ratio (M‐H, Random, 95% CI) | 0.33 [0.04, 2.77] |
| 3 Anxiety Show forest plot | 1 | 78 | Mean Difference (IV, Random, 95% CI) | ‐7.5 [‐13.11, ‐1.89] |
| 4 Carer burden Show forest plot | 3 | 135 | Std. Mean Difference (IV, Random, 95% CI) | 0.24 [‐0.11, 0.58] |
| 5 Coping style Show forest plot | 1 | 19 | Mean Difference (IV, Random, 95% CI) | 6.0 [‐4.59, 16.59] |
| 6 Dropout rates Show forest plot | 4 | 166 | Risk Ratio (M‐H, Random, 95% CI) | 1.39 [0.32, 5.99] |
| Outcome or subgroup title | No. of studies | No. of participants | Statistical method | Effect size |
| 1 Depressive symptoms Show forest plot | 2 | 50 | Mean Difference (IV, Random, 95% CI) | ‐1.97 [‐6.89, 2.95] |
| 2 Clinically significant depressive symptoms Show forest plot | 1 | 33 | Risk Ratio (M‐H, Random, 95% CI) | 0.69 [0.26, 1.78] |
| 3 Anxiety Show forest plot | 1 | 33 | Mean Difference (IV, Random, 95% CI) | ‐7.27 [‐14.92, 0.38] |
| 4 Carer burden Show forest plot | 1 | 17 | Mean Difference (IV, Random, 95% CI) | ‐1.60 [‐19.48, 16.28] |
| 5 Coping style Show forest plot | 1 | 17 | Mean Difference (IV, Random, 95% CI) | 7.90 [‐5.41, 21.21] |
| 6 Dropout rates Show forest plot | 1 | 20 | Risk Ratio (M‐H, Random, 95% CI) | 2.0 [0.21, 18.69] |
| Outcome or subgroup title | No. of studies | No. of participants | Statistical method | Effect size |
| 1 Depressive symptoms Show forest plot | 1 | 38 | Mean Difference (IV, Random, 95% CI) | ‐0.16 [‐0.71, 0.39] |
| 2 Carer burden Show forest plot | 1 | 38 | Mean Difference (IV, Random, 95% CI) | 6.62 [‐4.92, 18.16] |
| Outcome or subgroup title | No. of studies | No. of participants | Statistical method | Effect size |
| 1 Depressive symptoms Show forest plot | 1 | 31 | Mean Difference (IV, Random, 95% CI) | ‐3.0 [‐8.52, 2.52] |
| 2 Clinically significant depressive symptoms Show forest plot | 1 | 31 | Risk Ratio (M‐H, Random, 95% CI) | 0.55 [0.20, 1.49] |
| 3 Anxiety Show forest plot | 1 | 31 | Mean Difference (IV, Random, 95% CI) | ‐6.92 [‐14.60, 0.76] |
| Outcome or subgroup title | No. of studies | No. of participants | Statistical method | Effect size |
| 1 Depressive symptoms Show forest plot | 1 | 78 | Mean Difference (IV, Random, 95% CI) | ‐3.20 [‐6.80, 0.40] |
| 2 Clinically significant depressive symptoms Show forest plot | 1 | 24 | Risk Ratio (M‐H, Fixed, 95% CI) | 1.0 [0.25, 4.00] |
| 3 Anxiety Show forest plot | 1 | 78 | Mean Difference (IV, Fixed, 95% CI) | ‐6.5 [‐12.00, 1.00] |
| 4 Carer burden Show forest plot | 1 | 78 | Mean Difference (IV, Fixed, 95% CI) | 0.90 [‐0.55, 2.35] |