La efectividad y relación de coste‐efectividad de los cuidados paliativos especializados hospitalarios para adultos con enfermedades en estadios avanzados y sus cuidadores
Resumen
Antecedentes
Las enfermedades graves suelen caracterizarse por problemas físicos/psicológicos, necesidades de apoyo familiar y un alto uso de recursos sanitarios. Los cuidados paliativos especializados hospitalarios (CPEH) se han desarrollado para ayudar a satisfacer mejor las necesidades de los pacientes y sus familias y reducir potencialmente los gastos de atención hospitalaria. Es necesario aclarar la efectividad y los modelos óptimos de CPEH, dado que la mayoría de las personas sigue muriendo en los hospitales, y también para asignar los escasos recursos de manera correcta.
Objetivos
Evaluar la efectividad y la relación de coste‐efectividad de los CPEH en comparación con la atención habitual de los adultos con enfermedades avanzadas (en adelante, los pacientes) y sus cuidadores/familias no remunerados.
Métodos de búsqueda
Se realizaron búsquedas en las bases de datos CENTRAL, CDSR, DARE y HTA a través de la Cochrane Library; MEDLINE; Embase; CINAHL; PsycINFO; CareSearch; National Health Service Economic Evaluation Database (NHS EED) y dos registros de ensayos hasta agosto de 2019. Además, se verificaron las listas de referencias y las revisiones sistemáticas pertinentes, se buscaron citas y se contactó con expertos para identificar estudios adicionales.
Criterios de selección
Se incluyeron ensayos controlados aleatorizados (ECA) que evaluaban el impacto de los CPEH en los desenlaces de los pacientes o sus cuidadores/familias no remunerados, o ambos. Los CPEH se definieron como los cuidados paliativos especializados prestados por un equipo de cuidados paliativos hospitalario que proporciona cuidados integrales, coordinados por un equipo multidisciplinario y con la colaboración entre los proveedores de los CPEH y los médicos de familia. Los CPEH se proporcionaron a los pacientes mientras estuvieron ingresados en hospitales de cuidados agudos, a pacientes ambulatorios o a pacientes que recibían atención de equipos hospitalarios en su domicilio. El comparador fue la atención habitual, definida como la atención hospitalaria de pacientes hospitalizados o ambulatorios sin cuidados paliativos especializados en el momento de entrada al estudio, la atención comunitaria o cuidados paliativos de terminalidad fuera del entorno hospitalario.
Obtención y análisis de los datos
Se utilizaron los procedimientos metodológicos estándares previstos por Cochrane. Se evaluó el riesgo de sesgo y se extrajeron los datos. Para tener en cuenta las distintas escalas de los estudios, se calcularon las diferencias de medias estandarizadas (DME) con intervalos de confianza (IC) del 95% para los datos continuos. Se utilizó un modelo de efectos aleatorios por la inversa de la varianza. Para los datos binarios, se calculó el odds ratio (OR) con un IC del 95%. La calidad de la evidencia se evaluó con los criterios GRADE y se creó una tabla de "Resumen de los hallazgos".
Los desenlaces principales fueron la calidad de vida relacionada con la salud (CVRS) del paciente y la carga de síntomas (un conjunto de dos o más síntomas). Los desenlaces secundarios clave fueron el dolor, la depresión, la satisfacción con la atención, la muerte en el lugar de preferencia, la mortalidad/supervivencia, la carga de los cuidadores no remunerados y la relación de coste‐efectividad. Se analizaron los datos cualitativos cuando se dispuso de ellos.
Resultados principales
Se identificaron 42 ECA con 7779 participantes (6678 pacientes y 1101 cuidadores/familiares). Veintiún estudios se realizaron con poblaciones con cáncer, 14 con poblaciones sin cáncer (de los cuales seis incluyeron pacientes con insuficiencia cardíaca) y siete con poblaciones mixtas con y sin cáncer (diagnósticos mixtos).
Los CPEH se ofrecían de diferentes maneras e incluía los siguientes modelos: en planta de hospital, en consulta de pacientes ingresados, en consulta de pacientes ambulatorios, en unidad hospitalaria en el domicilio, y en prestación de servicios en varios entornos que incluían el hospital. Para los análisis principales, se agruparon los datos de los estudios que informan de los valores ajustados de los desenlaces. Cuarenta estudios presentaban un riesgo de sesgo alto en al menos un dominio.
En comparación con la atención habitual, los CPEH mejoraron la CVRS del paciente con un pequeño tamaño del efecto de DME 0,26 sobre la atención habitual (IC del 95%: 0,15 a 0,37; I2 = 3%, 10 estudios, 1344 participantes, evidencia de calidad baja, las puntuaciones más altas indican una mejor CVRS del paciente). Los CPEH también mejoraron otros desenlaces centrados en la persona. Los CPEH mejoraron la carga de los síntomas del paciente con un pequeño tamaño del efecto de DME ‐0,26 sobre la atención habitual (IC del 95%: ‐0,41 a 0,12; I2 = 0%, seis estudios, 761 participantes, evidencia de calidad muy baja, puntuaciones más bajas indican una menos carga de los síntomas del paciente). Los CPEH mejoraron la satisfacción del paciente con la atención con un pequeño tamaño del efecto de DME 0,36 sobre la atención habitual (IC del 95%: 0,41 a 0,57; I2 = 0%, dos estudios, 337 participantes, evidencia de calidad baja, las puntuaciones más altas indican una mayor satisfacción del paciente con la atención). Utilizando la muerte en el domicilio como medida representativa del lugar de muerte preferido por el paciente, los pacientes tuvieron más probabilidades de morir en su domicilio con los CPEH en comparación con la atención habitual (OR 1,63, IC del 95%: 1,23 a 2,16; I2 = 0%, siete estudios, 861 participantes, evidencia de calidad baja). Los datos sobre el dolor (cuatro estudios, 525 participantes) no mostraron evidencia de una diferencia entre los CPEH y la atención habitual (DME ‐0,16; IC del 95%: ‐0,33 a 0,01; I2 = 0%, evidencia de calidad muy baja). Ocho estudios (N = 1252 participantes) informaron sobre episodios adversos y la evidencia de calidad muy baja no demostró un efecto de los CPEH sobre los daños graves. Dos estudios (170 participantes) presentaron datos sobre la carga de los cuidadores y ninguno encontró evidencia del efecto de los CPEH (evidencia de calidad muy baja). Se incluyeron 13 estudios económicos (2103 participantes). En general, la evidencia sobre la relación de coste‐efectividad de los CPEH en comparación con la atención habitual no fueron coherentes entre los cuatro estudios económicos completos. Otros estudios que utilizaron solo un análisis económico parcial y los que presentaron información más limitada sobre el uso de los recursos y los costes también tuvieron resultados incoherentes (evidencia de calidad muy baja).
Calidad de la evidencia
La calidad de la evidencia utilizando los criterios GRADE fue muy baja; se rebajó debido al riesgo de sesgo alto, la inconsistencia e imprecisión.
Conclusiones de los autores
Hay evidencia de calidad muy baja a baja de que, en comparación con la atención habitual, los CPEH pueden ofrecer pequeños efectos beneficiosos para varios desenlaces centrados en la persona, como la CVRS del paciente, la carga de los síntomas y la satisfacción del paciente con la atención, al tiempo que aumenta las posibilidades de que los pacientes mueran en su lugar de preferencia (medido a través de la muerte en el domicilio). Si bien no se encontró evidencia de que los CPEH causen efectos perjudiciales graves, la evidencia fue insuficiente para sacar conclusiones firmes. Aunque se trata de efectos de pequeña magnitud, pueden ser clínicamente relevantes en un estadio avanzado de la enfermedad con un pronóstico limitado, y son desenlaces centrados en la persona que son importantes para muchos pacientes y familias. Se necesitan más estudios bien realizados para estudiar las poblaciones con enfermedades no malignas y diagnósticos mixtos, modelos de CPEH en planta de hospital, acceso a la atención 24 horas al día (atención fuera del horario de trabajo) como parte de los CPEH, el dolor, el lugar de atención preferido por el paciente, la satisfacción del paciente con la atención, los desenlaces de los cuidadores (satisfacción con la atención, carga, depresión, ansiedad, dolor, calidad de vida) y la relación de coste‐efectividad de los CPEH. Además, es necesario realizar investigaciones para obtener desenlaces validados centrados en la persona que se utilicen en todos los estudios y poblaciones.
PICO
Resumen en términos sencillos
Efectividad y relación de coste‐efectividad de los cuidados paliativos especializados hospitalarios (CPEH) para los adultos con enfermedades en estadios avanzados y sus cuidadores no remunerados
Pregunta de la revisión
¿Cómo de efectivos son los cuidados paliativos especializados hospitalarios para adultos con una enfermedad terminal y para sus cuidadores no remunerados? ¿Son coste‐efectivos?
¿Por qué es importante esta pregunta?
Los cuidados paliativos tienen por objeto mejorar la calidad de vida de las personas que padecen una enfermedad terminal (una enfermedad que no se puede curar y es probable que lleve a la muerte). Su objetivo es ayudar a los pacientes, a sus cuidadores no remunerados y a sus familias a controlar los síntomas que causan angustia (por ejemplo, el dolor) y a satisfacer las necesidades de apoyo psicológico, social y espiritual de los pacientes y sus cuidadores no remunerados. Los cuidados paliativos son reconocidos como un método "holístico" porque consideran a la persona "completa" y su red de apoyo, no sólo la enfermedad y sus síntomas. Por lo general, se trata de un equipo de personas que puede incluir médicos, enfermeras, farmacéuticos, otros profesionales sanitarios, trabajadores sociales, capellanes o voluntarios.
Un número cada vez mayor de hospitales está estableciendo servicios de cuidados paliativos especializados (conocidos como cuidados paliativos especializados hospitalarios [CPEH]). Se pueden proporcionar CPEH:
‐ en el propio hospital, para pacientes ingresados o ambulatorios;
‐ como "hospitalización a domicilio", lo que significa que el equipo del hospital visita a los pacientes en su domicilio;
‐ o en varios contextos (por ejemplo, el hospital y el domicilio).
Para averiguar si los CPEH tienen efectos beneficiosos sobre los pacientes y sus cuidadores no remunerados, y cómo de coste‐efectivos son, se revisó la evidencia de la investigación.
¿Cómo se identificó y evaluó la evidencia?
Primero, se buscaron todos los estudios relevantes en la literatura médica. Se buscaron específicamente:
‐ estudios controlados aleatorizados: son estudios en los que las personas se dividen al azar entre diferentes grupos de tratamiento. Este tipo de estudios proporciona la evidencia más sólida sobre los efectos de un tratamiento.
‐ estudios que compararon los CPEH con la atención hospitalaria sin cuidados paliativos especializados; la atención recibida en la comunidad; o atención paliativa de terminalidad fuera del hospital.
Se compararon los resultados y se resumió la evidencia de todos los estudios. Finalmente se evaluó la certeza de la evidencia. Se consideraron factores como la forma en que se realizaron los estudios, el tamaño de los mismos y la consistencia de los hallazgos entre los estudios. Según las evaluaciones, la evidencia se calificó como de certeza muy baja, baja, moderada o alta.
¿Qué se encontró?
Se encontraron 42 estudios con un total de 6678 pacientes y 1101 cuidadores o familiares. Los pacientes sufrían cáncer (21 estudios); una enfermedad avanzada que no era cáncer (14 estudios); y una combinación de diagnósticos de cáncer y no cáncer (mixtos) (7 estudios). Los pacientes de seis de los 14 estudios no relacionados con el cáncer presentaban insuficiencia cardíaca. Casi la mitad (19) de los estudios se realizaron en los Estados Unidos. Trece estudios informaron sobre los costes de los CPEH.
La evidencia de los estudios identificados sugiere que, en comparación con la atención habitual:
‐ los CPEH podrían mejorar ligeramente la calidad de vida de los pacientes en relación con la salud, la carga general de los síntomas y su satisfacción con la atención;
‐ los CPEH podrían aumentar las posibilidades de que las personas mueran en su lugar de preferencia.
No está claro cuáles son los efectos de los CPEH en el dolor, la carga de los cuidadores o los episodios no deseados. Esto se debe a que la evidencia identificada no era sólida (evidencia de certeza muy baja). Del mismo modo, dado que la evidencia relacionada con los costes era de certeza muy baja, no está claro cómo de rentable son los CPEH.
¿Qué significa esto?
En comparación con la atención habitual,los CPEH podrían mejorar ligeramente la calidad de vida del paciente, la carga de los síntomas y su satisfacción con la atención. También podrían aumentar las posibilidades de morir en su domicilio. Sin embargo, es probable que las investigaciones futuras modifiquen estos resultados, ya que se basan en evidencia de certeza baja. Se necesitan más estudios para evaluar el efecto de los CPEH en otros desenlaces, como el dolor, la carga de los cuidadores, los episodios no deseados y la relación de coste‐efectividad.
¿Cuál es el grado de actualización de esta revisión?
La evidencia de esta revisión Cochrane está actualizada hasta agosto de 2019.
Authors' conclusions
Summary of findings
| Hospital‐based specialist palliative care compared to usual care for adults with advanced illness and their unpaid caregivers/families | |||||
| Patient or population: adults with advanced illness and their unpaid caregivers/families | |||||
| Outcomes | Anticipated absolute effects* (95% CI) | Relative effect | № of participants | Certainty of the evidence | |
|---|---|---|---|---|---|
| Risk with usual care | Risk with hospital‐based specialist palliative care | ||||
| Patient health‐related quality of life (HRQoL)i, SD units | Mean (SD) ranging from ‐45.4 (26.83) to 131.14 (26.62) | SMD 0.26 SDs higher | ‐ | 1344 | ⊕⊕⊝⊝ |
| Patient symptom burden assessed with generalised measuresii, SD units (lower scores indicate lower symptom burden) | Mean (SD) ranging from ‐19.3 (4.2) to 268.59 (201.65) | SMD 0.26 SDs lower | ‐ | 761 | ⊕⊝⊝⊝ |
| Patient satisfaction with careiii, SD units | Mean (SD) ranging from 6.4 (1.1) to 68.37 (9.03) | SMD 0.36 SDs higher (0.41 higher to 0.57 higher) | ‐ | 337 (2 RCTs) | ⊕⊕⊝⊝ |
| Achieving patient preferred place of death (measured by number of patients with home death) Follow‐up: range 1 month to 13 months | 462 per 1000 | 583 per 1000 (513 to 649) | OR 1.63 higher (1.23 higher to 2.16 higher) | 861 | ⊕⊕⊝⊝ |
| Painiv, SD units | Mean (SD) ranging from 2.2 (3.7) to 28.19 (32.81) | SMD 0.16 SDs lower | ‐ | 525 | ⊕⊝⊝⊝ |
| Unpaid caregiver burdenv | Only two studies reported adjusted endpoint values but we could not pool them in a meta‐analysis. They both found no between‐group difference between HSPC and usual care | ‐ | 170 | ⊕⊝⊝⊝ | |
| Cost and cost‐effectiveness | Of 13 studies reporting costs of HSPC, nine studies found no difference between HSPC and usual care and two studies favoured HSPC over usual care. The difference in cost was unclear in one study, while another study reported mixed findings with lower cost of hospitalisation in favour of HSPC but no difference in the cost of emergency room visit. Four studies with full economic analysis were inconclusive on the cost‐effectiveness of HSPC. | ‐ | 2103 | ⊕⊝⊝⊝ | |
| *The risk in the intervention group (and its 95% confidence interval) is based on the assumed risk in the comparison group and the relative effect of the intervention (and its 95% CI). i. Assessed with the European Organisation for the Research and Treatment of Cancer Quality of Life Questionnaire Core 30 (EORTC QLQ‐C30), Functional Assessment of Cancer Therapy ‐ Bone Marrow Transplant (FACT‐BMT), Functional Assessment of Cancer Therapy ‐ General Measure (FACT‐G), Functional Assessment of Cancer Therapy – Lung scale (FACT‐L), Functional Assessment of Chronic Illness therapy for Palliative Care (FACIT‐Pal), Functional Assessment of Chronic Illness Therapy ‐ Spiritual Well‐being Scale (FACIT‐Sp), McGill Quality of Life Questionnaire (McGill QoL questionnaire) and Minnesota Living with Heart Failure Questionnaire (MLHF questionnaire). ii. Assessed with the Edmonton Symptom Assessment Scale (ESAS) or a modified form of it, severity subscale of the Memorial Symptom Assessment Scale (MSAS), symptom impact subscale of the Quality of Life at End of life (QUAL‐E), Rotterdam Symptom Checklist (RSC ‐ Physical Symptoms Score) and lung cancer subscale of the FACT‐L. iii. Assessed with 16‐item Family Satisfaction with Care ‐ Patient Version (FAMCARE‐P16) and Modified City of Hope Patient Questionnaires ‐ Place of Care Environment Scale (MCOHPQ ‐ Place of Care Environment Scale). iv. Assessed with pain item of EORTC QLQ‐C30 and Brief Pain Inventory (BPI). v. Assessed with Montgomery‐Borgatta Caregiver Burden Scale and Zarit Burden Inventory | |||||
| GRADE Working Group grades of evidence | |||||
| a We downgraded by 2 levels for very serious study limitations due to a high risk of bias in studies. b We downgraded by 1 level due to inconsistency between our main meta‐analysis and sensitivity analyses. c We downgraded by 1 level for imprecision due to the small number of participants. d We downgraded by 1 level for inconsistency because the results were inconsistent across studies. | |||||
Background
The global burden of disease has increased, and this change is placing considerable strain on healthcare systems internationally (Bloom 2016). Most adults develop one or more chronic illnesses with which they may live for many years before they die. For a minority of patients with serious illness, the time following diagnosis is characterised by a stable period of relatively good functional and cognitive performance, followed by a predictable and short period of functional and clinical decline. The time following diagnosis may also be characterised by months to years of physical and psychological symptom distress, progressive functional dependence and frailty, considerable family support needs and high healthcare resource use (Evans 2019; Prince 2015). In addition to increased clinical complexity, the rise of ageing populations has led to considerable healthcare costs globally. This has occurred despite efforts to reduce acute hospital care expenditure in many high‐income countries, including, for example, in the USA (Kashihara 2012), and the UK (Imison 2017; Lafond 2014), by shifting care from the hospital setting to primary care and the community.
It could be argued that increased staffing costs and the introduction or expansion of novel services in hospitals and the community, such as specialist palliative care, plays a role in this increased expenditure. Hospital‐based palliative care encompasses palliative care interventions that are delivered by specialist palliative care teams based in a hospital to patients with advanced (C‐TAC 2015), life‐limiting (Palliative Care Australia 2005), or life‐threatening illness (NCP 2013), which is likely to compromise their quality of life (WHOQOL Group 1995). The care is provided to the patient while they are admitted as inpatients to acute care hospitals, outpatients or patients receiving care from hospital outreach teams at home. Between 2000 and 2016, the prevalence of specialist palliative care in hospitals with 50 or more beds increased by 178% in USA, from 25% of hospitals in 2000 to 75% in 2016 (CAPC 2018). Furthermore, the growth of specialist palliative care in acute hospitals is likely to continue in the foreseeable future as most older adults (≥ 65 years old) die in hospitals (Broad 2013), most deaths in hospital occur due to terminal illness (Pivodic 2016), and also because deaths in institutional care persist into older stages of life, with one in five centenarians dying in hospital (Evans 2014). In the UK, it has been estimated that by 2040 about 160,000 more people yearly are likely to have palliative care needs, including pain management in chronic illnesses and end‐of‐life care in hospitals, hospices and at home (Etkind 2017). Cost‐effective commissioning of end‐of‐life resources has been highlighted as a priority (PHE 2017). Preliminary evidence shows that palliative care improves clinical outcomes and quality of care (Higginson 2003). Furthermore, palliative care, which includes bereavement care and preparatory grief work, has the potential to help unpaid caregivers access the care they need related to the death of a loved one (Grande 2017).
The numbers of inpatient hospital palliative care teams are increasing (CAPC 2018; Meier 2011). This is occurring in response to unmet palliative care needs of inpatients and their unpaid caregivers (Meier 2011), yet clarity around effective models of care are needed. This Cochrane Review will provide much‐needed clarity regarding the effectiveness and cost‐effectiveness of hospital‐based specialist palliative care. In the review, five different models of hospital‐based specialist palliative care were specified due to its evolving nature and also to make the findings more relevant to clinical practice. The models of hospital‐based specialist palliative care eligible are ward‐based models, inpatient consulting models, outpatient models, hospital‐at‐home or hospital outreach models (hereafter outreach model) and service provision across multiple settings which included hospital. The review findings will have the potential to aid the future development, funding and implementation of hospital‐based specialist palliative care. This may help transform services, which have mostly developed locally in culturally responsive ways in relation to local needs and populations (Higginson 2003; Kamal 2013). Therefore, the review will help deliver hospital‐based specialist palliative care services in the midst of increased ageing populations that present with complex clinical needs against a backdrop of fiscal constraint and increased healthcare utilisation.
Description of the condition
Population‐based estimates of palliative care have indicated which populations require this service (Murtagh 2014), including those with malignant neoplasms and non‐malignant and other health‐related conditions, specifically: heart disease, including cerebrovascular disease, renal disease, liver disease, respiratory disease, neurodegenerative disease (Huntington’s disease, Parkinson’s disease, multiple sclerosis, motor neuron disease, multi‐system degeneration, progressive supranuclear ophthalmoplegia, Alzheimer's dementia and senility) and HIV/AIDS. Patients with any of these conditions and their unpaid caregivers were considered for inclusion in this review.
Description of the intervention
The intervention of interest is hospital‐based specialist palliative care (HSPC). In this review, hospital‐based specialist palliative care encompasses the following essential components:
-
care co‐ordinated by a multiprofessional or multidisciplinary team;
-
collaboration between specialist palliative care providers and generalist providers; and
-
holistic care (NCP 2013).
HSPC refers to care that is provided with the input of specialist palliative care providers to patients while they are admitted as inpatients to acute care hospitals, outpatients or patients receiving care from hospital outreach teams at home. The models of HSPC eligible for inclusion include ward‐based models, inpatient consulting models, outpatient models, hospital outreach models and service provision across multiple settings which included hospital. Ward‐based models encompassed care provision to patients and their families on a palliative care ward in hospital. Inpatient consulting models encompassed care provision to patients and their families by an inpatient consult team while they are admitted as inpatients to acute hospitals. Outpatient models comprised care provision to hospital outpatients and their families. Hospital‐at‐home or hospital outreach into the community involved care provision by hospital outreach teams in the patient's home as well as service provision across multiple settings including hospital.
The intervention aims to prevent or relieve physical, psychological, social and spiritual problems. It is provided to patients who have a malignant and/or non‐malignant condition who may or may not be at the end of their life (Dixon 2015). Recognising the importance of the informal unpaid caregiver, palliative care also aims to meet the psychological, social and spiritual needs of unpaid caregivers. (Grande 2017).
At the heart of palliative care is the belief that every person is unique, autonomous and that they have the right to continue to live and enjoy quality of life even though they are diagnosed with an advanced, life‐limiting or life‐threatening illness. Specialist palliative care is differentiated from generalist palliative care. Specialists are likely to have received higher specialist training in palliative care work and services focus mainly or exclusively on patients with palliative care needs; whereas for generalists, provision of palliative care is a component of their service provision (Dixon 2015) and they will not have received higher specialist traing in palliative care. Specialist care is mostly provided to patients with advanced, life‐limiting or life‐threatening illness who present with complex needs (NHS England 2016). Complexity, although sometimes difficult to define, involves clinical complexity and its interaction with the confidence or ability of the lead clinical team (generalists) to address the presenting need. Complexity may involve intertwined and multiple factors which may include related age, the serious nature of illness, social or familial backgrounds, and/or the nature of a symptom (e.g. the usualness or intractable nature of the symptom) (Palliative Care Australia 2005; Quill 2013).
Pre‐bereavement interventions are also specialist palliative care interventions administered to prevent or manage bereavement‐related physical, psychological, social and spiritual problems experienced by unpaid caregivers prior to the death of the patient (Aoun 2017; Breen 2014). We included specialist palliative care interventions involving pre‐bereavement interventions either to the unpaid caregiver alone or together with the patient.
How the intervention might work
Although positive outcomes, such as symptom reduction, improved quality of care and care co‐ordination, and reduced hospital costs, can result from hospital‐based specialist palliative care, qualitative methods such as interviews and empirical testing using randomised controlled trials have yet to definitively establish how hospital‐based specialist palliative care might work. Therefore, any descriptions of how hospital‐based specialist palliative care may work are speculative. That acknowledged, hospital‐based specialist palliative care may work with patients by the following:
-
directly improving symptoms (including physical and psychological symptoms, such as uncertainty and feelings of loss) through specialist interventions and holistic care (Temel 2010);
-
improving care quality by delivering or facilitating improved care co‐ordination and person‐centred holistic care (Daveson 2014; Pinnock 2011);
-
reducing futile medical interventions by mitigating against disease‐modifying priorities through optimal communication and shared decision‐making practice (Harris 2013
-
addressing holistic needs that span multimorbidity (Burge 2012); and
-
reducing unnecessary hospital costs through significant reduction in pharmaceutical, laboratory and intensive care unit costs (May 2014);
In addition, findings from published a systematic review (Harding 2012), RCTs (Allen 2008; Hudson 2005), and a before‐and‐after study (Lichtenthal 2011), indicated that the intervention may work for unpaid caregivers prior to the death of the patient through the following mechanisms:
-
emphasising the positive aspects of caregiving by providing relevant information, guidance and instruction. The intervention may also work by providing unpaid caregivers with individual support to see problems differently, draw out their optimism, helping them to plan and by providing them with access to expert information;
-
improving the unpaid caregiver’s understanding of their experiences and role to result in increased caregiving competencies and knowledge;
-
aiding their interpretation of their circumstance and normalising their emotional responses to caregiving demands;
-
enabling their involvement in care planning, where possible;
-
engaging both patients and unpaid caregivers in a life review within consultations which may work to reduce unpaid caregivers’ stress; and
-
ensuring timely assessment of needs, adaptive coping and access to needs‐based care through pre‐bereavement work.
The intervention may therefore also work via a preventive mechanism.
Why it is important to do this review
A previous systematic review by Higginson 2002 showed that hospital‐based palliative care improved clinical outcomes and quality of care and can reduce hospital costs. However, this review was small (nine studies) and only included cancer patients. A recent review in hospital, hospice or community settings by Gaertner 2017 showed that specialist palliative care led to improvement in quality of life with significant benefits for patients with cancer receiving specialist palliative care early. The results for pain and other outcomes were inconclusive. Another review by Haun 2017 showed that early palliative care interventions resulted in improved quality of life and lower symptom intensity compared with the control condition. Survival and levels of depression did not differ significantly between the early palliative care group and control group.
Since the publication of these systematic reviews, there have been at least six newly published RCTs on hospital‐based specialist palliative care and no review on its different models. In addition, the models of palliative care are continuously evolving. Recent UK government (DoH 2008), and commissioning guidance (NCPC 2012), have recommended that there ought to be delivery of a 24/7 palliative care service. However, the End of Life Care Audit 2016 showed that of the 142 acute NHS trusts in England participating, only 37% had specialist palliative care services available out‐of‐hours and this service varied with level of contact (telephone or on‐site visiting) and health professional involved (specialist nurse, junior doctor or consultant) (RCP 2016). The research priorities identified by the James Lind Alliance highlighted the need for research into identifying the core palliative care services needed and the best way of providing palliative care outside of working hours (JLA 2015). This Cochrane Review addresses these priorities. It is important that, following the Liverpool Care Pathway and Neuberger review, we examine the most effective methods and models of hospital‐based specialist palliative care in order to ensure that there is an evidence‐based approach to its delivery (Crown 2013).
A Cochrane Review has provided valuable evidence synthesis on the effectiveness and cost‐effectiveness of home palliative care services (Gomes 2013). However, there is no such available evidence for specialist palliative care in hospital inpatient, outpatient, outreach and services provided across multiple settings. Furthermore, the numbers of hospital‐based specialist palliative care teams are increasing (CAPC 2018; Meier 2011). This is occurring in response to unmet palliative needs of patients and their unpaid caregivers (Meier 2011), yet clarity regarding the effective components of the intervention is needed. This review may therefore assist with providing much‐needed solutions to problems, and clarity regarding the effectiveness and cost‐effectiveness of the component parts of hospital‐based specialist palliative care. In essence, the review may address some of the problems encountered by contemporary healthcare systems and services, service‐users, clinicians, policy‐makers, researchers and commissioners.
Objectives
To assess the effectiveness and cost‐effectiveness of hospital‐based specialist palliative care compared to usual care for adults with advanced illness and their unpaid caregivers/families.
Methods
Criteria for considering studies for this review
Types of studies
Due to the increasing numbers of RCTs in palliative and end‐of‐life care, and also because they are the most robust experimental design, this review only included RCTs (including cluster‐unit randomised trials). We used established approaches to include and analyse RCTs following the Cochrane Handbook for Systematic Reviews of Interventions (Higgins 2011a).
All studies evaluated effectiveness regarding one or more of our primary or secondary outcomes. In the economic component of the review, we included studies conducted alongside (or as part of) the main effectiveness trial and ones that also met the eligibility criteria for the effectiveness component. Full economic evaluation (i.e. cost‐effectiveness analyses, cost‐utility analyses, cost‐benefit analyses); partial economic evaluations (i.e. cost analyses, cost‐description studies, cost‐outcome descriptions); and studies that reported more limited information, such as estimates of resource use or costs associated with service use, were eligible for inclusion.
Types of participants
-
Adult (≥ 18 years) patients receiving hospital‐based specialist palliative care:
-
these patients were diagnosed with advanced, life‐limiting or life‐threatening illness (malignant or non‐malignant), which was likely to compromise their quality of life in some way;
-
diseases and health‐related conditions included (with the corresponding International Classification of Diseases (ICD‐10)) malignant neoplasms (ICD‐10 codes: C00‐C97) and non‐malignant and other health‐related conditions, specifically: heart disease, including cerebrovascular disease (ICD‐10 codes: I00‐I52, I60‐69), renal disease (ICD‐10 codes: N17, N18, N28, I12, I13), liver disease (ICD‐10 codes: K70‐K77), respiratory disease (ICD‐10 codes: J06‐J18, J20‐22, J40‐47, J96), neurodegenerative disease (Huntington’s disease (ICD‐10 code: G10), Parkinson's disease (ICD‐10 code: G20), multiple sclerosis (ICD‐10 code: G35), motor neuron disease (ICD‐10 code: G12.2)), multi‐system degeneration (ICD‐10 code: G90.3), progressive supranuclear ophthalmoplegia (ICD‐10 code: G23.1), Alzheimer’s dementia and senility (ICD‐10 codes: F01, F03, G20, R54), and HIV/AIDS (ICD‐10 codes: B20‐B24)); and
-
-
unpaid caregivers, including those who had received a pre‐bereavement intervention from one or more hospital‐based specialist palliative care staff in order to manage or alleviate bereavement‐related problems prior to the death of the inpatient: unpaid caregivers are likely to be family, friends or significant others associated with the patient (Payne 2010a; Payne 2010b).
Types of interventions
Hospital‐based Specialist Palliative Care (herein HSPC) varies between settings and countries. In order to allow for these differences, we included studies that described HSPC as "palliative care, generic palliative care, hospice care (provided in hospital settings) or specialist palliative care". It was delivered by a specialist palliative care team or by a "specialist palliative care", "palliative care" or "hospice outreach (based in hospital settings)" staff member. In order to account for differences in specialist palliative care between countries, and also because of the sometimes limited details provided on the specialist training of palliative care teams, we decided to include studies where training/clinical experience in specialist palliative care was made explicit as well as those that simply stated the involvement of a palliative care team; eligibility was informed by activity of delivering specialist palliative care rather than level of specialist training (Luckett 2014). Higher specialist training in palliative care was also accepted if the authors described the professionals as palliative care experts or specialists (for example, palliative care physician or nurse) or if they had obtained clinical competencies and professional characteristics required for the delivery of specialist palliative care through clinical experience (NCPC 2012). The intervention was provided to adults receiving hospital inpatient, outpatient, outreach or HSPC as part of wider services, and their unpaid caregivers/families.
We included studies of HSPC compared with usual care. Usual care was defined as inpatient or outpatient hospital care without specialist palliative care input (e.g. oncological care) at the point of entry into the study, community care (e.g. primary or specialist care provided in the patient’s place of residence) or hospice care provided outside of the hospital setting. Usual care patients may receive specialist palliative care after entry into the study if requested by the patient, their families or clinicians, however specialist palliative care should not be a routine part of usual care. We extracted descriptive data on what was involved in each intervention.
Similar to a Cochrane Review that examined home palliative care (Gomes 2013), we excluded trials that evaluated hospital palliative care practitioners’ provision of only a biomedical component of palliative care (e.g. oxygen therapy) as this does not encompass the holistic nature of palliative care assessment or treatment.
Types of outcome measures
We developed the primary and secondary outcomes for this review from previous reviews regarding the effectiveness of palliative care and those that we thought to be clinically relevant (Gomes 2013; Gysels 2004; Higginson 2003; Higginson 2010). The outcomes reflect the multicomponent nature of palliative care and the provision of both direct (e.g. face‐to‐face delivery of patient care) and indirect (e.g. concerning practitioners' prescribing rationale) patient care, and care for unpaid caregivers/families while the patient is still alive. We chose to measure health‐related quality of life and symptom burden reported as adjusted endpoint values as our primary outcomes. We selected health‐related quality of life and symptom burden as primary outcomes because the major focus of palliative care is to improve quality of life while providing optimal management of symptoms (Dixon 2015).
Primary outcomes
-
Patient health‐related quality of life, measured using validated assessment scales which may be generic and disease/condition‐specific health‐related quality of life measures; and
-
Patient symptom burden, specifically, a collection of two or more symptoms which could be physical (e.g. pain), psychological (e.g. anxiety, depression), social or spiritual domains, either patient or proxy‐reported through validated generalised assessment scales.
Secondary outcomes
-
Patient satisfaction with care through validated assessment scales;
-
Caregiver/family satisfaction with care through validated assessment scales;
-
Achieving patient's preferred place of care;
-
Achieving patient's preferred place of death;
-
Patient mortality/survival;
-
Pain measured using validated assessment scales;
-
Patient anxiety and depression measured using validated assessment scales;
-
Breathlessness measured using validated assessment scales;
-
Adverse events in participants and unpaid caregivers;
-
Unpaid caregiver symptom control, specifically physical, psychological (e.g. anxiety and depression), social or spiritual domains, reported through validated assessment scales and burden, including emotional strain, burden, distress, mastery or positive aspects of caregiving through validated assessment scales;
-
Unpaid caregiver pre‐ and post‐bereavement outcomes, reported using validated outcome scales of multidimensional caregiving experiences (strain, distress, positive appraisals, and family well‐being), caregiver prolonged grief, multidimensional grief responses (despair, panic behaviour, blame and anger, detachment, disorganisation and personal growth), quality of life.
-
Resource use: institutional care services use (e.g. emergency department (ED) or accident and emergency (A&E), intensive care unit use, inpatient stay, care in nursing homes (or skilled nursing homes) etc.), outpatient clinic services use (e.g. palliative care visits in outpatient settings, consultation with experts in outpatient settings), community care services use (e.g. contact with general practitioners, district nurses, home care, hospice care at home etc.), unpaid caregiver's care, and medications and other resources;
-
Costs and cost‐effectiveness: costs were calculated based on resource use and unit costs of services, while cost‐effectiveness was measured using e.g. incremental cost‐effectiveness ratios of costs and condition‐specific outcome measures or quality‐adjusted life years (QALYS) or an equivalent.
Search methods for identification of studies
We identified studies through electronic searches, handsearching, electronic citation tracking, personal contact and searching of grey literature. We did not place restrictions on language; we assessed non‐English papers with the assistance of a native speaker.
Electronic searches
We identified studies by searching the databases listed below, using a combination of key terms and MeSH terms:
-
Cochrane Library:
-
Cochrane Central Register of Controlled Trials (CENTRAL); Issue 8 of 12, 2019
-
Cochrane Database of Systematic Reviews (CDSR); Issue 8 of 12, 2019
-
Database of Abstracts of Reviews of Effects (DARE), Issue 2 of 4, 2015;
-
Health Technology Assessment (HTA), Issue 4 of 4, 2016;
-
National Health Service Economic Evaluation Database (NHS EED), Issue 2 of 4, 2015;
-
-
MEDLINE & MEDLINE‐in‐Process (OVID), 1947 to 27 August 2019;
-
Embase (OVID), 1974 to 27 August 2019;
-
CINAHL (EBSCO),1982 to 28 August 2019;
-
PsycINFO (OVID), 1806 to 28 August 2019;
-
CareSearch, Australian Government's Department of Health and Ageing (http://www.caresearch.com.au/) (from inception to 12 September 2019).
We could not carry out more recent searches in DARE, HTA and NHS EED because they are no longer updated. We also could not carry out a search of the health economic database EURONHEED as it is no longer available. We refined our search strategies with the assistance of the Information Specialist of the Cochrane Pain, Palliative and Supportive Care Review Group. Please see Appendix 1 for the MEDLINE search strategy in OVID and Appendix 2, Appendix 3, Appendix 4, Appendix 5 and Appendix 6 for all other search strategies.
Searching other resources
We searched clinicaltrials.gov (www.clinicaltrials.gov) and the World Health Organisation (WHO) International Clinical Trials Registry Platform (ICTRP) (http://apps.who.int/trialsearch/) for ongoing trials on 12 September 2019 (search term: palliative).
Handsearching
We screened the reference lists of all included studies, and three relevant systematic reviews (Haun 2017; Gaertner 2017; Gomes 2013), for additional studies.
Electronic citation tracking
We used the "Citation tacking" option in MEDLINE for lateral searching on the included studies, as recommended for palliative care reviews (Payne 2010a).
Personal contact
We contacted 15 experts in the field for unpublished and ongoing trials. We also contacted study authors for additional information where necessary.
Data collection and analysis
Selection of studies
Two review authors (AO and SB) independently screened all titles and abstracts identified in our electronic searches. If, after reading the abstract, doubt persisted regarding the eligibility of the study, we retrieved the full‐text articles for further assessment and again the two reviewers independently assessed these full‐text articles. We resolved disagreements by discussion and consensus. We reported our study selection process using a Preferred Reporting Items for Systematic Reviews and Meta‐Analyses (PRISMA) flow diagram (Liberati 2009) in Figure 1, as recommended in the Cochrane Handbook for Systematic Reviews of Interventions (Higgins 2011a).
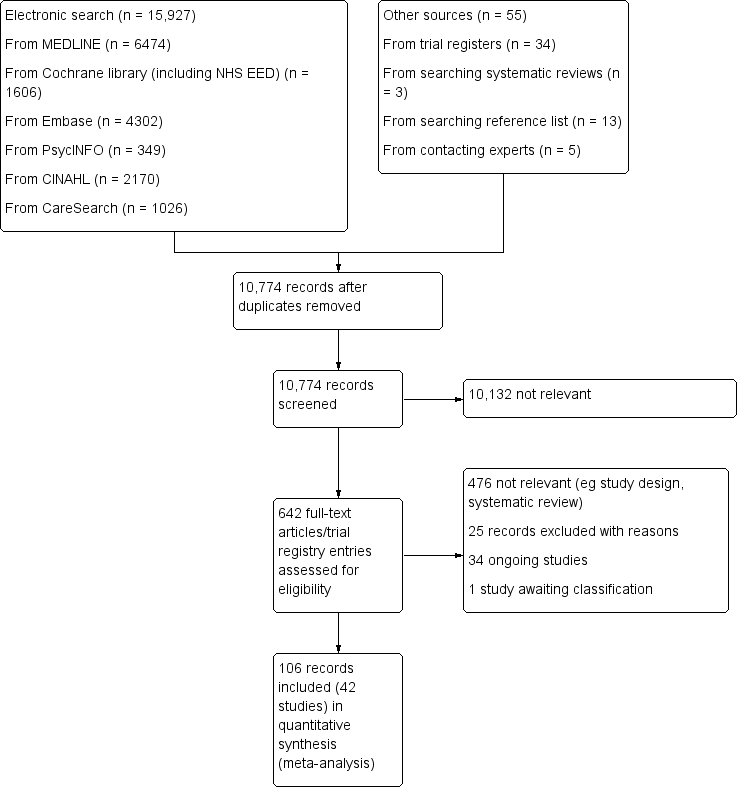
PRISMA flow diagram.
Data extraction and management
Two reviewers (AO and SB) independently extracted data from all included studies using a piloted data extraction form (Appendix 7), that we further developed for economic evaluation based on the format and guidelines used to produce structured abstracts of economic evaluations for inclusion in the NHS EED. We entered data into Review Manager (RevMan) (RevMan 2014). We resolved any disagreements by discussion and consensus. Given that the review included some studies by the review authors, we did not involve these authors in the assessment of or extraction of data from their studies. The data extraction form has been used previously for a review on the effectiveness of home palliative care (Gomes 2013). We adapted the form for this review regarding HSPC.
We collated multiple reports of the same study, so that each study rather than each report was the unit of interest in the review. We collected characteristics of the included studies in sufficient detail to populate a 'Characteristics of included studies' table.
Assessment of risk of bias in included studies
Two reviewers (AO and SB)independently assessed risk of bias for each included study, using the criteria outlined in the Cochrane Handbook for Systematic Reviews of Interventions (Chapter 12, Schunemann 2011), with any disagreements resolved by discussion. We completed a 'Risk of bias' table for each included study using the 'Risk of bias' tool for randomised controlled studies in RevMan (RevMan 2014).
We assessed the following for each included study:
-
Random sequence generation (checking for possible selection bias). We assessed the method used to generate the allocation sequence as:
-
low risk of bias (any truly random process, e.g. random number table; computer random number generator); or
-
unclear risk of bias (method used to generate sequence not clearly stated);
-
we excluded studies that used a non‐random process (e.g. odd or even date of birth; hospital or clinic record number).
-
-
Allocation concealment (checking for possible selection bias). The method used to conceal allocation to interventions prior to assignment determines whether intervention allocation could have been foreseen in advance of, or during recruitment, or changed after assignment. We assessed the methods as:
-
low risk of bias (e.g. telephone or central randomisation; consecutively numbered sealed opaque envelopes); or
-
unclear risk of bias (method not clearly stated);
-
we excluded studies that did not conceal allocation.
-
-
Blinding of participants and personnel (checking for possible performance bias) (subjective). We assessed the methods used to blind study participants and personnel from knowledge of which intervention a participant received for subjective outcomes (e.g. quality of life, pain, breathlessness). We grouped all subjective outcomes as being at high risk of bias if blinding was unsuccessful. When the study did not include subjective outcomes, we left this domain blank. We assessed the methods as:
-
low risk of bias (blinding of participants and key study personnel ensured, and unlikely that the blinding could have been broken);
-
unclear risk of bias (insufficient information to permit judgement of ‘low risk’ or ‘high risk’);
-
high risk of bias (no blinding or incomplete blinding; blinding of key study participants and personnel attempted, but likely that the blinding could have been broken, and the outcome is likely to be influenced by lack of blinding).
-
-
Blinding of participants and personnel (checking for possible performance bias) (objective). We assessed the methods used to blind study participants and personnel from knowledge of which intervention a participant received for objective outcomes (e.g. mortality, length of stay in hospital, number of readmissions). When the study did not include objective outcomes, we left this domain blank. We assessed the methods as:
-
-
low risk of bias (objective outcomes are unlikely to be influenced by lack of blinding and we treated these outcomes as a 'low risk of bias' even if blinding was unsuccessful or not carried out);
-
unclear risk of bias (insufficient information to permit judgement of ‘low risk’ or ‘high risk’); or
-
we did not rate a high risk of bias for an objective outcome.
-
-
Blinding of outcome assessment (checking for possible detection bias) (subjective). We assessed the methods used to blind outcome assessors from knowledge of which intervention a participant received for subjective outcomes. We grouped all subjective outcomes as being at high risk of bias if blinding was unsuccessful. When the study did not include subjective outcomes, we left this domain blank. We assessed the methods as:
-
low risk of bias (blinding of outcome assessment ensured, and unlikely that the blinding could have been broken);
-
unclear risk of bias (insufficient information to permit judgement of ‘low risk’ or ‘high risk’); or
-
high risk of bias (no blinding of outcome assessment; blinding of outcome assessment, but likely that the blinding could have been broken, and the outcome measurement is likely to be influenced by lack of blinding).
-
-
Blinding of outcome assessment (checking for possible detection bias) (objective). We assessed the methods used to blind outcome assessors from knowledge of which intervention a participant received for objective outcomes. Objective outcomes are unlikely to be influenced by lack of blinding and we rated these outcomes as a 'low risk of bias' even when blinding was unsuccessful or not carried out. When the study did not include objective outcomes, we left this domain blank. We assessed the methods as:
-
-
low risk of bias (e.g. no blinding of outcome assessment, but the review authors judge that the outcome measurement is not likely to be influenced by lack of blinding; blinding of outcome assessment ensured, and unlikely that the blinding could have been broken);
-
unclear risk of bias (insufficient information to permit judgement of ‘low risk’ or ‘high risk’); or
-
we did not rate a high risk of bias for an objective outcome.
-
-
Selective reporting (checking for reporting bias). We assessed whether primary and secondary outcome measures were prespecified and whether these were consistent with those reported. We assessed the methods as:
-
low risk of bias (protocol is available and all of the study’s prespecified primary and secondary outcomes that are of interest in the review have been reported in the prespecified way);
-
unclear risk of bias (insufficient information to permit judgement of ‘low risk’ or ‘high risk’, including, when the protocol is not available); or
-
high risk of bias (protocol is available and some prespecified outcomes were not reported; one or more primary outcomes were reported using measurements, analysis methods or subsets of the data (e.g. subscales) that were not prespecified; one or more reported primary outcomes were not prespecified).
-
-
Incomplete outcome data (checking for possible attrition bias due to the amount, nature and handling of incomplete outcome data). We assessed the methods used to deal with incomplete data as:
-
low risk (< 10% of participants did not complete the study or used ‘baseline observation‐carried‐forward’ analysis);
-
unclear risk of bias (used 'last‐observation‐carried‐forward' analysis or when the number of dropouts was not reported); or
-
high risk of bias (used 'completer' analysis).
-
-
Other bias (other sources of bias). We also assessed whether groups were balanced at baseline and whether differences at baseline were controlled for. We assessed the studies as:
-
low risk of bias (e.g. if there were no baseline differences or if observed differences were controlled for);
-
unclear risk of bias (e.g. if there were baseline differences and it was unclear if the differences were significant and also if they were controlled for); or
-
high risk of bias (e.g. if there were differences that were not controlled for).
-
-
Size of study (checking for possible biases confounded by small size). We assessed studies as being at:
-
low risk of bias (≥ 200 participants per treatment arm);
-
unclear risk of bias (50 to 199 participants per treatment arm; 50 to 199 participants in one treatment arm and ≥ 200 participants in another treatment arm; < 50 participants in one treatment arm and 50 to 199 participants in another treatment arm); or
-
high risk of bias (< 50 participants per treatment arm).
-
Quality assessment in studies with a cost/cost‐effectiveness component
We classified health economics studies per the design of the health economic study (e.g. full economic evaluation, partial economic evaluation) and the design of the study generating the effectiveness data of the health economic study (e.g. a single study design, a synthesis of several studies). For full economic evaluations, we assessed the risk of bias in results of the single effectiveness study on which the full economic evaluation study was based and methodological quality of the full economic evaluation study. We used as checklists the BMJ Checklist for authors and peer reviewers of economic submissions (Drummond 1996), and the Consensus on Health Economic Criteria (CHEC) list for assessment of methodological quality of economic evaluations (Evers 2005).
For assessment of the quality of relevant economic modelling studies, we planned to use tools such as the Consolidated Health Economic Evaluation Reporting Standards (CHEERS) statement (Husereau 2013), and the Quality Appraisal Checklist for Economic Evaluations (NICE 2012), supplemented by the Philips Checklist (Philips 2004). We could not apply these planned methods in this review as we did not identify any relevant economic modelling studies for inclusion; we plan to use these tools for future updates of the review, where appropriate.
Measures of treatment effect
If appropriate, we undertook meta‐analysis of the primary and secondary outcomes using RevMan (RevMan 2014). Given that eligible studies were conducted with different populations, countries and years, and that they included different models of HSPC, we had to incorporate the assumption of heterogeneity in the meta‐analysis of our outcomes. We used the inverse variance random‐effects model for meta‐analysis. This method summarises effect sizes from studies by calculating the weighted mean of the effect sizes using the inverse variance of the individual studies as weights (Lee 2016).
We combined data from the RCTs for the primary outcomes (patient health‐related quality of life and patient symptom burden) and expressed the pooled effect as standardised mean difference (SMD) for HSPC compared to usual care; values greater than 0 indicated better patient health‐related quality of life with HSPC, and less than 0 indicated worse health‐related quality of life. By contrast, for symptom burden, values greater than 0 indicated higher symptom burden and less than 0 reduced symptom burden.
We used a P value of 0.05 as the cut‐off value to determine statistical significance and we presented data as effect size with 95% CIs. We did not combine change values with endpoint values in our meta‐analysis because we pooled the data using SMD (Deeks 2011). Furthermore, we pooled adjusted endpoint values presented for patient health‐related quality of life and patient symptom burden as our main analyses because adjusted endpoint values control for differences and provide the most precise and least biased estimates of treatment effects (Deeks 2011). Where possible, we conducted similar meta‐analyses for the other outcomes with the exception of achieving preferred place of death (measured as home deaths) where we expressed the pooled effect as an odds ratio (OR) for HSPC compared to usual care; values greater than 1 indicated increased odds of achieving preferred place of death with HSPC, and less than 1 indicated decreased odds. Even though we used ORs to detect treatment effect, we also presented findings as risk ratios (RRs) (or relative risk) in order to aid the use and interpretation of the findings by end users. We used the Mantel‐Haenszel (M‐H) method in the meta‐analysis for achieving preferred place of death.
In order to combine different instruments in which an increase in score indicates improvement or an increase in score is worse in the same meta‐analysis, we multiplied the mean values from one set of studies by ‐1 to ensure that all the scales were in the same direction.
In order to interpret subgroup differences in our subgroup analyses, we considered the test for subgroup differences and also checked for confidence interval overlap. Where P values were < 0.05 in the test for subgroup differences, we considered this to be evidence of a subgroup effect. However, we were cautious in the interpretation of our subgroup analyses where there were a small number of studies and participants.
We considered that a SMD of 0.2 to < 0.5 constituted a small effect, 0.5 to < 0.8 a moderate effect and ≥ 0.8 constituted a large effect (Cohen 1988).
Economic data
We presented characteristics of the included health economics studies, such as year of study; details of interventions and comparators; study design; data sources; jurisdiction and setting; analytic perspective and time horizon, in the 'Characteristics of included studies' table as recommended in the Cochrane Handbook for Systematic Reviews of Interventions (Higgins 2011a). We summarised characteristics and results of included economic evaluations using additional tables, supplemented by a narrative summary that compared and evaluated methods used and principal results between studies. Where possible, we presented point estimates of measures of items of resource use and cost with associated measures of uncertainty for both the intervention and its comparators, as well as point estimates of incremental costs and cost‐effectiveness, again with associated measures of uncertainty. We converted costs to Great British Pounds (GBP) (2018) based on Purchasing Power Parities (PPP) and gross domestic product (GDP) deflators.
Unit of analysis issues
We addressed issues in the analysis of studies with particular characteristics, for example cluster‐randomised trials, in our meta‐analysis. We highlighted whether cluster‐randomised trials presented their intra‐cluster correlation coefficient (ICC) and if they made adjustment for clustering. Where studies adjusted for clustering, we used the data they presented in the meta‐analysis. However, where the authors did not present their ICC or adjust for clustering, we contacted the authors for an estimate of the ICC. Where authors did not respond, we estimated an ICC from a previous Cochrane review (Shepperd 2011) and used it to adjust for clustering in order to allow for inclusion of the study in our meta‐analysis. We carried out sensitivity analysis to test the estimate we used for clustering. The Cochrane Handbook for Systematic Reviews of Interventions suggests that decisions that may be somewhat unclear should be tested using sensitivity analysis (Higgins 2011a).
Dealing with missing data
When sample sizes and mean (SD) were missing, we did not carry out imputations or estimate the missing values for meta‐analysis. Rather, as recommended by the Cochrane Handbook for Systematic Reviews of Interventions (Higgins 2011a), we contacted study authors to request additional data. Where studies had missing intervention data (such as number of staff involved and skills and so on), we assessed the potential impact of these missing data on the findings of the review in the 'Discussion' section of the review. We sought clarity from study authors regarding study population, analysis and interventions, where required.
Assessment of heterogeneity
We examined and assessed heterogeneity through the following three measures:
-
inspecting the studies to examine for plausible areas of heterogeneity based on clinical factors that may influence findings of our meta‐analysis;
-
inspecting the forest plots;
-
using the I² statistics to examine the extent and impact of heterogeneity between included studies (Higgins 2011a).
Assessment of reporting biases
In order to detect and manage reporting bias, we took the following steps to attend to:
-
multiple (publication) bias by contacting study authors to ascertain whether duplication had occurred;
-
location bias by searching relevant national and international trial registries for all relevant studies (e.g. CENTRAL);
-
language bias by including studies published in languages other than English; and
-
outcomes reporting (including non‐publication of economic evaluation outlined in the protocol) through comparing the findings in eligible studies with published protocols, where available. Where published protocols were unavailable, we asked study authors to supply them.
In addition, where there were more than 10 included studies in our meta‐analysis, we used funnel plots and visually inspected them for asymmetry/symmetry as a means of exploring whether there was evidence that study size (precision) was associated with effect size. Where possible, we also conducted relevant tests for asymmetry influenced by data type (e.g. continuous or dichotomous), to assist with examining publication bias and to overcome any reliance on visual inspection (Lau 2006). When we observed asymmetry, we considered publication bias as one (of several) plausible explanations (Sterne 2001).
Data synthesis
Where eligible studies were not sufficiently homogenous to permit meta‐analysis, we extracted quantitative data (means, standard deviations, frequencies and proportions, test coefficients, 95% CIs and effects sizes, where available) and we employed techniques used in narrative synthesis to analyse the data, including:
-
tabulation, which involved inserting the main elements of extracted data into a table format;
-
textual descriptions, which involved collating a summary description of each included study (part of Characteristics of included studies);
-
clustering of group textual descriptions according to attributes; and
-
vote counting to determine how often certain attributes were reported (Rodgers 2009).
Where possible, we included qualitative data from nested or embedded qualitative studies where qualitative data were used as part of the trial to explore stakeholder views and experiences of the intervention. We analysed these through narrative synthesis methods.
Quality of the evidence
Two review authors independently rated the quality of the outcomes. We used the Grading of Recommendations, Assessment, Development and Evaluation (GRADE) system to rank the quality of the evidence using the GRADEprofiler Guideline Development Tool software (GRADEpro GDT 2015) and the guidelines provided in the CochraneHandbook (Chapter 12, Higgins 2011a).
The GRADE approach uses five considerations (study limitations, consistency of effect, imprecision, indirectness and publication bias) to assess the quality of the body of evidence for each outcome (Chapter 12, Higgins 2011a). The GRADE system uses the following criteria for assigning grades of evidence:
-
high: we are very confident that the true effect lies close to that of the estimate of the effect.
-
moderate: we are moderately confident in the effect estimate; the true effect is likely to be close to the estimate of effect, but there is a possibility that it is substantially different.
-
low: our confidence in the effect estimate is limited; the true effect may be substantially different from the estimate of the effect.
-
very low: we have very little confidence in the effect estimate; the true effect is likely to be substantially different from the estimate of effect.
The GRADE system uses the following criteria for assigning a quality level to a body of evidence (Chapter 12, Higgins 2011a):
-
high: randomised trials; or double‐upgraded observational studies;
-
moderate: downgraded randomised trials; or upgraded observational studies;
-
low: double‐downgraded randomised trials; or observational studies;
-
very low: triple‐downgraded randomised trials; or downgraded observational studies; or case series/case reports.
Factors that may decrease the quality level of a body of evidence are:
-
limitations in the design and implementation of available studies suggesting high likelihood of bias;
-
indirectness of evidence (indirect population, intervention,control, outcomes);
-
unexplained heterogeneity or inconsistency of results (including problems with subgroup analyses);
-
imprecision of results (wide CIs);
-
high probability of publication bias.
Factors that may increase the quality level of a body of evidence are:
-
large magnitude of effect;
-
all plausible confounding would reduce a demonstrated effect or suggest a spurious effect when results show no effect;
-
dose‐response gradient.
We downgraded the quality of the evidence by one (−1) or two (−2) if we identified:
-
serious (−1) or very serious (−2) limitation to study quality;
-
important inconsistency (−1);
-
some (−1) or major (−2) uncertainty about directness;
-
imprecise or sparse data (−1);
-
high probability of reporting bias (−1).
'Summary of findings' table
We included a 'Summary of findings' table to present the main findings in a transparent and simple tabular format. The table summarised the comparison of HSPC versus usual care (which could be inpatient or outpatient hospital care without specialist palliative care input (e.g. oncological care) at the point of entry to the study, community care (e.g. primary or specialist care provided in the patient’s place of residence), and hospice care provided outside of the hospital setting). The table included key information concerning the quality of the evidence, the magnitude of effect of the interventions examined, and the sum of available data on the outcomes patient health‐related quality of life, patient symptom burden, patient satisfaction with care, achieving patient preferred place of death (measured by number of patients with home death), pain, unpaid caregiver burden, and cost/cost‐effectiveness.
Subgroup analysis and investigation of heterogeneity
As part of our primary objective, we identified the effective components and determined the comparative effectiveness of HSPC for adults with advanced illness and their unpaid caregivers/families. We compared the resources and costs associated with these services and determined their cost‐effectiveness; compared effectiveness by disease type (e.g. malignant and non‐malignant groups), and country; and we examined other sources of heterogeneity and the applicability of meta‐analysis.
Where possible, we performed subgroup analysis using the following components known to influence the effectiveness of specialist palliative care:
-
disease type, including malignant, non‐malignant and mixed malignant and non‐malignant disease (mixed diagnoses);
-
frailty associated with advanced age;
-
HSPC team composition (e.g. physician‐led, nurse‐led versus multidisciplinary team‐led palliative care services and organisation (e.g. 24‐hour access (out‐of‐hours) versus temporally restricted access)) and taxonomy of the components;
-
models of HSPC (ward‐based model, inpatient consult model, outpatient model, outreach model and service provision across multiple settings);
-
early palliative care versus late palliative care to assess the effectiveness of hospital‐based palliative care applied early in the course of a life‐threatening disease from palliative care delivered mainly with high symptom burden or in the terminal phase of illness. To be classified as early palliative care, early palliative care intent had to be stated explicitly or reflected in the sample composition, i.e. most participants had to be enrolled shortly after diagnosis of advanced disease (Haun 2017). Anything besides this, we classified as late palliative care; and
-
country of origin.
Sensitivity analysis
We carried out sensitivity analyses to explore a number of our methodological decisions.
We conducted sensitivity analysis to assess our decision to use an estimate of intracluster‐correlation coefficient (ICC) we had obtained from a previous Cochrane review (Shepperd 2011) to adjust for clustering in one of the cluster‐RCTs (McCorkle 2015). The authors did not respond to our request for the ICC from their study.
Given that combining endpoint scores and change scores is not recommended when using standardised mean differences (SMDs) and also that Cochrane does not recommend pooling adjusted and unadjusted estimates together
(Deeks 2011), we pooled studies presenting adjusted endpoint scores as our main meta‐analysis while we carried out sensitivity analyses with studies reporting unadjusted endpoint scores, adjusted change scores and unadjusted change scores.
Results
Description of studies
Also see the Characteristics of included studies; Characteristics of excluded studies; Characteristics of studies awaiting classification; Characteristics of ongoing studies tables.
Results of the search
We identified 15,927 records from our electronic searches and an additional 55 records from other sources. After removing duplicates, two authors independently screened the titles and abstracts of 10,774 records, excluded 10,132 records and selected 642 for full‐text reading. We classed 476 records as not relevant (e.g. systematic reviews, study design).
We included 42 studies reported in 106 records (91 full papers and 15 abstracts), ranging from one to ten records per study (see Included studies). Of the remaining records, we excluded 25 with reasons (see Excluded studies); 34 are ongoing studies, and one study is awaiting classification (Aljohani 2015) (see Figure 1 for the PRISMA flow diagram).
Included studies
Design
All the studies we included were RCTs, comprising one cluster‐RCT (McCorkle 2015), one cluster‐randomised crossover trial (Ma 2019) and eight fast‐track RCTs (Bajwah 2015; Bakitas 2015; Edmonds 2010; Farquhar 2014; Farquhar 2016; Higginson 2009; Higginson 2014; McWhinney 1994). The remaining 32 RCTs had a parallel design.
Sample sizes
Sample sizes in included studies ranged from 30 to 621 participants. The length of recruitment in included studies varied between 10 months and 50 months. In total, we included data from studies involving 7779 participants (6678 adults with advanced illness and 1101 unpaid caregivers/family members). Thirty‐three studies had power calculations (details in 'Characteristics of included studies'). Nine studies were powered on quality of life only (Bekelman 2018; El‐Jawahri 2016; Franciosi 2019; Groenvold 2017; Rogers 2017; Tattersall 2014; Temel 2010; Temel 2017; Vanbutsele 2018). Ma 2019 was powered on proportion of patients transitioning to do‐not‐resuscitate and do‐not‐intubate (DNR/DNI). In addition to quality of life, Bakitas 2015 also performed calculations on depression, Solari 2018 on symptom burden, O'Riordan 2019 on pain, while Bakitas 2009 and Sidebottom 2015 included depression and symptom burden. Farquhar 2014 and Farquhar 2016 were powered on distress due to breathlessness, Brannstrom 2014 on symptom burden, Brumley 2007 on cost, Carson 2016 on depression and anxiety, Grudzen 2016 on time to palliative care, Janssens 2019 on hospital admission, Rodin 2019 on traumatic stress symptoms, Bajwah 2015, Edmonds 2010 and Higginson 2009 on the Palliative care Outcome Scale (POS), Lowther 2015 on the African Palliative care Outcome Scale (APOS), Higginson 2014 on Chronic Respiratory Disease Questionnaire (CRDQ) mastery domain, Hopp 2016 and Ozcelik 2014 on palliative outcomes and palliative care service respectively, McWhinney 1994 on pain and nausea and Woo 2019 on pain and depression.
Eight studies were well‐powered at recruitment and also at the primary point of analyses (Carson 2016; Edmonds 2010; Farquhar 2016; Higginson 2014; Ma 2019; Ozcelik 2014; Solari 2018; Temel 2017). Fourteen studies were underpowered at recruitment stage (i.e. participants enrolled) by three participants (Brumley 2007; Groenvold 2017; Hopp 2016), four (Grudzen 2016), eight (Rodin 2019), 19 (Nottelmann 2018), 25 (O'Riordan 2019), 30 (Tattersall 2014), 50 (Rogers 2017), 74 (McWhinney 1994), 78 (Bakitas 2009), 111 (Janssens 2019), 153 (Bakitas 2015) and 268 (Sidebottom 2015). In one of the underpowered studies (Rogers 2017), the data and safety monitoring board in consultation with the sponsoring agency recommended a sample size reduction due to enrollment rates, a mortality rate that was lower than predicted and observed outcomes differences at the intermediate time point. Reasons provided for underpowered studies included slower than anticipated accrual, resource constraints, early deaths, problems with recruitment and low compliance rate for completion of questionnaires. The remaining 11 studies included the numbers that they had planned to recruit but dropped below the required numbers by the first time point of analyses (i.e. following baseline assessment and after receiving the intervention or control). These studies were underpowered by two participants (Brannstrom 2014), three participants (El‐Jawahri 2016), five participants each (Bajwah 2015; Higginson 2009), six participants each (Lowther 2015; Farquhar 2014), 13 participants (Temel 2010), 22 participants (Vanbutsele 2018), 29 participants (Franciosi 2019), 60 participants (Woo 2019) and 70 participants (Bekelman 2018). Nine studies did not report any power calculation (Ahronheim 2000; Cheung 2010; Gade 2008; Jingfen 2017; Kane 1984; Mendoza‐Galindo 2018 (abstract only); McCaffrey 2013; McCorkle 2015; Wallen 2012) (see Figure 2 for a graphical representation of the power of included studies at recruitment and follow‐up). Overall, 14 studies examined post‐intervention assessments in more than 100 participants.

A figure describing the power of included studies at recruitment and follow‐up
Setting
Nineteen studies were carried out in USA. Six studies took place in the UK (Bajwah 2015; Edmonds 2010; Farquhar 2014; Farquhar 2016; Higginson 2009; Higginson 2014), and three studies occurred in Australia (Cheung 2010; McCaffrey 2013; Tattersall 2014). One study was conducted in Sweden (Brannstrom 2014), two in Denmark (Groenvold 2017; Nottelmann 2018), one in Switzerland (Janssens 2019), one in Belgium (Vanbutsele 2018), two in Italy (Franciosi 2019; Solari 2018), and one in Turkey (Ozcelik 2014). McWhinney 1994 and Rodin 2019 were carried out in Canada, while Woo 2019 was undertaken in South Korea. Lowther 2015 took place in Kenya and Jingfen 2017 was conducted in China. Mendoza‐Galindo 2018 (abstract only) was carried out in Mexico.
Thirty studies recruited from hospital settings. Three of these studies recruited from intensive care units (ICU) (Carson 2016; Cheung 2010; Ma 2019). Of these 30 studies, Ahronheim 2000 recruited patients with advanced dementia from Mount Sinai Hospital, Bajwah 2015 recruited from a specialist interstitial lung disease centre, Janssens 2019 from patients followed by Geneva University Hospitals on long‐term oxygen therapy (LTOT) and/or home non‐invasive ventilation (NIV) as well as those hospitalised for acute exacerbation of Chronic Obstructive Oulmonary Disease (COPD) in the general internal medicine and geriatric wards, Lowther 2015 from outpatient HIV clinics in a community hospital, McCorkle 2015 from disease‐specific multidisciplinary clinics at a cancer hospital, O'Riordan 2019 from new inpatient admissions to the medicine and cardiology services, Solari 2018 from three Italian multiple sclerosis centres and Franciosi 2019 from outpatient and inpatient settings at five Italian cancer centres. Seven studies recruited from oncology centres or clinics (Groenvold 2017; Rodin 2019; Tattersall 2014; Temel 2010; Temel 2017; Vanbutsele 2018; Woo 2019). Bakitas 2009 and Bakitas 2015 recruited from oncology clinics of a cancer centre and affiliated outreach clinics and the Veterans Affairs Medical Centre (VAMC).
Eleven studies recruited from primary care and/or secondary care. For example, Gade 2008 recruited from community medical services and inpatient units, while McWhinney 1994 recruited through family physicians and home care nurses. Brumley 2007 received referrals from discharge planners, primary care physicians and other specialty physicians, whereas Rogers 2017 enrolled both hospitalised patients and recently discharged patients who were at high risk of rehospitalisation. Higginson 2009 received referrals from local health and social care professionals. Edmonds 2010 received referrals from health and social care professionals and, in a few instances, through voluntary organisations and self‐referral.
Mendoza‐Galindo 2018 (abstract only) did not present the setting where recruitment took place..
Participants
Twenty‐one studies were carried out with patients who had severe/advanced cancer or their unpaid caregivers/family members or both (Bakitas 2009; Bakitas 2015; El‐Jawahri 2016; Farquhar 2014; Franciosi 2019; Groenvold 2017; Grudzen 2016; Jingfen 2017; Kane 1984; McCorkle 2015; McWhinney 1994; Mendoza‐Galindo 2018 (abstract only); Nottelmann 2018; Ozcelik 2014; Rodin 2019; Tattersall 2014; Temel 2010; Temel 2017; Vanbutsele 2018; Wallen 2012; Woo 2019). A range of cancers were included in these studies comprising solid and non‐solid tumour cancers. Seven studies involved both cancer and non‐cancer populations (mixed populations) (Brumley 2007; Carson 2016; Cheung 2010; Gade 2008; Higginson 2014; Ma 2019; McCaffrey 2013), while the remaining 14 studies had only non‐cancer populations. The non‐cancer populations were those with interstitial lung disease (Bajwah 2015), heart failure (Bekelman 2018; Brannstrom 2014; Hopp 2016; O'Riordan 2019; Rogers 2017; Sidebottom 2015), HIV (Lowther 2015), dementia (Ahronheim 2000), multiple sclerosis (Edmonds 2010; Higginson 2009; Solari 2018), COPD (Janssens 2019) and a combination of COPD (83%) and other non‐malignant diseases (Farquhar 2016). Two studies were with rural populations (Bakitas 2009; Bakitas 2015), while Hopp 2016 was with a predominantly African‐American population (92%). Thirty‐five studies were conducted or first published from 2010 onwards, with 89% taking place within the last six years (see Characteristics of included studies for details).
Mean/median age ranged from 38.3 to 85.6 years. About the same number of males and females were included in most studies. However, five studies had between 69% and 82% females (Ahronheim 2000; Edmonds 2010; Higginson 2009; Lowther 2015; Ozcelik 2014), whereas nine studies had 60% to 98% males (Bajwah 2015; Bakitas 2009; Bekelman 2018; Brannstrom 2014; Farquhar 2016; Franciosi 2019; Kane 1984; Rodin 2019; Vanbutsele 2018). Ahronheim 2000 had the highest percentage of females (82%). Kane 1984 who recruited at a Veterans Administration hospital included predominantly male veterans. Wallen 2012 did not provide the gender distribution in their population. Unpaid caregivers/family members included in studies tended to be mainly females. Nine of the 16 studies involving unpaid caregivers/families described one or more of their characteristics: they were mainly spouses and women, and had a median/mean age ranging from 51 to 65.6 years. In five studies, between 16% and 43% of patients lived alone (Farquhar 2014; Farquhar 2016; Higginson 2009; McCorkle 2015; Vanbutsele 2018).
Sixteen studies had survival as an inclusion criterion. Life expectancy specified in these studies ranged from > 72 hours to 24 months. Eight studies specifically stated that they included newly diagnosed patients (Bakitas 2015; Franciosi 2019; McCorkle 2015; Nottelmann 2018; Rodin 2019; Temel 2010; Temel 2017; Woo 2019). Exclusion criteria included the presence of severe mental illness (Bakitas 2009; Bakitas 2015; Hopp 2016; Jingfen 2017; Temel 2017), and palliative care/hospice involvement previously or at present/request for palliative care involvement (Bajwah 2015; Carson 2016; Cheung 2010; Franciosi 2019; Grudzen 2016; Ma 2019; Nottelmann 2018; Rodin 2019; Sidebottom 2015; Solari 2018; Tattersall 2014; Temel 2010; Temel 2017; Vanbutsele 2018). In three studies, patients without surrogate decision‐makers were excluded (Carson 2016; Cheung 2010; Solari 2018), while Gade 2008 excluded patients if they had impaired cognitive status and no surrogate. Janssens 2019 and Rodin 2019 excluded patients with moderate or severe cognitive impairment.
Intervention
Hospital Based Specialist Palliative Care (HSPC)
We included different models of HSPC in this review. Some were new interventions evaluated through feasibility/pilot studies or early phase trials (e.g. Bajwah 2015; Cheung 2010; Edmonds 2010; Higginson 2009; Nottelmann 2018; Rodin 2019); others had existed for some time. Services were based in hospitals, with three studies in hospital ICUs (Carson 2016; Cheung 2010; Ma 2019), and three in palliative care centres/units of hospitals (Groenvold 2017; Jingfen 2017; McWhinney 1994). The hospice programme in Kane 1984 was located in a Veterans Administration hospital. Most served urban and suburban populations. Both Bakitas 2009 and Bakitas 2015 evaluated telephone‐based hospital interventions for rural populations.
The HSPC models in the 42 included studies were:
-
ward‐based services. This was provided by only Jingfen 2017;
-
inpatient consult or advisory services. This was provided by 10 studies: Ahronheim 2000; Carson 2016; Cheung 2010; El‐Jawahri 2016; Gade 2008; Grudzen 2016; Hopp 2016; Ma 2019; Ozcelik 2014; Sidebottom 2015;
-
outpatient services. This was provided by six studies: Lowther 2015; Mendoza‐Galindo 2018 (abstract only); Nottelmann 2018; Tattersall 2014, Temel 2010; Woo 2019;
-
hospital outreach services. This was provided by five studies: Bajwah 2015; Brannstrom 2014; Janssens 2019; McWhinney 1994; Solari 2018; and
-
service provision across multiple settings including hospital. This was provided by 20 studies: Bakitas 2009; Bakitas 2015; Bekelman 2018; Brumley 2007; Edmonds 2010; Farquhar 2014; Farquhar 2016; Franciosi 2019; Groenvold 2017; Higginson 2009; Higginson 2014; Kane 1984; McCaffrey 2013; McCorkle 2015; O'Riordan 2019; Rodin 2019; Rogers 2017; Temel 2017; Vanbutsele 2018; Wallen 2012.
In order to be included in this review, one of the criteria was that care should be co‐ordinated by a multidisciplinary team. Consequently, all the studies included a multidisciplinary HSPC team either as the core team providing the intervention or a multidisciplinary team was included as needed. Seven studies included HSPC teams led by nurses (Bajwah 2015; Bakitas 2009; Lowther 2015; McCaffrey 2013; Nottelmann 2018; Tattersall 2014; Vanbutsele 2018), while none of the studies included HSPC teams that were physician‐led. In one study, it was unclear who was leading the HSPC (Mendoza‐Galindo 2018 (abstract only)). Multi‐disciplinary team members ranged from two to eight professionals, mainly comprising nurses, physicians and sometimes social workers.
Five studies had HSPC that had 24 hours access (out‐of‐hours care). The hospital outreach service provided by McWhinney 1994 included 24 hours on‐call service, while another hospital outreach service organised the intervention in close co‐operation with out‐of‐hours palliative advanced home care (Brannstrom 2014). In McCaffrey 2013, services traversed multiple settings, including hospital and nursing services, and were provided up to 24 hours a day at home for up to five days. Brumley 2007 involved service provision across multiple settings including hospital and also included 24 hours on‐call service. The inpatient consult service provided by Gade 2008 included a palliative care physician on call after hours.
Thirty‐one studies either included certified experts in palliative care or those described as palliative care clinicians (without being explicit about their training). For example, Bakitas 2015 included a board‐certified palliative care clinician and advanced practice palliative care nurse specialists, while Gade 2008 included a multiprofessional team comprising a palliative care physician, nurse, hospital social worker and chaplain. Janssens 2019 included a palliative care team comprising nurses with experience in palliative care and a physician specialised in palliative care. Furthermore, Higginson 2009 evaluated a new short‐term specialist palliative care intervention involving one to three contacts provided by a core team of a part‐time consultant in palliative medicine, part‐time palliative care nurse, psychosocial worker and administrator comprising consultation and shared care with other care providers. Bajwah 2015, Edmonds 2010 and Nottelmann 2018 were also new palliative care services. Bajwah 2015 was developed for people with interstitial lung disease and involved a hospital‐to‐home case conference attended by the palliative care nurse who organised it and different healthcare professionals, while the service in Edmonds 2010 comprised a part‐time consultant in palliative medicine with a special interest in neurological conditions, a part‐time clinical nurse specialist and a full time administrator. Nottelmann 2018 was a palliative rehabilitation service delivered by a specialised palliative care team consisting of physicians, nurses, physiotherapists, psychologists, a part time social worker, dietician, occupational therapist, and chaplain. In Franciosi 2019, the palliative care intervention was provided across multiple settings and involved nurses working full time in palliative care as well as double‐boarded certified oncologists and palliative care physicians. A palliative care physician and nurse that were separate from the haematology team provided the intervention in Rodin 2019. Other multidisciplinary team members were involved as needed. Sidebottom 2015 assessed inpatient palliative care for patients with heart failure. The inpatient palliative care team included four physicians who were board‐certified in hospice and palliative medicine, two clinical nurse specialists board‐certified in advanced practice palliative care nursing, a chaplain and a social worker. The remaining 11 studies only stated the involvement of professionals who delivered specialist level interventions without any details on their training or whether they were palliative care clinicians (Ahronheim 2000; Cheung 2010; Groenvold 2017; Grudzen 2016; Hopp 2016; Jingfen 2017; McCaffrey 2013; Mendoza‐Galindo 2018 (abstract only); O'Riordan 2019; Ozcelik 2014; Woo 2019).
Early palliative care was evaluated in 19 studies (Bakitas 2009; Bakitas 2015; El‐Jawahri 2016; Franciosi 2019; Groenvold 2017; Grudzen 2016; Higginson 2014; Janssens 2019; Ma 2019; McCorkle 2015; Mendoza‐Galindo 2018 (abstract only); Nottelmann 2018; Rodin 2019; Tattersall 2014; Temel 2010; Temel 2017; Vanbutsele 2018; Wallen 2012; Woo 2019). Early palliative care intent either had to be stated explicitly or most participants had to enrolled shortly after diagnosis of advanced disease. Bakitas 2009 included patients who were within eight to 12 weeks of a new diagnosis of advanced cancer, while Bakitas 2015 included patients with advanced cancer who were within 30 and 60 days of diagnosis. McCorkle 2015 recruited patients with a late‐stage cancer diagnosis within 100 days, whereas Temel 2010 included patients with metastatic lung cancer diagnosed within the previous eight weeks. Similarly, four studies included patients who were within eight weeks of diagnosis of advanced cancer (Franciosi 2019; Nottelmann 2018; Temel 2017; Woo 2019). Temel 2017 recruited patients with incurable lung or non‐colorectal Gastrointestinal cancer, while Franciosi 2019 recruited patients with non‐small cell lung cancer, pancreatic, gastric or biliary tract cancer. Nottelmann 2018 involved patients diagnosed with non‐resectable solid cancer, and Woo 2019 recruited those with a diagnosis of advanced or metastatic pancreatic or biliary tract cancer. Vanbutsele 2018 included patients who were within the first 12 weeks of a new primary tumour or had a diagnosis progression. In El‐Jawahri 2016, the intention was early palliative care and the intervention was delivered during hospitalisation for haematopoietic stem cell transplantation (HCT) care. Groenvold 2017 initiated their palliative care intervention earlier than would otherwise have been the case among patients with advanced cancer, while Grudzen 2016 assessed early referral to palliative care for emergency department patients with advanced cancer. Rodin 2019 delivered early palliative care interventions to patients newly diagnosed with acute leukaemia. Wallen 2012 began an early palliative care intervention postoperatively for patients with advanced cancer. Tattersall 2014 included ambulatory patients with newly‐detected incurable metastatic cancer. Higginson 2014 evaluated early palliative care integrated with respiratory services for patients with a range of malignant and non‐malignant advanced diseases (mixed populations) and refractory breathlessness. Janssens 2019 assessed early palliative care for patients with severe and very severe COPD over a one‐year period while Mendoza‐Galindo 2018 (abstract only) stated that their intervention was an early palliative care intervention for patients with newly‐diagnosed or relapsed metastatic breast cancer. Ma 2019 involved early triggered palliative care consultation within 48 hours of ICU admission.
Eleven studies were theoretically grounded: case conference/management (Bajwah 2015; Ozcelik 2014), chronic care model (Bakitas 2009), person‐centred palliative care (Brannstrom 2014), palliative care approach (Farquhar 2014; Farquhar 2016), hospice (Brumley 2007; Kane 1984), knowledge‐belief‐action model (Jingfen 2017), trauma‐focussed cognitive behavioural therapy (Rodin 2019), and palliative care and physiotherapy approach (Higginson 2014). Two studies were modelled after hospice programmes (Brumley 2007; Kane 1984).
Twenty‐three studies included HSPC that provided some level of unpaid caregiver/family support ranging from meeting with unpaid caregivers/families to discuss care options to education/counselling or provision of psychological interventions aimed at supporting patient and unpaid caregiver/family dyads.
Taxonomy of the components of HSPC
We assessed the components of HSPC in the studies included in this review using the principles and domains of palliative care highlighted by Zimmermann 2019. Zimmermann 2019 developed a conceptual framework highlighting the domains and principles of team‐based outpatient early palliative care for patients with cancer. This framework is based on palliative care theory (Doyle 1998; WHO 2002; Zimmermann 2004; Zimmermann 2012), review of previous palliative care interventions (Zimmermann 2008) and practice guidelines (Cancer Care Ontario 2016; NCCN 2016). This framework was chosen above others such as the Holistic Common Assessment (National End of Life Care Programme 2010), which is used for comprehensive palliative care assessment, because the essential elements of the framework are consistent with the need for early provision of palliative care in collaboration with the multidisciplinary team, and also because it is based on the needs of the patient and their family, rather than on prognosis.
The four domains are coping and support, decision‐making, symptom control and future planning, while the four principles are that care is flexible, attentive, patient‐ and family‐centred.
Components of HSPC in studies that either included certified experts in palliative care or those described as palliative care clinicians
Thirty‐one studies either included certified experts in palliative care or those described as palliative care clinicians. Eight studies were only patient‐centred (Brannstrom 2014; Rodin 2019; Rogers 2017; Sidebottom 2015; Tattersall 2014; Temel 2017; Vanbutsele 2018; Wallen 2012), while Carson 2016 was only family‐centred because the intervention was a palliative care‐led meeting for families of patients in the medical intensive care unit. Twenty‐two studies were both patient‐centred and family‐centred (Bajwah 2015; Bakitas 2009; Bakitas 2015; Bekelman 2018; Brumley 2007; Edmonds 2010; El‐Jawahri 2016; Farquhar 2014; Farquhar 2016; Franciosi 2019; Gade 2008; Higginson 2009; Higginson 2014; Janssens 2019; Kane 1984; Lowther 2015; Ma 2019; McCorkle 2015; McWhinney 1994; Nottelmann 2018; Solari 2018; Temel 2010). For instance, the HSPC intervention in Bajwah 2015 was individualised to each patient and carer, while Vanbutsele 2018 described the use of semi‐structured monthly consultations by palliative care nurses that allowed for individualised care. Bekelman 2018 described collaboration between patients and the nurse as they both agreed on the symptom to focus on.
Palliative care in all 31 studies except Kane 1984 involved provision of care that was flexible and attentive to the needs of patients and/or their families as they allowed for the involvement of other members of the healthcare team in order to address these needs.
We mapped the 31 studies to the four domains highlighted above. We added care co‐ordination as an additional domain because the need for co‐ordinated care for those with advanced disease is not always delivered and this can result in increased hospitalisations and suboptimal clinical outcomes (Higginson 2003; Walsh 2011) (see Table 1 under Additional tables for the domains covered in the studies and Figure 3 for the percentage of studies assessing different domains).
| Author | Symptom control (e.g. assess symptoms, prescribing of medications) | Decision‐making (e.g. enquire about goals of care) | Future planning (e.g. advance care planning) | Coping and support (e.g. emotional and practical support) | Care co‐ordination (e.g. helping with co‐ordinating care) |
|---|---|---|---|---|---|
| Yes | Yes | Yes | Yes | Yes | |
| Yes | Yes | Yes | Yes | Yes | |
| Yes | Yes | Yes | Yes | Yes | |
| Yes | Yes | No | Yes | Yes | |
| Yes | Yes | No | Yes | Yes | |
| Yes | Yes | Yes | Yes | Yes | |
| No | Yes | No | Yes | No | |
| Yes | Yes | Yes | Yes | Yes | |
| Yes | No | No | Yes | No | |
| Yes | Yes | Yes | Yes | No | |
| Yes | Yes | Yes | Yes | No | |
| Yes | Yes | No | Yes | Yes | |
| Yes | Yes | Yes | Yes | No | |
| Yes | No | Yes | Yes | Yes | |
| Yes | Yes | Yes | Yes | Yes | |
| Yes | Yes | Yes | Yes | Yes | |
| Yes | No | Yes | Yes | No | |
| Yes | Yes | Yes | Yes | No | |
| Yes | Yes | No | Yes | Yes | |
| Yes | Yes | No | Yes | Yes | |
| Unclear | Unclear | Unclear | Yes | Unclear | |
| Yes | Yes | Yes | Yes | Yes | |
| Yes | No | No | Yes | No | |
| Yes | Yes | Yes | Yes | Yes | |
| Yes | Yes | Yes | Yes | Yes | |
| Unclear | Unclear | Unclear | Yes | Unclear | |
| Yes | No | No | Yes | No | |
| Yes | Yes | No | Yes | Yes | |
| Yes | Yes | No | Yes | Yes | |
| Yes | Yes | No | Yes | Yes | |
| Yes | No | No | Yes | No |
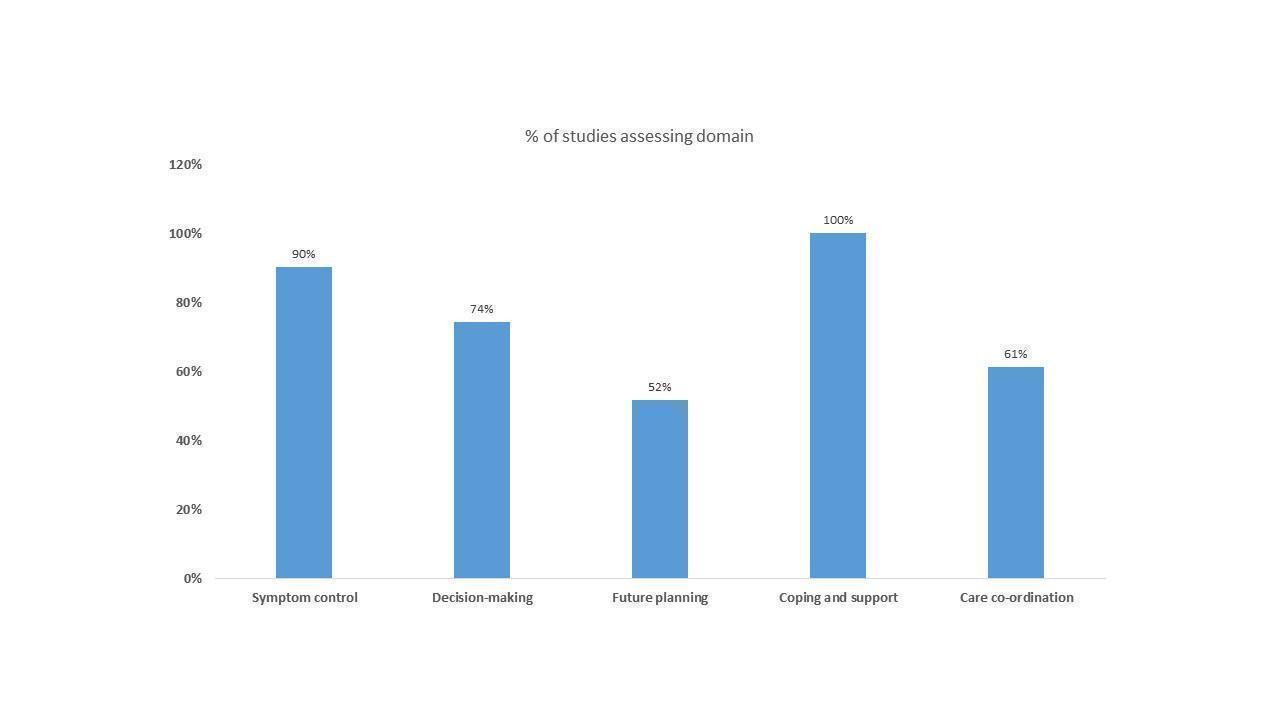
A figure showing the domains of HSPC in the studies that either included certified experts in palliative care or those described as palliative care clinicians
Symptom control
This involved assessment and management of symptoms. Twenty‐eight studies highlighted that the HSPC intervention included symptom or needs assessment and management. In two studies, this was unclear (McWhinney 1994; Solari 2018), while it appeared that Carson 2016 did not address this domain.
Decision‐making
This domain involved assessing patient and their family's understanding of illness, assessing individual and cultural values/beliefs or assessing goals of care and regularly reviewing them. Twenty‐three studies included HSPC that addressed one or more aspects of decision‐making. One study included HSPC that did not focus on decision‐making as the intervention was targeted at managing patients’ physical and psychological symptoms during hospitalisation (El‐Jawahri 2016). A further five studies of HSPC did not involve this domain (Higginson 2009; Kane 1984; Rodin 2019; Tattersall 2014; Wallen 2012). In two studies, this was unclear (McWhinney 1994; Solari 2018).
Future planning
Future planning involved discussing concerns and preferences for end‐of‐life care, making a will, power of attorney and decisions about resuscitation. Half of the studies (n = 16) included HSPC that involved planning for the future, while this was unclear in two studies (McWhinney 1994; Solari 2018). The remaining 13 studies did not include this domain in delivery of HSPC (Bekelman 2018; Brannstrom 2014; Carson 2016; El‐Jawahri 2016; Franciosi 2019; Ma 2019; McCorkle 2015; Rodin 2019; Tattersall 2014; Temel 2010; Temel 2017; Vanbutsele 2018; Wallen 2012).
Coping and support
This involved establishing a therapeutic relationship, facilitating coping with advanced illness and spiritual support, providing emotional and practical support, addressing family needs and bereavement care.
All 31 studies involved HSPC that had one or more elements of this domain. In particular, three studies included HSPC that specifically highlighted bereavement care or involved a bereavement co‐ordinator as needed (Bakitas 2009; Brumley 2007; Higginson 2009). Bakitas 2009 provided a bereavement follow‐up call to the unpaid caregiver as part of the HSPC intervention, while Higginson 2009 described HSPC that provided bereavement support when needed. Brumley 2007 described HSPC that included a bereavement co‐ordinator, as needed. Furthermore, Bekelman 2018 included a topic on grief and loss as part of the counselling session in their HSPC intervention.
In addition to the areas described above, we assessed the provision of spiritual care. Thirteen studies include HSPC provided spiritual care or support (Bajwah 2015; Brannstrom 2014; Brumley 2007; Carson 2016; Higginson 2014; Janssens 2019; Kane 1984; Lowther 2015; Nottelmann 2018; Rogers 2017; Sidebottom 2015; Vanbutsele 2018; Wallen 2012).
Care co‐ordination
Although Zimmermann 2019 did not include care co‐ordination as a domain in their conceptual framework, we decided to include this domain. Over half of the studies (n = 19) involved HSPC that provided care co‐ordination (Bajwah 2015; Bakitas 2009; Bakitas 2015; Bekelman 2018; Brannstrom 2014; Brumley 2007; Edmonds 2010; Franciosi 2019; Higginson 2009; Higginson 2014; Janssens 2019; Ma 2019; McCorkle 2015; Nottelmann 2018; Rogers 2017; Sidebottom 2015; Temel 2010; Temel 2017; Vanbutsele 2018), while this was unclear in two studies (McWhinney 1994; Solari 2018). In 10 studies, it appeared that the HSPC intervention did not include this domain.
The main domains of care in the HSPC intervention in the 31 studies were symptom control, coping and support, and decision‐making. At least half of the studies included HSPC that provided care co‐ordination and future planning. Besides McWhinney 1994 and Solari 2018, the remaining studies addressed at least two domains.
Components of HSPC in studies that were unclear about palliative care training
Eleven studies were unclear about the palliative care training of those who delivered the HSPC intervention (Ahronheim 2000; Cheung 2010; Groenvold 2017; Grudzen 2016; Hopp 2016; Jingfen 2017; McCaffrey 2013; Mendoza‐Galindo 2018 (abstract only); O'Riordan 2019; Ozcelik 2014; Woo 2019) (see Table 2 under Additional tables for the domains covered in the studies and Figure 4 for the percentage of studies assessing different domains). Four of these studies were only patient‐centred (Groenvold 2017; Hopp 2016; O'Riordan 2019; Woo 2019), while Ahronheim 2000 was only family‐centred. Three studies were both patient‐ and family‐centred (Grudzen 2016; Jingfen 2017; Ozcelik 2014). In three studies, this was unclear (Cheung 2010; McCaffrey 2013; Mendoza‐Galindo 2018 (abstract only)).
| Author | Symptom control (e.g. assess symptoms, prescribing of medications) | Decision‐making (e.g. enquire about goals of care) | Future planning (e.g. advance care planning) | Coping and support (e.g. emotional and practical support) | Care co‐ordination (e.g. helping with co‐ordinating care) |
|---|---|---|---|---|---|
| Yes | No | Yes | Yes | No | |
| Unclear | Unclear | Unclear | Unclear | Unclear | |
| Unclear | Unclear | Unclear | Unclear | Unclear | |
| Yes | Yes | Yes | Yes | No | |
| Yes | Yes | Yes | Yes | No | |
| Yes | Yes | No | Yes | No | |
| Unclear | Unclear | Unclear | Unclear | Yes | |
| Yes | No | No | Yes | No | |
| Yes | No | Yes | Yes | No | |
| Yes | No | Yes | Yes | No | |
| Yes | No | No | Yes | No |

A figure showing the domains of HSPC in studies that were unclear about palliative care training
Palliative care provision was flexible in all the 11 studies, with the involvement of the multidisciplinary team as required to address the needs of patients and/or their families. In 10 studies, the palliative care providers were attentive to the needs of patients and their families, while this was unclear in Mendoza‐Galindo 2018 (abstract only). Mendoza‐Galindo 2018 (abstract only) only reported that the intervention was provided by a palliative team, which included psychological, nutritional and symptom support.
We assessed the domains of HSPC included in these studies as follows:
Symptom control
Eight studies highlighted the issue that the HSPC intervention included symptom or needs assessment and management. In three studies, this was unclear (Cheung 2010; Groenvold 2017; McCaffrey 2013).
Decision‐making
Three studies involved one or more aspects of decision‐making (Grudzen 2016; Hopp 2016; Jingfen 2017), while this was unclear in three studies (Cheung 2010; Groenvold 2017; McCaffrey 2013). It appeared five studies did not involve this domain (Ahronheim 2000; Mendoza‐Galindo 2018 (abstract only); O'Riordan 2019; Ozcelik 2014; Woo 2019).
Future planning
Five studies involved planning for the future (Ahronheim 2000; Grudzen 2016; Hopp 2016; O'Riordan 2019; Ozcelik 2014), while this was unclear in three studies (Cheung 2010; Groenvold 2017; McCaffrey 2013). Three studies did not include this domain (Jingfen 2017; Mendoza‐Galindo 2018 (abstract only); Woo 2019).
Coping and support
Eight studies involved one or more elements of this domain, while three studies were unclear (Cheung 2010; Groenvold 2017; McCaffrey 2013). O'Riordan 2019 further involved the provision of spiritual care.
Care co‐ordination
Only McCaffrey 2013 involved care co‐ordination, while eight studies did not. It was unclear whether two studies included this domain (Cheung 2010; Groenvold 2017).
The main domains of care in the HSPC intervention in studies with unclear training were symptom control, coping and support, and future planning. Very few studies involved decision‐making and care co‐ordination. Besides three studies where the domains were unclear, the remaining eight studies addressed at least two domains.
When compared to studies that included experts or those described as palliative care clinicians, studies with unclear palliative care training often did not include decision‐making and care co‐ordination. There was also less focus on symptom control, and coping and support in studies with unclear palliative care training. Both groups were similar in the extent to which they focussed on future planning.
Controls
HSPC was compared with usual care. Overall, there was poor description of usual care in most studies with no information or very little information provided. For example, Ahronheim 2000 only stated that the control group was treated by the primary care team without palliative care input, and Cheung 2010 stated that control group received usual ICU care without palliative care consultation. Among studies providing some level of detail on usual care, it appeared usual care was varied, probably reflecting the local context as well as differences in health systems. For example, in the Kenyan study by Lowther 2015, those in the usual care group received care from nurses without experience in palliative care from the HIV clinic, consisting of monthly clinical assessments once antiretroviral therapy (ART) was established. In the Swiss study by Janssens 2019, patients receiving usual care had no contact with the palliative care team. Specialised nurses provided regular home visits to patients under long‐term oxygen therapy (LTOT) and/or home non‐invasive ventilation (NIV). In the Belgian study by Vanbutsele 2018, usual oncology care in all the participating departments was provided by a multidisciplinary team, including oncologists, other medical specialists, social workers, psychologists, dieticians and specialist nurses. All patients with advanced cancer usually have an introductory consultation with a specialist nurse trained in oncological care, a dietician, and a psychologist at the start of their treatment. Follow‐up consultations were at the patient's discretion. The palliative care team was only involved on demand and often late in the disease trajectory, and their services were not systematically offered to all patients from oncology departments. Usual care in the South Korean study by Woo 2019 comprised anticancer and symptom control treatments and consultation with psychiatric and pain specialists. In Bajwah 2015, a UK study, the control group remained under interstitial lung disease (ILD) specialist care which included input from ILD physicians, ILD clinical nurse specialist, occupational therapists, physiotherapists and oxygen assessment and treatment services. All patients were also able to access inpatient ILD treatment, as needed. The control group received the intervention after four weeks. In Higginson 2014, the control group received usual care services according to UK guidance. After six weeks, the control group was offered the intervention. Similarly, in Solari 2018, usual care involved health and social services provided by the Italian National Health Service and dyads were offered the intervention at the end of the study.
In 20 studies, usual care included involvement of palliative care professionals if needed (Bajwah 2015; Bakitas 2009; Bakitas 2015; Bekelman 2018; Carson 2016; El‐Jawahri 2016; Franciosi 2019; Groenvold 2017; Grudzen 2016; Ma 2019; McCaffrey 2013; McWhinney 1994; Rodin 2019; Rogers 2017; Tattersall 2014; Temel 2010; Temel 2017; Vanbutsele 2018; Wallen 2012; Woo 2019), and, in one study, usual care incorporated hospice care (Brumley 2007). Wallen 2012 reported that the usual care group was permitted to cross over to the intervention arm if standard pain and symptom management was inadequate to meet their needs.
Outcomes
Our primary outcomes of patient health‐related quality of life (HRQoL) and their symptom burden (assessed using generalised measures) were assessed by 10 and six studies reporting adjusted endpoint values, respectively. Of the 10 studies assessing patient HRQoL, nine were with cancer populations, and one with non‐cancer populations. Nine of the 10 studies involved early palliative care (Bakitas 2009; Bakitas 2015; El‐Jawahri 2016; McCorkle 2015; Rodin 2019; Tattersall 2014; Temel 2010; Temel 2017; Vanbutsele 2018). All six studies that reported symptom burden were with cancer populations and they involved early palliative care (Bakitas 2009; Bakitas 2015; El‐Jawahri 2016; Rodin 2019; Tattersall 2014; Temel 2010).
Other patient outcomes reported included individual symptoms (pain, anxiety, depression, post‐traumatic stress disorder, breathlessness, fatigue, nausea/vomiting, appetite loss, sleep disturbance), traumatic stress symptoms, mortality (death at home, hospital and ICU), survival, advanced care planning, functional independence, achieving preferred place of care or death, satisfaction with care, physical function, psychological, social and spiritual well‐being, nutrition, and cognitive status.
Unpaid caregiver outcomes assessed in studies included satisfaction with care, symptom control (e.g. anxiety, depression), HRQoL, burden, coping, distress with patients' symptoms, and grief.
Economic data
We included 31 studies in the economic component of this review as they compared the resource use and/or costs/cost‐effectiveness between HSPC and usual care alongside clinical effectiveness. We restricted the economic component of the review to economic analyses conducted alongside the studies meeting eligibility criteria for the effectiveness component of the review. Of the 31 studies, four studies were full economic evaluations that compared the costs and effects of the intervention and control group between baseline and follow‐up (Farquhar 2014; Farquhar 2016; Higginson 2009; McCaffrey 2013), five partial economic evaluations that compared only costs and outcomes without reporting incremental changes or decision criteria (Brumley 2007; Gade 2008; Higginson 2014; Kane 1984; Temel 2010), and 22 studies reported more limited resource use/cost information.
The studies measured resource use associated with care received in the intervention and the control group. Use of the following resources was assessed: institutional care services use (e.g. emergency department (ED) or accident and emergency (A&E), intensive care unit use, inpatient stay, care in nursing homes (or skilled nursing homes)); outpatient clinic use (e.g. palliative care visits in outpatient settings, consultation with experts in outpatient settings); community care services use (e.g. GP contacts, nurse visits, home care, hospice care at home); unpaid caregiver care; medications and other resource use. Thirteen studies calculated the costs associated with resource utilisation (Brannstrom 2014; Brumley 2007; Farquhar 2014; Farquhar 2016; Gade 2008; Higginson 2009; Higginson 2014; Kane 1984; Ma 2019; McCaffrey 2013; Mendoza‐Galindo 2018 (abstract only); Ozcelik 2014; Temel 2010). Four studies reported the results of cost‐effectiveness analysis using relevant outcome measures (palliative outcome, unpaid caregiver burden, quality‐adjusted life years (QALYs)) (Farquhar 2014; Farquhar 2016; Higginson 2009; McCaffrey 2013), and hospital costs or total costs. Results of cost‐effectiveness analyses were reported by incremental cost‐effectiveness ratios (ICERs) and/or costs per QALY (point estimates or cost‐effectiveness planes). The four studies reported ICERs, cost/QALY, or cost‐effectiveness planes from cost‐effectiveness analysis.
Excluded studies
We excluded 25 studies for the following reasons: studies were not RCTs (n = 8), usual care included palliative care as part of routine care (n = 5), studies did not conceal their allocation sequence (n = 3), intervention was not delivered by a multidisciplinary team (n = 7), intervention was not HSPC (n = 1), and study included hospices based outside hospital settings (n = 1) (see Characteristics of excluded studies).
Studies awaiting classification
We could not classify one study due to insufficient information to clarify the nature of the palliative care team and setting (see Characteristics of studies awaiting classification).
Ongoing studies
We identified 34 ongoing studies (see Characteristics of ongoing studies).
Risk of bias in included studies
We assessed risk of bias using the Cochrane 'Risk of bias' tool (see Figure 5 and Figure 6) (Higgins 2011b). Across trials, we assessed risk of bias for all outcomes in all the domains specified for RCTs in the Cochrane Handbook (Higgins 2011b). The domains we covered were selection bias (random sequence generation and allocation concealment), performance, detection, attrition and reporting biases. We also assessed 'size of study' as a potential risk of bias. Under the 'other bias' domain, we assessed whether groups were balanced at baseline and also if differences at baseline were adjusted for.

Risk of bias summary: review authors' judgements about each risk of bias item for each included study.

Risk of bias graph: review authors' judgements about each risk of bias item presented as percentages across all included studies.
Allocation
Random sequence generation
Twenty‐seven studies were randomised and provided adequate description of the sequence generation process. We therefore judged them to be at low risk of bias. However, we judged 15 studies to be at unclear risk of bias due to insufficient description of the sequence generation process (Ahronheim 2000; Grudzen 2016; Hopp 2016; Kane 1984; Lowther 2015; Ma 2019; McCaffrey 2013; Mendoza‐Galindo 2018 (abstract only); O'Riordan 2019; Ozcelik 2014; Rogers 2017; Sidebottom 2015; Temel 2010; Wallen 2012; Woo 2019).
Allocation concealment
Authors of 21 studies did not provide adequate information on how they concealed the allocation and so we judged them to be at unclear risk of bias (Ahronheim 2000; Bakitas 2009; Bakitas 2015; Brannstrom 2014; Brumley 2007; El‐Jawahri 2016; Gade 2008; Hopp 2016; Jingfen 2017; Kane 1984; Lowther 2015; McCaffrey 2013; McCorkle 2015; Mendoza‐Galindo 2018 (abstract only); O'Riordan 2019; Ozcelik 2014; Rogers 2017; Sidebottom 2015; Temel 2010; Wallen 2012; Woo 2019). We judged 21 studies as having a low risk of bias because the methods used to conceal the allocation sequence were described.
Blinding
As stated in the methods, we assessed blinding for subjective and objective outcomes separately.
Blinding of participants and personnel (subjective outcomes)
None of the studies that reported on subjective outcomes blinded participants. We judged two studies as having an unclear risk of bias because they did not state whether participants and personnel were blinded (Jingfen 2017; Mendoza‐Galindo 2018 (abstract only)), while we gave the remaining 36 studies a high risk of bias because they did not carry out blinding. Four studies did not include subjective outcomes and we therefore did not assess this domain in these studies (Ahronheim 2000; Hopp 2016; Ma 2019; McCaffrey 2013) and we left the domain blank. Generally, in palliative care research, blinding of participants and personnel is not possible or feasible due to the nature of palliative care interventions which involve service provision by a multidisciplinary team (Piggott 2004), and also because of ethical considerations as patients need to be informed about the intervention.
Blinding of participants and personnel (objective outcomes)
We judged 29 studies to be at low risk of bias because we considered that lack of blinding of participants and personnel was unlikely to affect the objective outcomes they assessed. We could not assess this domain in 12 studies because they did not include objective outcomes (Edmonds 2010; Farquhar 2014; Farquhar 2016; Higginson 2009; Jingfen 2017; Lowther 2015; McCorkle 2015; McWhinney 1994; O'Riordan 2019; Ozcelik 2014; Temel 2017; Wallen 2012) and so we therefore left this domain blank. We gave Mendoza‐Galindo 2018 (abstract only) an unclear risk of bias because the authors did not state whether blinding of participants and personnel occurred.
Blinding of outcome assessment (subjective outcomes)
We judged nine studies as having a low risk of bias because they blinded outcome assessors (Bakitas 2015; Bekelman 2018; Brumley 2007; Farquhar 2014; Farquhar 2016; Franciosi 2019; Groenvold 2017; McWhinney 1994; Solari 2018). We assessed 14 studies as having an unclear risk of bias rating (Carson 2016; Gade 2008; Grudzen 2016; Higginson 2014; Jingfen 2017; Kane 1984; McCorkle 2015; Mendoza‐Galindo 2018 (abstract only); Nottelmann 2018; O'Riordan 2019; Ozcelik 2014; Sidebottom 2015; Wallen 2012; Woo 2019) because it was unclear whether outcome assessors were blinded, while we gave 15 studies a high risk of bias rating because they did not blind outcome assessors. Some authors of studies with a high risk of bias stated explicitly that they did not blind outcome assessors (e.g. Vanbutsele 2018), while others stated that they were open‐label or non‐blinded studies (e.g. Bakitas 2009; Janssens 2019; Rodin 2019; Temel 2017).
We could not assess this domain in four studies because they did not include subjective outcomes (Ahronheim 2000; Hopp 2016; Ma 2019; McCaffrey 2013) so we therefore left this domain blank.
Blinding of outcome assessment (objective outcomes)
We assessed 29 studies as having a low risk of bias because they blinded outcome assessors, while we rated two studies as having an unclear risk of bias (Jingfen 2017; Mendoza‐Galindo 2018 (abstract only)) due to lack of clarity on whether outcome assessors were blinded. We could not rate the remaining 11 studies because they did not include objective outcomes (Edmonds 2010; Farquhar 2014; Farquhar 2016; Higginson 2009; Lowther 2015; McCorkle 2015; McWhinney 1994; O'Riordan 2019; Ozcelik 2014; Temel 2017; Wallen 2012) and so we left this domain blank.
Incomplete outcome data
Twenty‐nine of the 42 included studies reported almost identical attrition rates in the intervention and control groups (Bajwah 2015; Bakitas 2009; Bekelman 2018; Brumley 2007; Carson 2016; Edmonds 2010; El‐Jawahri 2016; Farquhar 2014; Farquhar 2016; Franciosi 2019; Gade 2008; Groenvold 2017; Grudzen 2016; Higginson 2009; Higginson 2014; Hopp 2016; Janssens 2019; Kane 1984; Lowther 2015; Ma 2019; McCaffrey 2013; McCorkle 2015; O'Riordan 2019; Rogers 2017; Sidebottom 2015; Solari 2018; Temel 2017; Wallen 2012; Woo 2019). The level of attrition ranged from 1% to 93%. Reasons given for attrition included clinical staff missed patient (n = 1, note all 'n's are studies), death (n = 27), deterioration/severe illness (n = 4), did not receive intervention (n = 1), did not complete (n = 3), feeling too well (n = 1), form mailed but not returned (n = 3), hospitalised or too ill/hospitalised/hospice (n = 2), lack of interest (n = 1), lost to follow‐up (n = 2), migrated (n = 1), not eligible after enrollment (n = 1), overwhelmed (n = 1), patients could not be reached (n = 2), passive withdrawal (n = 1), protocol violation (n = 1), refused to participate (n = 5), transfer of care (n = 3), treated at another facility (n = 1), unable to attend appointments and unavailable (n = 1), unknown reason (n = 2), withdrawal of consent (n = 16) and went on holiday (n = 1).
We judged 17 studies as having a high risk of bias. For example, we assessed Brannstrom 2014 as having a high risk of bias because attrition was not balanced across the intervention and control groups with 77.8% completers in the intervention and 88.9% completers in the control group. Missing data were also excluded from the analysis in this study. Similarly, in McCorkle 2015, missing data were not included in the analysis. McCorkle 2015 had 55% completers in the intervention and 70% completers in the control group. We gave Tattersall 2014 a high risk of bias rating due to high attrition as only 18.3% of intervention group and 30% of control completed the study and reasons for non‐completion were not stated. In McWhinney 1994, a high attrition rate was reported at one month (36%). However, the attrition rate in each of the treatment arms (intervention and control) was not stated. Janssens 2019 had a 16% death rate at 12 months but did not indicate the number of deaths in each of the treatment arms.
We judged 18 studies as having a low risk of bias (Bakitas 2015; Bekelman 2018; Brumley 2007; Edmonds 2010; El‐Jawahri 2016; Farquhar 2016; Franciosi 2019; Gade 2008; Groenvold 2017; Grudzen 2016; Janssens 2019; McCaffrey 2013; Ozcelik 2014; Rodin 2019; Solari 2018; Temel 2010; Vanbutsele 2018; Woo 2019). In Bekelman 2018, there were 79% completers in both intervention and control groups with 14 (8.9%) and 12 (7.6%) being unaccounted for in the intervention and control groups, respectively. Given that missing data were included in the analysis using maximum likelihood estimates, we gave a low risk of bias rating. Franciosi 2019 had 63.4% completers in the intervention group and 62.6% completers in the control group. We rated it as having a low risk of bias because an imputation method was used for missing data as described in the FACIT Administration and Scoring Guidelines. Rodin 2019 had 59% completers in the intervention group and 95% completers in the control group. In spite of this difference, we gave a low risk of bias rating because missing data were included in the analysis.
We judged the remaining seven studies as having an unclear risk of bias (Ahronheim 2000; Bakitas 2009; Higginson 2009; Jingfen 2017; Lowther 2015; Mendoza‐Galindo 2018 (abstract only); Nottelmann 2018). Examples of reasons for unclear risk of bias ratings were inclusion of missing data in primary outcome analysis but not secondary outcome analysis (Bakitas 2009) and study was an abstract and provided no information on attrition (Mendoza‐Galindo 2018 (abstract only).
Selective reporting
We judged only five studies as having a low risk of bias (Bakitas 2015; Cheung 2010; Franciosi 2019; Higginson 2009; Tattersall 2014) because all prespecified outcomes were reported, while we gave 13 studies an unclear risk of bias either because their study protocols were not available or study protocols were available but only an abstract had been published. We gave 24 studies a high risk of bias for a number of reasons (for example. Bajwah 2015; Bekelman 2018; Carson 2016; Edmonds 2010; Janssens 2019; Rodin 2019; Solari 2018; Temel 2010; Vanbutsele 2018; Wallen 2012): some prespecified outcomes were not reported (for example, Edmonds 2010; Wallen 2012; Rodin 2019; Solari 2018); some outcomes in published papers were not stated a priori in the protocol/trial registry (for example, Brannstrom 2014; Janssens 2019); or because outcomes specified as primary outcomes in the protocol/trial registry were reported as secondary outcomes in published papers (for example, Bakitas 2009). We gave Temel 2017 a high risk of bias because it used a terminal decline joint modelling approach in modelling the trend in outcomes backward from death. This approach was not prespecified in the protocol.
Other potential sources of bias
Overall, we judged 27 studies as having a low risk of bias in this domain because the studies either appeared free of other biases or controlled for confounders in their analyses. For example, in Bakitas 2015, although the intervention group had significantly less education, higher weekly alcoholic beverage use, and higher clinical trial enrollment, the intention to treat analyses were adjusted for baseline values. Similarly, in Brannstrom 2014, the intervention and control groups were balanced with respect to baseline characteristics except for mean age. However, we gave a low risk of bias rating because the authors controlled for age in their analysis. We gave two studies a high risk of bias rating because the authors stated that there were baseline differences which were not adjusted for (Gade 2008; O'Riordan 2019). In 13 studies, we rated an unclear risk of bias because there were baseline differences and it was unclear if any adjustment was carried out for the differences (e.g. Bajwah 2015; Bekelman 2018; Brumley 2007; Cheung 2010; Franciosi 2019; McCorkle 2015). We gave McWhinney 1994 an unclear risk of bias because the sample characteristics at baseline were not reported.
Size of study
We assessed the size of studies in order to check for possible biases confounded by small size. We assessed 11 studies as having a high risk of bias because they included fewer than 50 participants in each treatment group (Brannstrom 2014; Cheung 2010; Edmonds 2010; Higginson 2009; Hopp 2016; Janssens 2019; McCaffrey 2013; Mendoza‐Galindo 2018 (abstract only); O'Riordan 2019; Ozcelik 2014; Rodin 2019). Three studies included greater than 200 participants in each treatment group and we rated them as having a low risk of bias (Bakitas 2009; Carson 2016; Gade 2008). We gave the remaining 28 studies an unclear risk of bias rating because they had between 50 and 199 participants in one of the treatment groups or both groups. For example, Bekelman 2018 had 157 participants in the intervention group and 157 participants in the control group.
Quality assessment for cost‐effectiveness studies
For full economic evaluations (Farquhar 2014; Farquhar 2016; Higginson 2009; McCaffrey 2013), we assessed risk of bias in results of the single effectiveness study on which the full economic evaluation study was based (see Figure 5 and Figure 6 for 'Risk of bias' assessment). We judged Farquhar 2014, Farquhar 2016 and Higginson 2009 to be at low risk of selection bias due to adequate description of the sequence generation process and allocation concealment. We gave McCaffrey 2013 an unclear risk of bias rating because there was insufficient information about the random sequence generation process and allocation concealment. Three of the studies reported on subjective outcomes but did not blind participants (Farquhar 2014; Farquhar 2016; Higginson 2009). Consequently, we gave the three studies a high risk of bias rating under 'blinding of participants and personnel (subjective outcomes)'. McCaffrey 2013 did not include subjective outcomes; we therefore left this domain blank. Besides McCaffrey 2013, the remaining three studies did not include objective outcomes and we left the domain 'blinding of participants and personnel (objective outcomes)' blank. We gave McCaffrey 2013 a low of risk under 'blinding of participants and personnel (objective outcomes)' because lack of blinding was unlikely to lead to bias in objective outcomes such as place of death.
We judged Farquhar 2014 and Farquhar 2016 to be at a low risk of bias for blinding of outcome assessment (subjective outcomes) because they blinded outcome assessors, while we gave Higginson 2009 a high risk of bias due to lack of blinding. McCaffrey 2013 did not include subjective outcomes and we therefore left this domain blank. McCaffrey 2013 included objective outcomes and we rated a low risk of bias for blinding of outcome assessment (objective outcomes) because lack of blinding was unlikely to affect objective outcomes. We left this domain blank in Farquhar 2014, Farquhar 2016 and Higginson 2009 because they did not include objective outcomes.
We judged Farquhar 2016 and McCaffrey 2013 as having a low risk of bias for incomplete outcome data (attrition bias), while we assessed Higginson 2009 as having an unclear risk of bias because the number of patients analysed differed from the number of patients randomly assigned to the intervention and control groups. We assessed Farquhar 2014 as having a high risk of bias in this domain due to exclusion of missing data from the analysis. With the exception of Higginson 2009, we rated a high risk of bias for selective reporting (reporting bias) in the remaining three studies because all outcomes in the protocol/trial registry were not reported in the publication.
We gave a low risk of bias rating for 'other bias' in all studies except McCaffrey 2013. In McCaffrey 2013, it was unclear whether the differences between the intervention and control groups were controlled for. We assessed Farquhar 2014 and Farquhar 2016 as having an unclear risk of bias for 'size of study', and Higginson 2009 and McCaffrey 2013 as having a high risk of bias due to sample sizes below 50 in the intervention and control groups.
BMJ Checklist for authors and peer reviews of economic submissions
The methodological quality of the 13 studies that examined total costs varied across the different areas assessed (see Appendix 8). We assessed methodological quality using the BMJ Checklist for authors and peer reviewers of economic submissions (Drummond 1996). Given that they used different methods and reported on different resources used by patients, we could not pool their data in a meta‐analysis. All the studies were clear about their research question. We considered all the studies to have provided the rationale for choosing the alternatives they compared because they all compared HSPC (or HSPC in addition to usual care) with usual care. However, only eight of them stated the economic importance of the research question. Six studies stated the form of economic evaluation used. The viewpoint of the analysis was stated only in three studies (Higginson 2009; McCaffrey 2013; Sahlen 2016 (linked to Brannstrom 2014)). All studies were clear about the source of effectiveness estimates used. Besides Mendoza‐Galindo 2018 (abstract only), they all provided details on the design and results of their effectiveness study. The primary outcome for the economic evaluation was clearly stated in seven studies (Farquhar 2014; Farquhar 2016; Gade 2008; Higginson 2009; Higginson 2014; McCaffrey 2013; Sahlen 2016 (linked to Brannstrom 2014)). Quantities of resources were not reported separately from their unit costs in four studies (Ma 2019; Mendoza‐Galindo 2018 (abstract only); Ozcelik 2014; Sahlen 2016 (linked to Brannstrom 2014)). In Brumley 2007, this was unclear because the authors described how the costs were derived but did not present the unit costs. Details of currency of price adjustments for inflation or currency conversion were not provided in any of the studies. The relevance of productivity changes to the study question was also not discussed in any of the studies. All studies except Mendoza‐Galindo 2018 (abstract only) stated the time horizon of costs and benefits. They all addressed the research question with conclusions following from their findings. Gade 2008, Higginson 2009, Higginson 2014, McCaffrey 2013 and Sahlen 2016 (linked to Brannstrom 2014) provided details of statistical tests and confidence intervals.
Consensus on Health Economic Criteria (CHEC) list
We also used the CHEC list to assess the methodological quality of economic evaluations (see Appendix 9). Overall, 13 studies met seven to 16 (out of 19) quality items on the list. Five items were considered to have been met by all studies: clear description of study population; a well‐defined research question in answerable form; identification of important and relevant outcomes for each alternative; appropriate measurement of outcomes; and conclusion following the reported data. All studies but Mendoza‐Galindo 2018 (abstract only) discussed the generalisation of results to other settings or patient group and chose the appropriate time horizon to include relevant costs and outcomes. Eleven of 13 studies used the appropriate economic study design to answer the stated objective with the exception of Brumley 2007 and Brannstrom 2014. All studies except McCaffrey 2013 and Mendoza‐Galindo 2018 (abstract only) discussed the ethical and distributional issues appropriately. Only two studies clearly described the competing alternatives (Higginson 2014; Ozcelik 2014), and three studies were considered to have appropriately chosen a perspective for the study (Higginson 2014; McCaffrey 2013; Temel 2010). Valuing outcomes appropriately was achieved only in five studies (Farquhar 2014; Farquhar 2016; Kane 1984; McCaffrey 2013; Temel 2010). No study needed nor clearly stated the discounting methods.
Effects of interventions
Primary outcomes
Patient Health‐related Quality of Life (HRQoL)
Ten studies contributed adjusted endpoint data to the main meta‐analysis on patient HRQoL (Bakitas 2009; Bakitas 2015; El‐Jawahri 2016; McCorkle 2015; O'Riordan 2019; Rodin 2019; Tattersall 2014; Temel 2010; Temel 2017; Vanbutsele 2018). We also pooled nine studies reporting unadjusted endpoint data (Bajwah 2015; Brannstrom 2014; El‐Jawahri 2016; Franciosi 2019; Gade 2008; Higginson 2014; Jingfen 2017; McCorkle 2015; Rogers 2017), and nine studies presenting unadjusted change data in our sensitivity analyses (Bajwah 2015; Bekelman 2018; El‐Jawahri 2016; Grudzen 2016; Ozcelik 2014; Rogers 2017; Sidebottom 2015; Temel 2010; Temel 2017). We further carried out sensitivity analyses to explore the effect of using 0.02 in adjusting for clustering in McCorkle 2015 among studies that reported adjusted endpoint data and unadjusted endpoint data. Only Solari 2018 reported adjusted change data.
Of the remaining 19 studies that were not in any of the meta‐analyses, 10 did not report on patient HRQoL (Ahronheim 2000; Brumley 2007; Carson 2016; Cheung 2010; Higginson 2009; Kane 1984; Ma 2019; McCaffrey 2013; Mendoza‐Galindo 2018 (abstract only); Wallen 2012), six presented data on different domains of HRQoL (Edmonds 2010; Farquhar 2014; Farquhar 2016; Groenvold 2017; Janssens 2019; Lowther 2015), one assessed HRQoL only at baseline but not at follow‐up (Hopp 2016), while one study only reported that there was "no significant difference" without presenting data (McWhinney 1994). Nottelmann 2018 assessed HRQoL but did not present analysable data.
Pooled data from 10 studies reporting adjusted endpoint data (main meta‐analysis) with 1344 participants showed that HSPC was beneficial at improving patient HRQoL when compared to usual care (SMD 0.26, 95% CI 0.15 to 0.37; I2 = 3%; Analysis 1.1). Positive SMDs indicate better patient HRQoL while negative SMDs indicate lower patient HRQoL. The effect size obtained (0.26) is small based on conventional standards (Cohen 1988).
We carried out sensitivity analysis with studies that reported adjusted endpoint data to assess the impact of using an estimate of 0.02 in adjusting for clustering in McCorkle 2015. We found similar results to the main analysis, in favour of HSPC (SMD 0.29, 95% CI 0.18 to 0.40; I2 = 0%; n = 9 studies; N = 1280 participants; Analysis 1.2). Sensitivity analysis using unadjusted endpoint values led to a larger difference between groups but the confidence intervals were wider and there was greater heterogeneity (SMD 0.41, 95% CI 0.11 to 0.70; I2 = 83%; n = 9 studies; N = 1201 participants; Analysis 1.3). When McCorkle 2015 was removed, HSPC was still better than usual care in improving HRQoL (SMD 0.46, 95% CI 0.13 to 0.78; I2 = 85%; n = 8 studies; N = 1137 participants; Analysis 1.4). When we pooled unadjusted change values, we also found benefit with HSPC (SMD 0.67, 95% CI 0.16 to 1.18; I2 = 95%; n = 9 studies; N = 1278 participants; Analysis 1.5). The results from these sensitivity analyses supported that from the main analyses.
Solari 2018 was the only study that presented adjusted change data and it assessed patient HRQoL using the Schedule for the Evaluation of Individual Quality of Life ‐ Direct Weighting (SEIQoL‐DW) (range, 0 to 100, 100 = best HRQoL). It found no between‐group difference between HSPC and usual care both at three months and six months. At three months, mean change in the HSPC group was ‐0.9 (95% CI ‐6.8 to 5.1) and ‐3.7 (95% CI ‐17.6 to 10.3) in the usual care group with a difference of 2.8 (95% CI ‐12.2 to 17.8) between the groups. At six months, mean change in the HSPC group was 0.8 (95% CI ‐5.3 to 6.9) and that in the usual care group was ‐4.0 (95% CI ‐21.1 to 13.1) with a difference of 4.8 (95% CI ‐13.2 to 22.7) between the groups.
Across the studies in the meta‐analyses, we combined different scales assessing patient HRQoL by calculating SMDs. Table 3 under Additional tables describes the HRQoL scales and the dimensions they covered. The studies used different scales for measuring patient HRQoL (Kings Brief Interstitial Lung Disease in Bajwah 2015; Functional Assessment of Chronic Illness therapy for Palliative Care, FACIT‐Pal, in Bakitas 2009, Bakitas 2015 and Rogers 2017; Kansas City Cardiomyopathy Questionnaire (KCCQ) in Bekelman 2018; EQ‐5D in Brannstrom 2014; Functional Assessment of Cancer Therapy‐Bone Marrow Transplant, FACT‐BMT, in El‐Jawahri 2016; Functional Assessment of Chronic Illness Therapy ‐ Spiritual Well‐being Scale, FACIT‐Sp, in Rodin 2019; Modified City of Hope Patient Questionnaires in Gade 2008; Functional Assessment of Cancer Therapy‐General Measure, FACT‐G, in Franciosi 2019; Grudzen 2016 and McCorkle 2015; Chronic Respiratory Disease Questionnaire‐Health Related Quality of lIfe (CRQ HRQL) in Higginson 2014; European Organisation for the Research and Treatment of Cancer Quality of Life Questionnaire Core 30, EORTC QLQ‐C30 (Chinese version), in Jingfen 2017; EORTC QLQ‐C30 in Ozcelik 2014 and Vanbutsele 2018; Minnesota Living with Heart Failure Questionnaire (MLHF) in O'Riordan 2019 and Sidebottom 2015; Schedule for the Evaluation of Individual Quality of Life ‐ Direct Weighting (SEIQoL‐DW) in Solari 2018; McGill Quality of Life Questionnaire in Tattersall 2014; Functional Assessment of Cancer Therapy – Lung scale, FACT‐L, in Temel 2010; Functional Assessment of Cancer Therapy ‐ General scale, FACT‐G, in Temel 2017).
| Studies, primary endpoint (PEP), disease group | Scales used | Dimensions covered in scales |
|---|---|---|
| PEP: 4 weeks Advanced fibrotic lung disease | KBILD (used in meta‐analysis) SGRQ | KBILD is a 15‐item questionnaire consisting of three domains (breathlessness and activities, chest symptoms and psychological) ‐ secondary outcome SGRQ is a 50‐item instrument designed to measure impact on overall health, daily life, and perceived well‐being in patients with obstructive airways disease. Part 1 has a symptoms component (frequency and severity) with a 1, 3 or 12 month recall (several scales); Part 2 has an activities component looking at activities that cause or are limited by breathlessness and an impact component looking at social functioning, psychological disturbances resulting from airways disease and referring to current state as the recall (dichotomous (true/false) except last question (4‐point Likert scale) – secondary outcome |
| PEP: 13 months Cancer | FACIT‐Pal | Measures physical, emotional, social, and functional well‐being in addition to concerns relevant to persons with life‐threatening illness (e.g. feeling peaceful, reconciling with others) – primary outcome |
| PEP: 3 months Cancer | FACIT‐Pal (used in meta‐analysis) Treatment Outcome Index | Measures physical, emotional, social, and functional well‐being and additional concern subscales – study did not specify whether primary or secondary outcome TOI, composed of FACIT‐Pal physical, functional, and additional concern subscales |
| PEP: 6 months Heart failure | KCCQ | KCCQ is a valid, reliable measure of heart failure–specific health status that is responsive to change. No further details provided in the study |
| PEP: 6 months Heart failure | EQ‐5D (used in meta‐analysis) KCCQ | A generic, single index that defines health in the five dimensions of mobility, self‐care, usual activities, pain/discomfort, and anxiety/depression ‐ did not specify primary or secondary outcomes Full data not shown in study |
| PEP: 12 weeks Multiple sclerosis | MSIS | Multiple Sclerosis Impact Scale (MSIS) is a 29‐item measure of disease impact. It has two subscales: physical and psychological subscales. |
| PEP: 2 weeks Cancer | FACT‐BMT | The 47‐item Functional Assessment of Cancer Therapy–Bone Marrow Transplant which includes subscales assessing physical, functional, emotional, social well‐being, and bone marrow transplant–specific concerns during the past week, was used to assess patients’ QoL – primary outcome |
| PEP: 12 weeks Cancer | FACT‐G | Functional Assessment of Cancer Therapy‐General (FACT‐G) scale. It is a 27‐item internationally validated questionnaire divided into four primary HRQoL domains: physical well‐being, social/family well‐being, emotional well‐being, and functional well‐being. The total FACT‐G score is the sum of the 4 subscale scores. |
| PEP: at hospital discharge Mixed diseases comprising cancer and non‐cancer | MCOHPQ | MCOHPQ Physical Area scale, emotional/relationship area and spiritual area scales and MCOHPQ place of care environment scale. Physical Area scale addresses pain, fatigue, sleep changes, nausea, constipation, diarrhoea, dry mouth, change in appetite, and shortness of breath. Emotional support items included: anxiety, burden to family, support they received, isolation, opportunity to discuss illness and possible death, and treatment wishes/goals. Spiritual support included: the importance of participation in spiritual or religious experiences from the Spiritual Area scale, and two items developed by the investigators: ability to find meaning in one’s life, and support given by religion or spiritual belief. MCOHPQ Place of Care Environment scale addressed experiences receiving pain management and symptom relief, psychological and social support, discharge planning, and end‐of‐life planning – primary outcome. |
| PEP: 12 weeks Cancer | FACT‐G | Functional Assessment of Cancer Therapy‐General Measure (not specified in study) – primary outcome |
| PEP: 6 weeks Mixed diseases comprising cancer and non‐cancer | CRQ HROL (presented in meta‐analysis) EQ‐5D | Measures breathlessness mastery, breathlessness, fatigue, and emotional function – secondary outcome A generic, single index that defines health in the five dimensions of mobility, self‐care, usual activities, pain/discomfort, and anxiety/depression |
| PEP: 12 months COPD | SF‐36 | A generalised self‐assessment scale assessing different dimensions including vitality, mental health, general health, physical functioning, role physical, role emotional, bodily pain, social functioning and health transition |
| PEP: 3 months Cancer | EORTC QLQ‐C30‐Chinese version | Not specified as primary or secondary outcome |
| PEP: not stated but 3 months used in meta‐analysis Cancer | FACT‐G (presented in meta‐analysis) SF‐12 (not used in meta‐analysis because only its first item was used) | No information provided in study on dimensions covered by FACT‐G ‐ secondary outcome |
| PEP: 12 weeks Cancer | EORTC QLQ‐C30 | The EORTC QLQ‐C30 consists of 30 items in 15 scales. In the present study additional items measuring role functioning, cognitive functioning, social functioning, dyspnoea, pain, fatigue, insomnia, appetite loss, nausea/vomiting and constipation were added to the questionnaire to expand these scales to at least four items in each scale. |
| PEP: not stated but appeared to be 6 months. 6 months was used in meta‐analysis Heart failure | MLHF questionnaire | MLHF questionnaire measures heart failure–specific health–related quality of life. No further information provided |
| PEP: on discharge Cancer | EORTC QLQ‐C30 | The scale consists of the 2 subscales 'functional' and ‘symptom'. The functional section is divided into 6 subsections: physical, role, cognitive, emotional, social, and global quality of life. The symptom section includes the following symptoms: fatigue, nausea and vomiting, pain, dyspnoea, sleep disorders, loss of appetite, constipation, diarrhoea, and financial impact – primary outcome |
| PEP: 12 weeks Cancer | FACIT‐Sp | The scale covers physical, social/family, emotional, functional, and spiritual well‐being. |
| PEP: 6 months Heart failure | FACIT‐Pal (presented in meta‐analysis) KCCQ | Assesses quality of life in several domains, including physical well‐being, social/family well‐being, emotional well‐being, functional well‐being, and palliative care – primary outcome The overall summary score is derived from the physical function, symptom, social function, and quality‐of‐life domains. |
| PEP: not stated but data presented at 3 months used in meta‐analysis Heart failure | MLHF questionnaire | The MLHF Questionnaire was created to be representative of the ways HF and treatments can affect key physical, emotional, social, and mental dimensions of QoL. It assess how much a person’s HF has affected many aspects of their life during the prior month – primary outcome |
| PEP: 6 months | SEIQoL‐DW questionnaire | Schedule for the Evaluation of Individual Quality of Life‐Direct Weighting (SEIQoL‐DW). The SEIQoL‐DW is administered in an interview in which respondents nominate the five areas of life that are most important in determining their QoL, and rate the satisfaction/functioning and weight/importance in each of these areas. The SEIQoL‐DW index can range from 0 to 100 (best). |
| PEP: one year Cancer | McGill QoL Questionnaire | Physical symptoms, psychological symptoms, outlook on life, and meaningful existence – primary outcome |
| PEP: 12 weeks Cancer | FACT‐L (presented in meta‐analysis) LCS TOI | Assesses multiple dimensions of the quality of life (physical, functional, emotional, and social well‐being) during the previous week. In addition, the lung cancer subscale (LCS) of the FACT‐L scale evaluates seven symptoms specific to lung cancer – primary outcome |
| PEP: 12 weeks Cancer | FACT‐G | Assesses four dimensions of QoL (physical, functional, emotional, and social well‐being) – primary outcome |
| PEP: 12 weeks Cancer | EORTC QLQ‐C30 (presented in meta‐analysis) McGill QoL questionnaire | Global health status/quality of life scale of the European Organisation for Research and Treatment of Cancer Quality‐of‐Life Questionnaire Core 30 items (EORTC QLQ‐C30; version 3) Single item scale and overall summary score of the McGill Quality of Life questionnaire (MQoL). The MQoL incorporates a single item scale of global quality of life and four subscales, measuring four relevant domains of quality of life (i.e. physical, psychological, existential/spiritual, and social). |
| PEP: 4 weeks Cancer | EORTC QLQ‐C30 (Korean version) | EORTC QLQ‐C30 (Korean version) assesses multiple dimensions of QoL (physical, functional, emotional and social well‐being) during the previous week. |
COPD:
CRQ HROL:
EORTC QLQ‐C30:
EQ‐5D:
FACIT‐Pal: Functional Assessment of Chronic Illness Therapy for Palliative Care
FACIT‐Sp: Functional Assessment of Chronic Illness Therapy—Spiritual Well‐Being (FACIT‐Sp)
FACT‐BMT: Functional Assessment of cancer Therapy – Bone Marrow Transplant
FACT‐G: Functional Assessment of Cancer Therapy‐General Measure/Functional Assessment of Chronic Illness Therapy–General Measure
FACT‐L:
HF:
HRQoL:
KBILD: Kings Brief Interstitial Lung Disease
KCCQ: Kansas City Cardiomyopathy Questionnaire
LCS:
MCOHPQ: Modified City of Hope Patient Questionnaires
MLHF: Minnesota Living with Heart Failure Questionnaire
MQoL:
MSIS:
PEP:
QoL:
QUAL‐E: Quality of Life at the End of Life (QUAL‐E)
SEIQoL‐DW:
SF‐12:
SF‐36:
SGRQ: St Georges Respiratory Questionnaire
TOI:
Four studies used more than one scale to measure patient HRQoL (Bajwah 2015; Brannstrom 2014; Higginson 2014; Rogers 2017). In particular, Brannstrom 2014 only showed data obtained using the EQ‐5D and not that from the KCCQ. Consequently, data from the EQ‐5D was used in the meta‐analysis. Higginson 2014 assessed HRQoL using the CRQ HRQL and the EQ‐5D. We only used data from the CRQ HRQL in the meta‐analysis because unlike the EQ‐5D (Williams 1995), a generic health‐related quality of life measure, it is more specific to chronic respiratory disease (Guyatt 1987). Rogers 2017 assessed HRQoL using the FACIT‐Pal and the KCCQ and both were presented as primary outcomes. Given that the FACIT‐Pal has more extensive validation in palliative populations, we used it in the meta‐analysis.
Overall, the funnel plot suggested some asymmetry (Figure 7). Egger's test for asymmetry resulted in a P value of 0.02. However, given evidence of publication of negative studies in the funnel plot, this asymmetry is not necessarily indicative of publication bias. We did not carry out subgroup analysis due to low heterogeneity (I2 = 3%) in our main meta‐analysis.

Funnel plot of comparison: 1 Patient health‐related quality of life, outcome: 1.1 HSPC versus usual care on patient HRQoL: adjusted endpoint values.
Quality of the evidence
Within the Grade approach, we downgraded the quality of the evidence on patient HRQoL to low due to a high risk of bias across studies (‐2 levels as a result of very serious study limitations: high risk of bias for selection, performance, detection, attrition and reporting bias) (see summary of findings Table 1).
Patient symptom burden (as a collection of two or more symptoms)
We pooled six studies that reported adjusted endpoint data as the main meta‐analysis on patient symptom burden (Bakitas 2009; Bakitas 2015; El‐Jawahri 2016; Rodin 2019; Tattersall 2014; Temel 2010). We pooled six studies that reported unadjusted endpoint values (Bajwah 2015; El‐Jawahri 2016; Gade 2008; Higginson 2014; Lowther 2015; McCorkle 2015), four studies presenting adjusted change values (Edmonds 2010; McCorkle 2015; Sidebottom 2015; Solari 2018), and six studies that reported unadjusted change values in our sensitivity analyses (Bajwah 2015; Bekelman 2018; El‐Jawahri 2016; Higginson 2009; Ozcelik 2014; Temel 2010). We further carried out sensitivity analyses to explore the effect of using 0.02 in adjusting for clustering in McCorkle 2015 among studies that reported unadjusted endpoint data and adjusted change data.
Pooled data from six studies with 761 participants reporting adjusted endpoint values showed that HSPC was beneficial at reducing patient symptom burden compared to usual care (SMD ‐0.26, 95% CI ‐0.41 to ‐0.12; I2 = 0%; Analysis 2.1). Negative SMDs indicate benefit (lower symptom burden) and positive SMDs reflect higher symptom burden.
Sensitivity analysis in the six studies (N = 833 participants) that reported unadjusted endpoint values showed a pooled effect of SMD ‐0.17 (95% CI ‐0.54 to 0.20; I2 = 83%; Analysis 2.2). Among studies that reported unadjusted endpoint values, we carried out another sensitivity analysis to assess the impact of using 0.02 in adjusting for clustering in McCorkle 2015 and had similar findings (SMD ‐0.19, 95% CI ‐0.62 to 0.24; I2 = 87%; n = 5 studies; N = 769 participants; Analysis 2.3). When we considered adjusted change values, the pooled effect was a SMD of ‐1.31 (95% CI ‐3.27 to 0.64; I2 = 98%; n = 4 studies; N = 353 participants; Analysis 2.4). When we excluded McCorkle 2015 from the studies that reported adjusted change values, we found a pooled effect of SMD ‐1.79 (95% CI ‐4.29 to 0.70; I2 = 98%; n = 3 studies; N = 289 participants; Analysis 2.5). When we considered unadjusted change values, the pooled effect from the studies was a SMD of ‐0.44 (95% CI ‐0.94 to 0.06; I2 = 88%; n = 6 studies; N = 641 participants; Analysis 2.6).
Of the remaining 25 studies that were not in any of the meta‐analyses, 20 did not report on patient symptom burden (Ahronheim 2000; Brumley 2007; Carson 2016; Cheung 2010; Franciosi 2019; Farquhar 2014; Farquhar 2016; Groenvold 2017; Grudzen 2016; Hopp 2016; Jingfen 2017; Ma 2019; McCaffrey 2013; McWhinney 1994; Mendoza‐Galindo 2018 (abstract only); Nottelmann 2018; Rogers 2017; Temel 2017; Vanbutsele 2018; Woo 2019), two studies reported that there were "no significant differences" between intervention and control groups but they did not present data (Brannstrom 2014; Kane 1984), while O'Riordan 2019 did not present data from the Edmonton Symptom Assessment Scale (ESAS). Wallen 2012 did not present analysable data, while Janssens 2019 only assessed patient symptom burden using the Edmonton Symptom Assessment Scale (ESAS) in the intervention group.
Across the studies that we pooled in the meta‐analyses, we combined different generalised measures of patient symptom burden by applying SMDs. Included studies used the following measures in assessing patient symptom burden: Palliative care Outcome Scale (POS) or a modified form of it in Bajwah 2015, Edmonds 2010, Higginson 2009, Higginson 2014 and Solari 2018; African POS in Lowther 2015; Edmonton Symptom Assessment Scale (ESAS) or a modified form of it in Bakitas 2009, El‐Jawahri 2016, Ozcelik 2014 and Sidebottom 2015; symptom impact subscale of the Quality of Life at End of life (QUAL‐E) in Bakitas 2015; General Symptom Distress Scale in Bekelman 2018; physical area scale of the Modified City of Hope Patient Questionnaires (MCOHPQ) in Gade 2008; Symptom Distress Scale (SDS) in McCorkle 2015 and Wallen 2012; Rotterdam Symptom Checklist (RSC ‐ Physical Symptoms Score) in Tattersall 2014; lung cancer subscale (LCS) of the FACT‐L in Temel 2010 and Memorial Symptom Assessment Scale (MSAS) in Rodin 2019. Only the severity subscale of the MSAS reported by Rodin 2019 was used in the meta‐analysis.
Given that there were fewer than 10 included studies in the main meta‐analysis of studies that presented adjusted endpoint values, we did not use funnel plots or carry out tests for funnel plot asymmetry. We also did not carry out subgroup analysis due to lack of heterogeneity I2 = 0%) in our main meta‐analysis.
Quality of the evidence
Within the GRADE approach, we downgraded the quality of the evidence for patient symptom burden to very low due to a high risk of bias across studies (‐2 levels as a result of very serious study limitations: high risk of bias for selection, performance, detection, attrition and reporting bias and inconsistency: ‐1 level due to differences between our main meta‐analysis and sensitivity analyses) (see summary of findings Table 1).
Secondary outcomes
Patient satisfaction with care
Eight studies assessed the effect of HSPC on patient satisfaction with care (Brumley 2007; Gade 2008; Jingfen 2017; Kane 1984; O'Riordan 2019; Ozcelik 2014; Rodin 2019; Wallen 2012). We excluded three of the studies from the synthesis because they used measures that had not been validated (Jingfen 2017; O'Riordan 2019; Ozcelik 2014), while one study did not present analysable data (Wallen 2012). We excluded Janssens 2019 because the authors did not state the outcome measure used in assessing satisfaction with the intervention. The remaining four studies with 733 participants used validated measures (Brumley 2007; Gade 2008; Kane 1984; Rodin 2019). However, we could not include Brumley 2007 and Kane 1984 in our meta‐analysis because Brumley 2007 presented odds ratio while Kane 1984 only presented P values.
Gade 2008 and Rodin 2019 reported adjusted endpoint values and found evidence in favour of HSPC (SMD 0.36, 95% CI 0.14 to 0.57; I2 = 0%; N = 337 participants; Analysis 3.1). Positive SMDs indicate better patient satisfaction while negative SMDs indicate lower patient satisfaction. Gade 2008 used the Modified City of Hope Patient Questionnaires (MCOHPQ) Place of Care Environment Scale and the Doctors, Nurses/Other Care Providers Communication scale for assessing patient satisfaction with care. The MCOHPQ Place of Care Environment scale addressed experiences receiving pain management and symptom relief, psychological and social support, discharge planning, and end‐of‐life planning, while the Doctors, Nurses/Other Health Care Providers Communication scale addressed the level of caring and respect a patient felt from their providers, as well as the opportunity, ease, and the level of understanding the patient had with their providers. Only data from the MCOHPQ Place of Care Environment scale was used in the meta‐analysis. Rodin 2019 assessed patient satisfaction with care using the 16‐item Family Satisfaction with Care ‐ Patient Version (FAMCARE‐P16).
Brumley 2007 found a 3.37 higher odds of satisfaction in the HSPC group compared to control group (P = 0.03). Brumley 2007 used the Reid‐Gundlach Satisfaction with Services instrument for assessing patient satisfaction. Kane 1984 found differences in satisfaction scores (P < 0.01) with HSPC patients expressing more satisfaction than control patients in two of the three areas examined. The two areas were interpersonal care and involvement in care. Kane 1984 used the Interpersonal Care scale adapted from the Ware scale (Ware 1979), a physical environment scale from McCaffree and Harkins (McCaffree 1976) and involvement‐in‐care questions adapted from the National Cancer Institute’s Hospice Study (Baker 1981). Kane 1984 reported that these measures have been shown to be reliable and valid for patients with terminal cancer. No study reported decreased satisfaction of care in the HSPC group.
Due to small numbers in our main meta‐analysis with adjusted endpoint values, we could not carry out subgroup analysis and we did not use funnel plots or carry out tests for funnel plot asymmetry.
Quality of the evidence
Within the Grade approach, we downgraded the quality of the evidence for patient satisfaction to low due to a high risk of bias in some domains in the two studies (‐2 levels as a result of very serious study limitations: high risk of performance, detection, reporting, attrition, size of study and other biases) (see summary of findings Table 1).
Unpaid caregiver satisfaction with care
Four studies assessed the effect of HSPC on family satisfaction with care (Carson 2016; Cheung 2010; Kane 1984; Ozcelik 2014). We excluded Cheung 2010 and Ozcelik 2014 from the synthesis because they used non‐validated family satisfaction measures. Carson 2016 and Kane 1984 used validated measures with a total of 408 participants.
Carson 2016 was the only study that presented adjusted endpoint values, with family satisfaction assessed using the Family Satisfaction in the Intensive Care Unit (FS‐ICU) survey (range, 0 to 100, 100 = best unpaid caregiver satisfaction). It found no between‐group difference between HSPC and usual care. The mean (95% CI) satisfaction in the HSPC group was 81.1 (78.3 to 83.9) while that in the usual care group was 84.3 (81.3 to 87.3), with a difference of ‐3.1 (‐7.3 to 1.0) between groups (P = 0.13).
Kane 1984 did not present their data. They only reported P values in favour of the HSPC group in two of the five cohorts they assessed. Kane 1984 assessed family satisfaction with care using the Interpersonal Care scale adapted from the Ware scale (Ware 1979), a physical environment scale based on that of McCaffree and Harkins (McCaffree 1976), and involvement‐in‐care questions adapted from the National Cancer Institute’s Hospice Study (Baker 1981).
Quality of the evidence
Within the Grade approach, we downgraded the quality of the evidence for unpaid caregiver satisfaction with care to very low due to a high risk of bias across studies (‐2 levels as a result of very serious study quality limitations: high risk of bias for performance, attrition and reporting biases and inconsistency: ‐1 level due to heterogeneity in study findings).
Achieving patient preferred place of death (measured by number of patients with home death)
Given that most people in developed countries prefer to die at home (Gomes 2012), we used number of home deaths as a proxy measure for achieving patient preferred place of death.
Pooled data from seven studies with 861 analysed participants showed that those receiving HSPC had higher odds of home deaths compared to those receiving usual care (OR 1.63, 95% CI 1.23 to 2.16; I2 = 0%; Analysis 4.1). The odds ratio of 1.63 translates to a risk ratio of 1.22 (95% CI 1.08 to 1.39). This implies an increase in the relative risk of home deaths of 22% (95% CI 8% to 39%) when compared to usual care.
Kane 1984 reported that in the intervention group, only 3% of deaths occurred at home with almost 60% dying in the inpatient hospice, while in the control group, 7% of deaths occurred at home with almost 80% dying in hospital. The actual number of deaths was not given but the authors stated that the difference between intervention and control group was not "statistically significant". Janssens 2019 reported two home deaths but did not state whether they occurred in the HSPC group or control group.
The remaining 33 studies did not report on home death.
Given that there were fewer than 10 included studies in the meta‐analysis, we did not use funnel plots or carry out tests for funnel plot asymmetry. In addition, we could not carry out subgroup analysis due to lack of heterogeneity (I2 = 0%) in our meta‐analysis.
Quality of the evidence
Within the Grade approach, we downgraded the quality of the evidence for achieving patient preferred place of death to low due to a high risk of bias across studies (‐2 levels as a result of very serious study limitations: high risk of bias for selection, performance, detection, attrition and reporting bias) (see summary of findings Table 1).
Achieving patient preferred place of care
Only one study by Bajwah 2015 (n = 47 participants) reported on this outcome. Bajwah 2015 was a fast‐track RCT. Patients in the intervention group received HSPC immediately after randomisation, while the control group received HSPC four weeks after randomisation. Consequently, both the intervention and control group received HSPC. Results at the end of the study showed that all eight patients (100%) who died in the intervention group achieved their preferred place of care, while 11 patients (84%) in the control group who received HSPC after four weeks achieved this.
Quality of the evidence
Within the Grade approach, we downgraded the quality of the evidence for achieving preferred place of care to very low due to a high risk of bias in different domains (‐2 levels as a result of very serious study limitations: high risk of bias for performance, detection, attrition and reporting bias and imprecision: ‐1 level due to limited number of studies and participants).
Mortality/survival
Thirty‐six studies with 7103 participants reported on mortality/survival (Ahronheim 2000; Bajwah 2015; Bakitas 2009; Bakitas 2015; Bekelman 2018; Brannstrom 2014; Brumley 2007; Carson 2016; Cheung 2010; Edmonds 2010; El‐Jawahri 2016; Farquhar 2014; Farquhar 2016; Franciosi 2019; Gade 2008; Groenvold 2017; Grudzen 2016; Higginson 2009; Higginson 2014; Hopp 2016; Janssens 2019; Kane 1984; Lowther 2015; Ma 2019; McCaffrey 2013; McCorkle 2015; McWhinney 1994; O'Riordan 2019; Rogers 2017; Sidebottom 2015; Solari 2018; Tattersall 2014; Temel 2010; Temel 2017; Vanbutsele 2018; Woo 2019) (see Table 4 under Additional tables). We decided against pooling of their hazard ratios in a meta‐analysis due to methodological limitations in the included studies. Three studies did not report on the number of deaths (Mendoza‐Galindo 2018 (abstract only); Ozcelik 2014; Wallen 2012), while Nottelmann 2018 only reported number of deaths in the HSPC group. Rodin 2019 reported that there were no deaths during the study, while this was unclear in the foreign language study because it was not described (Jingfen 2017).
| Author | Results for Mortality/Survival | P value |
|---|---|---|
| Number of deaths in the sample Intervention: 12 (25%) Control: 12 (25%) | 0.96 | |
| Number of deaths in the sample Intervention: 8 (32%) Control: 13 (54%) | Not stated | |
| Number of deaths in the sample Intervention: 112 (69.6%) Control: 119 (73.9%) Survival time (median, 95% CI) Intervention: 14 months (10.6 to 18.4) Control: 8.5 months (7 to 11.1) | Cox proportional hazards model estimate demonstrated a reduced relative risk of death (HR, 0.67 (95% CI: 0.496 to 0.906) P = .009) in the HSPC group during the first year of the study and a greater relative risk after one year, (HR, 1.56 (95% CI: 0.908 to 2.655)). P for survival time = 0.14 | |
| Number of deaths (authors stated that there were 109 deaths (52.7%) Intervention: numbers not provided Control: numbers not provided Survival time (median) Intervention: 18.3 months Control: 11.8 months | Kaplan‐Meier curves illustrated a 15% difference in survival at 1 year (HSPC, 63% vs control, 48%; P = 0.038). However, for the overall log‐rank test, P = 0.18), suggesting a convergence in overall survival after 12 months. | |
| Number of deaths in the sample Intervention: 10 (6.4%) Control: 13 (8.3%) | 0.52 | |
| Number of deaths in the sample Intervention: 8 (22%) Control: 4 (11.1%) | 0.34 | |
| Number of deaths (authors highlighted 75% deaths among participants) Intervention: numbers not provided Control: numbers not provided Survival time (mean (SD)) Intervention: 196 days (SD:164) Control: 242 days (SD:200) | P = 0.03 However, results of the Kaplan‐Meier survival analysis did not show differences in survival time between study groups (P = 0.08). | |
| Survival time (median, IQR) Intervention: 19 days (12 to 37) Control: 23 days (12 to 39) | P for survival time = 0.51 90‐day survival (HR, 0.95 (95% CI: 0.65 to 1.38), P = 0.96). Post hoc adjustment for baseline activities of daily living and study site did not alter the outcome (HR,1.01 (95% CI; 0.69 to 1.47), P = 0.96) | |
| Number of deaths in the sample Intervention: 7 (70%) Control: 9 (90%) | P = 0.58 | |
| Number of deaths in the sample Intervention: 1 (70%) Control: 3 (11.5%) | P value not stated | |
| Number of deaths in the sample Intervention: 3 (3.7%) Control: 0 | P value not stated | |
| Number of deaths in the sample Intervention: 2 (5.7%) Control: 0 | P value not stated | |
| Number of deaths in the sample Intervention: 1 (2.3%) Control: 1 (2.3%) | P value not stated | |
| Number of deaths in the sample Intervention: 52 (37.4%) Control: 30 (36.6%) | P value not stated | |
| Number of deaths in the sample Intervention: 173 (63%) Control: 132 (56%) Survival time (median, IQR) Intervention: 30 days (6 to 104) Control: 36 days (13 to 106) | P (for difference in number of deaths) = 0.08 P (for difference in survival time) = 0.08 | |
| Number of deaths in the sample Intervention: 25 (27%) Control: 22 (23%) Survival time (median) Intervention: 323 days Control: 364 days | P (for difference in survival time) = 0.16, but in the adjusted analysis P = 0.39 | |
| Number of deaths in the sample Intervention: 41 (59.4%) Control: 44 (65.7%) Survival time (median, 95% CI) Intervention: 289 days (128 to 453) Control: 132 days (80 to 302) | The P value for difference in median survival was 0.20 (log‐rank test) | |
| Number of deaths in the sample Intervention: 1 (3.8%) Control: 3 (11.5%) | P value not stated | |
| Number of deaths in the sample Intervention: 3 (5.7%) Control: 13 (25%) Survival time (median, range) Intervention: 745 (338 to1075) Control: 711 (345 to1045) | P (for survival rate) was 0.048. In subgroup analysis, this pattern was not recorded for patients with cancer (P = 0·97); but it became more marked for patients with diseases other than cancer (P = 0·01). | |
| Number of deaths in the sample (denominator unclear) Intervention: 11 Control: 8 | P = 0.47 | |
| Number of deaths in the sample Intervention: 4 (15.4%) Control: 4 (17.4%) Survival time (unclear if mean or median reported) Intervention: 454 days (95% CI: 382 to 525) Control: 425 days (95% CI: 339 to 509) | Survival did not differ between groups (log‐rank test, P = 0.913). | |
| One‐third of the sample died within 45 days after enrollment, the second third within 120 days but numbers were not provided for the intervention and control groups | Authors reported no difference in the survival patterns of HSPC and control patients | |
| Number of deaths in the sample Intervention: 3 (5%) Control: 0 | P value not stated | |
| Number of deaths in the sample Intervention: 34 (35.1%) Control: 37 (36.3%) | P = 0.87 | |
| Number of deaths in the sample Intervention: 16 (69.6%) Control: 5 (62.5%) | Increment (95% CI) reported as 7 (‐45.1 to 30.4) | |
| Number of deaths in the sample Intervention: 7 (10.6%) Control: 3 (3.8%) | P value not stated | |
| Authors reported that 36 (24.7%) patients died before one month but did not provide numbers in the intervention and control group. | ||
| Number of deaths in the sample Intervention: 1 (4.5%) Control: 1 (5.6%) | P value not stated | |
| Number of deaths in the sample Intervention: 23 (30.7%) Control: 20 (26.7%) | P value not stated | |
| Number of deaths in the sample Intervention: 14 (12.1%) Control: 5 (4.3%) | Results of the survival analysis found no association between study group assignment and death within 6 months after adjustment for age, gender, and marital status. | |
| Number of deaths in the sample Intervention: 3 (3%) Control: 0 | P value not stated | |
| Number of deaths in the sample Intervention: 39 (65%) Control: 31 (51.7%) Survival time (median, 95% CI) Intervention: 7 months (5.2 to 9.8) Control: 11.7 months (9.8 to 18.8) | P (log rank) = 0.014. The estimated HR was 1.6 (95% CI: 1.1 to 2.3; P = 0.015). This estimate changed to 1.5 (95% CI 0.99 to 2.2; P = 0.06) when adjusted for the oncologist’s baseline estimate of likely survival, diagnosis, months since diagnosis, and gender. | |
| Number of deaths (authors stated 105 participants (70%) had died by the time of analysis) Intervention: numbers not provided Control: numbers not provided Survival time (median, 95% CI) Intervention: 11.6 (6.4 to 16.9) months Control: 8.9 (6.3 to 11.4) months | Log‐rank P = 0.02 After adjustment for age, sex, and baseline Eastern Cooperative Oncology Group performance status, the group assignment remained a predictor of survival (HR for death in the standard care group, 1.70; 95% CI, 1.14 to 2.54; P = 0.01). | |
| Number of deaths in the sample Intervention: 33 (18.9%) Control: 41 (23.4%) | P value not stated | |
| Number of deaths (authors stated that 121 (65%) of participants had died by the end of the study) Intervention: numbers not provided Control: numbers not provided Survival time (median, 95% CI) Intervention: 312 days (190 to 434) Control: 343 days (253 to 433) | P = 0.97 | |
| Authors reported that there was no difference in survival between HSPC and usual care but did not present any data |
CI:
HR:
HSPC:
IQR:
vs:
Ten of these studies reported on deaths in the HSPC and control group without presenting survival time and they found no between‐group difference in number of deaths (Ahronheim 2000; Bekelman 2018; Brannstrom 2014; Cheung 2010; Franciosi 2019; Higginson 2009; Hopp 2016; Ma 2019; McCaffrey 2013; Rogers 2017), while Sidebottom 2015 reported no association between study group assignment and death within six months after adjustment for age, gender, and marital status (Hazard Ratio: 1.90 (95% CI: 0.88, 4.09); P = 0.101). Sidebottom 2015 reported 14 deaths (12.1%) in the HSPC group and 5 deaths (4.3%) in the control group.
In 11 studies, it was unclear if there was any difference in mortality because the P values were not presented (Bajwah 2015; Edmonds 2010; El‐Jawahri 2016; Farquhar 2014; Farquhar 2016; Lowther 2015; McCorkle 2015; McWhinney 1994; O'Riordan 2019; Solari 2018; Temel 2017). McWhinney 1994 only presented the total number of deaths at one month (36 (24.7%)) but did not report the numbers in the HSPC and control group.
In the studies that reported survival time, there was probably little to no effect of HSPC on survival (Bakitas 2009; Bakitas 2015; Carson 2016; Gade 2008; Groenvold 2017; Grudzen 2016; Kane 1984; Janssens 2019; Vanbutsele 2018; Woo 2019).
In Bakitas 2009, median survival (95% CI) in the HSPC group was 14 months (10.6 to 18.4) and 8.5 months (7 to 11.1) in control with a P value of 0.14. There were 112 deaths (69.6%) in the HSPC group and 119 deaths (73.9%) in the control group. The Cox proportional hazards model estimate demonstrated a reduced relative risk of death (Hazard Ratio (HR): 0.67 (95% CI: 0.496 to 0.906), P = 0.009) in the HSPC group during the first year of the study and a greater relative risk after one year (HR, 1.56 (95% CI: 0.908 to 2.655)).
In Bakitas 2015, a fast‐track RCT in which the intervention group was offered HSPC immediately, while the control group received HSPC after three months, median survival by the end of data collection in the intervention group was 18.3 months and 11.8 months in the control group who began HSPC three months later. Kaplan‐Meier curves illustrated a 15% difference in survival at 1 year (HSPC, 63% versus control, 48%; P = 0.038). However, the overall log‐rank test P value was 0.18, suggesting a convergence in overall survival after 12 months. At one year, there were 109 deaths (52.7%) but numbers in intervention and control groups were not reported.
Carson 2016 reported a median survival (95% CI) of 19 (12 to 37) days in the HSPC group and 23 (12 to 39) days in control group (P = 0.51). There was no difference in 90‐day survival (HR, 0.95 (95% CI: 0.65 to 1.38), P = 0.96). Post hoc adjustment for baseline activities of daily living and study site did not alter the outcome (HR,1.01 (95% CI: 0.69 to 1.47), P = 0.96).
In Grudzen 2016, median survival (95% CI) in the HSPC group was 289 days (128 to 453) and 132 days (80 to 302) in control with a P value of 0.2. At one year, 41 participants (59.4%) had died in the HSPC group and 44 (65.7%) had died in the control group. However, there was no difference between the groups (P = 0.20).
Janssens 2019 was not clear about whether they were reporting mean or median survival. Survival in the HSPC group was 454 days (95% CI: 382 to 525) and 425 days (95% CI: 339 to 509) in the control group (log‐rank test, P = 0.91). During the follow‐up period in Janssens 2019, there were four deaths (15.4%) in the HSPC group and four deaths (17.4%) in the control group.
Kane 1984 reported no difference in survival between HSPC and the control group as the survival curves were similar.
In Gade 2008, median survival (IQR) was 30 days (6 to 104) in the HSPC group and 36 days (13 to 106) in the control group (P = 0.08). There were 173 deaths (63%) in the HSPC group and 132 deaths (56%) in the control group during the study period.
Groenvold 2017 reported that survival time did not differ between HSPC and the control group. Median survival in the HSPC group was 323 days and 364 days in the control group (P = 0.16, but in the adjusted analysis P = 0.39). There were 25 deaths (27%) in the HSPC group and 22 deaths (23%) in the control group.
Woo 2019 reported that there was no difference in survival between HSPC and usual care but did not present any data.
Vanbutsele 2018 found the median survival (95% CI) in the HSPC group to be 312 days (190 to 434) and 343 days (253 to 433) in the control group (P = 0.97).
Sidebottom 2015 reported no association between study group assignment and death within six months after adjusting for age, gender and marital status (P = 0.10).
Higginson 2014 and Temel 2010 found evidence in favour of HSPC for longer survival compared to usual care. Higginson 2014 was a fast‐track RCT in which the intervention group received HSPC immediately while those in the control group were offered HSPC after six weeks. Survival was calculated from the time of randomisation to the time of death, if death occurred during the study period, or to the time of censoring. Median survival (range) from randomisation to the time of censoring was 745 (338 to 1075) days in the intervention group compared to 711 (345 to 1045) in the control group who received HSPC after six weeks (P = 0.048). In subgroup analysis, this pattern was not recorded for patients with cancer (P = 0.97); but it became more marked for patients with diseases other than cancer (P = 0.01). Temel 2010 reported that median survival (95% CI) was 11.6 months (6.4 to 16.9) in the HSPC group and 8.9 months (6.3 to 11.4) in control (log rank P = 0.02). After adjustment for age, sex, and baseline Eastern Cooperative Oncology Group performance status, the group assignment remained a predictor of survival (hazard ratio for death in the standard care group, 1.70; 95% CI, 1.14 to 2.54; P = 0.01).
By contrast, Brumley 2007 and Tattersall 2014 reported greater survival (SD) in the control group compared to the HSPC group. Brumley 2007 reported a mean (SD) survival of 242 (SD:200) days in the control group compared to 196 (SD:164) days in those receiving HSPC (P = 0.03). However, results of the Kaplan‐Meier survival analysis did not show differences in survival time between study groups (P = 0.08). The authors also highlighted 75% death among participants but the percentages in the HSPC and control groups were not stated. In Tattersall 2014, there were 39 (65%) deaths in the HSPC group and 31 (51.7%) in the control group at 12 months. Tattersall 2014 found the median survival (95% CI) in the HSPC group to be 7 months (5.2 to 9.8) compared to 11.7 months (9.8 to 18.8) in the control group (log rank P = 0.014). The estimated hazard ratio was 1.6 (95% CI:1.1 to 2.3; P = 0.015). This estimate changed to 1.5 (95% CI 0.99 to 2.2; P = 0.06) when adjusted for the oncologist’s baseline estimate of likely survival, diagnosis, months since diagnosis, and gender.
Quality of the evidence
Within the Grade approach, we downgraded the quality of the evidence for mortality/survival to very low due to a high risk of bias across studies (‐2 levels as a result of very serious study limitations: high risk of bias for selection, performance, detection, attrition, reporting and other biases and inconsistency: ‐1 level due to variability in study findings).
Pain
We pooled data from four studies (n = 525 participants) that reported adjusted endpoint values for pain as the main meta‐analysis. The meta‐analysis showed that HSPC may lead to little to no difference in pain relief (SMD ‐0.16, 95% CI ‐0.33 to 0.01; I2 = 0%; Analysis 5.1). Positive SMDs indicate more pain while negative SMDs indicate lower pain (benefit). Only Woo 2019 reported unadjusted endpoint values and it assessed pain using the Brief Pain Inventory. It found no difference in mean pain scores between HSPC and usual care (P = 0.22). However, sensitivity analysis with studies reporting adjusted change values showed evidence in favour of HSPC (SMD ‐0.47, 95% CI ‐0.74 to ‐0.20, I2 = 0%; n = 2 studies; N = 218 participants; Analysis 5.2).
When we carried out sensitivity analysis using unadjusted change values, we found no evidence of a difference between HSPC and usual care (SMD ‐0.93, 95% CI ‐3.05 to 1.19; I2 = 97%; n = 2 studies; N = 291 participants; Analysis 5.3).
Although we had initially specified that we would treat pain as a binary outcome in our published protocol (Bajwah 2017), this was not possible as most studies presented pain as a continuous outcome. Studies such as Tattersall 2014 reported on the percentage of patients with pain, while Lowther 2015 presented pain data as medians. Kane 1984 reported that there was no difference in pain between the intervention and control group over time but did not present data. Also, McWhinney 1994 stated that there were "no clinically or statistically significant differences" between the intervention and control groups but did not report their data. The remaining 30 studies did not report on pain.
We combined different scales assessing pain by calculating SMDs. Across the studies in these meta‐analyses, we combined different measures for assessing pain (PEG derived from the Brief Pain Inventory (BPI) in Bekelman 2018; pain item of the EORTC QLQ‐C30 in Groenvold 2017 and Vanbutsele 2018; pain item of the POS in Higginson 2009; pain severity on the BPI in O'Riordan 2019, Rodin 2019 and Woo 2019; pain item of the ESAS in Ozcelik 2014 and Sidebottom 2015).
Given that there were fewer than 10 included studies in our main meta‐analysis on pain using adjusted endpoint values, we did not use funnel plots or carry out tests for funnel plot asymmetry. In addition, we could not carry out subgroup analysis due to lack of heterogeneity (I2 = 0%) in our main meta‐analysis with adjusted endpoint values.
Quality of the evidence
Within the Grade approach, we downgraded the quality of the evidence for pain to very low due to a high risk of bias across studies (‐2 levels as a result of very serious study limitations: high risk of bias for performance, attrition and other bias and inconsistency: ‐1 level due to differences between our main meta‐analysis and sensitivity analyses) (see summary of findings Table 1).
Patient anxiety and depression
Patient anxiety
We pooled data from five studies (N = 384 participants) that reported adjusted endpoint values as the main meta‐analysis. The five studies used the anxiety subscale of the Hospital Anxiety and Depression Scale (HADS‐A) for assessing anxiety (seven items; 0 to 21 scale, 21 = maximum distress). HSPC showed no evidence of difference with a mean difference of ‐0.63 points when compared to usual care (95% CI ‐2.22 to 0.96; I2 = 76%; Analysis 6.1). Negative mean difference (MD) indicates benefit (lower anxiety) and positive MD reflects harm (higher anxiety).
We carried out sensitivity analysis to test the estimate we used in adjusting for clustering in McCorkle 2015 and found evidence in favour of HSPC (MD ‐1.60, 95% CI ‐2.56 to ‐0.65; I2 = 17%; n = 4 studies; N = 320 participants; Analysis 6.2).
Evidence from the sensitivity analysis of studies that reported unadjusted endpoint values produced a mean difference of ‐0.90 between HSPC and usual care (95% CI ‐2.52 to 0.71; I2 = 67%; n = 4 studies; N = 273 participants; Analysis 6.3). Included studies measured anxiety using the HADS‐A. When we removed McCorkle 2015, the mean difference was ‐1.48 (95% CI ‐3.52 to 0.56; I2 = 71%; n = 3 studies; N = 209 participants; Analysis 6.4).
Sensitivity analysis with studies that presented unadjusted change values showed an effect in favour of HSPC (SMD ‐0.62; 95% CI ‐1.02 to ‐0.21; I2 = 74%; n = 4 studies; N = 496 participants; Analysis 6.5). SMD was used in pooling the estimates because the four studies used different scales for measuring anxiety. Bajwah 2015 and El‐Jawahri 2016 used the HADS‐A, Bekelman 2018 used the Generalised Anxiety Disorder‐7 (GAD‐7), while Ozcelik 2014 used the anxiety subscale of the Edmonton Symptom Assessment Scale (ESAS)).
Only Sidebottom 2015 (n = 167 participants) reported adjusted change values and it assessed anxiety using the anxiety subscale of the ESAS (using a visual scale line, 0 to 10, 10 = worst possible). It found that anxiety scores improved by a mean of 1.27 points in the HSPC group and 0.89 in the control group at three months (difference 0.38, P = 0.017) after adjusting for age, gender, and marital status differences between study groups. This difference was already evident at one month (P = 0.007).
Five studies also assessed patient anxiety but they could not be included in the meta‐analysis for the following reasons: Kane 1984 did not provide data on anxiety but rather it only stated the P values, Temel 2010 only presented the percentage of patients with anxiety at the primary point of analysis, Temel 2017 did not provide data but stated that scores did not differ between the intervention and control groups at 12 weeks or 24 weeks, Solari 2018 reported no difference between groups for change at three and six months but did not present usable data and Vanbutsele 2018 presented an odds ratio at 12, 18 and 24 weeks. This study did not find any evidence of a difference between groups at these different time points.
The remaining 26 studies did not report on patient anxiety.
Given that there were fewer than 10 included studies in the main meta‐analysis on patient anxiety using adjusted endpoint values, we did not use funnel plots or carry out tests for funnel plot asymmetry.
Subgroup analysis on patient anxiety
We carried out the following subgroup analyses on patient anxiety.
Effect of HSPC on patient anxiety in different populations
Among studies that reported adjusted endpoint values, we carried out subgroup analysis to assess the effect of HSPC on patient anxiety in different populations. Three studies with 275 participants were with cancer populations and two with non‐cancer populations (N = 109 participants). Subgrouping according to patient population explained heterogeneity in the non‐cancer population subgroup (I2 = 0%), but not the cancer population subgroup (I2 = 87%) (Analysis 6.6). There was no evidence of a subgroup effect (P = 0.90, I2 = 0%). This finding may be spurious due to the small number of studies and participants in the subgroups. When McCorkle 2015 was excluded from the cancer population subgroup, heterogeneity (I2) reduced to 24% (Analysis 6.7). No subgroup difference was observed (P = 0.29, I2 = 10%).
Effect of different models of HSPC on patient anxiety
Four studies (N = 227 participants) that involved service provision across multiple settings and one study by El‐Jawahri 2016 with an inpatient consult model (N = 157 participants) reported adjusted endpoint values. We could not carry out subgroup analysis because of the limited number of studies in the inpatient consult model subgroup.
Effect of 24 hours access (out‐of‐hours care) on patient anxiety
None of the studies had provision for 24 hours access.
Effect of early palliative care versus late palliative care on patient anxiety
Among studies that reported adjusted endpoint data, two studies with 221 participants provided HSPC early and three with 163 participants provided it late. Subgrouping only explained heterogeneity in the late palliative care subgroup (I2 = 0%), but not the early palliative care subgroup (I2 = 94%) (Analysis 6.8). There was no evidence of a subgroup effect (P = 0.90, I2 = 0%). When McCorkle 2015 was removed from the early palliative care subgroup, only El‐Jawahri 2016 was remaining in the subgroup and we could not carry out any further analysis.
Effect of nurse led multi‐disciplinary team versus multidisciplinary led team services on patient anxiety
All five studies (N = 384 participants) that reported adjusted endpoint values were MDTservices not led by nurses with a pooled mean difference of ‐0.63 between HSPC and usual care (95% CI ‐2.22 to 0.96; I2 = 76%; Analysis 6.9). After removal of McCorkle 2015, there was evidence in favour of HSPC when compared to usual care (MD ‐1.60, 95% CI ‐2.56 to ‐0.65; I2 = 17%; n = 4 studies; N = 320 participants; Analysis 6.10).
Effect of HSPC on patient anxiety in different countries
Among studies that reported adjusted endpoint values, three (N = 251 participants) were carried out in USA and two (N = 133 participants) in the UK. Subgrouping by country only explained heterogeneity in the UK studies (I2 = 0%), but not the USA studies (I2 = 88%) (Analysis 6.11). Subgroup analysis showed no difference across the two countries (P = 0.66, I2= 0%). This analysis is unlikely to detect a subgroup difference due to the small number of studies and participants in the subgroups. When McCorkle 2015 was removed from the USA subgroup, I2 was 52% in the subgroup (Analysis 6.12) and there was no evidence of a subgroup effect and heterogeneity (P = 0.77, I2 = 0%).
Quality of the evidence
Within the Grade approach, we downgraded the quality of the evidence for patient anxiety to very low due to a high risk of bias across studies (‐2 levels as a result of very serious study limitations: high risk of bias for selection, performance, detection, attrition and reporting biases and inconsistency: ‐1 level due to unexplained heterogeneity).
Patient depression
We pooled data from eight studies (N = 1096 participants) reporting adjusted endpoint values for our main meta‐analysis on patient depression. The results showed that HSPC improved depression when compared to usual care (SMD ‐0.22, 95% CI ‐0.34 to ‐0.10; I2 = 0%; Analysis 8.1). Negative SMDs indicate benefit (lower depression) and positive SMDs reflect harm (higher depression).
We carried out sensitivity analysis with five studies (N = 350 participants) presenting unadjusted endpoint values and found a pooled estimate of SMD ‐0.25 (95% CI ‐0.55 to 0.04; I2 = 47%; Analysis 8.2). We carried out sensitivity analysis to assess the impact of using an estimate of 0.02 in adjusting for clustering in McCorkle 2015 and found evidence in favour of HSPC (SMD ‐0.34, 95% CI ‐0.65 to ‐0.03; I2 = 42%; n = 4 studies; N = 286 participants; Analysis 8.3).
Only two studies (McCorkle 2015, Sidebottom 2015) with 231 participants contributed data to the sensitivity analysis using adjusted change values with a pooled estimate of MD ‐0.32 (95% CI ‐1.10 to 0.45; I2 = 92%; Analysis 8.4). The sensitivity analysis using unadjusted change values showed evidence in favour of HSPC (SMD ‐0.38, 95% CI ‐0.58 to ‐0.18; I2 = 12%; n = 4 studies; N = 488 participants; Analysis 8.5).
Three studies also presented binary data and we pooled them using odds ratio (El‐Jawahri 2016; Temel 2010; Woo 2019). We found evidence of lower odds of patient depression with HSPC compared to usual care (OR 0.38, 95% CI 0.21 to 0.68; I2 = 32%; n = 3 studies; N = 338 participants; Analysis 8.6). The odds ratio of 0.38 translates to a risk ratio of 0.55, implying that the risk of patient depression was 0.55 times lower with HSPC compared to usual care.
Four studies assessed patient depression but we excluded them from the main meta‐analysis because they did not present analysable data (Kane 1984; Solari 2018; Vanbutsele 2018; Wallen 2012). Kane 1984 described no between‐group difference between intervention and control group but did not provide the data. Solari 2018 reported that they found no difference between groups at three and six months but did not present analysable data, Vanbutsele 2018 presented only odds ratios and the corresponding 95% CIs for the two measures it used in assessing depression (HADS‐D and PHQ‐9). There was no difference between intervention and control groups at 12, 18 and 24 weeks in Vanbutsele 2018. Wallen 2012 assessed depression but did not present data on it at baseline and follow‐up. The remaining 21 studies did not report on patient depression.
Studies included in the meta‐analyses used different scales in assessing depression (Becks Depression Inventory‐II (BDI‐II) in Rodin 2019; depression subscale of the Hospital Anxiety and Depression Scale (HADS‐D) in Bajwah 2015, El‐Jawahri 2016, Farquhar 2014, Farquhar 2016, Higginson 2014, O'Riordan 2019, Rogers 2017; Patient Health Questionnaire (PHQ‐9) in Bekelman 2018, Grudzen 2016, McCorkle 2015, Sidebottom 2015 and Temel 2017; depression subscale of the Edmonton Symptom Assessment Scale (ESAS) in Ozcelik 2014; Centre for Epidemiological Studies ‐ Depression Scale (CES‐D) in Bakitas 2009, Bakitas 2015 and Woo 2019). El‐Jawahri 2016 and Temel 2017 also assessed depression using the PHQ‐9.
Given that there was no heterogeneity in our main meta‐analysis (I2 = 0%), we did not carry out any subgroup analysis. There were fewer than 10 studies that reported adjusted endpoint values in the main meta‐analysis, and we did not use funnel plots or carry out tests for funnel plot asymmetry.
Quality of the evidence
Within the Grade approach, we downgraded the quality of the evidence for patient depression to very low due to a high risk of bias across studies (‐2 levels as a result of very serious study limitations: high risk of bias for selection, performance, detection, attrition and reporting biases and inconsistency: ‐1 level due to differences between our main meta‐analysis and sensitivity analyses).
Patient breathlessness
We pooled data from five studies reporting adjusted endpoint values for our main meta‐analysis on patient breathlessness with a pooled estimate of SMD ‐0.04 (95% CI ‐0.19 to 0.12; I2 = 0%, N = 616 participants; Analysis 12.1). Negative SMDs indicate benefit (reduced breathlessness) and positive SMDs reflect worsened breathlessness. The five studies used different instruments and reported on different breathlessness domains. For instance, Farquhar 2014 and Farquhar 2016 both assessed distress due to breathlessness and breathlessness mastery using a Numeric Rating Scale (NRS) and the mastery domain of the Chronic Respiratory Questionnaire (CRQ), respectively; Groenvold 2017 and Vanbutsele 2018 assessed breathlessness intensity using the dyspnoea item of EORTC QLQ‐C30; O'Riordan 2019 assessed breathlessness intensity using the BORG scale. For Farquhar 2014 and Farquhar 2016, we used only data for distress due to breathlessness assessed with the NRS in our meta‐analysis because it was the primary outcome. We did not differentiate between different breathlessness domains in our meta‐analysis due to small numbers.
Sensitivity analysis carried out with the two studies (N = 128 participants) presenting unadjusted endpoint values showed a pooled estimate in favour of HSPC (SMD ‐0.35, 95% CI ‐0.70 to ‐0.00; I2 = 0%; Analysis 12.2).
Only Sidebottom 2015 presented adjusted change values. It assessed breathlessness using the dyspnoea item of ESAS (using a visual scale line, 0 to 10, 10 = worst possible) and found that breathlessness scores improved by a mean of 2.8 points in the HSPC group and 1.7 in the control group at 3 months (difference 1.08, P < 0.001) after adjusting for age, gender, and marital status differences between study groups. This difference was evident at one month with a mean difference of 1.10 (P < 0.001).
Sensitivity analysis with the two studies that reported unadjusted change values showed a pooled estimate of SMD ‐0.47 (95% CI ‐1.55 to 0.61; I2 = 90%, N = 292 participants; Analysis 12.3).
A study by Tattersall 2014 also recorded this outcome but did not present analysable data. The remaining 31 studies did not report on breathlessness.
Studies included in the meta‐analyses used different scales in assessing breathlessness: D‐12 in Bajwah 2015; Memorial Symptom Assessment Scale in Bekelman 2018; Numeric Rating Scale (NRS) for distress due to breathlessness in Farquhar 2014 and Farquhar 2016; dyspnoea item of EORTC QLQ‐C30 in Groenvold 2017 and Vanbutsele 2018; breathlessness mastery domain of the Chronic Respiratory Disease Questionnaire (CRQ mastery) in Higginson 2014; BORG scale in O'Riordan 2019; dyspnoea item of ESAS in Ozcelik 2014 and Sidebottom 2015.
Due to lack of heterogeneity (I2 = 0%) in our main meta‐analysis, we could not carry out subgroup analysis. Given that there were fewer than 10 included studies in the main meta‐analysis on breathlessness using adjusted endpoint values, we did not use funnel plots or carry out tests for funnel plot asymmetry.
Quality of the evidence
Within the Grade approach, we downgraded the quality of evidence for breathlessness to very low due to a high risk of bias across studies (‐2 levels as a result of very serious study limitations: high risk of bias for selection, performance, detection, attrition and reporting biases, imprecision: ‐1 level due to wide 95% CI around the effect estimates that included both benefit and harm and inconsistency: ‐1 level due to differences between our main meta‐analysis and sensitivity analyses).
Adverse events in patients and unpaid caregivers
Eight studies with 1252 participants reported on adverse events (Bajwah 2015; Bekelman 2018; Groenvold 2017; Higginson 2014; Lowther 2015; Rodin 2019; Solari 2018; Tattersall 2014) (see Table 5 under Additional tables). Two of these studies involved unpaid caregivers (Bajwah 2015; Higginson 2014).
| Studies | Participants | Adverse effects in patients/caregivers |
|---|---|---|
| Patients and caregivers | Authors reported no worsening of any outcome after receiving the intervention. | |
| Patients | There were no harmful adverse events attributed to the intervention. | |
| Patients | Authors did not observe any harmful effect of the intervention. | |
| Patients (and caregivers if present) | Authors did not observe any harmful effect of the intervention. | |
| Patients | Authors did not observe any harmful effect of the intervention. | |
| Patients | Authors reported no adverse events during the study. | |
| Patients and caregivers | Authors reported 15 serious adverse events in 13 patients in the HSPC group and 7 in 7 patients in the control group. Serious adverse events reported included aspiration pneumonia, generalised anxiety, breathing difficulty, urine retention/infection, anarthria, contact dermatitis, dysphagia, vomiting, bladder catheter malfunctioning, fever, arrhythmia, necrotising fasciitis, traumatic wound, macrohaematuria, constipation, abdominalgia and bronchitis. Three patients in the HSPC group died but this was considered to be unrelated to the intervention. | |
| Patients | Authors reported that more patients in the HSPC group had poorer appetite compared to the control group (P = 0.04). |
HSPC:
Six studies (N = 976 participants) reported no harmful effect (Bajwah 2015; Bekelman 2018; Groenvold 2017; Higginson 2014; Lowther 2015; Rodin 2019).
One study by Tattersall 2014 (N = 120 participants) found that more patients in the HSPC group had the mild adverse event of poorer appetite (P = 0.04) compared to the control group.
Solari 2018 (N = 156 participants) reported 15 serious adverse events in 13 patients in the HSPC group and seven in seven patients in the control group (P = 0.78). Serious adverse events reported included aspiration pneumonia, generalised anxiety, breathing difficulty, urine retention/infection, anarthria, contact dermatitis, dysphagia, vomiting, bladder catheter malfunctioning, fever, arrhythmia, necrotising fasciitis, traumatic wound, macrohaematuria, constipation, abdominalgia and bronchitis. Three patients in the HSPC group died but this was considered to be unrelated to the intervention.
Quality of the evidence
Within the Grade approach, we downgraded the quality of the evidence for adverse events to very low due to a high risk of bias across studies (‐2 levels as a result of very serious study limitations: high risk of bias for performance, detection, attrition and reporting bias and inconsistency: ‐1 level due to variability in the results).
Unpaid caregiver symptom control
Unpaid caregiver anxiety
Only Carson 2016 (N = 312 participants) presented adjusted endpoint values. Carson 2016 assessed unpaid caregiver anxiety using the HADS‐A (seven items; 0 to 21 scale, 21 = maximum distress). Carson 2016 reported no difference in the unpaid caregiver anxiety in the HSPC group compared to the control group at three months on adjusting for baseline and multiple respondents (mean (95% CI): 7.2 (6.6 to 7.9) versus 6.4 (5.7 to 7.1), mean difference was 0.8 (95% CI: ‐0.1 to 1.8), P = 0.09). Adjustments for three variables (baseline, multiple respondents and study sites) and six variables (baseline, multiple respondents, study sites, race, sex and primary/additional surrogate) also produced similar results with P values of 0.11 and 0.12, respectively.
Only Bajwah 2015 and Carson 2016 with 351 participants provided unadjusted endpoint data with a pooled estimate of MD ‐0.71 (95% CI ‐4.27 to 2.85; I2 = 77%; Analysis 7.1). Both studies used the HADS‐A in assessing unpaid caregiver anxiety. A negative MD indicates benefit (lower unpaid caregiver anxiety) and a positive MD reflects harm (higher unpaid caregiver anxiety).
Four studies recorded this outcome but did not present analysable data (El‐Jawahri 2016; Farquhar 2014; Farquhar 2016; Kane 1984). El‐Jawahri 2016 and Farquhar 2016 did not present the number of participants in the intervention and control group at the primary point of analysis. Farquhar 2014 reported that there was little change in carer outcomes but did not present data, while Kane 1984 found differences in favour of HSPC in three of the five cohorts examined but did not present usable data.
The remaining 36 studies did not report on unpaid caregiver anxiety.
Given that we had only one study that presented adjusted endpoint values, we could not carry out any further analysis.
Quality of the evidence
Within the Grade approach, we downgraded the quality of the evidence for unpaid caregiver anxiety to very low due to a high risk of bias (‐2 levels as a result of very serious study limitations: high risk of bias for performance, attrition and reporting biases, and imprecision: ‐1 level due to the small number of participants).
Unpaid caregiver depression
Two studies (N = 413 participants) reported on unpaid caregiver depression and also presented adjusted endpoint values. They found that HSPC had little to no effect on unpaid caregiver depression (SMD ‐0.02, 95% CI ‐0.21 to 0.18; I2 = 0%; Analysis 9.1). Negative SMDs indicate benefit (lower depression) and positive SMDs reflect harm (higher depression).
Sensitivity analysis with the three studies that reported unadjusted endpoint values resulted in a SMD of ‐0.29 (95% CI ‐0.70 to 0.12; I2 = 63%; n = 3 studies; N = 420 participants; Analysis 9.2).
Bajwah 2015, (N = 35 unpaid caregiver participants), was the only study that presented unadjusted change values on the HADS‐D (seven items; 0 to 21 scale, 21 = maximum distress). It found a 30% mean decrease in unpaid caregiver depression scores from baseline at four weeks for the HSPC group while for controls, unpaid caregiver depression increased by one point. The effect size (95% CI) at four weeks was ‐0.7 (‐1.3 to 0.0). Between the period when the control group received HSPC (four weeks) and eight weeks, mean (SD) depression improved in the control group from 9.6 (4.9) to 7.2 (3.9).
Four studies reported on unpaid caregiver depression but did not present usable data (El‐Jawahri 2016; Farquhar 2014; Farquhar 2016; Kane 1984). In El‐Jawahri 2016, the number of participants in the intervention and control groups at the primary point of analysis was not reported. Farquhar 2014, Farquhar 2016 and Kane 1984 did not present their data. The remaining 34 studies did not report on unpaid caregiver depression.
Studies included in the meta‐analyses used different scales in assessing unpaid caregiver depression (Bajwah 2015 and Carson 2016 used the depression subscale of the HADS (HADS‐D); Bakitas 2015 used the CES‐D; Bekelman 2018 assessed depression using the Patient Health Questionnaire‐8 (PHQ‐8)).
We could not carry out subgroup analysis due to lack of heterogeneity in our main meta‐analysis (I2 = 0%). Given that there were fewer than 10 included studies in the meta‐analysis on unpaid caregiver depression, we did not use funnel plots or carry out tests for funnel plot asymmetry.
Quality of the evidence
Within the Grade approach, we downgraded the quality of evidence for unpaid caregiver depression to very low due to a high risk of bias (‐2 levels as a result of very serious study limitations: high risk of bias for performance, attrition and reporting bias and imprecision: ‐1 level due to wide 95% CIs around the effect estimates that included both benefit and harm).
Unpaid caregiver burden
Two studies with 170 participants presented adjusted endpoint values (Dionne‐Odom 2015a (linked to Bakitas 2015); Bekelman 2018)). However, we could not pool them together in a meta‐analysis due to how they presented their data. Dionne‐Odom 2015a assessed unpaid caregiver burden using the Montgomery‐Borgatta Caregiver Burden (MBCB) scale and presented results for three different subscales of the MBCB, namely, the objective burden scale (range, 6 to 30; 30 indicates worst level of interference with the unpaid caregiver's private, social, recreational time and normal daily routine), stress burden scale (range, 4 to 20; 20 indicates worst level of strained emotional demands related to caregiving) and the demand scale (range, 4 to 20; > 15 indicates worst level of caregiver strain by his or her caregiving demands). Bekelman 2018 assessed unpaid caregiver burden using the Zarit Burden Inventory (ZBI) (range, 0 to 88; 88 indicates highest burden).
On the objective burden scale of the MBCB, the mean unpaid caregiver burden scores for the HSPC group was 0.3 points higher (range 6 to 30; 30 indicates worst) than that of the control group with adjustment for patient death (P = 0.64). On the stress burden scale of the MBCB, the mean caregiver burden scores for the HSPC group was 0.5 points lower (range, 4 to 20; 20 indicates worst) than the control group with adjustment for patient death (P = 0.29). There was no difference in the mean caregiver burden score with adjustment for patient death on the demand scale of the MBCB (P = 0.97). Bekelman 2018 reported a mean (SE) caregiver burden of 12.9 (1.3) in the HSPC group and 14.8 (1.4) in the control group at 12 months (P = 0.30).
Two studies (N = 108 participants) reported unadjusted endpoint data but we could not pool them in a meta‐analysis (Bajwah 2015; Dionne‐Odom 2015a (linked to Bakitas 2015)). Dionne‐Odom 2015a reported the following results: on the objective burden scale of the MBCB, the mean caregiver burden scores for the HSPC group was 0.3 points higher (range 6 to 30; 30 indicates worst) than that of the control group (P = 0.62). On the stress burden scale of the MBCB, the mean caregiver burden scores for the HSPC group was 0.6 points lower (range, 4 to 20; 20 indicates worst) than that of the control group. There was no difference between HSPC and control group in the mean caregiver burden score on the demand scale of the MBCB (P = 0.99). Bajwah 2015 assessed unpaid caregiver burden using the ZBI (range, 0 to 88; 88 indicates highest burden), and reported a mean (SD) unpaid caregiver burden of 22.3 (15.3) in the fast‐track group and 31.7 (17.3) for the control group at four weeks. After the control group was offered HSPC between four weeks and eight weeks, mean (SD) unpaid caregiver burden reduced to 25.4 (13.4).
We carried out sensitivity analysis with the three studies that reported adjusted change values and found evidence in favour of HSPC (MD = ‐3.88, 95% CI ‐5.95 to ‐1.80; I2 = 0%; N = 128 participants; Analysis 11.1). All three studies assessed unpaid caregiver burden using the ZBI.
Bajwah 2015 (N = 39 participants) was the only study that presented unadjusted change values. Bajwah 2015 reported a 0.1 mean increase in unpaid caregiver burden score from baseline to four weeks for 16 intervention unpaid caregivers while for 23 unpaid caregivers in the control group, unpaid caregiver burden decreased by a 0.1 point. The effect size (95% CI) at four weeks was ‐0.6 (‐1.2 to 0.1).
Bakitas 2009 reported on unpaid caregiver burden but did not present usable data for the meta‐analysis. The remaining 36 studies did not report on unpaid caregiver burden.
We did not carry out any further analysis on unpaid caregiver burden due to limited number of studies.
Quality of the evidence
Within the Grade approach, we downgraded the quality of the evidence for unpaid caregiver burden to very low due to a high risk of bias across studies (‐2 levels as a result of very serious study limitations: high risk of bias for performance and reporting bias and imprecision: ‐1 level due to small number of participants).
Unpaid caregiver pre‐ and post‐bereavement outcomes
Unpaid caregiver grief
Only Dionne‐Odom 2016 (linked to Bakitas 2015) with 44 participants provided usable data for unpaid caregiver grief. Dionne‐Odom 2016 assessed unpaid caregiver grief using the Prigerson Inventory of Complicated Grief ‐ Short Form (PG 13) and reported a non‐signifacnt difference in the mean unpaid caregiver grief score in the HSPC group that was 2.2 points lower (range, 11 to 55; 55 indicates highest grief) than that of the control group (P = 0.21). There was no evidence of a difference on adjusting for religious preference (P = 0.40), baseline depression levels (P = 0.51) and patient hospice use (P = 0.51).
Quality of the evidence
We downgraded the quality of the evidence on unpaid caregiver grief to low due to a high risk of bias (‐1 level as a result of serious study limitations: high risk of performance bias and imprecision: ‐1 level due to small number of participants).
Unpaid caregiver quality of life
Only Dionne‐Odom 2015a (linked to Bakitas 2015) with 69 participants reported adjusted endpoint data on unpaid caregiver quality of life with no evidence of benefit of HSPC over usual care. Dionne‐Odom 2015a assessed unpaid caregiver quality of life using the unpaid caregiver Quality of Life (CQOL) Index (range, 0 to 140; 140 indicates worse CQOL), and found a non‐significant improvement in the mean unpaid caregiver quality of life score in the HSPC group that was two points better than that of the control group at three months with adjustment for patient death (P = 0.39). In decedents' unpaid caregivers, a terminal decline analysis indicated a mean difference of ‐4.9 points between HSPC group and control (P = 0.07).
Sensitivity analysis in two studies (N = 105 participants) that reported unadjusted endpoint values showed a pooled effect in favour of HSPC (MD = 6.11, 95% CI 0.42 to 11.81; I2 = 0%; Analysis 10.1). A positive MD indicates better unpaid caregiver quality of life and a negative MD reflects lower unpaid caregiver quality of life. The two studies assessed unpaid caregiver quality of life using the unpaid caregiver Quality of Life (CQOL) Index (range, 0 to 140; 140 indicates worse CQOL).
In addition, Bajwah 2015 with 36 participants also presented unadjusted change values and assessed unpaid caregiver quality of life using the CQOL index. Bajwah 2015 found a non‐significant 2.5 point mean improvement (range, 0 to 140; 140 indicates worse CQOL) in unpaid caregiver quality of life from baseline at four weeks for the HSPC group while for controls, unpaid caregiver quality of life improved by 0.7 points. The effect size (95% CI) at four weeks was ‐0.4 (‐1.1 to 0.2). At eight weeks, the mean (SD) score for the HSPC group was 58.3 (15.6), while that for the control group was 60.2 (23.9).
The remaining 39 studies did not report on unpaid caregiver quality of life.
We could not perform any further analysis due to the limited number of studies.
Quality of the evidence
Within the Grade approach, we downgraded the quality of the evidence for unpaid caregiver quality of life to low due to a high risk of bias (‐1 level as a result of serious study limitations: high risk of bias for performance bias and imprecision: ‐1 level due to small number of participants).
Resource use
It was not possible to combine data for resource use or costs due to differences in measurement and reporting, such as type of analysis, tools used, assessment time points or time horizon and statistics reported. Consequently, we provided a narrative synthesis on the economic studies.
Thirty‐one studies compared resource use or costs or both between the treatment groups in different ways. Three studies collected information on resource use and/or costs by chart review (Ahronheim 2000; Kane 1984; Bakitas 2009), while four studies collected resource use data from patients using either the Client Services Receipt Inventory (CSRI) or a modified form of it (Farquhar 2014; Farquhar 2016; Higginson 2009; Higginson 2014). Eight studies used medical/health records (Grudzen 2016; Ma 2019; Rogers 2017; Sidebottom 2015; Tattersall 2014; Temel 2010; O'Riordan 2019; Vanbutsele 2018). Four studies used a combination of methods (Bekelman 2018; Bakitas 2015; Janssens 2019; Rodin 2019). Bekelman 2018 collected data from medical records and supplemented these with patient or family self‐report, while Janssens 2019 collected data from medical records as well as contact with patients and their GPs. Rodin 2019 collected data from patients and their medical charts. Bakitas 2015 used patient self‐report for hospital and intensive care unit days and emergency department visits, while decedents' data for the period between the last patient‐reported assessment and death, and chemotherapy use in last 14 days were obtained from medical records. In Ozcelik 2014, a patient expenditure record form was created to capture resources and their costs. Brumley 2007 obtained resource use for each patient retrospectively from the non‐profit HMO mainframe database, while Gade 2008 used standard data extract protocols to extract information from the managed care organisation’s (MCO) database. Methods for collecting resource use information were unclear in nine RCTs (Brannstrom 2014; Cheung 2010; Carson 2016; El‐Jawahri 2016; Groenvold 2017; McCaffrey 2013; Mendoza‐Galindo 2018 (abstract only); Temel 2017; Woo 2019).
We considered resource use in the following areas: institutional care services use, outpatient clinic services use, community care services use, unpaid caregiver's care, and medications and other resources.
Institutional care services use
Thirty studies compared the effect of HSPC and usual care on institutional care use. Eight studies assessed emergency department (ED) visits (Bakitas 2009; Bakitas 2015; Brumley 2007; Janssens 2019; Ma 2019; Mendoza‐Galindo 2018 (abstract only); Rogers 2017; Temel 2010), and their results were inconsistent (see Table 6 under Additional tables). Two of the studies reported fewer ED visits in favour of the HSPC group (Brumley 2007; Ma 2019). Brumley 2007 found that 20% of intervention group patients had ED visits compared to 33% of control group patients (P = 0.01). Linear regression adjusting for survival, age and severity of illness showed the intervention reduced ED visits by 0.35 visits (P = 0.02). Ma 2019 reported fewer post‐discharge ED visits in the HSPC group compared to the control group (1.3% versus 12.5%; P = 0.0067). Four of the remaining six studies described little to no difference between HSPC and control group (Bakitas 2009; Bakitas 2015; Janssens 2019; Mendoza‐Galindo 2018 (abstract only)). In particular, Janssens 2019 initially reported that patients in the HSPC group were twice as likely to be admitted to the emergency ward for respiratory failure compared to the control group (incidence rate ratio (95% CI): 2.05 (1.11 to 3.94); P = 0.014). However, after correction for multiple testing, there was no longer any evidence of a difference. Two studies reported fewer ED visits in the HSPC group compared to the control group but did not present their P values (Rogers 2017; Temel 2010).
| Study | Time horizon | Significance and direction | Details |
|---|---|---|---|
| During study period | Wilcoxon rank sum test P = 0.53 | Intervention: 0.86 visits Control: 0.63 visits Note: not clear if the figures were means or medians | |
| Total use covering period before and after enrollment | Poisson generalised linear model P = 0.32 for baseline (total sample of 207) P = 0.21 for total use in 109 decedents | Intervention for baseline sample (days, 95% CI): 0.16 (0.1 to 0.25) Control for baseline sample: 0.21 (0.15 to 0.31 Intervention (total use in 50 decedents): 0.14 (0.09 to 0.2) Control (total use in 59 decedents): 0.19 (0.14 to 0.26) | |
| During study period | Reduced ED use in intervention group Cramer’s V 0.15; P = 0.01 linear regression adjusted for survival, age and severity of illness showed intervention reduced ED visits by 0.35 (P = 0.02) | Intervention: 20% had ED visits Control: 33% had ED visits | |
| Admissions to the emergency ward in the year before study enrollment | There was no difference in admissions to the emergency ward in the intervention group compared to the control group (Incidence rate ratio 1.27, 95% CI: 0.72 to 2.26, P = 0.384). | Number of admissions to emergency ward Intervention: 33 Control: 23 | |
| During study period | Admission to the emergency ward was twice as often in the intervention group compared to the control group (incidence rate ratio 2.05, 95% CI: 1.11 to 3.94, P = 0.014). However, after the Benjamini and Hochberg correction for multiple testing, this difference was not significant. | Number of admissions to emergency ward Intervention: 37 Control: 16 | |
| During study period and post‐discharge | Patients in the intervention group had fewer ED visits compared to usual care (P = 0.0067) | % of ED visits: Intervention: 1.3% Control: 12.5% P: 0.0067 | |
| Unclear | P = 0.074 | Intervention: 39 Control: 50 | |
| During study period | P value not stated | Frequency of interactions occurring between patients and providers Emergency department/urgent care: Intervention, mean (SD): 0.4 (0.12) Control, mean (SD): 0.5 (0.11) | |
| During study period | P value not stated | Any emergency department visit from enrollment to death: Intervention: 53.1% Control: 57.1% | |
| P value not stated | Any emergency department visit within 30 days of death: Intervention: 22.4% Control: 30.4% |
CI: confidence intervals
ED:
SD: standard deviation
Nine studies assessed ICU use (see Table 7 under Additional tables). Six studies of these studies assessed ICU days (Bakitas 2009; Bakitas 2015; Carson 2016; Cheung 2010; Kane 1984; Ma 2019), and three assessed number of ICU admissions (Gade 2008; Grudzen 2016; Janssens 2019). Five of the six studies assessing ICU days found no difference between HSPC and control group (Bakitas 2009; Bakitas 2015; Carson 2016; Cheung 2010; Ma 2019). Kane 1984 reported slightly shorter mean number of ICU days per patient in the HSPC group compared to the control group (0.2 versus 0.3) but did not report P values. Gade 2008, Grudzen 2016 and Janssens 2019 reported contrasting results regarding ICU admission. Janssens 2019 compared number of ICU admissions for respiratory failure between HSPC and control groups in the year before study inclusion (7 versus 7; incidence rate ratio 0.88, 95% CI: 0.26 to 2.96; P = 0.82) and also during the study (5 versus 1; incidence rate ratio 4.42, 95% CI: 0.49 to 20.92; P = 0.16), but did not find any evidence of a difference. On the other hand, Gade 2008 found evidence in favour of HSPC in reduction in ICU admissions. The median number of ICU admissions in the HSPC group was 12 while in the control group it was 21 (P = 0.04). Grudzen 2016 reported that no difference between the treatment arms in the number of ICU admissions during the index‐admission (P > 0.99) and also at 180 days (P > 0.99).
| Study | Time horizon | Significance and direction | Details |
|---|---|---|---|
| During study period | Wilcoxon rank sum test P > 0.99 | Intervention: 0.06 days Control: 0.06 days Note: not clear if the figures were means or medians | |
| Total use covering period before and after enrollment | Poisson generalised linear model P = 0.10 for baseline (total sample of 207) P = 0.49 for total use in 109 decedents | Intervention for baseline sample (days, 95% CI): 0.52 (0.28 to 0.95) Control for baseline sample: 0.22 (0.1 to 0.5) Intervention (total use in 50 decedents): 0.1 (0.04 to 0.24) Control (total use in 59 decedents): 0.15 (0.07 to 0.3) | |
| Interviewed surrogate decision‐makers immediately after the second support and information team meeting for the intervention group and 10 days after randomisation for the control group, unless the patient had died. All surrogate decision‐makers were interviewed again by telephone for follow‐up beginning 90 days after randomisation. | Differences between groups for other patient outcomes were analysed based on t tests, nonparametric tests, χ2 tests (including the Fisher exact test), or log‐rank tests as appropriate. For total ICU days, P = 0.51 P value for after randomisation, P = 0.72 | ICU days Total: Intervention, median (IQR): 19 (15 to 26) Control, median (IQR): 20 (15 to 30) After randomisation: Intervention, median (IQR): 9 (6 to 15) Control, median (IQR): 10 (5 to 17) | |
| Enrollment to ICU discharge | Fisher’s exact test and the Mann‐Whitney test P = 0.97 | Intervention: median (IQR) ICU length of stay: 3 (7) days Control: median (IQR) ICU length of stay: 5 (8) days | |
| During study period | Index‐admission Fisher exact test P > 0.99 Up to 180 days Fisher exact test P > 0.99 | Hospital days at 180 days Index‐admission: Since only 1 participant had more than 1 ICU admission, the authors treated the ICU admission as a binary outcome. During the index‐admission, there was no difference between the 2 groups. (Fisher exact test P > 0.99) Up to 180 days: There was no difference between the 2 groups (Fisher exact test, P > 0.99). | |
| 6 months post‐index hospitalisation | P = 0.04 Continuous measures for intervention and usual care patients were compared using t tests for normally distributed measures and Wilcoxon two‐sample tests for measures with skewed distributions. | ICU admissions, median n: Intervention: 12 Control: 21 | |
| Admissions to ICU for respiratory failure in the year before study enrollment | There was no difference in ICU admissions for respiratory failure in the intervention group compared to the control group (Incidence rate ratio 0.88, 95% CI: 0.26 to 2.96, P = 0.82). | Number of ICU admissions for respiratory failure in the year before inclusion: Intervention: 7 Control: 7 | |
| During study period | There was no difference in ICU admissions for respiratory failure in the intervention group compared to the control group (Incidence rate ratio 4.42, 95% CI: 0.49 to 20.92, P = 0.16). | Number of ICU admissions for respiratory failure during the study period: Intervention: 5 Control: 1 | |
| During study period | P value not stated | Mean number of ICU days per patient: Intervention, mean per patient: 0.2 Control, mean per patient: 0.3 | |
| During study period | No difference in ICU duration between intervention and control group (P = 0.38) | ICU duration in days, median (IQR): Intervention: 5 (3 ‐ 8) Control: 5.5 (3 ‐ 10) P: 0.38 |
CI: confidence intervals
ICU:
IQR: interquartile range
Carson 2016 and Ma 2019 provided details on resource use in the ICU and their findings were varied (see Table 8 under Additional tables). Carson 2016 found no difference in use of the following resources between HSPC and control group in the ICU: dialysis (median (IQR): 13 (10) versus 15 (12); P = 0.64), mechanical ventilation (median (IQR): 40 (31) versus 33 (26); P = 0.41), nutrition (median (IQR): 18 (14) versus 21 (17); P = 0.60) and vasopressors (median (IQR): 18 (14) versus 19 (15); P = 0.86). Ma 2019 reported lower use of tracheostomy (1% versus 7.8%; P = 0.035) and fewer median (IQR) number of days on mechanical ventilation (4 (3 to 7) versus 6 (3 to 13); P = 0.042) in the ICU in the HSPC group compared to the control group.
| Study | Time horizon | Significance and direction | Details |
|---|---|---|---|
| Interviewed surrogate decision‐makers immediately after the second support and information team meeting for the intervention group and 10 days after randomisation for the control group, unless the patient had died. All surrogate decision‐makers were interviewed again by telephone for follow‐up beginning 90 days after randomisation. | Differences between groups for other patient outcomes were analysed based on t tests, nonparametric tests, χ2 tests (including the Fisher exact test), or log‐rank tests as appropriate. Mechanical ventilation, P = 0.41 Dialysis, P = 0.64 Nutrition, P = 0.60 Vasopressors, P = 0.86 | Limitations of ICU treatment Mechanical ventilation: Intervention, median (IQR): 40 (31) Control, median (IQR): 33 (26) Dialysis: Intervention, median (IQR): 13 (10) Control, median (IQR): 15 (12) Nutrition: Intervention, median (IQR): 18 (14) Control, median (IQR): 21 (17) Vasopressors: Intervention, median (IQR): 18 (14) Control, median (IQR): 19 (15) | |
| During study period | The following were lower in the intervention group compared to the control group: tracheostomy (P = 0.035) and days on mechanical ventilation (P = 0.042). | % of patients using mechanical ventilation: Intervention: 53.6% Control: 56.9% P: 0.64 Haemodialysis: Intervention: 15.5% Control: 23.5% P: 0.15 Vasopressors: Intervention: 48.5% Control: 50% P: 0.83 Tracheostomy: Intervention: 1% Control: 7.8% P: 0.035 Cardiopulmonary resuscitation: Intervention: 5.2% Control: 6.9% P: 0.61 Number of days on mechanical ventilation, median (IQR): Intervention: 4 (3 ‐ 7) Control: 6 (3 ‐ 13) P: 0.042 Number of days on vasopressors, median (IQR): Intervention: 3 (1 ‐ 6) Control: 3 (2 ‐ 6) P: 0.91 |
ICU:
IQR: Interquartile Range
Kane 1984 further reported reduced mean number of nursing home days per patient in favour of the HSPC group (HSPC 1 and control 11.4, P < 0.05).
Twelve studies provided mixed results on hospital admissions (Ahronheim 2000; Bekelman 2018; Brannstrom 2014; Brumley 2007; Farquhar 2014; Farquhar 2016; Janssens 2019; Ma 2019; Mendoza‐Galindo 2018 (abstract only); Rogers 2017; Sidebottom 2015; Temel 2010) (see Table 9 under Additional tables). Four studies found no difference in the number of hospital admissions between HSPC and the control group (Ahronheim 2000; Bekelman 2018; Ma 2019; Sidebottom 2015). Ma 2019 initially described fewer hospital readmissions in the intervention group compared to the control group (17.3% versus 33.3%; P = 0.024). Hospital admission for respiratory failure during the study was almost twice as often in the HSPC group compared to the control group (Incidence rate ratio 1.87, 95% CI: 1.04 to 3.48, P = 0.026). However, after the Benjamini and Hochberg correction for multiple testing, there was no longer any evidence of a difference in the number of hospital admissions during the study period. Sidebottom 2015 reported no association between study group assignment and 30‐day inpatient readmission (adjusting for age, gender, and marital status) (P = 0.50). Janssens 2019 described a non‐significant increase in hospital admissions for respiratory failure in the HSPC group compared to the control group in the year before the study (24 versus 18; P = 0.60) and also during the study period (38 versus 18; P = 0.026). Two studies found fewer hospital admissions in favour of the HSPC group (Brannstrom 2014; Brumley 2007). Brannstrom 2014 found fewer mean (SD) number of hospitalisations in the HSPC group compared to the control group (0.42 (0.60) versus 1.47 (1.81); P = 0.009). Brumley 2007 found fewer hospital admissions in the intervention group compared to the control group (36% versus 59%, P < 0.001). Three studies further reported fewer hospital admissions in the HSPC group but they did not present their P values (Farquhar 2014; Mendoza‐Galindo 2018 (abstract only); Temel 2010). Farquhar 2014 reported 7% inpatient admissions in the HSPC group compared to 12% in the control group, while Mendoza‐Galindo 2018 (abstract only) found that 48% of patients in HSPC group had hospital admissions compared to 51% in the control group. Temel 2010 described fewer hospital admissions in the HSPC group compared to the control group from enrollment to death (73.5% versus 76.8%) and also within 30 days of death (36.7% versus 53.6%). By contrast, Farquhar 2016 reported more inpatient admissions in the HSPC group compared to the control group (15% versus 11%), but did not report the P value. In Rogers 2017, there was more hospitalisation for heart failure during the study in the HSPC group (30.7% versus 29.3%; P value was not reported), more hospitalisation for non‐heart failure cardiovascular conditions (16% versus 13%; P value was not reported) and fewer hospitalisations for non‐cardiovascular conditions (10.7% versus 24%; P value was not reported).
| Study | Time horizon | Significance and direction | Details |
|---|---|---|---|
| During study period | P = 0.92 | Mean number of total admissions Intervention: 1.94 Control: 1.90 | |
| During study period | P = 0.61 | Number of hospitalisations Intervention: 18 patients had 1 hospitalisation 9 patients had 2 or more hospitalisations Control: 30 patients had 1 hospitalisation 6 patients had 2 or more hospitalisations | |
| During study period | P = 0.009 | Number of hospitalisations, mean (SD) Intervention: 0.42 ± 0.60 Control: 1.47 ± 1.81 Total number of hospitalisations: Intervention: 15 Control: 53 | |
| During study period | Reduced hospitalisation in intervention group Cramer’s V 0.23; P < 0.001 | Intervention: 36% were admitted Control: 59% were admitted | |
| During study period | P value not stated | Inpatient: Intervention, n (%), mean (SD) contacts: 2 (7%), 3.0 (2.8) Control, n (%), mean (SD) contacts: 3 (12%), 6.3 (6.8) | |
| During study period | P value not stated | Inpatient: Intervention, n (%), mean (SD) contacts: 6 (15%), 11.5 (8.3) Control, n (%), mean (SD) contacts: 4 (11%), 6.0 (3.4) | |
| Hospital admissions for respiratory failure in the year before study enrollment | There was no difference in hospital admissions for respiratory failure in the intervention group compared to the control group (incidence rate ratio 1.18, 95% CI: 0.61 to 2.31, P = 0.60). | Number of hospital admissions for respiratory failure in the year before inclusion: Intervention: 24 Control: 18 | |
| During study period | Hospital admission for respiratory failure was almost twice as often in the intervention group compared to the control group (incidence rate ratio 1.87, 95% CI: 1.04 to 3.48, P = 0.026). However, after the Benjamini and Hochberg correction for multiple testing, this difference was not significant. | Number of hospital admissions for respiratory failure during study period: Intervention: 38 Control: 18 | |
| Hospital admissions for respiratory failure in the year before study enrollment | There was no difference in hospital admissions for respiratory failure in the intervention group compared to the control group (incidence rate ratio 1.18, 95% CI: 0.36 to 4.12, P = 0.77). | Other hospitalisations in the year before inclusion: Intervention: 8 Control: 6 | |
| During study period | There was no difference in hospital admissions for respiratory failure in the intervention group compared to the control group (incidence rate ratio 1.01, 95% CI: 0.32 to 3.28, P = 0.99). | Other hospitalisations during study period: Intervention: 8 Control: 7 | |
| During study period and post‐discharge | Patients in the intervention group had fewer hospital readmissions compared to usual care (P = 0.024) | % of hospital readmissions: Intervention: 17.3% Control: 33.3% P: 0.024 | |
| Unclear | There was no difference in number of hospitalisations. P value not given | Intervention: 48% Control: 51% | |
| During study period | During the 6‐month follow‐up, 30% of patients were hospitalised for HF. No differences were seen between the 2 treatment groups in this clinical endpoints through the 6‐month follow‐up point. For hospitalisation for non‐heart failure/cardiovascular and hospitalisation for non‐cardiovascular, P value was not stated | Hospitalisation for HF: Intervention: 30.7% Control: 29.3% Hospitalisation for non‐heart failure/cardiovascular: Intervention: 16% Control: 13% Hospitalisation for non‐cardiovascular: Intervention: 10.7% Control: 24% | |
| Inpatient readmission for any cause within 30 days | Survival analysis using proportional hazards regression P = 0.50 | There was no association between study group assignment and 30‐day inpatient readmission (adjusting for age, gender, and marital status). | |
| During study period | P value not stated | Any admission from enrollment to death: Intervention: 73.5% Control: 76.8% | |
| P value not stated | Any admission within 30 days of death: Intervention: 36.7% Control: 53.6% |
CI:
HF:
n: number
SD: standard deviation
Length of hospital admission was assessed in 17 studies (Ahronheim 2000; Bakitas 2009; Bakitas 2015; Brannstrom 2014; Brumley 2007; Carson 2016; Cheung 2010; El‐Jawahri 2016; Gade 2008; Grudzen 2016; Higginson 2009; Higginson 2014; Kane 1984; Ma 2019; Mendoza‐Galindo 2018 (abstract only); Ozcelik 2014; Temel 2010) (see Table 10 under Additional tables). Nine studies found no difference in length of admission between HSPC and the control group (Ahronheim 2000; Bakitas 2009; Carson 2016; Cheung 2010; Gade 2008; Grudzen 2016; Ma 2019; Mendoza‐Galindo 2018 (abstract only); Ozcelik 2014). Bakitas 2015 described fewer hospitalisation days in the HSPC group (0.69 (95% CI 0.4 to 1.18) versus 1.39 (95% CI 0.97 to 1.97); P = 0.03) but not in decedents in the HSPC group (0.95 (95% CI 0.61 to 1.46) versus 1.3 (95% CI 0.91 to 1.86); P = 0.26). Brannstrom 2014 reported that the mean (SD) number of days spent in hospital was lower in the HSPC group compared to the control group (2.9 (8.3) versus 8.5 (12.4), P = 0.011). The number of days spent in the Department of Medicine‐Geriatrics (100, range 1 ‐ 45 versus 242, range 2 ‐ 46) and Surgery (0 versus 56) were also lower in the HSPC group, but not in other departments (3, range 1 ‐ 2 versus 7 range 1 ‐ 6). Brumley 2007 reported fewer hospital days in the HSPC group. Linear regression adjusted for survival, age and severity of illness showed that the intervention reduced hospital days by 4.36 (P < 0.001). Kane 1984 reported on total inpatient days as well as general medicine, hospice, intensive care unit and intermediate care inpatient days. The mean number of total inpatient days per patient did not differ between HSPC and control group (51 versus 47.5). However, Kane 1984 found fewer mean days of general medical inpatient care (HSPC 13.2 and control 20.7, P < 0.05) and intermediate inpatient care per patient (HSPC 8.3 and control 26.5, P < 0.05). Four studies described fewer hospital days in the HSPC group compared to the control group but did not report their P values (El‐Jawahri 2016; Higginson 2009; Higginson 2014; Temel 2010). El‐Jawahri 2016 reported the median duration of hospitalisation in the HSPC group to be 20 (range: 12 to 102 days) and that in the control group to be 21 (13 to 40). Institutional days (hospital admission) was reported to be increased in the control group by Higginson 2009. Higginson 2014 reported mean hospital days of 4.5 (6.8) in the HSPC group and 4.6 (7.6) in the control group, while Temel 2010 reported the number of inpatient days from enrollment to death to be 5 (range: 0 to 50) in the HSPC group and 7 (range: 0 to 45) in the control group.
| Study | Time horizon | Significance and direction | Details |
|---|---|---|---|
| During study period | Student’s t‐test was used P = 0.46 | Intervention (mean (range)): 8.8 (1 ‐ 93) Control (mean (range)): 9.7 (1 ‐ 63) | |
| During the study | Wilcoxon rank sum test P = 0.14 | Number of hospital days (unclear if mean or median reported) Intervention: 6.6 days Control: 6.5 days | |
| Total use covering period before and after enrollment | Poisson generalised linear model P = 0.03 for baseline (total sample of 207) P = 0.26 for total use in 109 decedents | Intervention for baseline sample (days, 95% CI): 0.69 (0.4 to 1.18) Control for baseline sample: 1.39 (0.97 to 1.97) Intervention (total use in 50 decedents): 0.95 (0.61 to 1.46) Control (total use in 59 decedents): 1.3 (0.91 to 1.86) | |
| During the study period | P value for total hospital days = 0.011. The number of days spent in hospital was also significantly lower in the intervention group at the Departments of Medicine‐Geriatrics (100, range 1–45 vs. 242, range 2–46 days) and Surgery (0 vs. 56, range 2–21 days). Days in other departments did not differ significantly. | Total hospital days, mean (SD) Intervention: 2.9 (8.3) Control: 8.5 (12.4) Days in Department of Medicine‐Geriatrics: Intervention: 100 (range 1 ‐ 45) Control: 242 (range 2 ‐ 46) Days in Department of Surgery: Intervention: 0 Control: 56 Days in other departments: Intervention: 3 (range 1 ‐ 2) Control: 7 (1 ‐ 6) | |
| During the study | Fewer hospital days in intervention group. Linear regression adjusted for survival, age and severity of illness showed intervention reduced hospital days by 4.36 (P < 0.001) | No descriptive data provided | |
| Interviewed surrogate decision‐makers immediately after the second support and information team meeting for the intervention group and 10 days after randomisation for the control group, unless the patient had died. All surrogate decision‐makers were interviewed again by telephone for follow‐up beginning 90 days after randomisation. | Differences in the number of hospital days were analysed using nonparametric methods. P value for total hospital days, P = 0.78 P value for deceased patients, P = 0.60 P value for after randomisation, P = 0.51 | Hospital days Total hospital days: Intervention, median (IQR): 35 (23 to 52) Control, median (IQR): 36 (23 to 54) For deceased patients: Intervention (49 deaths), median (IQR): 25 (18 to 36) Control (51 deaths), median (IQR): 24 (14 to 39) After randomisation: Intervention, median (IQR): 19 (12 to 37) Control, median (IQR): 23 (12 to 39) | |
| During study period | Fisher’s exact test and the Mann‐Whitney test P = 0.44 | Intervention: median (IQR) hospital length of stay: 5 (8) days Control: median (IQR) hospital length of stay: 11 (27) days | |
| During study period | P value not stated | Duration of HCT hospitalisation, median (range): Intervention: 20 (12 – 102) days Control: 21 (13 – 40) days | |
| 6 months post‐index hospitalisation | P value for admission to study enrollment (days), P = 0.36 P value for study enrollment to discharge or death in the hospital (days), P = 0.10 P‐value for index hospital length of stay (days), P = 0.57 Continuous measures for intervention and usual care patients were compared using t tests for normally distributed measures and Wilcoxon two‐sample tests for measures with skewed distributions. | Admission to study enrollment (days), median (IQR): Intervention: 3 (2, 7) Control: 4 (2, 7) Study enrollment to discharge or death in the hospital (days), median (IQR): Intervention: 3 (1, 6) Control: 2 (1, 5) Index hospital length of stay (days), median (IQR): Intervention: 7 (4, 12) Control: 7 (4, 12) | |
| During study period | Index‐admission Wilcoxon test P = 0.67 Up to 180 days Wilcoxon test P = 0.14 | Hospital days at 180 days Index‐admission: The authors found no difference in hospital days between the intervention and usual care groups during the index‐admission (Wilcoxon test P = 0.67). Up to 180 days: The intervention group had slightly more hospital days at 180 days than the usual care group (Wilcoxon test P = 0.14). | |
| 12 weeks following enrollment | Authors stated increased institutional days in control group but P value was not stated. “The control care patients were more likely to be (...) admitted to or seen in hospital”. | Intervention: 4/26 (17%) were institutionalised for mean 19.0 days (SD 21.6) Control: 6/28 (29%) were institutionalised for mean 30.7 days (SD 32.1) | |
| Three months before baseline interview | P value not stated | Hospital inpatient days Intervention, mean (SD): 4.5 (6.8) Control, mean (SD): 4.6 (7.6) | |
| During study period | P value for general medical inpatient days, P < 0.05 P value for intermediate care inpatient days P < 0.05 | Total inpatient days: Intervention, mean per patient: 51 Control, mean per patient: 47.5 General medical: Intervention, mean per patient: 13.2 Control, mean per patient: 20.7 Intermediate care: Intervention, mean per patient: 8.3 Control, mean per patient: 26.5 | |
| During study period | No difference in hospital duration between intervention and control group (P = 0.43) | Hospital duration in days, median (IQR) Intervention: 10 (6 ‐ 15) Control: 11 (6 ‐ 19) P: 0.43 | |
| Unclear | P = 0.808 | Intervention: 78 days Control: 90 days | |
| During study period | P = 0.07 | Intervention, mean (SD): 9.4 (6.27) days Control, mean (SD): 13.9 (11.5) days | |
| During study period | P value not stated | Median inpatient days (range) from enrollment to death: Intervention: 5 (0 – 50) Control: 7 (0 – 45) |
IQR: interquartile range
SD: standard deviation
Palliative care visits during hospitalisation was further compared between HSPC and usual care in two studies (El‐Jawahri 2016; Tattersall 2014) (see Table 11 under Additional tables). El‐Jawahri 2016 reported that HSPC patients had at least two palliative care visits during the first two weeks of their hospitalisation (median 4; range, 2‐7), while two control patients received a palliative care consultation (P values were not reported). Tattersall 2014 highlighted that 86% of patients in the HSPC group had palliative care contact during hospitalisation compared to 78% of control group patients (P = 0.37).
| Study | Time horizon | Significance and direction | Details |
|---|---|---|---|
| During study period | P value not stated | Palliative care visits, median (range): All intervention patients had at least 2 palliative care visits during the first 2 weeks of their hospitalisation (median number of visits, 4; range, 2‐7). Intervention participants had at least 4 palliative care visits during their entire hospitalisation (median number of visits, 8; range, 4‐40). Two control patients received a palliative care consultation. A total of 41.8% (146/349) of palliative care visits occurred while a family member was present. | |
| During study period | P = 0.37 | Palliative care contact during the last acute hospital admission: Intervention: 42 patients (86%) Control: 29 patients (78%) |
With the exception of days spent in nursing homes reported in one study to be in favour of HSPC, the overall evidence on institutional care use was inconsistent.
Outpatient clinic services use
Seven studies provided inconsistent evidence on the effect of HSPC compared to usual care on outpatient clinic visits (Brannstrom 2014; Higginson 2009; Groenvold 2017; Rogers 2017; Temel 2010; Temel 2017; Vanbutsele 2018) (see Table 12 under Additional tables). One of these studies reported fewer outpatient clinic visits in favour of HSPC (Brannstrom 2014). Brannstrom 2014 found fewer physician visits, nurse visits, phone calls and prescriptions in the HSPC group compared to the control group. Another study by Vanbutsele 2018 reported a difference in favour of the control group for number of consultations with a psychologist at 18 weeks (P = 0.02), but not at 24 weeks. Three studies described more contacts with palliative care teams in the HSPC group compared to the control group, but did not present P values (Groenvold 2017; Temel 2010; Temel 2017). Temel 2017 highlighted more palliative care visits in the HSPC group compared to the control group (mean (range): 6.54 (0 to 14) versus 0.89 (0 to 7)). Temel 2010 reported that all the patients assigned to HSPC, except for one patient who died shortly after enrollment, had at least one visit with the palliative care service by the 12th week. The average number of visits in the palliative care group was 4 (range, 0 to 8). Ten patients who received usual care (14%) had a palliative care consultation in the first 12 weeks of the study, with seven patients having one visit and three having two visits. In Groenvold 2017, 138 patients had at least one face‐to‐face contact with the HSPC team compared to 13 patients in the control group. Groenvold 2017 further reported no difference in mean (SD) number of specialists visits between HSPC and control group (4.9 (8.1) versus 7.0 (9.1); P = 0.25).
| Study | Time horizon | Significance and direction | Details |
|---|---|---|---|
| During study period | P value for physician visit, P = 0.000 P value for physician, phone calls and prescriptions, P = 0.012 P value for nurse visits, P = 0.003 P value for nurse visits, phone calls and prescriptions P = 0.003 | Hospital outpatient clinic Physician visit, n, median (range): Intervention: 27, 1 (4 – 30) Control: 133, 3 (2 ‐11) Physician, phone calls and prescriptions, n, median (range): Intervention: 42, 3 (0 – 8) Control: 86, 3 (0 ‐10) Nurse visits, n, median (range): Intervention: 4, 1 (0 – 4) Control: 60, 2 (0 ‐27) Nurse, phone calls and prescriptions, n, median (range): Intervention: 8, 1 (0 – 4) Control: 44, 2 (0 ‐ 8) | |
| During study period | P values not stated | Contact with the HSPC team, (numbers): Intervention: 138 patients had at least one face‐to‐face contact Control: 13 patients had at least one face‐to‐face contact | |
| 12 weeks following enrollment | Hospital specialist visits differences and P value not stated | Hospital specialist visits: Intervention: 8 patients (35%) received; mean 1.0 contacts (SD 0.0) Control: 16 patients (76%) received; mean 1.3 contacts (SD 0.7) | |
| During study period | P value not stated | Frequency of interactions occurring between patients and providers Total number of clinic encounter records: Intervention, mean (SD): 21.9 (1.99) Control, mean (SD): 20.8 (1.92) Cardiology: Intervention, mean (SD): 2.3 (0.55) Control, mean (SD): 3.2 (1.0) Rehabilitation clinic: Intervention, mean (SD): 1.4 (0.68) Control, mean (SD): 0.9 (0.48) | |
| During study period | P values not stated | Contact with palliative care physician consultant: Intervention: 51 patients (85%) Control: 8 patients (13.3%) Contact with palliative care physician in the last month of life: Intervention: 16 patients (26.7%) Control: 6 patients (10%) | |
| During study period | P values not stated | PC visits: All the patients assigned to early palliative care, except for one patient who died within 2 weeks after enrollment, had at least one visit with the palliative care service by the 12th week. The average number of visits in the palliative care group was 4 (range, 0 to 8). Ten patients who received standard care (14%) had a palliative care consultation in the first 12 weeks of the study, primarily to address the management of symptoms, with seven patients having one visit and three having two visits. | |
| During study period | P value not stated | Mean number of palliative care visits: Intervention, mean (range): 6.54 (0 to 14) Control, mean (range): 0.89 (0 to 7) Number of palliative care visits split on lung and GI cancer: The authors stated that “we explored characteristics between patients with lung and GI cancer and found no differences in baseline measures or in the number of PC visits among those patients who received intervention. However, the GI cancer cohort had a higher proportion of male patients and a greater number of hospitalisations (P = 0.038) from baseline to week 24 compared with the lung cancer cohort". | |
| During study period | P value not stated for some of the comparisons. However, the authors reported a difference between intervention and control groups for number of consultations with a psychologist (P = 0.02) | Number of consultations from the palliative care team nurse at 18 weeks: Intervention, median (IQR): 3 (1 – 4). 82 patients (89%) had at least one consultation Control, median (IQR): 17 patients (18%) had at least one consultation PC physician at 18 weeks: Intervention: 25 patients (27%) Control: 1 patient (1%) Nurses at 24 weeks: Intervention, median (IQR): 3 (2 – 5). 55 patients (60%) had at least 3 consultations Control, median (IQR): 12 patients (13%) had at least 3 consultations PC physician at 24 weeks: Intervention: 32 patients (35%) had at least one consultation Control: 1 (1%) had one consultation Number of consultations with a psychologist: 18 weeks: Intervention: 34 patients (37%) had at least one consultation Control: 21 patients (22%) had at least one consultation 24 weeks: No difference was found between intervention and control groups. Number of consultations with other professionals: There were no differences between study groups in the number of consultations with a social care nurse (P = 0·87), dietician (P = 0·32), or specialist nurse (P = 0·28) between 18 weeks and baseline; or between 24 weeks and baseline with social care nurse (P = 0·07), dietician (P = 0·95), or specialist nurse (P = 0·99). | |
| During study period | Forwards from enrollment | Consultation with a psychiatrist: The proportions that consulted a psychiatrist (12% vs 12%) were similar in the intervention and control groups. |
HSPC: hospital‐based specialist palliative care
IQR: Interquartile range
PC: palliative care
SD: standard deviation
Higginson 2009 described fewer hospital specialist visits in the HSPC group (8 patients (35%)) compared to control group (16 patients (76%)), but P values were not reported. Rogers 2017 reported more mean (SD) total number of clinic encounters in the HSPC group compared to control group (21.9 (1.99) versus 20.8 (1.92)), but did not present P values. There were more visits to the rehabilitation clinic in the HSPC group compared to the control group (mean (SD): 1.4 (0.68) versus 0.9 (0.48)) and fewer cardiology visits in the HSPC group compared to control group (mean (SD): 2.3 (0.55) versus 3.2 (1.0)). Woo 2019 reported that similar proportions of patients in the HSPC group and control group consulted with a psychiatrist (12% versus 12%), but did not present P values. Tattersall 2014 reported more contacts with palliative care physicians in the HSPC group compared to the control group by the end of the study (51 patients (85%) versus 8 patients (13.3%)) and also in the last month of life (16 patients (26.7%) versus 6 patients (10%)). However, the P values were not reported.
Community care services use
Fourteen studies compared community care services use between the HSPC group and control group and their findings were inconsistent (Bakitas 2009; Bakitas 2015; Brannstrom 2014; Brumley 2007; Farquhar 2014; Farquhar 2016; Gade 2008; Grudzen 2016; Higginson 2009; Kane 1984; McCaffrey 2013; Rogers 2017; Sidebottom 2015; Temel 2010) (see Table 13 under Additional tables). The studies reported on a range of community services. Two UK studies by the same author found different results for mean number (SD) of GP contacts for cancer (Farquhar 2014), and non‐cancer populations (Farquhar 2016). Farquhar 2014 reported the mean number of GP contacts to be slightly higher in the control group (1.3 (0.5)) compared to the HSPC group (1.2 (0.6)) in cancer populations, while Farquhar 2016 found the mean number of GP contacts to be slightly higher in the HSPC group (1.8 (1.2)) compared to the control group (1.6 (0.7)) in non‐cancer populations. However, these studies did not provide their P values. Higginson 2009 described differences in contact with GPs, district/practice nurse, multiple sclerosis (MS) nurse and social services, but the P values of the results were not reported.
| Study | Time horizon | Significance and direction | Details |
|---|---|---|---|
| Total use covering period before and after enrollment | Poisson generalised linear model P = 0.62 | Hospice use: Intervention, rate 95% CI: 0.68 (0.55 to 0.84) Control, rate 95% CI: 0.63 (0.51 to 0.78) | |
| During study period | Primary Healthcare Centre: P‐value for physician, primary healthcare centre (PHC), P = 0.027 P value for physician, phone calls and prescriptions, P = 0.000 P‐value for nurse visits, PHC, P = 0.25 P value for nurse visits, phone calls and prescriptions P = 0.010 Home: P‐value for physician visits, home, P not stated P value for nurse visits, home, P = 0.032 Within the PREFER team there were 158 additional physician visits and 1031 nurse visits at the patient’s home, and 36 phone call and/or drug prescriptions by the physician and 225 phone calls and/or prescriptions by the nurses. Summarising all this, the most striking difference was found between nurse visits in the PREFER group and the usual care group (1075 vs. 230; P =0.000). On the other hand, phone calls and prescriptions by doctors were more common in the usual care group (108 vs. 231), while physician’s visits were somewhat similar (194 vs. 201). | Primary Healthcare Centre Physician, primary healthcare centre (PHC), n, median (range): Intervention: 9, 1 (0 – 3) Control: 54, 2 (0 ‐ 8) Physician, phone calls and prescriptions, n, median (range): Intervention: 30, 1 (0 – 5) Control: 145, 1 (1 ‐ 14) Nurse visits, PHC, n, median (range): Intervention: 29, 1 (0 – 12) Control: 61, 2 (0 ‐ 14) Nurse, phone calls and prescriptions, n, median (range): Intervention: 59, 3 (0 – 9) Control: 153, 4 (1 ‐ 21) Home: Physician visits, home, n, median (range): Intervention: 0, 0 (0 – 0) Control: 14, 2 (1 ‐ 5) Nurse visits, home, n, median (range): Intervention: 11, 2 (1 – 3) Control: 109, 5 (1 ‐ 23) | |
| During study period | Days in hospice care (1of 2 sites only) t 0.52 P = 0.60 | Days in hospice care (1 of 2 sites only): descriptive data not provided | |
| During study period | P values not stated | Breathlessness intervention service: Intervention, n (%), mean (SD) contacts: 27 (96%), 1.9 (2.0) Control, n (%), mean (SD) contacts: 2 (8%), 1.5 (0.7) | |
| P values not stated | GP: Intervention, n (%), mean (SD) contacts: 10 (36%), 1.2 (0.6) Control, n (%), mean (SD) contacts: 13 (50%), 1.3 (0.5) | ||
| During study period | P values not stated | Breathlessness intervention service: Intervention, n (%), mean (SD) contacts: 39 (95%), 2.1 (1.0) Control, n (%), mean (SD) contacts: 2 (5%), 1.5 (0.7) | |
| P values not stated | GP: Intervention, n (%), mean (SD) contacts: 25 (61%), 1.8 (1.2) Control, n (%), mean (SD) contacts: 24 (63%), 1.6 (0.7) | ||
| 6 months post‐index hospitalisation | P = 0.09 Continuous measures for intervention and control patients were compared using t tests for normally distributed measures and Wilcoxon two‐sample tests for measures with skewed distributions | Study enrollment to hospice admission (days), median (IQR): Intervention: 2 (0, 23) Control: 3 (0, 37) | |
| P = 0.04 Continuous measures for intervention and control patients were compared using t tests for normally distributed measures and Wilcoxon two‐sample tests for measures with skewed distributions. | Hospice length of stay (days), median (IQR) Intervention: 24 (7, 94) Control: 12 (4, 48) | ||
| P = 0.5 Categorical measures were tested using 2 tests or Fisher’s exact test. | Patients admitted to hospice, n (%): Intervention: 103 (37.1%) Control: 96 (40.7%) | ||
| During study period | Fisher’s exact test P = 0.85 Chi2 test P = 0.93 | Hospice use at 180 days: Intervention: 28% Control: 25% | |
| 12 weeks following enrollment | General practice: Authors stated less GP contact in intervention group but P values not stated District/practice nurse: P values not stated MS nurse: Authors stated there were no differences (P values not stated) Social services: P values not stated Specialist home visit: P values not stated | General practice: Intervention: 8 (35%) received; M 3.8 contacts (SD 0.5) Control: 11 (52%) received; M 3.4 contacts (SD 1.2) “Control care patients were more likely to be in contact with general practitioners” District/practice nurse: Intervention: 20 (87%) received; M 12.3 contacts (SD 19.7) Control: 13 (62%) received; M 31.9 contacts (SD 50.7) MS nurse: Intervention: 11 (48%) received; M 1.8 contacts (SD 1.8) Control: 7 (33%) received; M 1.1 contacts (SD 0.2) “Receipt of MS nurses was similar in the two groups”. Social services: Intervention: 10 (43%) received; M 6.4 contacts (SD 7.7) Control: 8 (38%) received; M 4.1 contacts (SD 2.4) Specialist home visit: Intervention: 5 (22%) received; M 5.2 contacts (SD 4.5) Control: 0 received Note: authors stated that specialist home visits were most likely to be from the intervention home palliative care team. | |
| During study period | P value not stated | Days at home: Intervention, mean per patient: 44.8 Control, mean per patient: 37.9 | |
| During study period | No difference as increment, mean (95% CI) = 1 (‐6.8, 8.6) | Days at home: Intervention, mean (95% CI): 13.1 (8.5, 17.7) Control, mean (95% CI): 12.1 (5.9, 18.4) | |
| During study period | P values not stated | Frequency of interactions occurring between patients and providers Primary care: Intervention, mean (SD): 4.4 (0.93) Control, mean (SD): 5.2 (0.82) | |
| Hospice use within 6 months of study hospitalisation | Survival analysis using proportional hazards regression P = 0.36 | There was no significant association between study group assignment and hospice use within 6 months (adjusting for age, gender, and marital status). | |
| During study period | P = 0.09 | Median duration of hospice care: Intervention: 11 days Control: 4 days |
CI:
GP: General Practitioner
M: mean
MS: Multiple Sclerosis
n: number
PHC:
PREFER:
SD: standard deviation
A study set in the USA by Gade 2008 found longer median length of stay in hospice favouring the HSPC group (24 days) compared to the control group (12 days) (P = 0.04), while two USA studies found no‐between group differences (Brumley 2007; Temel 2010). Grudzen 2016 and Bakitas 2015 reported no between‐group differences in hospice use at 180 days. Sidebottom 2015 found no evidence of an association between group assignment and hospice use within six months adjusting for age, gender and marital status in USA. Ma 2019 highlighted more transfers to hospice care in the HSPC group compared to usual care (18.6% versus 4.9%; P = 0.0026).
Brannstrom 2014 further reported more nurse visits in the HSPC group compared to the control group (1075 versus 230, P = 0.000) in Sweden. By contrast, this study found that phone calls and prescriptions by doctors were more common in the control group (108 versus 231) while physician visits were similar (194 versus 201).
Kane 1984 and McCaffrey 2013 both reported more days spent at home in the HSPC group compared to the control group, but did not present P values. Kane 1984 reported a mean of 44.8 days at home per patient while that in the control group was 37.9 days at home per patient. In McCaffrey 2013, the HSPC group spent a mean of 13.1 days (95% CI 8.5 to 17.7) at home compared to 12.1 days (95% CI 5.9 to 18.4) in the control group.
Rogers 2017 reported on the frequency of interaction between patients and primary care providers and found fewer interactions in the HSPC group (mean (SD): 4.4 (0.93)) compared to the control group (mean (SD): 5.2 (0.82)). The authors did not present the P values.
Unpaid caregiver's care
Higginson 2009 and Farquhar 2014 reported on the effect of HSPC and usual care on the support provided by informal unpaid caregivers (see Table 14 under Additional tables). Increased care by informal unpaid caregivers was reported by Higginson 2009 with more hours of informal care provided in the control group. The P value was not reported. Farquhar 2014 reported more use of informal care in the control group compared to the HSPC group. However, the P value was not also stated.
| Study | Time horizon | Significance and direction | Details |
|---|---|---|---|
| During study period | P value not stated | Breathlessness intervention service: Intervention, n (%), mean (SD) contacts: 22 (79%), 20.3 (20.8) Control, n (%), mean (SD) contacts: 25 (96%), 23.4 (25.2) | |
| 12 weeks following enrollment | P value not stated | Care by informal caregiver: Intervention: 15/23 (65%) received; Mean 152.5 contacts (SD 53.7) Control: 16/21 (76%) received; Mean 151.1 contacts (SD 57.7) |
n: number
SD: standard deviation
Medication and other resources
Seventeen studies either reported on the use of medications or other resources, or both (Ahronheim 2000; Bakitas 2009; Bakitas 2015; Brumley 2007; Carson 2016; Farquhar 2014; Farquhar 2016; Groenvold 2017; Higginson 2009; Janssens 2019; Kane 1984; Ma 2019; Markgren 2016 (linked to Brannstrom 2014); O'Riordan 2019; Rodin 2019; Rogers 2017; Temel 2010) (see Table 15 under Additional tables). Markgren 2016 (part of Brannstrom 2014) assessed the number of patients receiving the target doses of medications based on current guidelines for heart failure among HSPC and control group patients. This study found that the number of patients treated with mineralocorticoid receptor antagonists (MRAs) differed between groups, and increased from 10 (28%) of 36 patients to 15 (48%) of 31 patients in the HSPC arm compared with 13 (35%) of 36 patients to 13 (39%) of 33 patients in the control group. The change in number of patients receiving full target doses of the angiotensin‐converting enzymes inhibitors (ACEIs)/angiotensin receptor blockers (ARBs), beta‐blockers and MRAs was higher in the HSPC arm than in the control arm (P = 0.009). Conversely, O'Riordan 2019 found no evidence of a difference in use of guideline‐driven heart failure treatments such as beta‐blockers and ACEIs/ARBs. Similarly, Janssens 2019 did not find any evidence of a difference between HSPC and the control group in antibiotics use (P = 0.819). Temel 2010 reported a difference in aggressive end‐of‐life care among decedents with 33% (16 of 49 patients) of those in the HSPC group and 54% (30 of 56 patients) in the control group receiving aggressive end‐of‐life care (P = 0.05). Aggressive end‐of‐life care was defined as chemotherapy within 14 days before death, no hospice care, or admission to hospice three days or less before death.
| Study | Time horizon | Significance and direction | Details |
|---|---|---|---|
| During study period | Pearson chi2 test P = 0.79 | New feeding tube Intervention: 22 (45.8%) Control: 22 (43.1%) | |
| Pearson chi2 test P = 0.66 | Total feeding tube Intervention: 34 (70.8%) Control: 34 (66.7%) | ||
| Pearson chi2 test P = 0.44 | Mechanical ventilation Intervention: 2 (4.2%) Control: 4 (7.8%) | ||
| Not calculated because expected frequencies < 5 in at least 2 cells | Tracheostomy Intervention: 0 Control: 1 | ||
| Not calculated because expected frequencies < 5 in at least 2 cells | CPR Intervention: 0 Control: 3 (5.9%) | ||
| Pearson chi2 test P = 0.16 | Systemic antibiotics (unclear if mean or median presented) Intervention: 73 (79.3) Control: 69 (70.4) | ||
| Interventions during 190 admissions | |||
| Pearson chi2 test P = 0.025 | IV for entire admission (unclear if mean or median presented) Intervention: 61 (66) Control: 79 (81) | ||
| Pearson chi2 test P = 0.30 | Indwelling urinary catheter (unclear if mean or median presented) Intervention: 41 (44.6) Control: 51 (52) | ||
| Pearson chi2 test P = 0.33 | Mechanical restraints (unclear if mean or median presented) Intervention: 13 (54.2) Control: 11 (45.8) | ||
| Student’s t‐test P = 0.14 | Days with restraints (mean) Intervention: 5.18 Control: 6.56 | ||
| Pearson chi2 test P = 0.089 | Daily phlebotomy for at least 50% of admission (unclear if mean or median presented) Intervention: 32 (34.8) Control: 46 (46.9) | ||
| Pearson chi2 test P = 0.461 | Daily sc/im injection for at least 50% of admission (unclear if mean or median presented) Intervention: 16 (17.4) Control: 21 (21.6) | ||
| ns Pearson chi2 test P = 0.12 | >1 complex non‐invasive test (unclear if mean or median presented) Intervention: 10 (11) Control: 4 (4) | ||
| ns Pearson chi2 test P = 0.215 | >1 invasive test (unclear if mean or median presented) Intervention: 5 (4.3) Control: 2 (2) | ||
| Pearson chi2 test P = 0.15 | Number of fingersticks per day in patients receiving insulin (unclear if mean or median presented) Intervention: 1.56 Control: 2.01 | ||
| Decisions to forgo treatments | |||
| Not calculated because expected frequencies < 5 in at least 2 cells | Enteral feeds Intervention: 3 (6.3%) Control: 4 (7.8%) | ||
| Not calculated because expected frequencies < 5 in at least 2 cells | Mechanical ventilation Intervention: 3 (6.3%) Control: 0 | ||
| Not calculated because expected frequencies < 5 in at least 2 cells | Intravenous lines Intervention: 5 (10.4%) Control: 1 (2%) | ||
| Not calculated because expected frequencies < 5 in at least 2 cells | Blood draws Intervention: 4 (8.3%) Control: 0 | ||
| Not calculated because expected frequencies < 5 in at least 2 cells | Antibiotics Intervention: 3 (6.3%) Control: 0 | ||
| Pearson chi2 test P = 0.65 | CPR in‐hospital (unclear if mean or median presented) Intervention: 62 (67.4) Control: 63 (64.3) | ||
| Pearson chi2 test P = 0.10 | CPR nonhospital (unclear if mean or median presented) Intervention: 47 (51.1) Control: 38 (38.8) | ||
| During study period | P = 0.34 Referral to hospice care Fisher exact test P = 0.75 | Referral to palliative care Intervention: 34/145 (23.4%) Control: 39/134 (29.1%) Referral to hospice care Intervention: 6/161 (3.7%) Control: 4/161 (2.5%) | |
| Total use covering period before and after enrollment | Poisson generalised linear model P = 0.54 | Chemotherapy in last 2 weeks of life Intervention, rate (95% CI): 0.08 (0.03 to 0.2) Control, rate (95% CI): 0.05 (0.02 to 0.15) | |
| During study period | Referral to hospice care (1of 2 sites only) Chi2 P = 0.15 Days in hospice care (1of 2 sites only) t 0.52 P = 0.60 | Referral to hospice care (1 of 2 sites only) Intervention: 25% Control: 36% Days in hospice care (1 of 2 sites only) descriptive data not provided | |
| Interviewed surrogate decision‐makers immediately after the second support and information team meeting for the intervention group and 10 days after randomisation for the control group, unless the patient had died. All surrogate decision‐makers were interviewed again by telephone for follow‐up beginning 90 days after randomisation. | Total ventilator days, P = 0.59 After randomisation, P = 0.42 | Ventilator days Total Intervention, median (IQR): 19 (15 to 31) Control, median (IQR): 21 (14 to 35) After randomisation Intervention, median (IQR): 10 (5 to 20) Control, median (IQR): 12 (5 to 27) | |
| Interviewed surrogate decision‐makers immediately after the second support and information team meeting for the intervention group and 10 days after randomisation for the control group, unless the patient had died. All surrogate decision‐makers were interviewed again by telephone for follow‐up beginning 90 days after randomisation. | P = 0.62 | Hospital discharge disposition (81 patients discharged from the hospital in intervention group and 75 in control group). Home Intervention, median (IQR): 15 (19) Control, median (IQR): 18 (24) Home with paid assistance: Intervention, median (IQR): 10 (12) Control, median (IQR): 7 (9) Hospice Intervention, median (IQR): 3 (4) Control, median (IQR): 4 (5) Acute rehabilitation facility Intervention, median (IQR): 22 (27) Control, median (IQR): 15 (20) Long‐term acute care hospital Intervention, median (IQR): 12 (15) Control, median (IQR): 12 (16) Other acute care facility Intervention, median (IQR): 0 Control, median (IQR): 1 (1) Skilled nursing facility Intervention, median (IQR): 19 (23) Control, median (IQR): 16 (21) Other Intervention, median (IQR): 0 Control, median (IQR): 2 (3) | |
| During study period | P value not stated | Other hospital care Intervention, n (%), mean (SD) contacts: 15 (54%), 1.5 (0.8) Control, n (%), mean (SD) contacts: 14 (54%), 1.4 (0.6) | |
| P value not stated | Nurse Intervention, n (%), mean (SD) contacts: 11 (39%), 3.0 (3.8) Control, n (%), mean (SD) contacts: 12 (46%), 1.8 (1.6) | ||
| P value not stated | Other health professionals Intervention, n (%), mean (SD) contacts: 5 (18%), 1.2 (0.4) Control, n (%), mean (SD) contacts: 3 (12%), 1.0 (0.0) | ||
| Social care Intervention, n (%), mean (SD) contacts: 4 (14%), 4.3 (6.5) Control, n (%), mean (SD) contacts: 3 (12%), 15.7 (22.9) | |||
| During study period | P value not stated | Other hospital services Intervention, n (%), mean (SD) contacts: 20 (49%), 1.7 (1.0) Control, n (%), mean (SD) contacts: 19 (50%), 2.5 (3.5) | |
| P value not stated | Nurse Intervention, n (%), mean (SD) contacts: 21 (51%), 2.7 (3.3) Control, n (%), mean (SD) contacts: 16 (42%), 2.5 (2.5) | ||
| P value not stated | Other health services Intervention, n (%), mean (SD) contacts: 14 (34%), 1.5 (1.1) Control, n (%), mean (SD) contacts: 4 (11%), 1.0 (0.0) | ||
| P value not stated | Social and other care Intervention, n (%), mean (SD) contacts: 8 (20%), 5.4 (4.6) Control, n (%), mean (SD) contacts: 9 (24%), 11.3 (22.8) | ||
| During study period | P value not stated | Telephone contact with the HSPC team, n Intervention: 116 patients had at least one telephone contact Control: 9 patients had at least one telephone contact | |
| 12 weeks after enrollment | P value not stated | Palliative care nurse Intervention: 9 (39%) received; M 3.0 (SD 1.5) Control: 0 received Other nurse Intervention: 7 (30%) received; M 40.0 (SD 63.8) Control: 7 (33%) received; M 95.0 (SD 79.6) Specialist (ward) Intervention: 5 (22%) received; M 1.0 (SD 0.0) Control: 7 (33%) received; M 9.6 (SD 12.1) Specialist (other) Intervention: 4 (17%) received; M 1.1 (SD 0.3) Control: 5 (24%) received; M 1.0 (SD 0.0) Occupational therapist/physiotherapist Intervention: 16 (70%) received; M 10.6 (SD 9.9) Control: 14 (67%) received; M 22.5 (SD 47.7) Dietitian/chiropodist Intervention: 12 (52%) received; M 3.5 (SD 2.5) Control: 13 (62%) received; M 2.6 (SD 1.3) Day centre Intervention: 5 (22%) received;M 20.2(SD 21.0) Control: 5 (24%) received; M 20.4 (SD 15.9) Respite care Intervention: 2 (9%) received; M 9.5 (SD 0.7) Control: 5 (24%) received; M 10.0 (SD 5.9) | |
| During study period | P = 0.819 | Use of antibiotics The use of antibiotics (for exacerbations not leading to hospital admission) did not differ between groups during the observation period. | |
| During study period | Major surgical procedures P < 0.05 | Major surgical procedures Intervention, mean per patient: 0.09 Control, mean per patient: 0.01 Minor surgical procedures Intervention, mean per patient: 0.42 Control, mean per patient: 0.30 | |
| Over 80% of both hospice and control patients had no radiation treatments. However, those few who did had as many as 48 treatments, hence the large number. | Radiation treatments Intervention, mean per patient: 7.4 Control, mean per patient: 7.7 | ||
| P = 0.03 | Chemotherapy treatments Intervention, mean per patient: 1.3 Control, mean per patient: 0.49 | ||
| Markgren 2016 (linked to Brannstrom 2014) | During study period | Only the change in patients receiving full target doses of the ACEIs/angiotensin receptor blockers, BBs and MRAs were higher (P = 0.0009) in the intervention arm than in the control arm. | Prescribed medication use In the intervention arm, the percentages of angiotensin converting enzyme inhibitors (ACEIs) and mineralocorticoid receptor antagonists (MRAs) increased at the end of the study from baseline, while loop diuretics decreased. Beta‐receptor blockers (BBs) decreased somewhat in both groups. The number of patients treated with MRAs differed the most between groups, and increased from 10 (28%) to 15 (48%) in the PREFER arm compared with 13 (35%) vs 13 (39%) in the control group. The change in patients receiving full target doses (+8 vs. +1) of the ACEIs/angiotensin receptor blockers, BBs and MRAs were higher (P = 0.0009) in the intervention arm than in the control arm. |
| During study period | CRT device, P = 0.3 ACE1/ARB device, P = 0.2 Diuretics, P = 0.2 Spironolactone/eplerenone, P = 0.9 Beta‐blockers, P = 0.4 | Medications (prescription and over‐the‐counter) in the medication list of patients Guideline‐driven HF therapies CRT device Intervention: 20% Control: 35.7% ACE1/ARB Intervention: 60% Control: 35.7% Diuretics Intervention: 86.7% Control: 64.3% Spironolactone/eplerenone Intervention: 26.7% Control: 28.6% Beta‐blockers Intervention: 66.7% Control: 50% Medications for other conditions Cholesterol‐lowering medication Intervention: 73.3% Control: 50% Anti‐anginal Intervention: 20% Control: 14.3% Diabetes medication Intervention: 13.3% Control: 14.3% Antidepressants Intervention: 20% Control: 28.6% Pain medication (NSAIDS and opioids) Intervention: 53.3% Control: 21.4% Anxiety medication Intervention: 0 Control: 7.1% Constipation Intervention: 26.7% Control: 28.6% | |
| During study period | P value not stated | Referral to palliative care Intervention: 22 (100%) Control: 1 (5%) Referral to social work Intervention: 22 (100%) Control: 20 (100%) Referral to psychiatry Intervention: 1 (4.5%) Control: 1 (5%) | |
| During study period | P value not stated | Frequency of interactions occurring between patients and providers Total number of hospital encounter records Intervention, mean (SD): 2.5 (0.45) Control, mean (SD): 2.4 (0.35) Telephone contact Intervention, mean (SD): 12.6 (1.2) Control, mean (SD): 10.6 (0.88) | |
| During study period | P = 0.05 | Aggressive end‐of‐life care among 105 decedents (chemotherapy within 14 days before death, no hospice care, or admission to hospice 3 days or less before death) Intervention: 54% Control: 33% | |
| Chemotherapy within 30 days of death Intervention: 32.5% Control: 42% |
ACEI:
ARB:
BB:
CPR: Cardiopulmonary Resuscitation
CRT:
HF:IQR: interquartile range
M: mean
MRA:
n: number
ns:
NSAID:
PREFER:
sc/im: subcutaneous/Intramuscuslar
SD: standard deviation
Kane 1984 further reported more use of chemotherapy in the HSPC group, with a mean of 1.3 patients receiving chemotherapy in the HSPC group compared to 0.49 in the control group (P = 0.03). More patients in the HSPC group (mean: 0.09) also received major surgical procedures compared to the control group (mean: 0.01) (P < 0.05). Bakitas 2015 reported no between‐group difference in chemotherapy use in the last two weeks of life.
Ahronheim 2000 reported lower use of intravenous therapy for the entire admission among 61 (66%) of 92 admissions in the HSPC group compared to 79 (81%) of 98 admissions in the control group in patients with advanced dementia. On the other hand, the study reported no evidence of a difference in use of other resources such as feeding tubes, mechanical ventilation, tracheostomy, systemic antibiotics, days with restraints, mechanical restraints and cardiopulmonary resuscitation. In Ma 2019, the HSPC group had fewer ventilator days (median 4 versus 6; P = 0.042) and tracheostomies performed (1% versus 7.8%; P = 0.035), while there was no between‐group difference in mechanical ventilation, use of vasopressors, haemodialysis, cardiopulmonary resuscitation. Carson 2016 found no between‐group difference in ventilator days between the HSPC and control group.
Higginson 2009 reported differences in resource use such as primary/secondary care, use of specialist wards, occupation therapist/physiotherapist, palliative care nurse, dietician, chiropodist, day centre and respite care. However, the P values of the differences were not reported. Rogers 2017 reported more hospital encounters with the HSPC team (mean (SD): 2.5 (0.45) versus 2.4 (0.35)) and telephone contacts (mean (SD): 12.6 (1.2) versus 10.6 (0.88)) in the HSPC group compared to the control group, but did not present P values. Groenvold 2017 also highlighted the face that 116 patients in the HSPC group had at least one telephone contact with the HSPC team compared to nine patients in the control group. However, they did not report their P value.
Bakitas 2009 and Brumley 2007 reported no evidence of a difference in referral to palliative care/hospice care. Bakitas 2009 reported that 34 (235) of 145 patients were referred to palliative care in the HSPC group compared to 39 (29%) of 134 patients in the control group (P = 0.34), while 6 (3.7%) of 161 patients in the HSPC group and 4 (2.5%) of 161 patients in the control group were referred to hospice care (P = 0.75). Brumley 2007 presented results on hospice referral for only one of the sites in their study and reported that 25% of patients in the HSPC group were referred to hospice care compared to 36% of patients in the control group (P = 0.15). Rodin 2019 described more referrals to palliative care (22 patients (100%) versus 1 patient (5%)), but not psychiatry (1 patient (4.5%) versus 1 patient (5%)) in the HSPC group compared to the control group. The P values for the differences were not reported. There was no difference in referral to social work between HSPC and control group (22 patients (100%) versus 20 patients (100%)).
Other resource use with no between‐group differences include hospital discharge disposition (Carson 2016). Farquhar 2014 and Farquhar 2016 reported differences between HSPC and the control group in use of services provided by nurses, social care, other health professionals and other hospital services but the P values for differences were not reported.
Certainty of the evidence
Within the Grade approach, we downgraded the certainty of evidence for resource use to very low due to a high risk of bias across studies (‐2 levels as a result of very serious study limitations: high risk of bias for performance, detection, attrition, reporting, size of study and other bias and inconsistency: ‐1 level due to variability in results) (summary of findings Table 1).
Costs and cost‐effectiveness of HSPC
Thirteen economic studies with 2103 participants reported on cost. The utilisations included were: ED or A&E visits; inpatient and outpatient hospital care; home and community care; care in nursing homes (or skilled nursing homes); inpatient stay; day care in hospice; hospice care at home; informal care; drugs and equipment. Four studies reported the results of cost‐effectiveness analysis using relevant outcome measures (palliative outcome, unpaid caregiver’s burden, quality‐adjusted‐life‐years) and hospital costs or total costs (Farquhar 2014; Farquhar 2016; Higginson 2009; McCaffrey 2013). Results of cost‐effectiveness analyses were reported by ICERs and/or costs per QALY (point estimates or cost‐effectiveness planes).
Two studies found evidence of lowered cost with HSPC (Brumley 2007; Gade 2008). When compared to usual care, Mendoza‐Galindo 2018 (abstract only) reported a reduction in the cost of hospitalisation days in the HSPC group. However, no difference was found between groups in the cost of emergency room visits. In Brannstrom 2014, this was unclear as no P value was presented for the difference in cost between HSPC and usual care. We identified four full economic studies (Farquhar 2014; Farquhar 2016; Higginson 2009; McCaffrey 2013). The evidence on the cost‐effectiveness of HSPC compared to usual care was inconsistent.
With the exception of Mendoza‐Galindo 2018 (abstract only), all other studies had applied more robust methodology since the first relevant study we identified which compared the costs of HSPC and conventional care among cancer patients (Kane 1984). Kane 1984 provided services across multiple settings and was carried out in the USA. The HSPC group had lower total costs when compared to conventional care. However, the authors reported that the difference was "not significant". The estimated mean expenditure per patient was reported to be US dollars (USD) 15,263 (converts to Great British Pounds (GBP) 29,058 in 2018) in the HSPC group and USD 15,493 (converts to GBP 29,496 in 2018) in the conventional care group. Resource use was measured in hospital stays, hospice stays, surgical procedures, chemotherapy and radiotherapy, and costs were calculated using different assumptions. However, difference in survival (days since enrollment in the study) as well as other factors (e.g. age, severity of diseases) which might be associated with costs, were not adjusted for.
Brumley 2007 compared resource use and costs between the HSPC and usual care group versus usual care only among terminally ill patients with mixed cancer and non‐cancer diagnoses in the USA involved service provision across multiple settings. A wider range of resource use was reported from the health insurance database: the number of ED visits, physician office visits, hospital days, hospice days, skilled nursing facility days, home health and palliative visits and palliative physician home visits. Service utilisation was lower in the HSPC group than usual care group even after controlling for age, survival and severity measured using the Palliative Performance Scale. Stay in hospital decreased by 4.36 days and ED visits by 0.35. Due to the difference in the survival (days on service), mean costs per patient were adjusted using regression analysis, controlling for survival, age, severity of illness and primary disease. Mean costs per patient in the intervention group were much lower (Australian dollars (AUD) 12,670, SD AUD 12,523; converts to GBP 8383, SD GBP 8285 in 2018), compared with the usual care group (AUD 20,222, SD AUD 30,026; converts to GBP 13,379, SD GBP 19,866 in 2018). Average daily costs per patient were also lower in the intervention group (AUD 95.30, converts to GBP 63.05 in 2018) compared to the usual care group (AUD 212.80, converts to GBP 140.76 in 2018) (P = 0.02).
Gade 2008 used the health insurance database to extract resource use and unit cost of services of hospitalised patients with life‐limiting illnesses (mixed cancer and non‐cancer diagnoses), who were randomly assigned to the HSPC intervention or usual care. Included utilisations were ED visits, clinic and hospital outpatient visits, home health visits, hospital admission, skilled nursing facility admissions and prescriptions. The cost of the palliative care team was calculated as the intervention cost. HSPC patients stayed longer in hospice after the index hospitalisation (24 days) than usual care patients (12 days) however this was a non‐significant difference (P = 0.08), and had shorter ICU stays on readmission (12 times versus 21 times, P = 0.04) and lower total healthcare costs (USD 14,486, converts to GBP 15,013 in 2018 versus USD 21,252, converts to GBP 22,025 in 2018, P = 0.001). Gade 2008 involved an inpatient consult model and was a USA study.
Temel 2010 examined the effectiveness of early palliative care integrated with standard oncologic care among patients with newly diagnosed metastatic non–small‐cell lung cancer, where standard oncologic care alone was a comparator. It was an outpatient model of HSPC that took place in the USA. Data on health utilisations and end‐of‐life care were collected from the medical records: anticancer therapy, medication prescriptions, referral to hospice, hospital admissions and ED visits. Patients in standard care received more aggressive end‐of‐life care (54% [30 of 56 patients] versus 33% [16 of 49 patients], P = 0.05), and had non‐significant longer stays in hospice care (median 11 days versus 4 days, P = 0.09) than the intervention group. Patients in the HSPC group used more palliative care and less aggressive care while there was greater improvement in quality of life and survival in this group than control. However, this was not conclusive because the sample size of the study did not allow the statistical power to test the differences in service utilisation. Detailed analyses of costs and cost‐effectiveness were conducted and reported later although lacking in statistical power to detect the difference in Greer 2016 (linked to Temel 2010)). Comparisons of costs per day alive and costs for the last 30 days were made between HSPC and the usual care group and the cost‐effectiveness per life year saved was calculated. Total costs per day were on average lower in the HSPC group. However, this was a non‐significant difference (mean difference USD 117, SE USD 74; converts to GBP 103, SE GBP 65 in 2018, P = 0.13). Total costs for the last 30 days were also reduced non‐significantly (mean difference USD 2527, SE USD 3311; converts to GBP 2230, SE GBP 2922 in 2018, P = 0.44). The cost‐effectiveness ratio was USD 41,938 per life year saved. There was a non‐signifant increase in use of hospice care (mean difference USD ‐1053, SE USD 538; converts to GBP ‐929, SE GBP 475 in 2018, P = 0.07) and less use of chemotherapy (mean difference USD 757, SE USD 365; converts to GBP 668, SE GBP 322 in 2018, P = 0.03) for the last 30 days.
Higginson 2014 examined the effectiveness of the early introduction of palliative care among patients with chronic breathlessness in the UK. The intervention (HSPC) was provided across multiple settings and patients had mixed cancer and non‐cancer diagnoses. Patients were randomly assigned either to the HSPC group or to usual care. Resource use was collected using the Client Services Receipt Inventory (CSRI) on health, voluntary, and social care received over the past three months at baseline and since the last interview at six weeks follow‐up. Limited results on resource use and costs were reported: hospital inpatient stays (mean 4.5, SD 6.8 in BSS; mean 4.6, SD 7.6 in control) and costs of formal care use (mean GBP 1422, 95% CI: 897 to 2101; converts to GBP 1611, 95% CI: 1016 to 2380 in 2018 in Breathlessness Support Service (BSS) group; mean GBP 1408, 95% CI: 899 to 2023; converts to GBP 1595, 95% CI: 1018 to 2292 in 2018 in control group). There was no between‐group difference between the two groups.
Brannstrom 2014 compared service use between patients randomised to the integrated palliative advanced home care and heart failure care (PREFER) intervention and usual care among patients with severe chronic heart failure in Sweden. The PREFER intervention involved an outreach model of HSPC. Resource use collected included hospital admissions, inpatient days, physician and nurse visits, phone calls and drug prescriptions. The HSPC group had fewer hospitalisations than the control group (0.42 ± 0.60 versus 1.47 ± 1.81, P = 0.009) and the length of stay in hospital was also shorter in patients receiving the intervention (mean 2.9, SD 8.3 versus mean 8.5, SD 12.4, P = 0.011). The total days or total contacts per study arm were compared between HSPC and the control group and additional cost analysis was reported in Sahlen 2016 (linked to Brannstrom 2014). QALY gain was 0.25 years between baseline and the end of intervention across the HSPC group (P = 0.025). Over six months, total cost was Swedish Krona (SEK) 1.4 million (EUR 140,000, converts to GBP 126,132 in 2018) in the HSPC group (n = 36) and SEK 2.0 million (EUR 205,000, converts to GBP 180,188 in 2018) in the control group (n = 26), and the difference SEK 600,000 (EUR 61,000, converts to GBP 54,056 in 2018) was the saving achieved by providing the intervention in addition to usual heart failure care.
Ozcelik 2014 compared duration of hospitalisation and direct cost between HSPC and usual care in Turkey. It was an inpatient consult model of HSPC. A patient cost record form was used to document cost. This form was created by listing direct health expenditure, which consisted of all expenses incurred while in hospital. Direct expenses assessed included medicines used from the start of the patient’s stay in hospital, medical equipment, laboratory and diagnosis tests, consultations, professional care, and hospital stay expenses (including those of companions). On the patient’s discharge from hospital, costs were recorded on the form by obtaining the expenses list from the clinic secretary. Mean (SD) direct cost in the HSPC group was USD 68,869 (SD 48.522) (converts to GBP 60,154 (GBP 42,382) in 2018) and USD 81,076 (72,700) (converts to GBP 70,816 (GBP 63,500) in 2018) in the control group (P = 0.76). There was no evidence of a difference in the duration of hospitalisation (P = 0.07), with a mean (SD) length of stay in hospital of 9.4 (6.27) days in the HSPC group and 13.9 (11.5) days in the control group.
The first study using robust cost‐effectiveness analysis (CEA) method among papers we identified was by Higginson 2009. This was the CEA alongside a feasibility trial of a new HSPC service among patients with multiple sclerosis (MS) in the UK, randomised into either fast‐track of the new intervention or control of usual care. Higginson 2009 involved service provision across multiple settings. Costs were measured in health, social and voluntary services, and informal care provided by family or friends was also included for the analysis from a broad perspective. As the usual unit costs were applied for the formal services, ‘shadow price’ was used for the informal care. CEA used the differences in costs and outcomes (palliative care outcome scale (POS‐8) and Zarit Burden Inventory (ZBI)) between baseline and follow‐up at 12 weeks. Total costs for 12 weeks measured at follow‐up were lower in the fast‐track intervention group than usual care group by GBP 1789 (95% CI: GBP ‐5224 to GBP 1902); converts to GBP 2424 (GBP ‐7077 to GBP 2577) in 2018. When inpatient care and informal care were excluded, mean service costs for 12 weeks were GBP 1195 lower for the intervention group (95% CI GBP ‐2916 to GBP 178); converts to GBP 1619 (GBP ‐3950 to GBP 241) in 2018. Cost‐effectiveness planes showed that 33.8% of replications for POS‐8 indicated that patients in the intervention group had lower cost and better outcomes than in the control group, and 54.9% had lower cost but worse outcomes. For ZBI, 47.3% of replications showed lower costs and better outcomes while 48% indicated higher costs and better outcomes.
McCaffrey 2013 estimated incremental net monetary benefit (INMB) and cost‐effectiveness acceptability curves (CEACs) for one extra day at home in an RCT among patients with mixed cancer and non‐cancer diagnoses with complex or unstable symptom management and high care needs in Australia. McCaffrey 2013 provided services across multiple settings. Data on resource use were prospectively collected and costed including: days at home, specialist palliative care service use, acute hospital and palliative care unit inpatient days, and outpatient visits. Intervention costs were calculated based on staff administration, travel and direct patient contact time, overheads and consumables. The analysis was conducted from a healthcare provider perspective and bootstrapping was used to calculate the confidence intervals around INMB and CEACs. Total costs were AUD 6452 (95% CI AUD 4469 to AUD 8586) (converts to GBP 5750 (95% CI GBP 3983 to GBP 7652) in 2018) in the HSPC group and AUD 5425 (95% CI AUD 2404 to AUD 8531) (converts to GBP 4835 (GBP 2142 to GBP 7602) in 2018) in the control group. The increment costs between the two groups was AUD 1027 (95% CI AUD ‐2612 to AUD 4738) (converts to GBP 915.22 (95% CI GBP ‐2327.71 to 4222.32). When the INMB of one more day at home was compared with varying threshold values, HSPC was preferred to usual care beyond AUD 1068. Sensitivity analyses with different inclusion ranges of costs (using hospital inpatient costs only and excluding high cost outliers) indicated that HSPC was preferred above AUD 2547 (converts to GBP 2270 in 2018) and AUD 846 (converts to GBP 754 in 2018). It was concluded that HSPC had a potential to be cost‐effective, especially in trials with longer follow‐up. The meaning of the threshold value for one extra day at home remains for future research.
Farquhar 2014 and Farquhar 2016 reported the cost‐effectiveness of the Breathlessness Intervention Service (BIS), a multidisciplinary complex intervention underpinned by a palliative care approach for patients with advanced cancer and advanced non‐malignant disease separately. The BIS was a model of HSPC where service provision traversed multiple settings in the UK. In Farquhar 2014, data from patients with advanced cancer were analysed from a societal perspective by including costs of informal care. Total health and social costs, including informal care for eight weeks prior to the baseline assessment, in the HSPC group were GBP 6137 (SD GBP 6099) which converts to GBP 6952 (GBP 6909) in 2018 and GBP 5461 (SD GBP 6099) which converts to GBP 6186 (GBP 6909) in 2018 for usual care. Costs between baseline and follow‐up at two weeks were GBP 794 (SD GBP 866) which converts to GBP 899 (SD GBP 981) in 2018 for HSPC and GBP 1121 (SD GBP 1635) which converts to GBP 1270 (SD GBP 1852) in 2018 for usual care. Intervention costs for HSPC were GBP 119 (SD GBP 62) which converts to GBP 135 (SD GBP 70) in 2018. Total costs were GBP 354 lower for HSPC (95% CI: GBP ‐1020 to GBP 246) which converts to GBP 401 (95% CI: GBP ‐1155 to GBP 279) in 2018 and incremental QALY‐gain was 0.0002 years (95% CI, −0.001 to 0.002), after controlling for baseline. The chance of HSPC being lower in total costs and providing better outcomes in terms of reduced distress due to breathlessness was 80.9% according to cost‐effectiveness planes and 16.4% for higher costs and better outcomes. It was 50.9% for the chance of HSPC being lower in total costs and greater in QALY, and 11% for higher costs and a greater QALY gain.
An NHS perspective was taken in the analysis of data from the UK study of patients with advanced non‐malignant disease in Farquhar 2016. Total health and social costs for eight weeks prior to the baseline assessment in the HSPC group was GBP 1952 (SD GBP 3290) which converts to GBP 2211 (SD GBP 3727) in 2018 and GBP 3630 (SD GBP 5588) which converts to GBP 4112 (SD GBP 6330) in 2018 for usual care. Costs between baseline and follow‐up at four weeks were GBP 1371 (SD GBP 2948) which converts to GBP 1553 (SD GBP 3339) in 2018 for HSPC and GBP 659 (SD GBP 1253) which converts to GBP 746 (SD GBP 1419) in 2018 for usual care. Intervention costs for HSPC were GBP 156 (SD GBP 80) which converts to GBP 177 (SD GBP 91) in 2018. With adjusting for baseline, total costs were GBP 799 higher for HSPC (95% CI: GBP ‐237 to GBP 1904) which converts to GBP 905 (95% CI: GBP ‐268 to GBP 2157) in 2018 and the HSPC group gained 0.003 extra QALYs (95% CI: –0.001 to 0.007). A cost per QALY for HSPC was GBP 266,333 (converts to GBP 301,692 in 2018). The chance of HSPC being lower in total costs and greater in QALYs was 7% according to cost‐effectiveness planes. There was an 86.5% likelihood of HSPC being higher in total costs and greater in QALY gain. The HSPC intervention appeared to be cost‐effective among patients with cancer but not among those with non‐malignant disease.
Mendoza‐Galindo 2018 (abstract only) compared resource use and costs between the early palliative care (EPC) group and usual care in patients with cancer diagnoses in Mexico. The study involved an outpatient model of HSPC. Resource use assessed included number/days of hospitalisation and emergency room (ER) visits as well as their cost. The number of ER visits in the EPC group was 39 while that in the control group was 50 (P = 0.074). There was also no difference in the number of hospitalisations (48% versus 51%) and days of hospitalisation (78 versus 90 days; P = 0.808) among both groups. Median cost associated with ER visits were non‐significantly lower in the EPC group (USD 21.99: converts to GBP 16.97 in 2018) compared to usual care (USD 46.35: converts to GBP 35.76 in 2018) (P = 0.081). The authors further reported lower median cost of hospitalisation days in favour of EPC (USD 167.57: converts to GBP 129.30 in 2018) compared to usual care (USD 295.05: converts to GBP 227.66 in 2018) (P = 0.015).
Ma 2019 assessed resource use and operating costs between an early palliative care intervention and usual care for patients in the ICU setting in USA. It was an inpatient consult model of HSPC. Resources used were extracted from patients' electronic medical records, including mechanical ventilation, vasopressors, haemodialysis, tracheostomy, cardiopulmonary resuscitation, ED visits, hospital readmission, hospital duration and ICU duration. Early palliative care patients had fewer ventilator days (median 4 versus 6; P = 0.042), tracheostomies performed (1% versus 7.8%; P = 0.035), postdischarge emergency department visits (1.3% versus 12.5%; P = 0.007), days on mechanical ventilation (median (IQR) 4 (3 ‐ 7) versus 6 (3 ‐ 13); P = 0.042) and hospital readmissions (17.3% versus 33.3%; P = 0.0024). There was no difference between the intervention and control group in ICU length of stay (median 5 versus 5.5 days), numbers on mechanical ventilation (53.6% versus 56.9%; P = 0.64), numbers on vasopressors (48.5% versus 50%; P = 0.83), days on vasopressors (median 3 versus 3; P = 0.91), numbers on haemodialysis (15.5% versus 23.5%; P = 0.15), numbers receiving cardiopulmonary resuscitation (5.2% versus 6.9%; P = 0.61) and hospital length of stay (median 10 versus 11 days). Analysis of operating costs was conducted though lacking in statistical power to detect the difference. Intervention patients had lower medical ICU (USD 9860 (converts to GBP 7608.08 in 2018) versus USD 15,660 (converts to GBP 12,083.42 in 2018); P = 0.004) and pharmacy costs (USD 3430 (converts to GBP 2646.62 in 2018) versus USD 5850 (converts to GBP 4513.92 in 2018); P = 0.016) per patient compared with the control group. However, the total operating cost per patient was not different between intervention and control group (USD 37,310 (converts to GBP 28,788.78 in 2018) versus USD 45,790 (converts to GBP 35,332.04 in 2018); P = 0.14). An estimated USD 880 (converts to GBP 679.02) of the intervention group’s per patient total operating cost was due to the added cost of the palliative care consultation.
Quality of the evidence
Within the Grade approach, we downgraded the quality of evidence for cost and cost‐effectiveness to very low due to a high risk of bias across studies (‐2 levels as a result of very serious study limitations: high risk of bias for performance, detection, attrition, reporting, size of study and other bias and inconsistency in the direction of the results: ‐1 level due to variability in results) (summary of findings Table 1).
Synthesis of nested or embedded qualitative studies that explored stakeholders' views and experiences of HSPC
Ten studies with a total of 322 participants (245 patients, 20 carers, 9 HSPC team members, 29 physicians (including oncologists), 14 oncology nurse practitioners, one consultant in interstitial lung disease, one clinical nurse specialist in interstitial lung disease, one community matron, one community palliative care nurse and one general practitioner) also had qualitative components that were used to explore stakeholders' views and experiences of HSPC (Bajwah 2015; Farquhar 2014; Farquhar 2016; Hopp 2016; Veron 2018 (linked to Janssens 2019); Lowther 2018 (linked to Lowther 2015); Maloney 2013 (linked to Bakitas 2009); Giovannetti 2018 (linked to Solari 2018); Talabani 2017 (linked to Brannstrom 2014); Wallen 2012) (see Table 16 under Additional tables). The number of patients interviewed by Wallen 2012 was unclear. However, a study (Slota 2014 linked to Wallen 2012) reporting the same data by the authors stated that 34 patients were involved in the qualitative analysis.
| Studies | Participants interviewed | Qualitative approach | Findings of the qualitative study | Findings of the quantitative component |
|---|---|---|---|---|
| Bajwah 2015 (patients with interstitial lung disease (ILD)) | 5 patients 5 carers 1 ILD consultant 1 ILD CNS 1 community matron 1 community palliative care nurse 1 GP | Semi‐structured interviews analysed using a constant comparison approach within framework analysis | Findings: Patients and carers interviewed valued the case conference as they felt that it "laid everything on the table" and importantly addressed concerns and anxieties that had been playing on patients’ and carers’ minds. The qualitative work also identified lack of early referral to palliative care by community health professionals, despite requests from patients and carers, and some gatekeeping by hospital health professionals. Themes from patients: Support in the community Crisis management Palliative care, psychological support Advance care planning Themes from health professionals: GPs ‐ collaboration of care and efficiency Community palliative care clinical nurse specialist – individual care plans and practical problems addressed ILD consultant – symptom control ILD CNS – empowering health professionals | Primary outcome: Symptom burden Mean (SD) POS scores at 4 weeks were ‐5.7 (7.5) fast‐track vs ‐0.4 (8.0) control, (mean change difference between the two arms was ‐5.3 (95% CI ‐9.8 to ‐0.7) independent t test P = 0.02); effect size (95% CI) ‐0.7 (‐1.2 to ‐0.1). Secondary outcomes: The secondary outcomes of quality of life, anxiety and depression were superior in the fast‐track arm, and none were worse. |
| Bakitas 2013 (linked to Bakitas 2009) (ENABLE II) (cancer patients) | 35 oncology clinicians comprising 21 physicians and 14 nurse practitioner | Semi‐structured interviews analysed using thematic analysis | Findings: Oncologists believed that integrating palliative care at the time of an advanced cancer diagnosis enhanced patient care and complemented their practice. Five themes comprised oncologists' views on the complementary role of palliative care: (1) “refer early and often,” (2) referral challenges: “palliative” equals “hospice”; “Heme patients are different,” (3) palliative care as consultants or co‐managers, (4) palliative care “shares the load,” and (5) ENABLE II facilitated palliative care integration. Self‐assessment of their practice with advanced cancer patients comprised four themes: (1) treating the whole patient, (2) focussing on quality versus quantity of life, (3) “some patients just want to fight,” and (4) helping with transitions; timing is everything. | Primary outcomes: Quality of life: The estimated treatment effects (intervention minus usual care) for all participants were a mean (SE) of 4.6 (2) for quality of life (P = 0.02) Symptom intensity The estimated treatment effects (intervention minus usual care) for all participants were a mean (SE) of ‐27.8 (15) for symptom intensity (P = 0.06) Resource use: Intensity of service did not differ between the 2 groups. Secondary outcomes: The estimated treatment effects (intervention minus usual care) for all participants were a mean (SE) of ‐1.8 (0.81) for depressed mood (P = 0.02). |
| Maloney 2013 (linked to Bakitas 2009 ) (ENABLE II) (cancer patients) | 53 patients (28 females included) | Semi‐structured interviews analysed using thematic analysis | Findings: Participants' perceptions of intervention benefits were represented by four themes: enhanced problem‐solving skills, better coping, feeling empowered, and feeling supported or reassured. Three themes related to trial participation: helping future patients and contributing to science, gaining insight through completion of questionnaires, and trial/intervention aspects to improve. Participants did not describe participation as burdensome but rather described some inconveniences or disappointments such as non‐attendance of meetings by other participants and disappointment at not being randomised to the intervention group. | Primary outcomes: Quality of life: The estimated treatment effects (intervention minus usual care) for all participants were a mean (SE) of 4.6 (2) for quality of life (P = 0.02) Symptom intensity The estimated treatment effects (intervention minus usual care) for all participants were a mean (SE) of ‐27.8 (15) for symptom intensity (P = 0.06) Intensity of service did not differ between the 2 groups. Secondary outcomes: The estimated treatment effects (intervention minus usual care) for all participants were a mean (SE) of ‐1.8 (0.81) for depressed mood (P = 0.02). |
| Talabani 2017 (linked to Brannstrom 2014) (heart failure (HF) patients) | 12 patients from the intervention group (8 men included) | Semi‐structured interviews analysed using content analysis | Findings: Two themes and a total of five categories were identified. The first theme was feeling secure and safe through receiving care at home with the categories: having access to readily available care at home, being followed up continuously and having trust in the team members' ability to help. The second theme was being acknowledged as both a person and a patient, with the following two categories: being met as a person, participating in decisions about one's care and receiving help for symptoms of both HF and comorbidities. The team also offered relatives support, which patients appreciated. | Outcomes: Quality of life: Between‐group analysis revealed that patients receiving HSPC had improved HRQoL compared with controls (57.6 ± 19.2 vs. 48.5 ± 24.4, age‐adjusted P = 0.05). Within‐group analysis revealed a 26% improvement in the HSPC group for HRQoL (P = 0.046) compared with 3% (P = 0.82) in the control group. Quality of life improved by 24% (P = 0.047). Symptom burden: Total symptom burden improved by 18% (P = 0.035) Resource use: Fifteen rehospitalisations (103 days) occurred in the HSPC group, compared with 53 (305 days) in the control group. |
| Farquhar 2014 (cancer patients) | 20 patients (and associated carers) | Semi‐structured interviews analysed using framework analysis | Findings: Breathlessness intervention service (BIS) reduced fear and worry, and increased confidence in managing breathlessness. Patients and carers consistently identified specific and repeatable aspects of the BIS model and interventions that helped. The multidisciplinary staff expertise was repeatedly noted. How interventions were delivered was important with a suggestion that the intervention was delivered through the provision of knowledge, with specialist expertise, which increased patients’ and carers’ confidence. BIS legitimised breathlessness and increased knowledge whilst making patients and carers feel ‘not alone’. | Primary outcome: BIS reduced patient distress due to breathlessness (primary outcome: −1.29; 95% CI −2.57 to −0.005; P = 0.049) significantly more than the control group; 94% of respondents reported a positive impact (51/53) Secondary outcomes: Mean CRQ mastery scores improved only negligibly in the intervention arm and remained stable for controls. No differences were found between trial arms on other CRQ domains (dyspnoea, fatigue or emotional function). Mean anxiety scores (HADS) remained fairly stable (both arms). Mean depression scores decreased slightly in the intervention arm, increasing slightly for controls. There was little change in other patient or carer outcomes. BIS had a 66% likelihood of better outcomes in terms of reduced distress due to breathlessness at lower health/social care costs than standard care (81% with informal care costs included). |
| Farquhar 2016 (Non‐cancer (mostly COPD) | 20 patients (and associated carers) | Semi‐structured interviews analysed using framework analysis | Findings: Patients with non‐malignant conditions and their carers described a range of impacts including reduced fear, anxiety, worry, and feelings of panic, as well as feeling more confident about breathlessness. They valued the multidisciplinary staff expertise (their knowledge and understanding of life with breathlessness), the characteristics of the BIS staff (their approachability and attentiveness) and their reassuring and positive approach, and the time BIS gave them to talk about breathlessness with an expert. They reported that being seen at home was especially helpful. The findings suggest that it was not only the provision of these interventions that was important, but also that how they were delivered was key to their impact: delivery of interventions through the provision of knowledge (why and how interventions work or specific guidance on how and when to use a particular intervention) increased patients’ and carers’ confidence. | Primary outcome: There was no difference between groups in the primary outcome ("distress due to breathlessness"), when compared to standard care, of –0.24 (95 % CI: –1.30, 0.82). Secondary outcomes: Mean CRQ mastery scores improved slightly on both arms with greater improvement in the intervention arm. No differences were found between trial arms on other CRQ domains (dyspnoea, fatigue or emotional function). Mean patient anxiety scores decreased slightly for the intervention arm and increased slightly for the control arm and mean depression scores decreased slightly in the intervention arm and remained stable for controls; no between‐group difference was found. Mean anxiety scores for carers achieved a greater, 1.65‐point, reduction in the intervention arm compared with a 0.15‐point reduction for controls, adjusted difference of –1.22 (95 % CI: –2.84 to 0.40), P = 0.14. There was little change in other patient or carer secondary outcomes. Carers of patients randomised to the intervention arm achieved a greater, 1.03‐point, reduction in their distress due to their patient’s breathlessness compared with a 0.2‐point increase for controls, adjusted difference of –0.42 (95 % CI: –1.86 to 1.02), P = 0.56. BIS resulted in extra mean costs of GBP799, reducing to GBP100 when outliers were excluded. |
| Hopp 2016 (patients with heart failure) | 85 patients | Unclear although the authors stated that clinical records were qualitatively reviewed | Findings: Patients expressed concerns about hospital palliative care as it might prevent them from receiving more aggressive treatment. Most patients did not engage with advanced care options. | Primary outcome: There was no difference between groups in the primary outcome (election vs non‐election of measure of comfort‐oriented care) (difference 9.3%, 95% CI ‐11.8% to 30%; P = 0.12). |
| Veron 2018 (linked to Janssens 2019) (COPD patients) | 18 patients (44.4% females) | Semi‐structured interviews analysed using thematic content analysis | Findings: Patients described poor recollection of the RCT and difficulties understanding the palliative care intervention. No major differences were observed between patients who received the specialised intervention and those who did not. Content analysis emphasised that although they experienced disabling symptoms, participants tended to attribute their limitations to problems other than COPD and some declared that they were not sick. Patients reported restrictions due to oxygen therapy, and the burden of becoming dependent on it. This dependence resulted in intense anxiety, leading participants to focus on the present only. A strong feeling of perceived helplessness emerged from the patients' interviews. | Primary outcomes: Patients in the HSPC group were hospitalised for respiratory failure (incidence rate ratio (IRR) 1.87, 95% CI 1.04 to 3.48, P = 0.026) and admitted to the emergency ward (IRR 2.05, 95% CI 1.11 to 3.94, P = 0.014) twice as often during follow‐up than the control group. However, after the Benjamini and Hochberg correction for multiple testing, none of these differences was significant. Furthermore, median values were identical in both groups (hospitalisation: median (IQR): 0.0 (1 to 2) vs. 1.5 (1 to 4), P = 0.219; admissions to emergency wards: 1.0 (0; 3) vs. 1.0 (0; 4), P = 0.484). Secondary outcomes: There was no difference in HRQoL assessed using the SF‐36 between the HSPC and control group. There was no difference in anxiety and depression measured by the HADS‐anxiety and HADS‐depression between the intervention and control group. At inclusion, 3 patients in each group had completed their advanced care planning (ACP) directives (P = 1.00). At the end of the study, 9 patients (35%) of the intervention group versus 3 (13%) of the control group had completed ACP directives (P = 0.194). There was therefore a difference in the number of patients who wrote their ACP directives in favour of the intervention group (P = 0.023). Survival did not differ between the groups (P = 0.913). 8 deaths occurred, 4 in each group. In the intervention group, survival was 454 days (1.24 years; 95% CI: 382 to 525 vs. 425 days (1.16 years; 95% CI: 339 to 509) in the control group; P = 0.592. |
| Lowther 2018 (linked to Lowther 2015) (HIV patients) | 20 patients (predominantly females (85%)) from the intervention group | Semi‐structured interviews analysed using thematic content analysis | Findings: Patients reported that having time to talk, appropriate pain medication and effective health education was of therapeutic value for their psychological well‐being. Integration of mixed method findings suggested that positive effect in quantitative measures of mental health and well‐being were attributable to the active ingredients of: appropriate medication, effective health education and counselling, and having time to talk in clinical encounters. Mechanisms of action included symptom relief, improved understanding of illness and treatment, and support focussed on articulated concerns. Participants whose quality of life remained static or deteriorated reported concurrent intractable physical or social problems which prevented them from fulfilling their social roles and led to financial difficulties. This in turn led to stress, which was a barrier to positive psychological well‐being. | Primary outcome: In the control group, median pain score on the pain item of the APOS (range: 0 to 5; 0 indicates worst pain) improved from 1.0 (IQR 0.0 to 2.0) at baseline to 5.0 (3.0 to 5.0) at 4 months; in the HSPC group, it improved from 1.0 (0.0 to 2.0) at baseline to 4.5 (3.0 to 5.0) at 4 months. There was no between‐group difference (coefficient ‐0.01, 95% CI ‐0.36 to 0.34, P = 0.95). Secondary outcomes: Person‐centred assessment and care delivered by staff who had received additional training had positive effects on self‐reported mental health‐related quality of life and psychosocial well‐being. |
| Giovannetti 2018 (linked to Solari 2018) (multiple sclerosis) | 12 patients, 15 caregivers, 8 physicians and nine members of HSPC team | Semi‐structured interviews analysed using framework method | Findings: Three themes emerged from the interviews: 'expectations,' 'met and unmet needs', and 'barriers'. Participants described benefits from the intervention such as improved control of symptoms and reduced sense of isolation of the patient‐caregiver dyads. Patient‐caregiver dyads valued the expertise of the HSPC team. Limitations identified that included factors related to experimental design (difficulty of dyads in identifying examiner and team roles, additional burden for caregivers); team issues (insufficient team building/supervision, competing priorities); limitations of the intervention itself (insufficient length, lack of rehabilitation input); and external factors (resource limitations, under‐responsive services/professionals). The referring physician focus groups provided little experiential data. | Primary outcomes: There was greater reduction in symptom burden (POS‐S‐MS) in the HSPC group compared to usual care (P = 0.047). Effect size was 0.20 at 3 months and 0.32 at 6 months. Changes in quality of life (SEIQoL‐DW index) did not differ between the two groups. Secondary outcomes: There were no differences between the secondary patient (POS, HADS, FIM total score) and carer outcomes (ZBI) at three and six months. There were 22 serious adverse events in 20 patients, 15 events in 13 patients in the HSPC group (30%) and 7 events in 7 patients in the control group (27%; P = 0.78). |
| Slota 2014 (linked to Wallen 2012) (cancer patients) | In Wallen 2012, n was unclear while Slota 2014 had 34 participants | Open‐ended, qualitative questions on a questionnaire. Method of analysis stated in Wallen 2012 was transcript‐based analysis while thematic analysis was stated in Slota 2014 | Findings: Patients identified consistent communication, emotional support, and pain and symptom management as positive contributions delivered by the intervention. Consistent communication was described in terms of the team as a whole and their focus on individualising patients’ pain and comfort needs. When describing emotional support or 'being there' participants emphasised the support and reassurance they felt knowing the Pain and Palliative Care Team was available across time. They saw team members as their advocates. | Primary outcomes and secondary outcomes: There was no difference between HSPC and control group. However, for those who remained on study for 12 months, the HSPC group performed better than their standard of care counterparts. |
ACP:
APOS: African Palliative Care Outcome Scale
BIS:
CI:
CNS: Clinical Nurse Specialist
COPD:
CRQ: Chronic Respiratory Questionnaire
ENABLE II:
FIM:
GBP: Great British Pounds
GP: General Practitioner
HADS: Hospital Anxiety and Depression Scale
HF:
HIV:
HRQL: Health‐Related Quality of Life
HRQoL:
HSPC:
n: number
HSPC: Hospital‐based Specialist Palliative Care
ILD:
IQR: Interquartile range
IRR:
POS: Palliative Care Outcome Scale
POS‐S‐MS:
SD:
SE: Standard Error
SEIQoL‐DW index: Schedule for the Evaluation of Individual Quality of Life‐Direct Weighting index
SF‐36:
ZBI: Zarit Burden Inventory
Data collection was mainly through semi‐structured interviews. However, Slota 2014 (linked to Wallen 2012) collected their data using open‐ended questions on a questionnaire, while Hopp 2016 qualitatively reviewed clinical records. Approaches to data analysis in these studies included content analysis, framework analysis and thematic analysis. Slota 2014 (linked to Wallen 2012) stated that they used thematic analysis while another study that reported the same data by the authors stated that they used transcript‐based analysis. Bajwah 2015 reported using a constant comparison approach within framework analysis, while Hopp 2016 did not state their approach.
Four studies were HSPC models involving service provision across multiple settings (Farquhar 2014; Farquhar 2016; Maloney 2013 (linked to Bakitas 2009); Wallen 2012), and another four were hospital outreach services (Bajwah 2015; Talabani 2017 (linked to Brannstrom 2014); Veron 2018 (linked to Janssens 2019); Solari 2018). Lowther 2018 (linked to Lowther 2015) was an outpatient HSPC model while Hopp 2016 was an inpatient consult model. Data from the studies were synthesised into two themes: valued components and challenges to HSPC provision.
Participants valued the patient and family‐centredness of the HSPC intervention as it helped to address the varied needs of patients and their unpaid caregivers/families. Benefits described included better symptom control, effective communication and shared decision‐making, psychosocial support and coping, respectful and compassionate care, supporting role maintenance and empowerment, reduced isolation, and improved use of devices. HSPC facilitated effective communication and shared decision‐making as patients and their unpaid caregivers/families had control over the care the patient received. They were able to ask questions, they were listened to and were able to receive the support they needed. Shared decision‐making and the psychosocial support provided as part of HSPC was therapeutic for patients and their unpaid caregivers/families, and also reassured them that they were not alone. Patients particularly valued services they received in the secure environment of their homes, and the involvement and support of their families. In addition to the care delivered, the process of delivery of care was also considered to be important. For instance, patients and their unpaid caregivers/families noted that the palliative care professionals were approachable, attentive and supportive. HSPC further facilitated care planning and the discussion of advanced care plans.
Although HSPC was viewed favourably by participants in these studies, there was also evidence that some participants questioned its usefulness. For instance, in Veron 2018 (linked to Janssens 2019), there were mixed reactions among advanced COPD patients about the value of the HSPC intervention. Authors described poor recollection of the HSPC consultation by patients who tended not to consider themselves to be sick. They ascribed their functional limitations to health problems other than COPD. Patients in this study avoided talking about the future and end‐of‐life issues and wanted to focus on the present. Also in Hopp 2016, participants expressed concerns that HSPC might prevent them from receiving more aggressive interventions and many did not want to discuss advanced directives.
Patients and their unpaid caregivers/families found the information provided during the HSPC intervention to be useful, as it ensured a better understanding of illness and treatment options. Patients and their unpaid caregivers/families valued the multidisciplinary nature of the HSPC team and their specialist expertise. Healthcare professionals such as oncologists tended to describe better patient care resulting from integration of palliative care with oncology at the time of diagnosis of advanced cancer.
Challenges to HSPC provision in these studies were identified, including lack of referral to HSPC by other health professionals, perception of palliative care as being synonymous with imminent death, lack of willingness to engage with palliative care, organisational barriers (e.g. insufficient services) and issues with the experimental study design (e.g. inadequate length of the HSPC intervention).
Discussion
Summary of main results
Studies on the effectiveness of HSPC in patients with an advanced illness have yielded evidence of low quality and very low quality indicating small benefits for patient HRQoL and symptom burden, respectively. Due to very low‐ to low‐quality evidence, we are uncertain about the true effect of HSPC on these outcomes. The results of the 10 studies including a total of 1344 participants indicate that, when compared to usual care, HSPC may improve patient HRQoL on average by 0.26 SMD (95% CI 0.15 to 0.37; I2 = 3%). Positive SMDs indicate better patient HRQoL while negative SMDs indicate lower patient HRQoL. Data from the six studies, including a total of 761 participants, suggests that HSPC may reduce patient symptom burden on average by ‐0.26 SMD over usual care (95% CI ‐0.41 to ‐0.12; I2 = 0%). Negative SMDs indicate benefit (lower symptom burden) and positive SMDs reflect higher symptom burden. Data from the two studies, including a total of 337 participants, suggests that HSPC may improve patient satisfaction with care on average by 0.36 SMD over usual care (95% CI 0.14 to 0.57; I2 = 0%; low‐quality evidence). Positive SMDs indicate better patient satisfaction with care while negative SMDs indicate lower patient satisfaction with care. By conventional criteria, these effects are considered small.
Very low‐quality evidence from one study including 312 participants suggests that when compared to usual care, there was no evidence of effect of HSPC on unpaid caregiver satisfaction with care. We used home death as a proxy measure for achieving patient's preferred place of death and we found low‐quality evidence favouring home death in those that received HSPC. Results from the seven studies (N = 861 participants) favoured HSPC which is reflected in 1.63 higher odds of home death (95% CI 1.23 to 2.16; I2 = 0%). Very low‐quality evidence from one study of 47 participants showed that when HSPC was involved, patients were more likely to achieve their preferred place of care.
We found no difference in mortality/survival between HSPC and usual care in 36 studies (N = 7103 participants) (very low‐quality evidence). Very low‐quality evidence from four studies (N = 525 participants) measuring pain also showed no evidence of effect of HSPC (SMD ‐0.16, 95% CI ‐0.33 to 0.01; I2 = 0%). Positive SMDs indicate more pain while negative SMDs indicate lower pain (benefit). As a result of the very low‐quality evidence, we are uncertain about the effect of HSPC on mortality/survival and pain.
Very low‐quality evidence from five studies (N = 384 participants) suggests that there is no difference in patient anxiety when HSPC is compared to usual care (MD ‐0.63, 95% CI ‐2.22 to 0.96; I2 = 76%). Negative mean differences (MDs) indicate benefit (lower anxiety) and positive MDs reflect higher anxiety. However, eight studies (N = 1096 participants) found that HSPC may improve patient depression on average with a small effect size of ‐0.22 SMD (95% CI ‐0.34 to ‐0.10; I2 = 0%; very low‐quality evidence). Negative SMDs indicate benefit (lower depression) and positive SMDs reflect higher depression. We found no evidence of effect on unpaid caregiver anxiety and depression. However, there was only very low‐quality evidence from one study that assessed unpaid caregiver anxiety (N = 312 participants), and two studies (N = 413 participants) that reported on unpaid caregiver depression (SMD ‐0.02, 95% CI ‐0.21 to 0.18; I2 = 0%).
The data we pooled from five studies (N = 616 participants) that reported adjusted endpoint values and constituted very low‐quality evidence indicated no evidence of effect of HSPC on breathlessness when compared to usual care (SMD ‐0.04, 95% CI ‐0.19 to 0.12; I2 = 0%). Negative SMDs indicate benefit (reduced breathlessness) and positive SMDs reflect worsened breathlessness.
Of the eight studies (N = 1252 participants) that reported on adverse events, six described no adverse events while the remaining two described more adverse events in the HSPC group compared to the control group. While we found no evidence that HSPC causes serious harms, the evidence was very low quality and insufficient to draw strong conclusions.
We could not pool data from the two studies (n = 170 participants) that reported adjusted endpoint data for unpaid caregiver burden. Both studies suggested that HSPC may make little to no difference to unpaid caregiver burden (very low‐quality evidence).
Only one study in 44 participants assessed unpaid caregiver grief and also reported adjusted endpoint values. Similarly, one study in 69 participants assessed unpaid caregiver quality of life and also presented adjusted endpoint values. There was no evidence of a difference between HSPC and usual care on unpaid caregiver grief and quality of life (low‐quality evidence).
Very low‐quality evidence suggests that the effect of HSPC compared to usual care on resource utilisation, cost and cost‐effectiveness is inconclusive. The evidence on resource use was varied across the different areas assessed. Two studies found reduced cost with HSPC when compared to usual care, while one study found a reduction in the cost of hospitalisation days but no difference in the cost of emergency room visits. The difference in cost was unclear in one study, while the remaining nine studies indicated no difference between HSPC and usual care. It was hard to tell if the costs were shifted to other settings (e.g. from acute sector to community) when data on resource utilisation were limited to hospital. Regarding cost‐effectiveness, the evidence from the full economic studies was also inconsistent. One study reported cost‐effectiveness planes of the palliative care outcome scale (POS‐8) and unpaid caregiver burden (ZBI) against total costs, and found that 34% and 47% of bootstrapped differences in costs and outcomes indicated lower costs and better outcomes for the intervention. Another study also presented cost‐effectiveness planes with bootstrapping, where 66% of replicated combinations of costs and outcomes of distress due to breathlessness (NRS) against total cost indicated lower costs and better outcomes. However, another study found that the intervention was not cost‐effective: the incremental cost‐effective ratio (ICER) was 266,333 per QALY, and there was only about a 7% likelihood of lower cost and higher QALYs. The last cost‐effectiveness study calculated incremental net monetary benefit (INMB) of HSPC and found that the intervention was cost‐effective when the willingness to pay threshold was larger than AUD 1,027 (converts to GBP 915 in 2018) for one extra day at home.
Evidence from the qualitative studies that explored views and experiences of HSPC by stakeholders suggested that HSPC was beneficial as it ensured personalised and holistic care for patients and their families, while also fostering open communication, shared decision‐making, respectful and compassionate care and psychosocial support. A previous systematic review also found these areas to be important by patients and their families for end‐of‐life care in the hospital setting (Virdun 2015). Patients found the specialist expertise and multidisciplinary nature of the HSPC teams to be helpful, and there was oncologists' support for early palliative care for patients with newly diagnosed advanced stage cancer.
The main domains of palliative care addressed in the studies that either included certified experts in palliative care, or those described as palliative care clinicians, were symptom control, coping and support, and decision‐making. Some of the studies also addressed care co‐ordination and future planning. With the exception of future planning, studies that were unclear about palliative care training of those delivering the HSPC intervention had less focus on symptom control, decision‐making, care co‐ordination and coping and support when compared to those that included certified experts in palliative care.
Overall completeness and applicability of evidence
We had a highly sensitive electronic search strategy in addition to contacting experts in order to locate grey literature and unpublished studies. As a result, we had a large number of references to screen. Given our intensive search strategy, we are of the opinion that we captured the breadth of evidence on HSPC so far. In particular, we were able to identify 42 RCTs including one foreign language study (Chinese). This allowed us to report on the effect of HSPC on different outcomes. It is noteworthy that the number of studies reporting on different outcomes varied, especially, as we decided to report adjusted endpoint values as our main meta‐analysis. We decided to present adjusted values as our main meta‐analysis because they control for differences, and also provide the most precise and least biased estimates of treatment effects. Although we had indicated that we would be carrying out subgroup analyses by disease type, HSPC team composition (e.g. physician‐led versus nurse‐led versus MDT‐led services and 24‐hour access versus temporarily restricted access), models of HSPC and country of origin in order to explain heterogeneity, we could only carry out subgroup analyses on one outcome (patient anxiety) due to low to no heterogeneity in the main meta‐analysis in other outcomes. The results of subgroup analysis should be interpreted with caution due to the small number of studies available and the exploratory nature of this approach. We had indicated that we would be carrying out a subgroup analysis using frailty associated with advanced age. However, no study reported on frailty. In addition, there is a need for better reporting of the findings of studies. We could not include some studies in the meta‐analysis because they did not present analysable data.
Most of the studies were conducted in hospitals with specialised palliative care teams and were largely carried out in the US and UK. Regulatory environment can have a significant impact on the provision and impact of HSPC on hospitals, patients and unpaid caregivers. For example, in the US, non‐hospital palliative care is provided through a large number of varied private for profit and non‐profit entities whose effectiveness and success may vary significantly. This aspect of the service also makes the hospital to home‐based care transition difficult and lacking in continuity of care. In addition, palliative care, health policy and resources in developed countries differ from what is obtainable in low‐ and middle‐income countries where resources are somewhat limited and palliative care at its infancy (WPCA/WHO 2014). The results obtained from these highly developed healthcare systems may not be applicable to low resource settings. The majority of our included studies were for populations of cancer patients and, importantly, this review has shown that HSPC is being extended to other patient populations.
Quality of the evidence
Besides Ahronheim 2000 and Jingfen 2017, a foreign language study, we judged all other studies as having a high risk of bias in at least one domain. Nine studies had a high risk of bias in four or more domains (Bajwah 2015; Brannstrom 2014; Cheung 2010; Edmonds 2010; Janssens 2019; O'Riordan 2019; Rodin 2019; Rogers 2017; Temel 2017). We carried out sensitivity analyses using unadjusted endpoint values and (un)adjusted changes and the results from these analyses sometimes supported the results we obtained from our main analysis.
Using the GRADE approach, the quality of the evidence ranged from very low to low across different outcomes. Generally, we downgraded the evidence mainly due to serious/very serious study limitations (high risk of bias), inconsistency resulting from unexplained heterogeneity and imprecision due to small numbers of participants.
There were differences across studies in the models of HSPC and usual care, patient population, outcome measures and time point of primary analysis. The evidence for mortality/survival was also quite varied. This difference could have resulted because of the diverse patient populations in the studies as well as the heterogeneous models of the intervention.
This review provided evidence of low quality concerning the effectiveness of HSPC on the primary outcomes of patient HRQoL and patient symptom burden. Given the low quality of the evidence, the findings should be interpreted circumspectly. Findings from ongoing studies and other future studies may assist in further strengthening the certainty of the effect estimates on the effectiveness of HSPC.
Potential biases in the review process
Given that decisions taken during the process of conducting a systematic review and meta‐analysis may be affected by subjective decisions (Shrier 2008), it is important to consider potential biases that may have occurred. Generally, the methods of a systematic review provide for transparency and standardisation thereby enhancing reproducibility of the process. For most of our outcomes such as patient HRQoL and patient symptom burden, we combined studies reporting adjusted endpoint data as our main meta‐analyses. We pooled these studies using standardised mean differences (SMDs) because they used different scales. Restricting our main meta‐analyses to studies reporting adjusted endpoint data reduced the number of studies we could pool together.
We could not include some studies in our meta‐analyses because they did not present analysable data. Outcomes that were not reported in a usable format may be systematically different from those that were included in the meta‐analyses, thereby introducing selective outcome reporting bias (Higgins 2011b). We followed the GRADE approach in assessing the quality of the evidence for different outcomes. Although the GRADE approach may not always ensure consistency of conclusions, we believe it offers the advantage of a systematic and transparent process of judging the quality of the evidence (Guyatt 2011).
An important step in minimising bias in systematic reviews is to address publication bias. Publication bias affects the validity and generalisability of the findings of a meta‐analysis (Lin 2017). In order to reduce the possibility of publication bias, we searched electronic databases, carried out citation tracking, handsearched relevant studies and reviews and contacted experts for grey literature and unpublished studies. We drew on a comprehensive search strategy with input from the information specialist from the PaPaS Group in order to minimise our chances of missing out relevant studies. We believe that this synthesis includes an unbiased sample that covers the populations targeted by this review. Nonetheless, we cannot rule out time‐lag bias, that is, when the results of negative trials take longer to publish when compared to positive trials (Sterne 2011).
In order to include studies in this review, the intervention had to have been delivered by a multidisciplinary team. Our definition of a multidisciplinary team was quite broad encompassing studies where different professionals delivered the intervention to those where one single professional led the service and included other professionals, as needed. We excluded studies such as Maltoni 2016 and Schenker 2018 because they did not meet our definition of a multidisciplinary team. Further, we excluded studies such as Brims 2019 and Wong 2016 because palliative care was an integral part of routine usual care. Our decision to include studies where the training of the palliative care team was unclear, with eligibility informed by activity of delivering specialist palliative care rather than level of specialist training, might have implications for the effect estimates we found, with the possibility of smaller effect sizes in the review. Also, in almost half of the studies (n = 20), there was palliative care involvement in the control group. This could have resulted in a smaller effect of the intervention in these studies. Due to differences in the reporting of the cost‐effectiveness results and also the dearth of cost‐effectiveness studies in this review, we could not carry out subgroup analysis to explore differences in cost‐effectiveness across countries.
We included studies where the authors stated that the intervention they provided was early palliative care or where this was their intention. Given that the definition of early palliative care is still an area of ongoing debate (Haun 2017), there is a need for consensus on its definition. In order to make our review more relevant for clinical practice and policy makers, we made some changes to the protocol such as expansion of the remit of our review from only inpatient specialist palliative care to five different HSPC models, limiting eligible studies to only RCTs and change of our primary outcome from pain to two primary outcomes, patient HRQoL (previously, a secondary outcome in the protocol) and patient symptom burden. We carried out these changes before we began data extraction and analysis. Consequently, the changes were not post hoc. We have provided a full description of the changes we made to the protocol under Differences between protocol and review.
As in a previous Cochrane Review on the effectiveness of early palliative care for adults with advanced cancer (Haun 2017), we provided a description of the quality of the evidence for our outcomes rather than on providing clinical guidance. We have presented quality ratings for each outcome and have not determined the quality across outcomes. Given that it has been suggested that the lowest quality rating of the primary outcome(s) should be applied to the overall quality rating across studies (Guyatt 2013), the evidence for HSPC would be considered as very low. However, as recognised in Haun 2017 and also in this review, this rating is likely biased and we need larger and well‐conducted studies to establish the effectiveness of HSPC.
Agreements and disagreements with other studies or reviews
Four relevant systematic reviews have been published prior to this review (Dalgaard 2014; Gaertner 2017; Haun 2017; Higginson 2002). Three of these reviews included HSPC while Haun 2017 assessed the effectiveness of early palliative care for cancer patients only. None of these previous reviews included all the RCTs in our review. Our Cochrane Review is the first to assess the effectiveness and cost‐effectiveness of HSPC on diverse outcomes in a broad population consisting of people with cancer, non‐cancer and mixed diagnoses.
Dalgaard 2014 assessed the best methods for early identification of palliative trajectories in patients with cancer, chronic heart failure and COPD, while also identifying preconditions for early integration of general palliative care in hospitals and outcomes for patients and relatives. This review included only one of the seminal papers on early palliative care by Temel 2010 which found that early integration of palliative care with standard oncology care for patients with non‐small‐cell lung cancer (NSCLC) led to better quality of life and mood as well as longer survival. This review concluded that evidence about outcomes was sparse and mostly related to cancer populations receiving specialised palliative care.
Gaertner 2017 assessed the effect of specialist palliative care on quality of life and other outcomes in adults with advanced illness in hospital, hospice or community settings. This review included eight RCTs that we also identified in our review and concluded that "specialist palliative care was associated with a small effect on quality of life and might have most pronounced effects for patients with cancer who received such care early". The review found that the results for pain and other secondary outcomes (fatigue, nausea, dyspnoea, psychosocial variables (distress, depression, anxiety, spiritual well‐being, social well‐being, and satisfaction), survival time, place of death, cost of care, and attrition (or completion rate)) were inconclusive.
Haun 2017 assessed the effectiveness of early palliative care on different outcomes such as HRQoL, depression, symptom intensity and survival among patients with advanced cancer. This review included six RCTs that were also part of our review and concluded that "early palliative care interventions may have more beneficial effects on HRQoL and symptom intensity among patients with advanced cancer than among those given usual/standard cancer care alone". The authors found only small effect sizes. The effects on mortality and depression were uncertain. The authors further stated that results should be interpreted with caution due to the very low‐to low‐quality of the evidence and between‐study differences regarding participant populations, interventions, and methods.
Higginson 2002 is the oldest review that was relevant. Its objective was to assess whether hospital‐based palliative care teams improved the process or outcomes of care for patients and families at the end‐of‐life through a qualitative meta‐synthesis and quantitative meta‐analysis. It did not include any of the studies in our review and there was only one RCT. The authors found a small positive effect for hospital‐based palliative care teams. Higginson 2002 further highlighted the need for better designed studies comparing different models of HSPC as well as the use of standardised outcome measures for assessing symptoms.
Our review agrees with these past reviews in some respect especially with regards to HRQoL. We found evidence that HSPC may be effective in improving HRQoL of patients and patient symptom burden with small effect sizes. We also found that HSPC may lead to benefits on some of the secondary outcomes we assessed: better patient satisfaction, achieving patient preferred place of death (measured by number of home deaths) and improvement in patient depression. Quality of the evidence ranged from very low to low. Similar to our review, the review by Gaertner 2017 found a small effect of specialist palliative care on HRQoL (SMD 0.16, 95% CI 0.01 to 0.31; n = 7 studies with 1218 participants; moderate‐quality evidence). The Cochrane Review by Haun 2017 also showed a small effect of early palliative care on HRQoL (SMD 0.27, 95% CI 0.15 to 0.38; n = 7 studies with 1028 participants; low‐quality evidence).

PRISMA flow diagram.
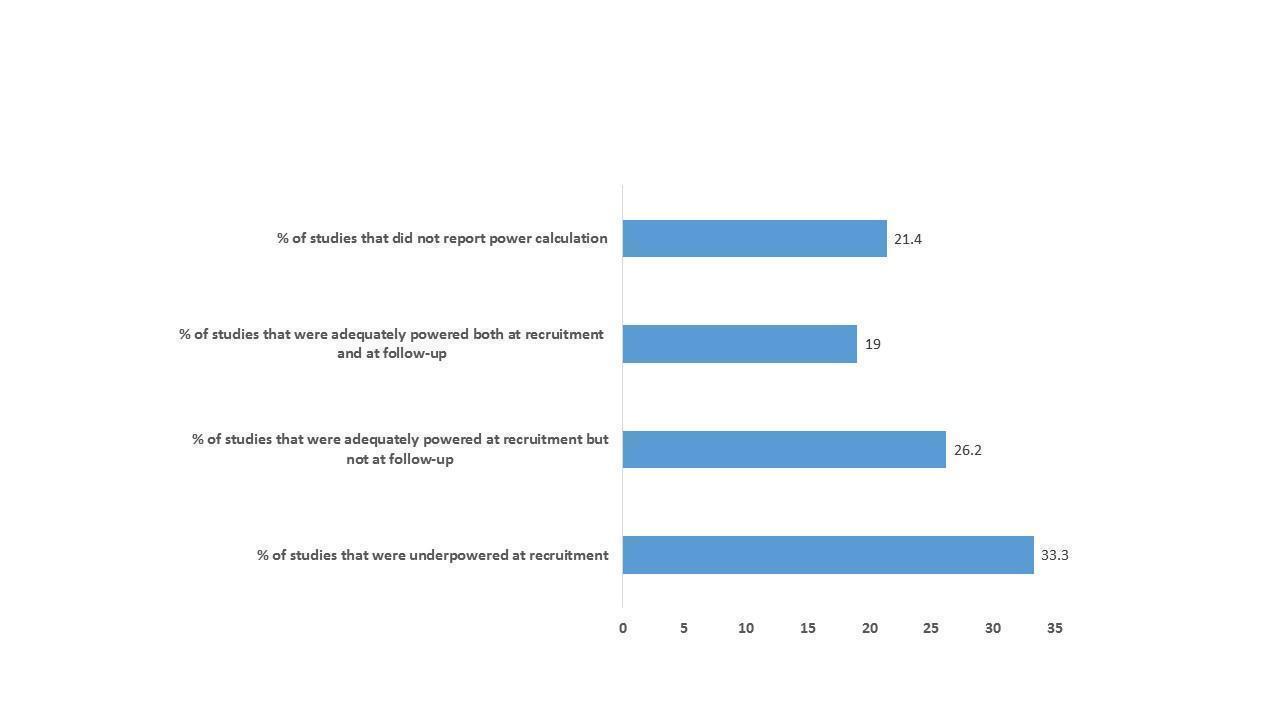
A figure describing the power of included studies at recruitment and follow‐up

A figure showing the domains of HSPC in the studies that either included certified experts in palliative care or those described as palliative care clinicians

A figure showing the domains of HSPC in studies that were unclear about palliative care training

Risk of bias summary: review authors' judgements about each risk of bias item for each included study.

Risk of bias graph: review authors' judgements about each risk of bias item presented as percentages across all included studies.

Funnel plot of comparison: 1 Patient health‐related quality of life, outcome: 1.1 HSPC versus usual care on patient HRQoL: adjusted endpoint values.

Comparison 1: Patient health‐related quality of life, Outcome 1: HSPC versus usual care on patient HRQoL: adjusted endpoint values

Comparison 1: Patient health‐related quality of life, Outcome 2: HSPC versus usual care on patient HRQoL: adjusted endpoint values (excluding McCorkle 2015)

Comparison 1: Patient health‐related quality of life, Outcome 3: HSPC versus usual care on patient HRQoL: unadjusted endpoint values

Comparison 1: Patient health‐related quality of life, Outcome 4: HSPC versus usual care on patient HRQoL: unadjusted endpoint values (excluding McCorkle 2015)

Comparison 1: Patient health‐related quality of life, Outcome 5: HSPC versus usual care on patient HRQoL: unadjusted change values

Comparison 2: Patient symptom burden, Outcome 1: HSPC versus usual care on patient symptom burden: adjusted endpoint values

Comparison 2: Patient symptom burden, Outcome 2: HSPC versus usual care on patient symptom burden: unadjusted endpoint values

Comparison 2: Patient symptom burden, Outcome 3: HSPC versus usual care on patient symptom burden: unadjusted endpoint values (excluding McCorkle 2015)

Comparison 2: Patient symptom burden, Outcome 4: HSPC versus usual care on patient symptom burden: adjusted change values

Comparison 2: Patient symptom burden, Outcome 5: HSPC versus usual care on patient symptom burden: adjusted change values (excluding McCorkle 2015)

Comparison 2: Patient symptom burden, Outcome 6: HSPC versus usual care on patient symptom burden: unadjusted change values

Comparison 3: Patient satisfaction with care, Outcome 1: HSPC versus usual care on patient satisfaction with care: adjusted endpoint values

Comparison 4: Achieving patient preferred place of death, Outcome 1: HSPC versus usual care on home deaths

Comparison 5: Pain, Outcome 1: HSPC versus usual care on pain: adjusted endpoint values

Comparison 5: Pain, Outcome 2: HSPC versus usual care on pain: adjusted change values

Comparison 5: Pain, Outcome 3: HSPC versus usual care on pain: unadjusted change values

Comparison 6: Patient anxiety, Outcome 1: HSPC versus usual care on patient anxiety: adjusted endpoint values

Comparison 6: Patient anxiety, Outcome 2: HSPC versus usual care on patient anxiety: adjusted endpoint values (excluding McCorkle 2015)

Comparison 6: Patient anxiety, Outcome 3: HSPC versus usual care on patient anxiety: unadjusted endpoint values

Comparison 6: Patient anxiety, Outcome 4: HSPC versus usual care on patient anxiety: unadjusted endpoint values (excluding McCorkle 2015)

Comparison 6: Patient anxiety, Outcome 5: HSPC versus usual care on patient anxiety: unadjusted change values

Comparison 6: Patient anxiety, Outcome 6: HSPC versus usual care on patient anxiety in different populations: adjusted endpoint values

Comparison 6: Patient anxiety, Outcome 7: HSPC versus usual care on patient anxiety in different populations: adjusted endpoint values (excluding McCorkle 2015)

Comparison 6: Patient anxiety, Outcome 8: EPC vs LPC on patient anxiety: adjusted endpoint values

Comparison 6: Patient anxiety, Outcome 9: Effect of MDT‐led services on patient anxiety: adjusted endpoint values

Comparison 6: Patient anxiety, Outcome 10: Effect of MDT‐led services on patient anxiety: adjusted endpoint values (excluding McCorkle 2015)

Comparison 6: Patient anxiety, Outcome 11: HSPC versus usual care on patient anxiety in different countries: adjusted endpoint values

Comparison 6: Patient anxiety, Outcome 12: HSPC versus usual care on patient anxiety in different countries: adjusted endpoint values (excluding McCorkle 2015)

Comparison 7: Unpaid caregiver anxiety, Outcome 1: HSPC versus usual care on unpaid caregiver anxiety: unadjusted endpoint values

Comparison 8: Patient depression, Outcome 1: HSPC versus usual care on patient depression: adjusted endpoint values

Comparison 8: Patient depression, Outcome 2: HSPC versus usual care on patient depression: unadjusted endpoint values

Comparison 8: Patient depression, Outcome 3: HSPC versus usual care on patient depression: unadjusted endpoint values (excluding McCorkle 2015)

Comparison 8: Patient depression, Outcome 4: HSPC versus usual care on patient depression: adjusted change values

Comparison 8: Patient depression, Outcome 5: HSPC versus usual care on patient depression: unadjusted change values

Comparison 8: Patient depression, Outcome 6: HSPC versus usual care on patient depression as a binary outcome

Comparison 9: Unpaid caregiver depression, Outcome 1: HSPC versus usual care on unpaid caregiver depression: adjusted endpoint values

Comparison 9: Unpaid caregiver depression, Outcome 2: HSPC versus usual care on unpaid caregiver depression: unadjusted endpoint values

Comparison 10: Unpaid caregiver quality of life, Outcome 1: HSPC versus usual care on unpaid caregiver quality of life: unadjusted endpoint values

Comparison 11: Unpaid caregiver burden, Outcome 1: HSPC versus usual care on unpaid caregiver burden: adjusted change values

Comparison 12: Patient breathlessness, Outcome 1: HSPC versus usual care on patient breathlessness: adjusted endpoint values

Comparison 12: Patient breathlessness, Outcome 2: HSPC versus usual care on patient breathlessness: unadjusted endpoint values

Comparison 12: Patient breathlessness, Outcome 3: HSPC versus usual care on patient breathlessness: unadjusted change values
| Hospital‐based specialist palliative care compared to usual care for adults with advanced illness and their unpaid caregivers/families | |||||
| Patient or population: adults with advanced illness and their unpaid caregivers/families | |||||
| Outcomes | Anticipated absolute effects* (95% CI) | Relative effect | № of participants | Certainty of the evidence | |
|---|---|---|---|---|---|
| Risk with usual care | Risk with hospital‐based specialist palliative care | ||||
| Patient health‐related quality of life (HRQoL)i, SD units | Mean (SD) ranging from ‐45.4 (26.83) to 131.14 (26.62) | SMD 0.26 SDs higher | ‐ | 1344 | ⊕⊕⊝⊝ |
| Patient symptom burden assessed with generalised measuresii, SD units (lower scores indicate lower symptom burden) | Mean (SD) ranging from ‐19.3 (4.2) to 268.59 (201.65) | SMD 0.26 SDs lower | ‐ | 761 | ⊕⊝⊝⊝ |
| Patient satisfaction with careiii, SD units | Mean (SD) ranging from 6.4 (1.1) to 68.37 (9.03) | SMD 0.36 SDs higher (0.41 higher to 0.57 higher) | ‐ | 337 (2 RCTs) | ⊕⊕⊝⊝ |
| Achieving patient preferred place of death (measured by number of patients with home death) Follow‐up: range 1 month to 13 months | 462 per 1000 | 583 per 1000 (513 to 649) | OR 1.63 higher (1.23 higher to 2.16 higher) | 861 | ⊕⊕⊝⊝ |
| Painiv, SD units | Mean (SD) ranging from 2.2 (3.7) to 28.19 (32.81) | SMD 0.16 SDs lower | ‐ | 525 | ⊕⊝⊝⊝ |
| Unpaid caregiver burdenv | Only two studies reported adjusted endpoint values but we could not pool them in a meta‐analysis. They both found no between‐group difference between HSPC and usual care | ‐ | 170 | ⊕⊝⊝⊝ | |
| Cost and cost‐effectiveness | Of 13 studies reporting costs of HSPC, nine studies found no difference between HSPC and usual care and two studies favoured HSPC over usual care. The difference in cost was unclear in one study, while another study reported mixed findings with lower cost of hospitalisation in favour of HSPC but no difference in the cost of emergency room visit. Four studies with full economic analysis were inconclusive on the cost‐effectiveness of HSPC. | ‐ | 2103 | ⊕⊝⊝⊝ | |
| *The risk in the intervention group (and its 95% confidence interval) is based on the assumed risk in the comparison group and the relative effect of the intervention (and its 95% CI). i. Assessed with the European Organisation for the Research and Treatment of Cancer Quality of Life Questionnaire Core 30 (EORTC QLQ‐C30), Functional Assessment of Cancer Therapy ‐ Bone Marrow Transplant (FACT‐BMT), Functional Assessment of Cancer Therapy ‐ General Measure (FACT‐G), Functional Assessment of Cancer Therapy – Lung scale (FACT‐L), Functional Assessment of Chronic Illness therapy for Palliative Care (FACIT‐Pal), Functional Assessment of Chronic Illness Therapy ‐ Spiritual Well‐being Scale (FACIT‐Sp), McGill Quality of Life Questionnaire (McGill QoL questionnaire) and Minnesota Living with Heart Failure Questionnaire (MLHF questionnaire). ii. Assessed with the Edmonton Symptom Assessment Scale (ESAS) or a modified form of it, severity subscale of the Memorial Symptom Assessment Scale (MSAS), symptom impact subscale of the Quality of Life at End of life (QUAL‐E), Rotterdam Symptom Checklist (RSC ‐ Physical Symptoms Score) and lung cancer subscale of the FACT‐L. iii. Assessed with 16‐item Family Satisfaction with Care ‐ Patient Version (FAMCARE‐P16) and Modified City of Hope Patient Questionnaires ‐ Place of Care Environment Scale (MCOHPQ ‐ Place of Care Environment Scale). iv. Assessed with pain item of EORTC QLQ‐C30 and Brief Pain Inventory (BPI). v. Assessed with Montgomery‐Borgatta Caregiver Burden Scale and Zarit Burden Inventory | |||||
| GRADE Working Group grades of evidence | |||||
| a We downgraded by 2 levels for very serious study limitations due to a high risk of bias in studies. b We downgraded by 1 level due to inconsistency between our main meta‐analysis and sensitivity analyses. c We downgraded by 1 level for imprecision due to the small number of participants. d We downgraded by 1 level for inconsistency because the results were inconsistent across studies. | |||||
| Author | Symptom control (e.g. assess symptoms, prescribing of medications) | Decision‐making (e.g. enquire about goals of care) | Future planning (e.g. advance care planning) | Coping and support (e.g. emotional and practical support) | Care co‐ordination (e.g. helping with co‐ordinating care) |
|---|---|---|---|---|---|
| Yes | Yes | Yes | Yes | Yes | |
| Yes | Yes | Yes | Yes | Yes | |
| Yes | Yes | Yes | Yes | Yes | |
| Yes | Yes | No | Yes | Yes | |
| Yes | Yes | No | Yes | Yes | |
| Yes | Yes | Yes | Yes | Yes | |
| No | Yes | No | Yes | No | |
| Yes | Yes | Yes | Yes | Yes | |
| Yes | No | No | Yes | No | |
| Yes | Yes | Yes | Yes | No | |
| Yes | Yes | Yes | Yes | No | |
| Yes | Yes | No | Yes | Yes | |
| Yes | Yes | Yes | Yes | No | |
| Yes | No | Yes | Yes | Yes | |
| Yes | Yes | Yes | Yes | Yes | |
| Yes | Yes | Yes | Yes | Yes | |
| Yes | No | Yes | Yes | No | |
| Yes | Yes | Yes | Yes | No | |
| Yes | Yes | No | Yes | Yes | |
| Yes | Yes | No | Yes | Yes | |
| Unclear | Unclear | Unclear | Yes | Unclear | |
| Yes | Yes | Yes | Yes | Yes | |
| Yes | No | No | Yes | No | |
| Yes | Yes | Yes | Yes | Yes | |
| Yes | Yes | Yes | Yes | Yes | |
| Unclear | Unclear | Unclear | Yes | Unclear | |
| Yes | No | No | Yes | No | |
| Yes | Yes | No | Yes | Yes | |
| Yes | Yes | No | Yes | Yes | |
| Yes | Yes | No | Yes | Yes | |
| Yes | No | No | Yes | No |
| Author | Symptom control (e.g. assess symptoms, prescribing of medications) | Decision‐making (e.g. enquire about goals of care) | Future planning (e.g. advance care planning) | Coping and support (e.g. emotional and practical support) | Care co‐ordination (e.g. helping with co‐ordinating care) |
|---|---|---|---|---|---|
| Yes | No | Yes | Yes | No | |
| Unclear | Unclear | Unclear | Unclear | Unclear | |
| Unclear | Unclear | Unclear | Unclear | Unclear | |
| Yes | Yes | Yes | Yes | No | |
| Yes | Yes | Yes | Yes | No | |
| Yes | Yes | No | Yes | No | |
| Unclear | Unclear | Unclear | Unclear | Yes | |
| Yes | No | No | Yes | No | |
| Yes | No | Yes | Yes | No | |
| Yes | No | Yes | Yes | No | |
| Yes | No | No | Yes | No |
| Studies, primary endpoint (PEP), disease group | Scales used | Dimensions covered in scales |
|---|---|---|
| PEP: 4 weeks Advanced fibrotic lung disease | KBILD (used in meta‐analysis) SGRQ | KBILD is a 15‐item questionnaire consisting of three domains (breathlessness and activities, chest symptoms and psychological) ‐ secondary outcome SGRQ is a 50‐item instrument designed to measure impact on overall health, daily life, and perceived well‐being in patients with obstructive airways disease. Part 1 has a symptoms component (frequency and severity) with a 1, 3 or 12 month recall (several scales); Part 2 has an activities component looking at activities that cause or are limited by breathlessness and an impact component looking at social functioning, psychological disturbances resulting from airways disease and referring to current state as the recall (dichotomous (true/false) except last question (4‐point Likert scale) – secondary outcome |
| PEP: 13 months Cancer | FACIT‐Pal | Measures physical, emotional, social, and functional well‐being in addition to concerns relevant to persons with life‐threatening illness (e.g. feeling peaceful, reconciling with others) – primary outcome |
| PEP: 3 months Cancer | FACIT‐Pal (used in meta‐analysis) Treatment Outcome Index | Measures physical, emotional, social, and functional well‐being and additional concern subscales – study did not specify whether primary or secondary outcome TOI, composed of FACIT‐Pal physical, functional, and additional concern subscales |
| PEP: 6 months Heart failure | KCCQ | KCCQ is a valid, reliable measure of heart failure–specific health status that is responsive to change. No further details provided in the study |
| PEP: 6 months Heart failure | EQ‐5D (used in meta‐analysis) KCCQ | A generic, single index that defines health in the five dimensions of mobility, self‐care, usual activities, pain/discomfort, and anxiety/depression ‐ did not specify primary or secondary outcomes Full data not shown in study |
| PEP: 12 weeks Multiple sclerosis | MSIS | Multiple Sclerosis Impact Scale (MSIS) is a 29‐item measure of disease impact. It has two subscales: physical and psychological subscales. |
| PEP: 2 weeks Cancer | FACT‐BMT | The 47‐item Functional Assessment of Cancer Therapy–Bone Marrow Transplant which includes subscales assessing physical, functional, emotional, social well‐being, and bone marrow transplant–specific concerns during the past week, was used to assess patients’ QoL – primary outcome |
| PEP: 12 weeks Cancer | FACT‐G | Functional Assessment of Cancer Therapy‐General (FACT‐G) scale. It is a 27‐item internationally validated questionnaire divided into four primary HRQoL domains: physical well‐being, social/family well‐being, emotional well‐being, and functional well‐being. The total FACT‐G score is the sum of the 4 subscale scores. |
| PEP: at hospital discharge Mixed diseases comprising cancer and non‐cancer | MCOHPQ | MCOHPQ Physical Area scale, emotional/relationship area and spiritual area scales and MCOHPQ place of care environment scale. Physical Area scale addresses pain, fatigue, sleep changes, nausea, constipation, diarrhoea, dry mouth, change in appetite, and shortness of breath. Emotional support items included: anxiety, burden to family, support they received, isolation, opportunity to discuss illness and possible death, and treatment wishes/goals. Spiritual support included: the importance of participation in spiritual or religious experiences from the Spiritual Area scale, and two items developed by the investigators: ability to find meaning in one’s life, and support given by religion or spiritual belief. MCOHPQ Place of Care Environment scale addressed experiences receiving pain management and symptom relief, psychological and social support, discharge planning, and end‐of‐life planning – primary outcome. |
| PEP: 12 weeks Cancer | FACT‐G | Functional Assessment of Cancer Therapy‐General Measure (not specified in study) – primary outcome |
| PEP: 6 weeks Mixed diseases comprising cancer and non‐cancer | CRQ HROL (presented in meta‐analysis) EQ‐5D | Measures breathlessness mastery, breathlessness, fatigue, and emotional function – secondary outcome A generic, single index that defines health in the five dimensions of mobility, self‐care, usual activities, pain/discomfort, and anxiety/depression |
| PEP: 12 months COPD | SF‐36 | A generalised self‐assessment scale assessing different dimensions including vitality, mental health, general health, physical functioning, role physical, role emotional, bodily pain, social functioning and health transition |
| PEP: 3 months Cancer | EORTC QLQ‐C30‐Chinese version | Not specified as primary or secondary outcome |
| PEP: not stated but 3 months used in meta‐analysis Cancer | FACT‐G (presented in meta‐analysis) SF‐12 (not used in meta‐analysis because only its first item was used) | No information provided in study on dimensions covered by FACT‐G ‐ secondary outcome |
| PEP: 12 weeks Cancer | EORTC QLQ‐C30 | The EORTC QLQ‐C30 consists of 30 items in 15 scales. In the present study additional items measuring role functioning, cognitive functioning, social functioning, dyspnoea, pain, fatigue, insomnia, appetite loss, nausea/vomiting and constipation were added to the questionnaire to expand these scales to at least four items in each scale. |
| PEP: not stated but appeared to be 6 months. 6 months was used in meta‐analysis Heart failure | MLHF questionnaire | MLHF questionnaire measures heart failure–specific health–related quality of life. No further information provided |
| PEP: on discharge Cancer | EORTC QLQ‐C30 | The scale consists of the 2 subscales 'functional' and ‘symptom'. The functional section is divided into 6 subsections: physical, role, cognitive, emotional, social, and global quality of life. The symptom section includes the following symptoms: fatigue, nausea and vomiting, pain, dyspnoea, sleep disorders, loss of appetite, constipation, diarrhoea, and financial impact – primary outcome |
| PEP: 12 weeks Cancer | FACIT‐Sp | The scale covers physical, social/family, emotional, functional, and spiritual well‐being. |
| PEP: 6 months Heart failure | FACIT‐Pal (presented in meta‐analysis) KCCQ | Assesses quality of life in several domains, including physical well‐being, social/family well‐being, emotional well‐being, functional well‐being, and palliative care – primary outcome The overall summary score is derived from the physical function, symptom, social function, and quality‐of‐life domains. |
| PEP: not stated but data presented at 3 months used in meta‐analysis Heart failure | MLHF questionnaire | The MLHF Questionnaire was created to be representative of the ways HF and treatments can affect key physical, emotional, social, and mental dimensions of QoL. It assess how much a person’s HF has affected many aspects of their life during the prior month – primary outcome |
| PEP: 6 months | SEIQoL‐DW questionnaire | Schedule for the Evaluation of Individual Quality of Life‐Direct Weighting (SEIQoL‐DW). The SEIQoL‐DW is administered in an interview in which respondents nominate the five areas of life that are most important in determining their QoL, and rate the satisfaction/functioning and weight/importance in each of these areas. The SEIQoL‐DW index can range from 0 to 100 (best). |
| PEP: one year Cancer | McGill QoL Questionnaire | Physical symptoms, psychological symptoms, outlook on life, and meaningful existence – primary outcome |
| PEP: 12 weeks Cancer | FACT‐L (presented in meta‐analysis) LCS TOI | Assesses multiple dimensions of the quality of life (physical, functional, emotional, and social well‐being) during the previous week. In addition, the lung cancer subscale (LCS) of the FACT‐L scale evaluates seven symptoms specific to lung cancer – primary outcome |
| PEP: 12 weeks Cancer | FACT‐G | Assesses four dimensions of QoL (physical, functional, emotional, and social well‐being) – primary outcome |
| PEP: 12 weeks Cancer | EORTC QLQ‐C30 (presented in meta‐analysis) McGill QoL questionnaire | Global health status/quality of life scale of the European Organisation for Research and Treatment of Cancer Quality‐of‐Life Questionnaire Core 30 items (EORTC QLQ‐C30; version 3) Single item scale and overall summary score of the McGill Quality of Life questionnaire (MQoL). The MQoL incorporates a single item scale of global quality of life and four subscales, measuring four relevant domains of quality of life (i.e. physical, psychological, existential/spiritual, and social). |
| PEP: 4 weeks Cancer | EORTC QLQ‐C30 (Korean version) | EORTC QLQ‐C30 (Korean version) assesses multiple dimensions of QoL (physical, functional, emotional and social well‐being) during the previous week. |
| COPD: | ||
| Author | Results for Mortality/Survival | P value |
|---|---|---|
| Number of deaths in the sample Intervention: 12 (25%) Control: 12 (25%) | 0.96 | |
| Number of deaths in the sample Intervention: 8 (32%) Control: 13 (54%) | Not stated | |
| Number of deaths in the sample Intervention: 112 (69.6%) Control: 119 (73.9%) Survival time (median, 95% CI) Intervention: 14 months (10.6 to 18.4) Control: 8.5 months (7 to 11.1) | Cox proportional hazards model estimate demonstrated a reduced relative risk of death (HR, 0.67 (95% CI: 0.496 to 0.906) P = .009) in the HSPC group during the first year of the study and a greater relative risk after one year, (HR, 1.56 (95% CI: 0.908 to 2.655)). P for survival time = 0.14 | |
| Number of deaths (authors stated that there were 109 deaths (52.7%) Intervention: numbers not provided Control: numbers not provided Survival time (median) Intervention: 18.3 months Control: 11.8 months | Kaplan‐Meier curves illustrated a 15% difference in survival at 1 year (HSPC, 63% vs control, 48%; P = 0.038). However, for the overall log‐rank test, P = 0.18), suggesting a convergence in overall survival after 12 months. | |
| Number of deaths in the sample Intervention: 10 (6.4%) Control: 13 (8.3%) | 0.52 | |
| Number of deaths in the sample Intervention: 8 (22%) Control: 4 (11.1%) | 0.34 | |
| Number of deaths (authors highlighted 75% deaths among participants) Intervention: numbers not provided Control: numbers not provided Survival time (mean (SD)) Intervention: 196 days (SD:164) Control: 242 days (SD:200) | P = 0.03 However, results of the Kaplan‐Meier survival analysis did not show differences in survival time between study groups (P = 0.08). | |
| Survival time (median, IQR) Intervention: 19 days (12 to 37) Control: 23 days (12 to 39) | P for survival time = 0.51 90‐day survival (HR, 0.95 (95% CI: 0.65 to 1.38), P = 0.96). Post hoc adjustment for baseline activities of daily living and study site did not alter the outcome (HR,1.01 (95% CI; 0.69 to 1.47), P = 0.96) | |
| Number of deaths in the sample Intervention: 7 (70%) Control: 9 (90%) | P = 0.58 | |
| Number of deaths in the sample Intervention: 1 (70%) Control: 3 (11.5%) | P value not stated | |
| Number of deaths in the sample Intervention: 3 (3.7%) Control: 0 | P value not stated | |
| Number of deaths in the sample Intervention: 2 (5.7%) Control: 0 | P value not stated | |
| Number of deaths in the sample Intervention: 1 (2.3%) Control: 1 (2.3%) | P value not stated | |
| Number of deaths in the sample Intervention: 52 (37.4%) Control: 30 (36.6%) | P value not stated | |
| Number of deaths in the sample Intervention: 173 (63%) Control: 132 (56%) Survival time (median, IQR) Intervention: 30 days (6 to 104) Control: 36 days (13 to 106) | P (for difference in number of deaths) = 0.08 P (for difference in survival time) = 0.08 | |
| Number of deaths in the sample Intervention: 25 (27%) Control: 22 (23%) Survival time (median) Intervention: 323 days Control: 364 days | P (for difference in survival time) = 0.16, but in the adjusted analysis P = 0.39 | |
| Number of deaths in the sample Intervention: 41 (59.4%) Control: 44 (65.7%) Survival time (median, 95% CI) Intervention: 289 days (128 to 453) Control: 132 days (80 to 302) | The P value for difference in median survival was 0.20 (log‐rank test) | |
| Number of deaths in the sample Intervention: 1 (3.8%) Control: 3 (11.5%) | P value not stated | |
| Number of deaths in the sample Intervention: 3 (5.7%) Control: 13 (25%) Survival time (median, range) Intervention: 745 (338 to1075) Control: 711 (345 to1045) | P (for survival rate) was 0.048. In subgroup analysis, this pattern was not recorded for patients with cancer (P = 0·97); but it became more marked for patients with diseases other than cancer (P = 0·01). | |
| Number of deaths in the sample (denominator unclear) Intervention: 11 Control: 8 | P = 0.47 | |
| Number of deaths in the sample Intervention: 4 (15.4%) Control: 4 (17.4%) Survival time (unclear if mean or median reported) Intervention: 454 days (95% CI: 382 to 525) Control: 425 days (95% CI: 339 to 509) | Survival did not differ between groups (log‐rank test, P = 0.913). | |
| One‐third of the sample died within 45 days after enrollment, the second third within 120 days but numbers were not provided for the intervention and control groups | Authors reported no difference in the survival patterns of HSPC and control patients | |
| Number of deaths in the sample Intervention: 3 (5%) Control: 0 | P value not stated | |
| Number of deaths in the sample Intervention: 34 (35.1%) Control: 37 (36.3%) | P = 0.87 | |
| Number of deaths in the sample Intervention: 16 (69.6%) Control: 5 (62.5%) | Increment (95% CI) reported as 7 (‐45.1 to 30.4) | |
| Number of deaths in the sample Intervention: 7 (10.6%) Control: 3 (3.8%) | P value not stated | |
| Authors reported that 36 (24.7%) patients died before one month but did not provide numbers in the intervention and control group. | ||
| Number of deaths in the sample Intervention: 1 (4.5%) Control: 1 (5.6%) | P value not stated | |
| Number of deaths in the sample Intervention: 23 (30.7%) Control: 20 (26.7%) | P value not stated | |
| Number of deaths in the sample Intervention: 14 (12.1%) Control: 5 (4.3%) | Results of the survival analysis found no association between study group assignment and death within 6 months after adjustment for age, gender, and marital status. | |
| Number of deaths in the sample Intervention: 3 (3%) Control: 0 | P value not stated | |
| Number of deaths in the sample Intervention: 39 (65%) Control: 31 (51.7%) Survival time (median, 95% CI) Intervention: 7 months (5.2 to 9.8) Control: 11.7 months (9.8 to 18.8) | P (log rank) = 0.014. The estimated HR was 1.6 (95% CI: 1.1 to 2.3; P = 0.015). This estimate changed to 1.5 (95% CI 0.99 to 2.2; P = 0.06) when adjusted for the oncologist’s baseline estimate of likely survival, diagnosis, months since diagnosis, and gender. | |
| Number of deaths (authors stated 105 participants (70%) had died by the time of analysis) Intervention: numbers not provided Control: numbers not provided Survival time (median, 95% CI) Intervention: 11.6 (6.4 to 16.9) months Control: 8.9 (6.3 to 11.4) months | Log‐rank P = 0.02 After adjustment for age, sex, and baseline Eastern Cooperative Oncology Group performance status, the group assignment remained a predictor of survival (HR for death in the standard care group, 1.70; 95% CI, 1.14 to 2.54; P = 0.01). | |
| Number of deaths in the sample Intervention: 33 (18.9%) Control: 41 (23.4%) | P value not stated | |
| Number of deaths (authors stated that 121 (65%) of participants had died by the end of the study) Intervention: numbers not provided Control: numbers not provided Survival time (median, 95% CI) Intervention: 312 days (190 to 434) Control: 343 days (253 to 433) | P = 0.97 | |
| Authors reported that there was no difference in survival between HSPC and usual care but did not present any data | ||
| CI: | ||
| Studies | Participants | Adverse effects in patients/caregivers |
|---|---|---|
| Patients and caregivers | Authors reported no worsening of any outcome after receiving the intervention. | |
| Patients | There were no harmful adverse events attributed to the intervention. | |
| Patients | Authors did not observe any harmful effect of the intervention. | |
| Patients (and caregivers if present) | Authors did not observe any harmful effect of the intervention. | |
| Patients | Authors did not observe any harmful effect of the intervention. | |
| Patients | Authors reported no adverse events during the study. | |
| Patients and caregivers | Authors reported 15 serious adverse events in 13 patients in the HSPC group and 7 in 7 patients in the control group. Serious adverse events reported included aspiration pneumonia, generalised anxiety, breathing difficulty, urine retention/infection, anarthria, contact dermatitis, dysphagia, vomiting, bladder catheter malfunctioning, fever, arrhythmia, necrotising fasciitis, traumatic wound, macrohaematuria, constipation, abdominalgia and bronchitis. Three patients in the HSPC group died but this was considered to be unrelated to the intervention. | |
| Patients | Authors reported that more patients in the HSPC group had poorer appetite compared to the control group (P = 0.04). | |
| HSPC: | ||
| Study | Time horizon | Significance and direction | Details |
|---|---|---|---|
| During study period | Wilcoxon rank sum test P = 0.53 | Intervention: 0.86 visits Control: 0.63 visits Note: not clear if the figures were means or medians | |
| Total use covering period before and after enrollment | Poisson generalised linear model P = 0.32 for baseline (total sample of 207) P = 0.21 for total use in 109 decedents | Intervention for baseline sample (days, 95% CI): 0.16 (0.1 to 0.25) Control for baseline sample: 0.21 (0.15 to 0.31 Intervention (total use in 50 decedents): 0.14 (0.09 to 0.2) Control (total use in 59 decedents): 0.19 (0.14 to 0.26) | |
| During study period | Reduced ED use in intervention group Cramer’s V 0.15; P = 0.01 linear regression adjusted for survival, age and severity of illness showed intervention reduced ED visits by 0.35 (P = 0.02) | Intervention: 20% had ED visits Control: 33% had ED visits | |
| Admissions to the emergency ward in the year before study enrollment | There was no difference in admissions to the emergency ward in the intervention group compared to the control group (Incidence rate ratio 1.27, 95% CI: 0.72 to 2.26, P = 0.384). | Number of admissions to emergency ward Intervention: 33 Control: 23 | |
| During study period | Admission to the emergency ward was twice as often in the intervention group compared to the control group (incidence rate ratio 2.05, 95% CI: 1.11 to 3.94, P = 0.014). However, after the Benjamini and Hochberg correction for multiple testing, this difference was not significant. | Number of admissions to emergency ward Intervention: 37 Control: 16 | |
| During study period and post‐discharge | Patients in the intervention group had fewer ED visits compared to usual care (P = 0.0067) | % of ED visits: Intervention: 1.3% Control: 12.5% P: 0.0067 | |
| Unclear | P = 0.074 | Intervention: 39 Control: 50 | |
| During study period | P value not stated | Frequency of interactions occurring between patients and providers Emergency department/urgent care: Intervention, mean (SD): 0.4 (0.12) Control, mean (SD): 0.5 (0.11) | |
| During study period | P value not stated | Any emergency department visit from enrollment to death: Intervention: 53.1% Control: 57.1% | |
| P value not stated | Any emergency department visit within 30 days of death: Intervention: 22.4% Control: 30.4% | ||
| CI: confidence intervals | |||
| Study | Time horizon | Significance and direction | Details |
|---|---|---|---|
| During study period | Wilcoxon rank sum test P > 0.99 | Intervention: 0.06 days Control: 0.06 days Note: not clear if the figures were means or medians | |
| Total use covering period before and after enrollment | Poisson generalised linear model P = 0.10 for baseline (total sample of 207) P = 0.49 for total use in 109 decedents | Intervention for baseline sample (days, 95% CI): 0.52 (0.28 to 0.95) Control for baseline sample: 0.22 (0.1 to 0.5) Intervention (total use in 50 decedents): 0.1 (0.04 to 0.24) Control (total use in 59 decedents): 0.15 (0.07 to 0.3) | |
| Interviewed surrogate decision‐makers immediately after the second support and information team meeting for the intervention group and 10 days after randomisation for the control group, unless the patient had died. All surrogate decision‐makers were interviewed again by telephone for follow‐up beginning 90 days after randomisation. | Differences between groups for other patient outcomes were analysed based on t tests, nonparametric tests, χ2 tests (including the Fisher exact test), or log‐rank tests as appropriate. For total ICU days, P = 0.51 P value for after randomisation, P = 0.72 | ICU days Total: Intervention, median (IQR): 19 (15 to 26) Control, median (IQR): 20 (15 to 30) After randomisation: Intervention, median (IQR): 9 (6 to 15) Control, median (IQR): 10 (5 to 17) | |
| Enrollment to ICU discharge | Fisher’s exact test and the Mann‐Whitney test P = 0.97 | Intervention: median (IQR) ICU length of stay: 3 (7) days Control: median (IQR) ICU length of stay: 5 (8) days | |
| During study period | Index‐admission Fisher exact test P > 0.99 Up to 180 days Fisher exact test P > 0.99 | Hospital days at 180 days Index‐admission: Since only 1 participant had more than 1 ICU admission, the authors treated the ICU admission as a binary outcome. During the index‐admission, there was no difference between the 2 groups. (Fisher exact test P > 0.99) Up to 180 days: There was no difference between the 2 groups (Fisher exact test, P > 0.99). | |
| 6 months post‐index hospitalisation | P = 0.04 Continuous measures for intervention and usual care patients were compared using t tests for normally distributed measures and Wilcoxon two‐sample tests for measures with skewed distributions. | ICU admissions, median n: Intervention: 12 Control: 21 | |
| Admissions to ICU for respiratory failure in the year before study enrollment | There was no difference in ICU admissions for respiratory failure in the intervention group compared to the control group (Incidence rate ratio 0.88, 95% CI: 0.26 to 2.96, P = 0.82). | Number of ICU admissions for respiratory failure in the year before inclusion: Intervention: 7 Control: 7 | |
| During study period | There was no difference in ICU admissions for respiratory failure in the intervention group compared to the control group (Incidence rate ratio 4.42, 95% CI: 0.49 to 20.92, P = 0.16). | Number of ICU admissions for respiratory failure during the study period: Intervention: 5 Control: 1 | |
| During study period | P value not stated | Mean number of ICU days per patient: Intervention, mean per patient: 0.2 Control, mean per patient: 0.3 | |
| During study period | No difference in ICU duration between intervention and control group (P = 0.38) | ICU duration in days, median (IQR): Intervention: 5 (3 ‐ 8) Control: 5.5 (3 ‐ 10) P: 0.38 | |
| CI: confidence intervals | |||
| Study | Time horizon | Significance and direction | Details |
|---|---|---|---|
| Interviewed surrogate decision‐makers immediately after the second support and information team meeting for the intervention group and 10 days after randomisation for the control group, unless the patient had died. All surrogate decision‐makers were interviewed again by telephone for follow‐up beginning 90 days after randomisation. | Differences between groups for other patient outcomes were analysed based on t tests, nonparametric tests, χ2 tests (including the Fisher exact test), or log‐rank tests as appropriate. Mechanical ventilation, P = 0.41 Dialysis, P = 0.64 Nutrition, P = 0.60 Vasopressors, P = 0.86 | Limitations of ICU treatment Mechanical ventilation: Intervention, median (IQR): 40 (31) Control, median (IQR): 33 (26) Dialysis: Intervention, median (IQR): 13 (10) Control, median (IQR): 15 (12) Nutrition: Intervention, median (IQR): 18 (14) Control, median (IQR): 21 (17) Vasopressors: Intervention, median (IQR): 18 (14) Control, median (IQR): 19 (15) | |
| During study period | The following were lower in the intervention group compared to the control group: tracheostomy (P = 0.035) and days on mechanical ventilation (P = 0.042). | % of patients using mechanical ventilation: Intervention: 53.6% Control: 56.9% P: 0.64 Haemodialysis: Intervention: 15.5% Control: 23.5% P: 0.15 Vasopressors: Intervention: 48.5% Control: 50% P: 0.83 Tracheostomy: Intervention: 1% Control: 7.8% P: 0.035 Cardiopulmonary resuscitation: Intervention: 5.2% Control: 6.9% P: 0.61 Number of days on mechanical ventilation, median (IQR): Intervention: 4 (3 ‐ 7) Control: 6 (3 ‐ 13) P: 0.042 Number of days on vasopressors, median (IQR): Intervention: 3 (1 ‐ 6) Control: 3 (2 ‐ 6) P: 0.91 | |
| ICU: | |||
| Study | Time horizon | Significance and direction | Details |
|---|---|---|---|
| During study period | P = 0.92 | Mean number of total admissions Intervention: 1.94 Control: 1.90 | |
| During study period | P = 0.61 | Number of hospitalisations Intervention: 18 patients had 1 hospitalisation 9 patients had 2 or more hospitalisations Control: 30 patients had 1 hospitalisation 6 patients had 2 or more hospitalisations | |
| During study period | P = 0.009 | Number of hospitalisations, mean (SD) Intervention: 0.42 ± 0.60 Control: 1.47 ± 1.81 Total number of hospitalisations: Intervention: 15 Control: 53 | |
| During study period | Reduced hospitalisation in intervention group Cramer’s V 0.23; P < 0.001 | Intervention: 36% were admitted Control: 59% were admitted | |
| During study period | P value not stated | Inpatient: Intervention, n (%), mean (SD) contacts: 2 (7%), 3.0 (2.8) Control, n (%), mean (SD) contacts: 3 (12%), 6.3 (6.8) | |
| During study period | P value not stated | Inpatient: Intervention, n (%), mean (SD) contacts: 6 (15%), 11.5 (8.3) Control, n (%), mean (SD) contacts: 4 (11%), 6.0 (3.4) | |
| Hospital admissions for respiratory failure in the year before study enrollment | There was no difference in hospital admissions for respiratory failure in the intervention group compared to the control group (incidence rate ratio 1.18, 95% CI: 0.61 to 2.31, P = 0.60). | Number of hospital admissions for respiratory failure in the year before inclusion: Intervention: 24 Control: 18 | |
| During study period | Hospital admission for respiratory failure was almost twice as often in the intervention group compared to the control group (incidence rate ratio 1.87, 95% CI: 1.04 to 3.48, P = 0.026). However, after the Benjamini and Hochberg correction for multiple testing, this difference was not significant. | Number of hospital admissions for respiratory failure during study period: Intervention: 38 Control: 18 | |
| Hospital admissions for respiratory failure in the year before study enrollment | There was no difference in hospital admissions for respiratory failure in the intervention group compared to the control group (incidence rate ratio 1.18, 95% CI: 0.36 to 4.12, P = 0.77). | Other hospitalisations in the year before inclusion: Intervention: 8 Control: 6 | |
| During study period | There was no difference in hospital admissions for respiratory failure in the intervention group compared to the control group (incidence rate ratio 1.01, 95% CI: 0.32 to 3.28, P = 0.99). | Other hospitalisations during study period: Intervention: 8 Control: 7 | |
| During study period and post‐discharge | Patients in the intervention group had fewer hospital readmissions compared to usual care (P = 0.024) | % of hospital readmissions: Intervention: 17.3% Control: 33.3% P: 0.024 | |
| Unclear | There was no difference in number of hospitalisations. P value not given | Intervention: 48% Control: 51% | |
| During study period | During the 6‐month follow‐up, 30% of patients were hospitalised for HF. No differences were seen between the 2 treatment groups in this clinical endpoints through the 6‐month follow‐up point. For hospitalisation for non‐heart failure/cardiovascular and hospitalisation for non‐cardiovascular, P value was not stated | Hospitalisation for HF: Intervention: 30.7% Control: 29.3% Hospitalisation for non‐heart failure/cardiovascular: Intervention: 16% Control: 13% Hospitalisation for non‐cardiovascular: Intervention: 10.7% Control: 24% | |
| Inpatient readmission for any cause within 30 days | Survival analysis using proportional hazards regression P = 0.50 | There was no association between study group assignment and 30‐day inpatient readmission (adjusting for age, gender, and marital status). | |
| During study period | P value not stated | Any admission from enrollment to death: Intervention: 73.5% Control: 76.8% | |
| P value not stated | Any admission within 30 days of death: Intervention: 36.7% Control: 53.6% | ||
| CI: | |||
| Study | Time horizon | Significance and direction | Details |
|---|---|---|---|
| During study period | Student’s t‐test was used P = 0.46 | Intervention (mean (range)): 8.8 (1 ‐ 93) Control (mean (range)): 9.7 (1 ‐ 63) | |
| During the study | Wilcoxon rank sum test P = 0.14 | Number of hospital days (unclear if mean or median reported) Intervention: 6.6 days Control: 6.5 days | |
| Total use covering period before and after enrollment | Poisson generalised linear model P = 0.03 for baseline (total sample of 207) P = 0.26 for total use in 109 decedents | Intervention for baseline sample (days, 95% CI): 0.69 (0.4 to 1.18) Control for baseline sample: 1.39 (0.97 to 1.97) Intervention (total use in 50 decedents): 0.95 (0.61 to 1.46) Control (total use in 59 decedents): 1.3 (0.91 to 1.86) | |
| During the study period | P value for total hospital days = 0.011. The number of days spent in hospital was also significantly lower in the intervention group at the Departments of Medicine‐Geriatrics (100, range 1–45 vs. 242, range 2–46 days) and Surgery (0 vs. 56, range 2–21 days). Days in other departments did not differ significantly. | Total hospital days, mean (SD) Intervention: 2.9 (8.3) Control: 8.5 (12.4) Days in Department of Medicine‐Geriatrics: Intervention: 100 (range 1 ‐ 45) Control: 242 (range 2 ‐ 46) Days in Department of Surgery: Intervention: 0 Control: 56 Days in other departments: Intervention: 3 (range 1 ‐ 2) Control: 7 (1 ‐ 6) | |
| During the study | Fewer hospital days in intervention group. Linear regression adjusted for survival, age and severity of illness showed intervention reduced hospital days by 4.36 (P < 0.001) | No descriptive data provided | |
| Interviewed surrogate decision‐makers immediately after the second support and information team meeting for the intervention group and 10 days after randomisation for the control group, unless the patient had died. All surrogate decision‐makers were interviewed again by telephone for follow‐up beginning 90 days after randomisation. | Differences in the number of hospital days were analysed using nonparametric methods. P value for total hospital days, P = 0.78 P value for deceased patients, P = 0.60 P value for after randomisation, P = 0.51 | Hospital days Total hospital days: Intervention, median (IQR): 35 (23 to 52) Control, median (IQR): 36 (23 to 54) For deceased patients: Intervention (49 deaths), median (IQR): 25 (18 to 36) Control (51 deaths), median (IQR): 24 (14 to 39) After randomisation: Intervention, median (IQR): 19 (12 to 37) Control, median (IQR): 23 (12 to 39) | |
| During study period | Fisher’s exact test and the Mann‐Whitney test P = 0.44 | Intervention: median (IQR) hospital length of stay: 5 (8) days Control: median (IQR) hospital length of stay: 11 (27) days | |
| During study period | P value not stated | Duration of HCT hospitalisation, median (range): Intervention: 20 (12 – 102) days Control: 21 (13 – 40) days | |
| 6 months post‐index hospitalisation | P value for admission to study enrollment (days), P = 0.36 P value for study enrollment to discharge or death in the hospital (days), P = 0.10 P‐value for index hospital length of stay (days), P = 0.57 Continuous measures for intervention and usual care patients were compared using t tests for normally distributed measures and Wilcoxon two‐sample tests for measures with skewed distributions. | Admission to study enrollment (days), median (IQR): Intervention: 3 (2, 7) Control: 4 (2, 7) Study enrollment to discharge or death in the hospital (days), median (IQR): Intervention: 3 (1, 6) Control: 2 (1, 5) Index hospital length of stay (days), median (IQR): Intervention: 7 (4, 12) Control: 7 (4, 12) | |
| During study period | Index‐admission Wilcoxon test P = 0.67 Up to 180 days Wilcoxon test P = 0.14 | Hospital days at 180 days Index‐admission: The authors found no difference in hospital days between the intervention and usual care groups during the index‐admission (Wilcoxon test P = 0.67). Up to 180 days: The intervention group had slightly more hospital days at 180 days than the usual care group (Wilcoxon test P = 0.14). | |
| 12 weeks following enrollment | Authors stated increased institutional days in control group but P value was not stated. “The control care patients were more likely to be (...) admitted to or seen in hospital”. | Intervention: 4/26 (17%) were institutionalised for mean 19.0 days (SD 21.6) Control: 6/28 (29%) were institutionalised for mean 30.7 days (SD 32.1) | |
| Three months before baseline interview | P value not stated | Hospital inpatient days Intervention, mean (SD): 4.5 (6.8) Control, mean (SD): 4.6 (7.6) | |
| During study period | P value for general medical inpatient days, P < 0.05 P value for intermediate care inpatient days P < 0.05 | Total inpatient days: Intervention, mean per patient: 51 Control, mean per patient: 47.5 General medical: Intervention, mean per patient: 13.2 Control, mean per patient: 20.7 Intermediate care: Intervention, mean per patient: 8.3 Control, mean per patient: 26.5 | |
| During study period | No difference in hospital duration between intervention and control group (P = 0.43) | Hospital duration in days, median (IQR) Intervention: 10 (6 ‐ 15) Control: 11 (6 ‐ 19) P: 0.43 | |
| Unclear | P = 0.808 | Intervention: 78 days Control: 90 days | |
| During study period | P = 0.07 | Intervention, mean (SD): 9.4 (6.27) days Control, mean (SD): 13.9 (11.5) days | |
| During study period | P value not stated | Median inpatient days (range) from enrollment to death: Intervention: 5 (0 – 50) Control: 7 (0 – 45) | |
| IQR: interquartile range | |||
| Study | Time horizon | Significance and direction | Details |
|---|---|---|---|
| During study period | P value not stated | Palliative care visits, median (range): All intervention patients had at least 2 palliative care visits during the first 2 weeks of their hospitalisation (median number of visits, 4; range, 2‐7). Intervention participants had at least 4 palliative care visits during their entire hospitalisation (median number of visits, 8; range, 4‐40). Two control patients received a palliative care consultation. A total of 41.8% (146/349) of palliative care visits occurred while a family member was present. | |
| During study period | P = 0.37 | Palliative care contact during the last acute hospital admission: Intervention: 42 patients (86%) Control: 29 patients (78%) |
| Study | Time horizon | Significance and direction | Details |
|---|---|---|---|
| During study period | P value for physician visit, P = 0.000 P value for physician, phone calls and prescriptions, P = 0.012 P value for nurse visits, P = 0.003 P value for nurse visits, phone calls and prescriptions P = 0.003 | Hospital outpatient clinic Physician visit, n, median (range): Intervention: 27, 1 (4 – 30) Control: 133, 3 (2 ‐11) Physician, phone calls and prescriptions, n, median (range): Intervention: 42, 3 (0 – 8) Control: 86, 3 (0 ‐10) Nurse visits, n, median (range): Intervention: 4, 1 (0 – 4) Control: 60, 2 (0 ‐27) Nurse, phone calls and prescriptions, n, median (range): Intervention: 8, 1 (0 – 4) Control: 44, 2 (0 ‐ 8) | |
| During study period | P values not stated | Contact with the HSPC team, (numbers): Intervention: 138 patients had at least one face‐to‐face contact Control: 13 patients had at least one face‐to‐face contact | |
| 12 weeks following enrollment | Hospital specialist visits differences and P value not stated | Hospital specialist visits: Intervention: 8 patients (35%) received; mean 1.0 contacts (SD 0.0) Control: 16 patients (76%) received; mean 1.3 contacts (SD 0.7) | |
| During study period | P value not stated | Frequency of interactions occurring between patients and providers Total number of clinic encounter records: Intervention, mean (SD): 21.9 (1.99) Control, mean (SD): 20.8 (1.92) Cardiology: Intervention, mean (SD): 2.3 (0.55) Control, mean (SD): 3.2 (1.0) Rehabilitation clinic: Intervention, mean (SD): 1.4 (0.68) Control, mean (SD): 0.9 (0.48) | |
| During study period | P values not stated | Contact with palliative care physician consultant: Intervention: 51 patients (85%) Control: 8 patients (13.3%) Contact with palliative care physician in the last month of life: Intervention: 16 patients (26.7%) Control: 6 patients (10%) | |
| During study period | P values not stated | PC visits: All the patients assigned to early palliative care, except for one patient who died within 2 weeks after enrollment, had at least one visit with the palliative care service by the 12th week. The average number of visits in the palliative care group was 4 (range, 0 to 8). Ten patients who received standard care (14%) had a palliative care consultation in the first 12 weeks of the study, primarily to address the management of symptoms, with seven patients having one visit and three having two visits. | |
| During study period | P value not stated | Mean number of palliative care visits: Intervention, mean (range): 6.54 (0 to 14) Control, mean (range): 0.89 (0 to 7) Number of palliative care visits split on lung and GI cancer: The authors stated that “we explored characteristics between patients with lung and GI cancer and found no differences in baseline measures or in the number of PC visits among those patients who received intervention. However, the GI cancer cohort had a higher proportion of male patients and a greater number of hospitalisations (P = 0.038) from baseline to week 24 compared with the lung cancer cohort". | |
| During study period | P value not stated for some of the comparisons. However, the authors reported a difference between intervention and control groups for number of consultations with a psychologist (P = 0.02) | Number of consultations from the palliative care team nurse at 18 weeks: Intervention, median (IQR): 3 (1 – 4). 82 patients (89%) had at least one consultation Control, median (IQR): 17 patients (18%) had at least one consultation PC physician at 18 weeks: Intervention: 25 patients (27%) Control: 1 patient (1%) Nurses at 24 weeks: Intervention, median (IQR): 3 (2 – 5). 55 patients (60%) had at least 3 consultations Control, median (IQR): 12 patients (13%) had at least 3 consultations PC physician at 24 weeks: Intervention: 32 patients (35%) had at least one consultation Control: 1 (1%) had one consultation Number of consultations with a psychologist: 18 weeks: Intervention: 34 patients (37%) had at least one consultation Control: 21 patients (22%) had at least one consultation 24 weeks: No difference was found between intervention and control groups. Number of consultations with other professionals: There were no differences between study groups in the number of consultations with a social care nurse (P = 0·87), dietician (P = 0·32), or specialist nurse (P = 0·28) between 18 weeks and baseline; or between 24 weeks and baseline with social care nurse (P = 0·07), dietician (P = 0·95), or specialist nurse (P = 0·99). | |
| During study period | Forwards from enrollment | Consultation with a psychiatrist: The proportions that consulted a psychiatrist (12% vs 12%) were similar in the intervention and control groups. | |
| HSPC: hospital‐based specialist palliative care | |||
| Study | Time horizon | Significance and direction | Details |
|---|---|---|---|
| Total use covering period before and after enrollment | Poisson generalised linear model P = 0.62 | Hospice use: Intervention, rate 95% CI: 0.68 (0.55 to 0.84) Control, rate 95% CI: 0.63 (0.51 to 0.78) | |
| During study period | Primary Healthcare Centre: P‐value for physician, primary healthcare centre (PHC), P = 0.027 P value for physician, phone calls and prescriptions, P = 0.000 P‐value for nurse visits, PHC, P = 0.25 P value for nurse visits, phone calls and prescriptions P = 0.010 Home: P‐value for physician visits, home, P not stated P value for nurse visits, home, P = 0.032 Within the PREFER team there were 158 additional physician visits and 1031 nurse visits at the patient’s home, and 36 phone call and/or drug prescriptions by the physician and 225 phone calls and/or prescriptions by the nurses. Summarising all this, the most striking difference was found between nurse visits in the PREFER group and the usual care group (1075 vs. 230; P =0.000). On the other hand, phone calls and prescriptions by doctors were more common in the usual care group (108 vs. 231), while physician’s visits were somewhat similar (194 vs. 201). | Primary Healthcare Centre Physician, primary healthcare centre (PHC), n, median (range): Intervention: 9, 1 (0 – 3) Control: 54, 2 (0 ‐ 8) Physician, phone calls and prescriptions, n, median (range): Intervention: 30, 1 (0 – 5) Control: 145, 1 (1 ‐ 14) Nurse visits, PHC, n, median (range): Intervention: 29, 1 (0 – 12) Control: 61, 2 (0 ‐ 14) Nurse, phone calls and prescriptions, n, median (range): Intervention: 59, 3 (0 – 9) Control: 153, 4 (1 ‐ 21) Home: Physician visits, home, n, median (range): Intervention: 0, 0 (0 – 0) Control: 14, 2 (1 ‐ 5) Nurse visits, home, n, median (range): Intervention: 11, 2 (1 – 3) Control: 109, 5 (1 ‐ 23) | |
| During study period | Days in hospice care (1of 2 sites only) t 0.52 P = 0.60 | Days in hospice care (1 of 2 sites only): descriptive data not provided | |
| During study period | P values not stated | Breathlessness intervention service: Intervention, n (%), mean (SD) contacts: 27 (96%), 1.9 (2.0) Control, n (%), mean (SD) contacts: 2 (8%), 1.5 (0.7) | |
| P values not stated | GP: Intervention, n (%), mean (SD) contacts: 10 (36%), 1.2 (0.6) Control, n (%), mean (SD) contacts: 13 (50%), 1.3 (0.5) | ||
| During study period | P values not stated | Breathlessness intervention service: Intervention, n (%), mean (SD) contacts: 39 (95%), 2.1 (1.0) Control, n (%), mean (SD) contacts: 2 (5%), 1.5 (0.7) | |
| P values not stated | GP: Intervention, n (%), mean (SD) contacts: 25 (61%), 1.8 (1.2) Control, n (%), mean (SD) contacts: 24 (63%), 1.6 (0.7) | ||
| 6 months post‐index hospitalisation | P = 0.09 Continuous measures for intervention and control patients were compared using t tests for normally distributed measures and Wilcoxon two‐sample tests for measures with skewed distributions | Study enrollment to hospice admission (days), median (IQR): Intervention: 2 (0, 23) Control: 3 (0, 37) | |
| P = 0.04 Continuous measures for intervention and control patients were compared using t tests for normally distributed measures and Wilcoxon two‐sample tests for measures with skewed distributions. | Hospice length of stay (days), median (IQR) Intervention: 24 (7, 94) Control: 12 (4, 48) | ||
| P = 0.5 Categorical measures were tested using 2 tests or Fisher’s exact test. | Patients admitted to hospice, n (%): Intervention: 103 (37.1%) Control: 96 (40.7%) | ||
| During study period | Fisher’s exact test P = 0.85 Chi2 test P = 0.93 | Hospice use at 180 days: Intervention: 28% Control: 25% | |
| 12 weeks following enrollment | General practice: Authors stated less GP contact in intervention group but P values not stated District/practice nurse: P values not stated MS nurse: Authors stated there were no differences (P values not stated) Social services: P values not stated Specialist home visit: P values not stated | General practice: Intervention: 8 (35%) received; M 3.8 contacts (SD 0.5) Control: 11 (52%) received; M 3.4 contacts (SD 1.2) “Control care patients were more likely to be in contact with general practitioners” District/practice nurse: Intervention: 20 (87%) received; M 12.3 contacts (SD 19.7) Control: 13 (62%) received; M 31.9 contacts (SD 50.7) MS nurse: Intervention: 11 (48%) received; M 1.8 contacts (SD 1.8) Control: 7 (33%) received; M 1.1 contacts (SD 0.2) “Receipt of MS nurses was similar in the two groups”. Social services: Intervention: 10 (43%) received; M 6.4 contacts (SD 7.7) Control: 8 (38%) received; M 4.1 contacts (SD 2.4) Specialist home visit: Intervention: 5 (22%) received; M 5.2 contacts (SD 4.5) Control: 0 received Note: authors stated that specialist home visits were most likely to be from the intervention home palliative care team. | |
| During study period | P value not stated | Days at home: Intervention, mean per patient: 44.8 Control, mean per patient: 37.9 | |
| During study period | No difference as increment, mean (95% CI) = 1 (‐6.8, 8.6) | Days at home: Intervention, mean (95% CI): 13.1 (8.5, 17.7) Control, mean (95% CI): 12.1 (5.9, 18.4) | |
| During study period | P values not stated | Frequency of interactions occurring between patients and providers Primary care: Intervention, mean (SD): 4.4 (0.93) Control, mean (SD): 5.2 (0.82) | |
| Hospice use within 6 months of study hospitalisation | Survival analysis using proportional hazards regression P = 0.36 | There was no significant association between study group assignment and hospice use within 6 months (adjusting for age, gender, and marital status). | |
| During study period | P = 0.09 | Median duration of hospice care: Intervention: 11 days Control: 4 days | |
| CI: | |||
| Study | Time horizon | Significance and direction | Details |
|---|---|---|---|
| During study period | P value not stated | Breathlessness intervention service: Intervention, n (%), mean (SD) contacts: 22 (79%), 20.3 (20.8) Control, n (%), mean (SD) contacts: 25 (96%), 23.4 (25.2) | |
| 12 weeks following enrollment | P value not stated | Care by informal caregiver: Intervention: 15/23 (65%) received; Mean 152.5 contacts (SD 53.7) Control: 16/21 (76%) received; Mean 151.1 contacts (SD 57.7) | |
| n: number | |||
| Study | Time horizon | Significance and direction | Details |
|---|---|---|---|
| During study period | Pearson chi2 test P = 0.79 | New feeding tube Intervention: 22 (45.8%) Control: 22 (43.1%) | |
| Pearson chi2 test P = 0.66 | Total feeding tube Intervention: 34 (70.8%) Control: 34 (66.7%) | ||
| Pearson chi2 test P = 0.44 | Mechanical ventilation Intervention: 2 (4.2%) Control: 4 (7.8%) | ||
| Not calculated because expected frequencies < 5 in at least 2 cells | Tracheostomy Intervention: 0 Control: 1 | ||
| Not calculated because expected frequencies < 5 in at least 2 cells | CPR Intervention: 0 Control: 3 (5.9%) | ||
| Pearson chi2 test P = 0.16 | Systemic antibiotics (unclear if mean or median presented) Intervention: 73 (79.3) Control: 69 (70.4) | ||
| Interventions during 190 admissions | |||
| Pearson chi2 test P = 0.025 | IV for entire admission (unclear if mean or median presented) Intervention: 61 (66) Control: 79 (81) | ||
| Pearson chi2 test P = 0.30 | Indwelling urinary catheter (unclear if mean or median presented) Intervention: 41 (44.6) Control: 51 (52) | ||
| Pearson chi2 test P = 0.33 | Mechanical restraints (unclear if mean or median presented) Intervention: 13 (54.2) Control: 11 (45.8) | ||
| Student’s t‐test P = 0.14 | Days with restraints (mean) Intervention: 5.18 Control: 6.56 | ||
| Pearson chi2 test P = 0.089 | Daily phlebotomy for at least 50% of admission (unclear if mean or median presented) Intervention: 32 (34.8) Control: 46 (46.9) | ||
| Pearson chi2 test P = 0.461 | Daily sc/im injection for at least 50% of admission (unclear if mean or median presented) Intervention: 16 (17.4) Control: 21 (21.6) | ||
| ns Pearson chi2 test P = 0.12 | >1 complex non‐invasive test (unclear if mean or median presented) Intervention: 10 (11) Control: 4 (4) | ||
| ns Pearson chi2 test P = 0.215 | >1 invasive test (unclear if mean or median presented) Intervention: 5 (4.3) Control: 2 (2) | ||
| Pearson chi2 test P = 0.15 | Number of fingersticks per day in patients receiving insulin (unclear if mean or median presented) Intervention: 1.56 Control: 2.01 | ||
| Decisions to forgo treatments | |||
| Not calculated because expected frequencies < 5 in at least 2 cells | Enteral feeds Intervention: 3 (6.3%) Control: 4 (7.8%) | ||
| Not calculated because expected frequencies < 5 in at least 2 cells | Mechanical ventilation Intervention: 3 (6.3%) Control: 0 | ||
| Not calculated because expected frequencies < 5 in at least 2 cells | Intravenous lines Intervention: 5 (10.4%) Control: 1 (2%) | ||
| Not calculated because expected frequencies < 5 in at least 2 cells | Blood draws Intervention: 4 (8.3%) Control: 0 | ||
| Not calculated because expected frequencies < 5 in at least 2 cells | Antibiotics Intervention: 3 (6.3%) Control: 0 | ||
| Pearson chi2 test P = 0.65 | CPR in‐hospital (unclear if mean or median presented) Intervention: 62 (67.4) Control: 63 (64.3) | ||
| Pearson chi2 test P = 0.10 | CPR nonhospital (unclear if mean or median presented) Intervention: 47 (51.1) Control: 38 (38.8) | ||
| During study period | P = 0.34 Referral to hospice care Fisher exact test P = 0.75 | Referral to palliative care Intervention: 34/145 (23.4%) Control: 39/134 (29.1%) Referral to hospice care Intervention: 6/161 (3.7%) Control: 4/161 (2.5%) | |
| Total use covering period before and after enrollment | Poisson generalised linear model P = 0.54 | Chemotherapy in last 2 weeks of life Intervention, rate (95% CI): 0.08 (0.03 to 0.2) Control, rate (95% CI): 0.05 (0.02 to 0.15) | |
| During study period | Referral to hospice care (1of 2 sites only) Chi2 P = 0.15 Days in hospice care (1of 2 sites only) t 0.52 P = 0.60 | Referral to hospice care (1 of 2 sites only) Intervention: 25% Control: 36% Days in hospice care (1 of 2 sites only) descriptive data not provided | |
| Interviewed surrogate decision‐makers immediately after the second support and information team meeting for the intervention group and 10 days after randomisation for the control group, unless the patient had died. All surrogate decision‐makers were interviewed again by telephone for follow‐up beginning 90 days after randomisation. | Total ventilator days, P = 0.59 After randomisation, P = 0.42 | Ventilator days Total Intervention, median (IQR): 19 (15 to 31) Control, median (IQR): 21 (14 to 35) After randomisation Intervention, median (IQR): 10 (5 to 20) Control, median (IQR): 12 (5 to 27) | |
| Interviewed surrogate decision‐makers immediately after the second support and information team meeting for the intervention group and 10 days after randomisation for the control group, unless the patient had died. All surrogate decision‐makers were interviewed again by telephone for follow‐up beginning 90 days after randomisation. | P = 0.62 | Hospital discharge disposition (81 patients discharged from the hospital in intervention group and 75 in control group). Home Intervention, median (IQR): 15 (19) Control, median (IQR): 18 (24) Home with paid assistance: Intervention, median (IQR): 10 (12) Control, median (IQR): 7 (9) Hospice Intervention, median (IQR): 3 (4) Control, median (IQR): 4 (5) Acute rehabilitation facility Intervention, median (IQR): 22 (27) Control, median (IQR): 15 (20) Long‐term acute care hospital Intervention, median (IQR): 12 (15) Control, median (IQR): 12 (16) Other acute care facility Intervention, median (IQR): 0 Control, median (IQR): 1 (1) Skilled nursing facility Intervention, median (IQR): 19 (23) Control, median (IQR): 16 (21) Other Intervention, median (IQR): 0 Control, median (IQR): 2 (3) | |
| During study period | P value not stated | Other hospital care Intervention, n (%), mean (SD) contacts: 15 (54%), 1.5 (0.8) Control, n (%), mean (SD) contacts: 14 (54%), 1.4 (0.6) | |
| P value not stated | Nurse Intervention, n (%), mean (SD) contacts: 11 (39%), 3.0 (3.8) Control, n (%), mean (SD) contacts: 12 (46%), 1.8 (1.6) | ||
| P value not stated | Other health professionals Intervention, n (%), mean (SD) contacts: 5 (18%), 1.2 (0.4) Control, n (%), mean (SD) contacts: 3 (12%), 1.0 (0.0) | ||
| Social care Intervention, n (%), mean (SD) contacts: 4 (14%), 4.3 (6.5) Control, n (%), mean (SD) contacts: 3 (12%), 15.7 (22.9) | |||
| During study period | P value not stated | Other hospital services Intervention, n (%), mean (SD) contacts: 20 (49%), 1.7 (1.0) Control, n (%), mean (SD) contacts: 19 (50%), 2.5 (3.5) | |
| P value not stated | Nurse Intervention, n (%), mean (SD) contacts: 21 (51%), 2.7 (3.3) Control, n (%), mean (SD) contacts: 16 (42%), 2.5 (2.5) | ||
| P value not stated | Other health services Intervention, n (%), mean (SD) contacts: 14 (34%), 1.5 (1.1) Control, n (%), mean (SD) contacts: 4 (11%), 1.0 (0.0) | ||
| P value not stated | Social and other care Intervention, n (%), mean (SD) contacts: 8 (20%), 5.4 (4.6) Control, n (%), mean (SD) contacts: 9 (24%), 11.3 (22.8) | ||
| During study period | P value not stated | Telephone contact with the HSPC team, n Intervention: 116 patients had at least one telephone contact Control: 9 patients had at least one telephone contact | |
| 12 weeks after enrollment | P value not stated | Palliative care nurse Intervention: 9 (39%) received; M 3.0 (SD 1.5) Control: 0 received Other nurse Intervention: 7 (30%) received; M 40.0 (SD 63.8) Control: 7 (33%) received; M 95.0 (SD 79.6) Specialist (ward) Intervention: 5 (22%) received; M 1.0 (SD 0.0) Control: 7 (33%) received; M 9.6 (SD 12.1) Specialist (other) Intervention: 4 (17%) received; M 1.1 (SD 0.3) Control: 5 (24%) received; M 1.0 (SD 0.0) Occupational therapist/physiotherapist Intervention: 16 (70%) received; M 10.6 (SD 9.9) Control: 14 (67%) received; M 22.5 (SD 47.7) Dietitian/chiropodist Intervention: 12 (52%) received; M 3.5 (SD 2.5) Control: 13 (62%) received; M 2.6 (SD 1.3) Day centre Intervention: 5 (22%) received;M 20.2(SD 21.0) Control: 5 (24%) received; M 20.4 (SD 15.9) Respite care Intervention: 2 (9%) received; M 9.5 (SD 0.7) Control: 5 (24%) received; M 10.0 (SD 5.9) | |
| During study period | P = 0.819 | Use of antibiotics The use of antibiotics (for exacerbations not leading to hospital admission) did not differ between groups during the observation period. | |
| During study period | Major surgical procedures P < 0.05 | Major surgical procedures Intervention, mean per patient: 0.09 Control, mean per patient: 0.01 Minor surgical procedures Intervention, mean per patient: 0.42 Control, mean per patient: 0.30 | |
| Over 80% of both hospice and control patients had no radiation treatments. However, those few who did had as many as 48 treatments, hence the large number. | Radiation treatments Intervention, mean per patient: 7.4 Control, mean per patient: 7.7 | ||
| P = 0.03 | Chemotherapy treatments Intervention, mean per patient: 1.3 Control, mean per patient: 0.49 | ||
| Markgren 2016 (linked to Brannstrom 2014) | During study period | Only the change in patients receiving full target doses of the ACEIs/angiotensin receptor blockers, BBs and MRAs were higher (P = 0.0009) in the intervention arm than in the control arm. | Prescribed medication use In the intervention arm, the percentages of angiotensin converting enzyme inhibitors (ACEIs) and mineralocorticoid receptor antagonists (MRAs) increased at the end of the study from baseline, while loop diuretics decreased. Beta‐receptor blockers (BBs) decreased somewhat in both groups. The number of patients treated with MRAs differed the most between groups, and increased from 10 (28%) to 15 (48%) in the PREFER arm compared with 13 (35%) vs 13 (39%) in the control group. The change in patients receiving full target doses (+8 vs. +1) of the ACEIs/angiotensin receptor blockers, BBs and MRAs were higher (P = 0.0009) in the intervention arm than in the control arm. |
| During study period | CRT device, P = 0.3 ACE1/ARB device, P = 0.2 Diuretics, P = 0.2 Spironolactone/eplerenone, P = 0.9 Beta‐blockers, P = 0.4 | Medications (prescription and over‐the‐counter) in the medication list of patients Guideline‐driven HF therapies CRT device Intervention: 20% Control: 35.7% ACE1/ARB Intervention: 60% Control: 35.7% Diuretics Intervention: 86.7% Control: 64.3% Spironolactone/eplerenone Intervention: 26.7% Control: 28.6% Beta‐blockers Intervention: 66.7% Control: 50% Medications for other conditions Cholesterol‐lowering medication Intervention: 73.3% Control: 50% Anti‐anginal Intervention: 20% Control: 14.3% Diabetes medication Intervention: 13.3% Control: 14.3% Antidepressants Intervention: 20% Control: 28.6% Pain medication (NSAIDS and opioids) Intervention: 53.3% Control: 21.4% Anxiety medication Intervention: 0 Control: 7.1% Constipation Intervention: 26.7% Control: 28.6% | |
| During study period | P value not stated | Referral to palliative care Intervention: 22 (100%) Control: 1 (5%) Referral to social work Intervention: 22 (100%) Control: 20 (100%) Referral to psychiatry Intervention: 1 (4.5%) Control: 1 (5%) | |
| During study period | P value not stated | Frequency of interactions occurring between patients and providers Total number of hospital encounter records Intervention, mean (SD): 2.5 (0.45) Control, mean (SD): 2.4 (0.35) Telephone contact Intervention, mean (SD): 12.6 (1.2) Control, mean (SD): 10.6 (0.88) | |
| During study period | P = 0.05 | Aggressive end‐of‐life care among 105 decedents (chemotherapy within 14 days before death, no hospice care, or admission to hospice 3 days or less before death) Intervention: 54% Control: 33% | |
| Chemotherapy within 30 days of death Intervention: 32.5% Control: 42% | |||
| ACEI: | |||
| Studies | Participants interviewed | Qualitative approach | Findings of the qualitative study | Findings of the quantitative component |
|---|---|---|---|---|
| Bajwah 2015 (patients with interstitial lung disease (ILD)) | 5 patients 5 carers 1 ILD consultant 1 ILD CNS 1 community matron 1 community palliative care nurse 1 GP | Semi‐structured interviews analysed using a constant comparison approach within framework analysis | Findings: Patients and carers interviewed valued the case conference as they felt that it "laid everything on the table" and importantly addressed concerns and anxieties that had been playing on patients’ and carers’ minds. The qualitative work also identified lack of early referral to palliative care by community health professionals, despite requests from patients and carers, and some gatekeeping by hospital health professionals. Themes from patients: Support in the community Crisis management Palliative care, psychological support Advance care planning Themes from health professionals: GPs ‐ collaboration of care and efficiency Community palliative care clinical nurse specialist – individual care plans and practical problems addressed ILD consultant – symptom control ILD CNS – empowering health professionals | Primary outcome: Symptom burden Mean (SD) POS scores at 4 weeks were ‐5.7 (7.5) fast‐track vs ‐0.4 (8.0) control, (mean change difference between the two arms was ‐5.3 (95% CI ‐9.8 to ‐0.7) independent t test P = 0.02); effect size (95% CI) ‐0.7 (‐1.2 to ‐0.1). Secondary outcomes: The secondary outcomes of quality of life, anxiety and depression were superior in the fast‐track arm, and none were worse. |
| Bakitas 2013 (linked to Bakitas 2009) (ENABLE II) (cancer patients) | 35 oncology clinicians comprising 21 physicians and 14 nurse practitioner | Semi‐structured interviews analysed using thematic analysis | Findings: Oncologists believed that integrating palliative care at the time of an advanced cancer diagnosis enhanced patient care and complemented their practice. Five themes comprised oncologists' views on the complementary role of palliative care: (1) “refer early and often,” (2) referral challenges: “palliative” equals “hospice”; “Heme patients are different,” (3) palliative care as consultants or co‐managers, (4) palliative care “shares the load,” and (5) ENABLE II facilitated palliative care integration. Self‐assessment of their practice with advanced cancer patients comprised four themes: (1) treating the whole patient, (2) focussing on quality versus quantity of life, (3) “some patients just want to fight,” and (4) helping with transitions; timing is everything. | Primary outcomes: Quality of life: The estimated treatment effects (intervention minus usual care) for all participants were a mean (SE) of 4.6 (2) for quality of life (P = 0.02) Symptom intensity The estimated treatment effects (intervention minus usual care) for all participants were a mean (SE) of ‐27.8 (15) for symptom intensity (P = 0.06) Resource use: Intensity of service did not differ between the 2 groups. Secondary outcomes: The estimated treatment effects (intervention minus usual care) for all participants were a mean (SE) of ‐1.8 (0.81) for depressed mood (P = 0.02). |
| Maloney 2013 (linked to Bakitas 2009 ) (ENABLE II) (cancer patients) | 53 patients (28 females included) | Semi‐structured interviews analysed using thematic analysis | Findings: Participants' perceptions of intervention benefits were represented by four themes: enhanced problem‐solving skills, better coping, feeling empowered, and feeling supported or reassured. Three themes related to trial participation: helping future patients and contributing to science, gaining insight through completion of questionnaires, and trial/intervention aspects to improve. Participants did not describe participation as burdensome but rather described some inconveniences or disappointments such as non‐attendance of meetings by other participants and disappointment at not being randomised to the intervention group. | Primary outcomes: Quality of life: The estimated treatment effects (intervention minus usual care) for all participants were a mean (SE) of 4.6 (2) for quality of life (P = 0.02) Symptom intensity The estimated treatment effects (intervention minus usual care) for all participants were a mean (SE) of ‐27.8 (15) for symptom intensity (P = 0.06) Intensity of service did not differ between the 2 groups. Secondary outcomes: The estimated treatment effects (intervention minus usual care) for all participants were a mean (SE) of ‐1.8 (0.81) for depressed mood (P = 0.02). |
| Talabani 2017 (linked to Brannstrom 2014) (heart failure (HF) patients) | 12 patients from the intervention group (8 men included) | Semi‐structured interviews analysed using content analysis | Findings: Two themes and a total of five categories were identified. The first theme was feeling secure and safe through receiving care at home with the categories: having access to readily available care at home, being followed up continuously and having trust in the team members' ability to help. The second theme was being acknowledged as both a person and a patient, with the following two categories: being met as a person, participating in decisions about one's care and receiving help for symptoms of both HF and comorbidities. The team also offered relatives support, which patients appreciated. | Outcomes: Quality of life: Between‐group analysis revealed that patients receiving HSPC had improved HRQoL compared with controls (57.6 ± 19.2 vs. 48.5 ± 24.4, age‐adjusted P = 0.05). Within‐group analysis revealed a 26% improvement in the HSPC group for HRQoL (P = 0.046) compared with 3% (P = 0.82) in the control group. Quality of life improved by 24% (P = 0.047). Symptom burden: Total symptom burden improved by 18% (P = 0.035) Resource use: Fifteen rehospitalisations (103 days) occurred in the HSPC group, compared with 53 (305 days) in the control group. |
| Farquhar 2014 (cancer patients) | 20 patients (and associated carers) | Semi‐structured interviews analysed using framework analysis | Findings: Breathlessness intervention service (BIS) reduced fear and worry, and increased confidence in managing breathlessness. Patients and carers consistently identified specific and repeatable aspects of the BIS model and interventions that helped. The multidisciplinary staff expertise was repeatedly noted. How interventions were delivered was important with a suggestion that the intervention was delivered through the provision of knowledge, with specialist expertise, which increased patients’ and carers’ confidence. BIS legitimised breathlessness and increased knowledge whilst making patients and carers feel ‘not alone’. | Primary outcome: BIS reduced patient distress due to breathlessness (primary outcome: −1.29; 95% CI −2.57 to −0.005; P = 0.049) significantly more than the control group; 94% of respondents reported a positive impact (51/53) Secondary outcomes: Mean CRQ mastery scores improved only negligibly in the intervention arm and remained stable for controls. No differences were found between trial arms on other CRQ domains (dyspnoea, fatigue or emotional function). Mean anxiety scores (HADS) remained fairly stable (both arms). Mean depression scores decreased slightly in the intervention arm, increasing slightly for controls. There was little change in other patient or carer outcomes. BIS had a 66% likelihood of better outcomes in terms of reduced distress due to breathlessness at lower health/social care costs than standard care (81% with informal care costs included). |
| Farquhar 2016 (Non‐cancer (mostly COPD) | 20 patients (and associated carers) | Semi‐structured interviews analysed using framework analysis | Findings: Patients with non‐malignant conditions and their carers described a range of impacts including reduced fear, anxiety, worry, and feelings of panic, as well as feeling more confident about breathlessness. They valued the multidisciplinary staff expertise (their knowledge and understanding of life with breathlessness), the characteristics of the BIS staff (their approachability and attentiveness) and their reassuring and positive approach, and the time BIS gave them to talk about breathlessness with an expert. They reported that being seen at home was especially helpful. The findings suggest that it was not only the provision of these interventions that was important, but also that how they were delivered was key to their impact: delivery of interventions through the provision of knowledge (why and how interventions work or specific guidance on how and when to use a particular intervention) increased patients’ and carers’ confidence. | Primary outcome: There was no difference between groups in the primary outcome ("distress due to breathlessness"), when compared to standard care, of –0.24 (95 % CI: –1.30, 0.82). Secondary outcomes: Mean CRQ mastery scores improved slightly on both arms with greater improvement in the intervention arm. No differences were found between trial arms on other CRQ domains (dyspnoea, fatigue or emotional function). Mean patient anxiety scores decreased slightly for the intervention arm and increased slightly for the control arm and mean depression scores decreased slightly in the intervention arm and remained stable for controls; no between‐group difference was found. Mean anxiety scores for carers achieved a greater, 1.65‐point, reduction in the intervention arm compared with a 0.15‐point reduction for controls, adjusted difference of –1.22 (95 % CI: –2.84 to 0.40), P = 0.14. There was little change in other patient or carer secondary outcomes. Carers of patients randomised to the intervention arm achieved a greater, 1.03‐point, reduction in their distress due to their patient’s breathlessness compared with a 0.2‐point increase for controls, adjusted difference of –0.42 (95 % CI: –1.86 to 1.02), P = 0.56. BIS resulted in extra mean costs of GBP799, reducing to GBP100 when outliers were excluded. |
| Hopp 2016 (patients with heart failure) | 85 patients | Unclear although the authors stated that clinical records were qualitatively reviewed | Findings: Patients expressed concerns about hospital palliative care as it might prevent them from receiving more aggressive treatment. Most patients did not engage with advanced care options. | Primary outcome: There was no difference between groups in the primary outcome (election vs non‐election of measure of comfort‐oriented care) (difference 9.3%, 95% CI ‐11.8% to 30%; P = 0.12). |
| Veron 2018 (linked to Janssens 2019) (COPD patients) | 18 patients (44.4% females) | Semi‐structured interviews analysed using thematic content analysis | Findings: Patients described poor recollection of the RCT and difficulties understanding the palliative care intervention. No major differences were observed between patients who received the specialised intervention and those who did not. Content analysis emphasised that although they experienced disabling symptoms, participants tended to attribute their limitations to problems other than COPD and some declared that they were not sick. Patients reported restrictions due to oxygen therapy, and the burden of becoming dependent on it. This dependence resulted in intense anxiety, leading participants to focus on the present only. A strong feeling of perceived helplessness emerged from the patients' interviews. | Primary outcomes: Patients in the HSPC group were hospitalised for respiratory failure (incidence rate ratio (IRR) 1.87, 95% CI 1.04 to 3.48, P = 0.026) and admitted to the emergency ward (IRR 2.05, 95% CI 1.11 to 3.94, P = 0.014) twice as often during follow‐up than the control group. However, after the Benjamini and Hochberg correction for multiple testing, none of these differences was significant. Furthermore, median values were identical in both groups (hospitalisation: median (IQR): 0.0 (1 to 2) vs. 1.5 (1 to 4), P = 0.219; admissions to emergency wards: 1.0 (0; 3) vs. 1.0 (0; 4), P = 0.484). Secondary outcomes: There was no difference in HRQoL assessed using the SF‐36 between the HSPC and control group. There was no difference in anxiety and depression measured by the HADS‐anxiety and HADS‐depression between the intervention and control group. At inclusion, 3 patients in each group had completed their advanced care planning (ACP) directives (P = 1.00). At the end of the study, 9 patients (35%) of the intervention group versus 3 (13%) of the control group had completed ACP directives (P = 0.194). There was therefore a difference in the number of patients who wrote their ACP directives in favour of the intervention group (P = 0.023). Survival did not differ between the groups (P = 0.913). 8 deaths occurred, 4 in each group. In the intervention group, survival was 454 days (1.24 years; 95% CI: 382 to 525 vs. 425 days (1.16 years; 95% CI: 339 to 509) in the control group; P = 0.592. |
| Lowther 2018 (linked to Lowther 2015) (HIV patients) | 20 patients (predominantly females (85%)) from the intervention group | Semi‐structured interviews analysed using thematic content analysis | Findings: Patients reported that having time to talk, appropriate pain medication and effective health education was of therapeutic value for their psychological well‐being. Integration of mixed method findings suggested that positive effect in quantitative measures of mental health and well‐being were attributable to the active ingredients of: appropriate medication, effective health education and counselling, and having time to talk in clinical encounters. Mechanisms of action included symptom relief, improved understanding of illness and treatment, and support focussed on articulated concerns. Participants whose quality of life remained static or deteriorated reported concurrent intractable physical or social problems which prevented them from fulfilling their social roles and led to financial difficulties. This in turn led to stress, which was a barrier to positive psychological well‐being. | Primary outcome: In the control group, median pain score on the pain item of the APOS (range: 0 to 5; 0 indicates worst pain) improved from 1.0 (IQR 0.0 to 2.0) at baseline to 5.0 (3.0 to 5.0) at 4 months; in the HSPC group, it improved from 1.0 (0.0 to 2.0) at baseline to 4.5 (3.0 to 5.0) at 4 months. There was no between‐group difference (coefficient ‐0.01, 95% CI ‐0.36 to 0.34, P = 0.95). Secondary outcomes: Person‐centred assessment and care delivered by staff who had received additional training had positive effects on self‐reported mental health‐related quality of life and psychosocial well‐being. |
| Giovannetti 2018 (linked to Solari 2018) (multiple sclerosis) | 12 patients, 15 caregivers, 8 physicians and nine members of HSPC team | Semi‐structured interviews analysed using framework method | Findings: Three themes emerged from the interviews: 'expectations,' 'met and unmet needs', and 'barriers'. Participants described benefits from the intervention such as improved control of symptoms and reduced sense of isolation of the patient‐caregiver dyads. Patient‐caregiver dyads valued the expertise of the HSPC team. Limitations identified that included factors related to experimental design (difficulty of dyads in identifying examiner and team roles, additional burden for caregivers); team issues (insufficient team building/supervision, competing priorities); limitations of the intervention itself (insufficient length, lack of rehabilitation input); and external factors (resource limitations, under‐responsive services/professionals). The referring physician focus groups provided little experiential data. | Primary outcomes: There was greater reduction in symptom burden (POS‐S‐MS) in the HSPC group compared to usual care (P = 0.047). Effect size was 0.20 at 3 months and 0.32 at 6 months. Changes in quality of life (SEIQoL‐DW index) did not differ between the two groups. Secondary outcomes: There were no differences between the secondary patient (POS, HADS, FIM total score) and carer outcomes (ZBI) at three and six months. There were 22 serious adverse events in 20 patients, 15 events in 13 patients in the HSPC group (30%) and 7 events in 7 patients in the control group (27%; P = 0.78). |
| Slota 2014 (linked to Wallen 2012) (cancer patients) | In Wallen 2012, n was unclear while Slota 2014 had 34 participants | Open‐ended, qualitative questions on a questionnaire. Method of analysis stated in Wallen 2012 was transcript‐based analysis while thematic analysis was stated in Slota 2014 | Findings: Patients identified consistent communication, emotional support, and pain and symptom management as positive contributions delivered by the intervention. Consistent communication was described in terms of the team as a whole and their focus on individualising patients’ pain and comfort needs. When describing emotional support or 'being there' participants emphasised the support and reassurance they felt knowing the Pain and Palliative Care Team was available across time. They saw team members as their advocates. | Primary outcomes and secondary outcomes: There was no difference between HSPC and control group. However, for those who remained on study for 12 months, the HSPC group performed better than their standard of care counterparts. |
| ACP: | ||||
| Outcome or subgroup title | No. of studies | No. of participants | Statistical method | Effect size |
| 1.1 HSPC versus usual care on patient HRQoL: adjusted endpoint values Show forest plot | 10 | 1344 | Std. Mean Difference (IV, Random, 95% CI) | 0.26 [0.15, 0.37] |
| 1.2 HSPC versus usual care on patient HRQoL: adjusted endpoint values (excluding McCorkle 2015) Show forest plot | 9 | 1280 | Std. Mean Difference (IV, Random, 95% CI) | 0.29 [0.18, 0.40] |
| 1.3 HSPC versus usual care on patient HRQoL: unadjusted endpoint values Show forest plot | 9 | 1201 | Std. Mean Difference (IV, Random, 95% CI) | 0.41 [0.11, 0.70] |
| 1.4 HSPC versus usual care on patient HRQoL: unadjusted endpoint values (excluding McCorkle 2015) Show forest plot | 8 | 1137 | Std. Mean Difference (IV, Random, 95% CI) | 0.46 [0.13, 0.78] |
| 1.5 HSPC versus usual care on patient HRQoL: unadjusted change values Show forest plot | 9 | 1278 | Std. Mean Difference (IV, Random, 95% CI) | 0.67 [0.16, 1.18] |
| Outcome or subgroup title | No. of studies | No. of participants | Statistical method | Effect size |
| 2.1 HSPC versus usual care on patient symptom burden: adjusted endpoint values Show forest plot | 6 | 761 | Std. Mean Difference (IV, Random, 95% CI) | ‐0.26 [‐0.41, ‐0.12] |
| 2.2 HSPC versus usual care on patient symptom burden: unadjusted endpoint values Show forest plot | 6 | 833 | Std. Mean Difference (IV, Random, 95% CI) | ‐0.17 [‐0.54, 0.20] |
| 2.3 HSPC versus usual care on patient symptom burden: unadjusted endpoint values (excluding McCorkle 2015) Show forest plot | 5 | 769 | Std. Mean Difference (IV, Random, 95% CI) | ‐0.19 [‐0.62, 0.24] |
| 2.4 HSPC versus usual care on patient symptom burden: adjusted change values Show forest plot | 4 | 353 | Std. Mean Difference (IV, Random, 95% CI) | ‐1.31 [‐3.27, 0.64] |
| 2.5 HSPC versus usual care on patient symptom burden: adjusted change values (excluding McCorkle 2015) Show forest plot | 3 | 289 | Std. Mean Difference (IV, Random, 95% CI) | ‐1.79 [‐4.29, 0.70] |
| 2.6 HSPC versus usual care on patient symptom burden: unadjusted change values Show forest plot | 6 | 641 | Std. Mean Difference (IV, Random, 95% CI) | ‐0.44 [‐0.94, 0.06] |
| Outcome or subgroup title | No. of studies | No. of participants | Statistical method | Effect size |
| 3.1 HSPC versus usual care on patient satisfaction with care: adjusted endpoint values Show forest plot | 2 | 337 | Std. Mean Difference (IV, Random, 95% CI) | 0.36 [0.14, 0.57] |
| Outcome or subgroup title | No. of studies | No. of participants | Statistical method | Effect size |
| 4.1 HSPC versus usual care on home deaths Show forest plot | 7 | 861 | Odds Ratio (M‐H, Random, 95% CI) | 1.63 [1.23, 2.16] |
| Outcome or subgroup title | No. of studies | No. of participants | Statistical method | Effect size |
| 5.1 HSPC versus usual care on pain: adjusted endpoint values Show forest plot | 4 | 525 | Std. Mean Difference (IV, Random, 95% CI) | ‐0.16 [‐0.33, 0.01] |
| 5.2 HSPC versus usual care on pain: adjusted change values Show forest plot | 2 | 218 | Std. Mean Difference (IV, Random, 95% CI) | ‐0.47 [‐0.74, ‐0.20] |
| 5.3 HSPC versus usual care on pain: unadjusted change values Show forest plot | 2 | 291 | Std. Mean Difference (IV, Random, 95% CI) | ‐0.93 [‐3.05, 1.19] |
| Outcome or subgroup title | No. of studies | No. of participants | Statistical method | Effect size |
| 6.1 HSPC versus usual care on patient anxiety: adjusted endpoint values Show forest plot | 5 | 384 | Mean Difference (IV, Random, 95% CI) | ‐0.63 [‐2.22, 0.96] |
| 6.2 HSPC versus usual care on patient anxiety: adjusted endpoint values (excluding McCorkle 2015) Show forest plot | 4 | 320 | Mean Difference (IV, Random, 95% CI) | ‐1.60 [‐2.56, ‐0.65] |
| 6.3 HSPC versus usual care on patient anxiety: unadjusted endpoint values Show forest plot | 4 | 273 | Mean Difference (IV, Random, 95% CI) | ‐0.90 [‐2.52, 0.71] |
| 6.4 HSPC versus usual care on patient anxiety: unadjusted endpoint values (excluding McCorkle 2015) Show forest plot | 3 | 209 | Mean Difference (IV, Random, 95% CI) | ‐1.48 [‐3.52, 0.56] |
| 6.5 HSPC versus usual care on patient anxiety: unadjusted change values Show forest plot | 4 | 496 | Std. Mean Difference (IV, Random, 95% CI) | ‐0.62 [‐1.02, ‐0.21] |
| 6.6 HSPC versus usual care on patient anxiety in different populations: adjusted endpoint values Show forest plot | 5 | 384 | Mean Difference (IV, Random, 95% CI) | ‐0.63 [‐2.22, 0.96] |
| 6.6.1 Cancer populations | 3 | 275 | Mean Difference (IV, Random, 95% CI) | ‐0.65 [‐3.03, 1.74] |
| 6.6.2 Non‐cancer populations | 2 | 109 | Mean Difference (IV, Random, 95% CI) | ‐0.82 [‐2.45, 0.80] |
| 6.7 HSPC versus usual care on patient anxiety in different populations: adjusted endpoint values (excluding McCorkle 2015) Show forest plot | 4 | 320 | Mean Difference (IV, Random, 95% CI) | ‐1.60 [‐2.56, ‐0.65] |
| 6.7.1 Cancer populations | 2 | 211 | Mean Difference (IV, Random, 95% CI) | ‐1.91 [‐3.12, ‐0.70] |
| 6.7.2 Non‐cancer populations | 2 | 109 | Mean Difference (IV, Random, 95% CI) | ‐0.82 [‐2.45, 0.80] |
| 6.8 EPC vs LPC on patient anxiety: adjusted endpoint values Show forest plot | 5 | 384 | Mean Difference (IV, Random, 95% CI) | ‐0.63 [‐2.22, 0.96] |
| 6.8.1 Early palliative care (EPC) | 2 | 221 | Mean Difference (IV, Random, 95% CI) | ‐0.57 [‐3.94, 2.79] |
| 6.8.2 Late palliative care (LPC) | 3 | 163 | Mean Difference (IV, Random, 95% CI) | ‐0.81 [‐2.14, 0.52] |
| 6.9 Effect of MDT‐led services on patient anxiety: adjusted endpoint values Show forest plot | 5 | 384 | Mean Difference (IV, Random, 95% CI) | ‐0.63 [‐2.22, 0.96] |
| 6.9.1 MDT‐led services | 5 | 384 | Mean Difference (IV, Random, 95% CI) | ‐0.63 [‐2.22, 0.96] |
| 6.10 Effect of MDT‐led services on patient anxiety: adjusted endpoint values (excluding McCorkle 2015) Show forest plot | 4 | 320 | Mean Difference (IV, Random, 95% CI) | ‐1.60 [‐2.56, ‐0.65] |
| 6.10.1 MDT‐led services | 4 | 320 | Mean Difference (IV, Random, 95% CI) | ‐1.60 [‐2.56, ‐0.65] |
| 6.11 HSPC versus usual care on patient anxiety in different countries: adjusted endpoint values Show forest plot | 5 | 384 | Mean Difference (IV, Random, 95% CI) | ‐0.63 [‐2.22, 0.96] |
| 6.11.1 Studies from USA | 3 | 251 | Mean Difference (IV, Random, 95% CI) | ‐0.32 [‐3.04, 2.39] |
| 6.11.2 Studies from UK | 2 | 133 | Mean Difference (IV, Random, 95% CI) | ‐1.02 [‐2.45, 0.42] |
| 6.12 HSPC versus usual care on patient anxiety in different countries: adjusted endpoint values (excluding McCorkle 2015) Show forest plot | 4 | 320 | Mean Difference (IV, Random, 95% CI) | ‐1.60 [‐2.56, ‐0.65] |
| 6.12.1 Studies from USA | 2 | 187 | Mean Difference (IV, Random, 95% CI) | ‐1.45 [‐3.90, 1.00] |
| 6.12.2 Studies from UK | 2 | 133 | Mean Difference (IV, Random, 95% CI) | ‐1.02 [‐2.45, 0.42] |
| Outcome or subgroup title | No. of studies | No. of participants | Statistical method | Effect size |
| 7.1 HSPC versus usual care on unpaid caregiver anxiety: unadjusted endpoint values Show forest plot | 2 | 351 | Mean Difference (IV, Random, 95% CI) | ‐0.71 [‐4.27, 2.85] |
| Outcome or subgroup title | No. of studies | No. of participants | Statistical method | Effect size |
| 8.1 HSPC versus usual care on patient depression: adjusted endpoint values Show forest plot | 8 | 1096 | Std. Mean Difference (IV, Random, 95% CI) | ‐0.22 [‐0.34, ‐0.10] |
| 8.2 HSPC versus usual care on patient depression: unadjusted endpoint values Show forest plot | 5 | 350 | Std. Mean Difference (IV, Random, 95% CI) | ‐0.25 [‐0.55, 0.04] |
| 8.3 HSPC versus usual care on patient depression: unadjusted endpoint values (excluding McCorkle 2015) Show forest plot | 4 | 286 | Std. Mean Difference (IV, Random, 95% CI) | ‐0.34 [‐0.65, ‐0.03] |
| 8.4 HSPC versus usual care on patient depression: adjusted change values Show forest plot | 2 | 231 | Mean Difference (IV, Random, 95% CI) | ‐0.32 [‐1.10, 0.45] |
| 8.5 HSPC versus usual care on patient depression: unadjusted change values Show forest plot | 4 | 488 | Std. Mean Difference (IV, Random, 95% CI) | ‐0.38 [‐0.58, ‐0.18] |
| 8.6 HSPC versus usual care on patient depression as a binary outcome Show forest plot | 3 | 338 | Odds Ratio (M‐H, Random, 95% CI) | 0.38 [0.21, 0.68] |
| Outcome or subgroup title | No. of studies | No. of participants | Statistical method | Effect size |
| 9.1 HSPC versus usual care on unpaid caregiver depression: adjusted endpoint values Show forest plot | 2 | 413 | Std. Mean Difference (IV, Random, 95% CI) | ‐0.02 [‐0.21, 0.18] |
| 9.2 HSPC versus usual care on unpaid caregiver depression: unadjusted endpoint values Show forest plot | 3 | 420 | Std. Mean Difference (IV, Random, 95% CI) | ‐0.29 [‐0.70, 0.12] |
| Outcome or subgroup title | No. of studies | No. of participants | Statistical method | Effect size |
| 10.1 HSPC versus usual care on unpaid caregiver quality of life: unadjusted endpoint values Show forest plot | 2 | 105 | Mean Difference (IV, Random, 95% CI) | 6.11 [0.42, 11.81] |
| Outcome or subgroup title | No. of studies | No. of participants | Statistical method | Effect size |
| 11.1 HSPC versus usual care on unpaid caregiver burden: adjusted change values Show forest plot | 3 | 128 | Mean Difference (IV, Random, 95% CI) | ‐3.88 [‐5.95, ‐1.80] |
| Outcome or subgroup title | No. of studies | No. of participants | Statistical method | Effect size |
| 12.1 HSPC versus usual care on patient breathlessness: adjusted endpoint values Show forest plot | 5 | 616 | Std. Mean Difference (IV, Random, 95% CI) | ‐0.04 [‐0.19, 0.12] |
| 12.2 HSPC versus usual care on patient breathlessness: unadjusted endpoint values Show forest plot | 2 | 128 | Std. Mean Difference (IV, Random, 95% CI) | ‐0.35 [‐0.70, ‐0.00] |
| 12.3 HSPC versus usual care on patient breathlessness: unadjusted change values Show forest plot | 2 | 292 | Std. Mean Difference (IV, Random, 95% CI) | ‐0.47 [‐1.55, 0.61] |