Familias y escuelas unidas (FAST) para mejorar los resultados de los niños y sus familias
Referencias
References to studies included in this review
References to studies excluded from this review
Additional references
References to other published versions of this review
Characteristics of studies
Characteristics of included studies [ordered by study ID]
Ir a:
| Methods | Design: cluster‐randomised trial, with assignment stratified on school performance level | |
| Participants | Location/setting: Philadelphia, PA (USA) Sample size: recruitment letters were sent to 7595 eligible families. Of these, 3787 (49.9%) were returned. Of the returned letters, 2926 families (77% of the returned letters, and 38.5% of the eligible sample) agreed to participate in the study. A random subsample of 1396 contenting families was chosen to participate in the study. Mean age: approximately 5 years. We obtained data from the study authors, but these covered only a portion of the randomised sample and were not broken out by group Sex: approximately 50% female Race/ethnicity: African American = 52%, Latino = 21%, White = 11%, other (includes Asian American, American Indian/Alaskan Native, and students identifying as multi‐racial/other) = 16% | |
| Interventions | Intervention (analyses based on approximately 500* children): FAST consisted of 8 weekly, multi‐family group sessions meeting in school buildings during out of school time. Activities include "one hour of parent‐led family activities...[that] may include a family craft, a family meal, family singing, or communication games...school and community staff members then organize children's time for an additional hour...next, parents practice being responsive to their children in 'special play', which is 15 minutes of one‐to‐one parent‐child time" (quote, p 3‐4) Control (analyses based on approximately 540* children): no treatment, with FAST available to control participants after conclusion of the study (see p 2) *Sample sizes are approximate because they change depending on the outcome | |
| Outcomes | Eligible measures (outcome domain)
Ineligible measures (reason)
Timing of outcome assessment: the first cohort of students was assessed at the end of kindergarten, at the end of first grade, and at the end of second grade. The second cohort of students was assessed at the end of kindergarten and at the end of first grade. Not all outcomes were assessed at all time points | |
| Notes | Study start date: FAST was offered during the 2013‐14 and 2014‐15 school years Study end date: the last data collection took place in mid‐2016 Funding source: this trial was funded by the US Department of Education Conflict of interest: none noted. The FAST organisation was one of the grantees but appears to have served as a technical assistance provider only (see p 9) | |
| Risk of bias | ||
| Bias | Authors' judgement | Support for judgement |
| Random sequence generation (selection bias) | Low risk | Comment: this is a cluster‐RCT. 60 willing and eligible schools were identified and were divided into 3 strata. The intervention was implemented in 2 successive cohorts Quote: "a random number was generated for each school. Within each of the three blocks...schools were rank‐ordered from the lowest to the highest, based on the random numbers assigned to them. Schools in the first half of each block were assigned to the treatment condition and the schools in the second half were assigned to the control condition" (p 14) |
| Allocation concealment (selection bias) | High risk | Comment: research staff clearly had access to group assignment information during enrolment Quote: "a random number was generated for each school. Within each of the three blocks...schools were rank‐ordered from the lowest to the highest, based on the random numbers assigned to them. Schools in the first half of each block were assigned to the treatment condition and the schools in the second half were assigned to the control condition" (p 14) |
| Blinding of participants and personnel (performance bias) | High risk | Comment: intervention and research staff clearly knew assignment conditions. Participants in the FAST condition clearly knew that they were receiving an intervention. Parents assigned to FAST but who chose not to participate may have been less aware of this, and presumably, parents in the control schools were much less aware of the fact that they were in the control condition |
| Blinding of outcome assessment (objective outcomes) | Low risk | Comment: student attendance was taken from school records. Child school performance was taken from standardised tests that appear to have been administered in the usual way |
| Blinding of outcome assessment (detection bias) (parent‐reported outcomes) | High risk | Comment: parent involvement in education; family relationship measures were completed by parents. Participants in the FAST condition clearly knew that they were receiving an intervention. Parents assigned to FAST but who chose not to participate may have been less aware of this, and presumably, parents in the control schools were likely much less aware of the fact that they were in the control condition |
| Incomplete outcome data (attrition bias): low attrition outcomes | Low risk | Comment: across the 2 cohorts and 3 measurement periods, overall attrition ranged from 15% to 31%, with similar loss rates across FAST and control groups (the mean percentage point difference in loss was less than 4). Analyses are not contingent on programme participation |
| Selective reporting (reporting bias) | Low risk | Comment: 1 subscale was planned to be given to parents at all 3 data collection points, but due to an administrative error, it was given only during the final data collection. The text of the report implies the presence of an analysis plan (this would be expected, given the organisation that funded this research) Quote: the analyses "were agreed upon before outcome data were collected" (p 15) |
| Other bias | High risk | Recruitment bias Comment: families were recruited after schools were randomly assigned to conditions. About 50% of the families approached to participate returned their consent forms. Of these, about 80% consented to participate (hence, about 40% of eligible families agreed to participate). FAST and control families were randomly selected from the consenting subsample Quote: "for Cohort 1, we sent out recruitment materials to 2,488 families, and 1,048 (42%) returned completed consent forms. Of those returned, 796 (76%) consented to participate, and 252 (24%) declined. For Cohort 2, we sent out recruitment materials to families of all 5,107 kindergarten students in study schools, and 2,739 (54%) returned completed consent forms. Of those returned, 2,130 (78%) consented for their families to be in the study, and 609 (22%) declined. Note that we drew a random subsample of the consenting students for actual participation in the study" (p 10) |
| Methods | Design: randomised controlled trial | |
| Participants | Location/setting: Madison, WI (USA) Sample size: "30 to 40 children" in one school "were identified as 'at‐risk', and then randomly assigned" (quote, p 89). Analyses were based on 32 students and their families Mean age: 7.1 years (intervention = 7.2, control = 7.0) Sex: not available Race/ethnicity: African American = 20%, White = 80% | |
| Interventions | Intervention (10 students): FAST involved "eight, weekly, three‐hour evening sessions of multiple family group activities, facilitated by the parents themselves and a FAST team of school, mental health, and AODA specialists, and parent‐advocates recruited from FAST graduates" (quote, p 13). Each session followed the same plan: "meal hosted by a family; Family Sing‐Along; Structured Family Communications Exercise; Family Feelings Identification Exercise; Parent Support Meeting; Parent and Child Reflective Play Technique; Special Play; Family Doorprize; Group Closing Ritual" (quote, p 14‐15) Control (22 students): no information provided | |
| Outcomes | Eligible measures (outcome domain)
Ineligible measures (reason)
Timing of outcome measurement: immediately after FAST participation | |
| Notes | Study start date: unclear. A different analysis in this paper (based on the 'statewide sample') was conducted during the 1990‐91 school year Study end date: unclear Funding source: unclear Conflict of interest: unclear. The study author helped create a training manual for FAST (see p 15), but the FAST developer does not appear to have participated in this study | |
| Risk of bias | ||
| Bias | Authors' judgement | Support for judgement |
| Random sequence generation (selection bias) | Unclear risk | Comment: no information on which to base a judgement Quote: "at this school, 30 to 40 children were identified as "at‐risk", and then randomly assigned either to recruitment into the FAST programme or to a waiting‐list comparison condition" (p 89) |
| Allocation concealment (selection bias) | Unclear risk | Comment: no details are provided on the methods used to conceal the allocation sequence |
| Blinding of participants and personnel (performance bias) | High risk | Comment: the condition to which participants were assigned was known to both intervention providers and participants |
| Blinding of outcome assessment (detection bias) (parent‐reported outcomes) | High risk | Comment: parents knew their assignment conditions |
| Blinding of outcome assessment (detection bias) (teacher‐reported outcomes) | Unclear risk | Comment: it is not clear whether teachers were aware of the student assignment conditions |
| Incomplete outcome data (attrition bias): high attrition outcomes | High risk | Comment: the total number of students randomly assigned was given as 30 to 40, and outcomes were based on 19 to 32 students. In addition, differential efforts were made to include families who completed at least 5 FAST sessions at outcome assessment Quote: "for economy of staff time, FAST trainers did not strongly encourage the collection of post‐measures from families who did not complete at least five of the eight sessions of the FAST curriculum" (p 88‐89) |
| Selective reporting (reporting bias) | Unclear risk | Comment: there is no information in the paper on which to base a judgement. The paper does seem thoroughly reported, although for studies conducted at this time, it would not be unusual to omit measured outcomes |
| Other bias | High risk | Recruitment bias Comment: students were identified by their schools as being 'at risk' for leaving school early, and then their families were approached by school personnel for a home visit by FAST staff. Presumably, not all families agreed to the home visit, and not all visited families agreed to be recruited into the study, although the paper is silent on these details |
| Methods | Design: cluster‐randomised trial (clusters were 4 to 10 community blocks) | |
| Participants | Location/setting: Santa Ana, CA (USA) Sample size: 282 immigrant Latino families Mean age: 9.5 years Sex: 52% female Race/ethnicity: Latino = 100% | |
| Interventions | Intervention (140 families): FAST consisted of family group sessions taking place once a week for 10 weeks, with each session lasting approximately 2.5 hours. During these sessions, families are guided through planned activities including family meals, family projects (e.g. designing a family flag), communication games, group activities (e.g. FAST songs), and either support group or modified parent‐child play sessions Control (142 families): not described | |
| Outcomes | Eligible measures (outcome domain)
Ineligible measures (reason)
Timing of outcome measurement: 3 months after the end of FAST, and again at 12 months | |
| Notes | Study start date: not stated Study end date: not stated Funding source: US Centers for Disease Control and Prevention Conflict of interest: none noted. The FAST organisation's involvement appears to have been limited to implementation planning | |
| Risk of bias | ||
| Bias | Authors' judgement | Support for judgement |
| Random sequence generation (selection bias) | Low risk | Quote: "a computer generated random number was used to randomly assign two communities to the intervention condition and two communities to the control condition" (p 68) |
| Allocation concealment (selection bias) | Unclear risk | Comment: for community‐level randomisation, no indication that attempts were made to conceal the allocation sequence is given in the report |
| Blinding of participants and personnel (performance bias) | High risk | Comment: the condition to which participants were assigned was known to intervention providers and to participants |
| Blinding of outcome assessment (detection bias) (parent‐reported outcomes) | High risk | Comment: parents were aware of their assignment conditions |
| Incomplete outcome data (attrition bias): high attrition outcomes | High risk | Comment: across outcomes, attrition rates (based on families who agreed to participate in the study) ranged from 27% to 35%. Differential attrition was high (15 percentage points more loss in the FAST group than in the control group). Multiple imputation was used to address both attrition and item non‐response |
| Selective reporting (reporting bias) | Unclear risk | Comment: there is no information in the paper on which to base a judgement. The paper does seem thoroughly reported |
| Other bias | High risk | Recruitment bias Comment: communities (i.e. geographic areas consisting of 4 to 10 blocks) were randomly assigned to conditions, and then families were recruited into the study |
| Methods | Design: randomised controlled trial | |
| Participants | Location/setting: Northern Wisconsin (USA) Sample size: 100 American Indian families Mean age: approximately 6.75 years. Age inferred from grade level and not reported in the paper Sex: 57% female (intervention = 56% female, control = 58% female) Race/ethnicity: American Indian = 100% | |
| Interventions | Intervention (50 families): as implemented, a FAST cycle consisted of 8 weekly, multi‐family group meetings. 7 cycles were conducted sequentially over 3 years. Sessions consisted of 15 minutes of parent‐child playtime, a shared meal, other family activities, and separate child play and parent discussion, and a lottery. The activities were adapted for specific fit with the 3 participating American Indian Nations, with details provided for each (see p 366), including details of parental homework, substance abuse information sessions, and 2‐year monthly follow‐up sessions Control (50 families): control families did not receive FAST treatment. No other details are provided | |
| Outcomes | Eligible measures (outcome domain)
Ineligible measures (reason)
Timing of outcome measurement: immediately after FAST and 9 to 12 months of follow‐up | |
| Notes | Study start date: not stated Study end date: not stated Funding source: US Department of Education Conflict of interest: the FAST developer was one of the co‐authors on this paper | |
| Risk of bias | ||
| Bias | Authors' judgement | Support for judgement |
| Random sequence generation (selection bias) | Unclear risk | Comment: no details about the randomisation procedure are provided Quote: "within each cycle, all children were matched on the basis of a number of designated characteristics and then randomly assigned either to participate in the FAST programme or to serve as non‐FAST controls" (p 364) |
| Allocation concealment (selection bias) | Unclear risk | Comment: no details are provided on methods used to conceal the allocation sequence Quote: "parents and children who participated in the research project (N = 100 families) were openly and universally recruited. Families were recruited at a school event and by sending information about the project home with all students in grades K‐2 in the participating schools" (p 363) |
| Blinding of participants and personnel (performance bias) | High risk | Comment: the condition to which participants were assigned was known to both intervention providers and participants |
| Blinding of outcome assessment (objective outcomes) | Low risk | Comment: this outcome is based on standardised tests |
| Blinding of outcome assessment (detection bias) (parent‐reported outcomes) | High risk | Comment: parents knew the conditions to which they were assigned |
| Blinding of outcome assessment (detection bias) (teacher‐reported outcomes) | Unclear risk | Comment: the triallists attempted to keep teachers blind to assignment condition, but no information is available on how successful these efforts were Quote: "to the best of the researchers’ ability, all teachers, observers, and testers were kept ‘blind’ concerning participants’ condition status" (p 364) |
| Incomplete outcome data (attrition bias): high attrition outcomes | High risk | Comment: after randomising matched pairs of students to conditions, the triallists dropped incomplete pairs from analysis. For teacher‐reported outcomes, analyses are based on 49 or 50 pairs of families. For parent‐reported outcomes, analyses are based on 19 to 24 pairs of families. Observation‐based measures are based on 40 pairs of families |
| Selective reporting (reporting bias) | Low risk | Comment: we obtained the printouts of the statistical analyses, suggesting it is likely that all measured outcomes are available for this review |
| Other bias | High risk | Recruitment bias Comment: families were recruited after schools were randomly assigned to conditions Quote: "parents and children who participated in the research project (N = 100 families) were openly and universally recruited. Families were recruited at a school event and by sending information about the project home with all students in grades K‐2 in the participating schools" (p 363) Loss of clusters Comment: no clusters were lost from the analysis |
| Methods | Design: randomised controlled trial | |
| Participants | Location/setting: Madison, WI (USA) Sample size: 134 children (half of whom were identified as at risk for special education services) and their families Mean age: approximately 6.4 years. Age inferred from grade level and not reported in the paper Sex: 57.5% female (intervention = 56.7% female, control = 58.2% female) Race/ethnicity: Asian = 13%, African American = 35%, Latino = 12%, White = 40% | |
| Interventions | Intervention (67 children): as implemented, a FAST cycle consisted of 8 weekly, multi‐family group after‐school meetings. 8 standardised cycles (1 per school) were conducted over a 3‐year period. The sessions were structured and included interactive and experiential learning, a 15‐minute parent‐child playtime, meals, and songs Control (67 children): "services as usual" (quote, p 250) | |
| Outcomes | Eligible measures (outcome domain)
Ineligible measures (reason)
Timing of outcome measurement: immediately after completion of FAST and 9 to 12 months of follow‐up | |
| Notes | Study start date: perhaps implemented in the 2000‐01 school year (see p 260) Study end date: perhaps spring 2002 Funding source: none mentioned Conflict of interest: the FAST developer was one of the co‐authors on this paper | |
| Risk of bias | ||
| Bias | Authors' judgement | Support for judgement |
| Random sequence generation (selection bias) | Unclear risk | Comment: no details about the randomisation procedure are provided Quote: "(1) as many volunteering students as possible were matched on the basis of a number of designated characteristics, and then (2) randomly assigned either to participate in the FAST programme or to serve as non‐FAST controls. This process produced a total of 67 matched pairs" (p 250) |
| Allocation concealment (selection bias) | Unclear risk | Comment: no details are provided on methods used to conceal the allocation sequence Quote: "(1) as many volunteering students as possible were matched on the basis of a number of designated characteristics, and then (2) randomly assigned either to participate in the FAST programme or to serve as non‐FAST controls. This process produced a total of 67 matched pairs" (p 250) |
| Blinding of participants and personnel (performance bias) | High risk | Comment: the condition to which participants were assigned was known to both intervention providers and participants |
| Blinding of outcome assessment (objective outcomes) | Low risk | Comment: this outcome is based on standardised tests that are routinely administered to all students |
| Blinding of outcome assessment (detection bias) (parent‐reported outcomes) | High risk | Comment: parents knew the conditions to which they were assigned |
| Blinding of outcome assessment (detection bias) (teacher‐reported outcomes) | Unclear risk | Comment: the triallists attempted to keep teachers blind to assignment condition, but no information is available on how successful these efforts were Quote: "to the best of the researchers’ ability, all teachers, observers, and testers were kept 'blind' concerning participants' condition status" (p 364) |
| Incomplete outcome data (attrition bias): high attrition outcomes | High risk | Comment: the triallists state that 225 families were approached for participation, that 172 agreed to participate, and that 134 were matched and potentially included in outcome analyses. Specifically, after randomising matched pairs of students to conditions, the triallists dropped incomplete pairs from the analysis. For teacher‐reported outcomes at the immediate post‐test, analyses are based on 60 pairs of families. For parent‐reported outcomes, analyses are based on 53 pairs of families For teacher‐reported outcomes at the follow‐up post‐test, analyses are based on 39 pairs of families. For parent‐reported outcomes, analyses are based on 31 pairs of families |
| Selective reporting (reporting bias) | Low risk | Comment: we obtained the printouts of the statistical analyses, suggesting it is likely that all measured outcomes are available for this review |
| Other bias | High risk | Recruitment bias Comment: the triallists state that 225 families were approached for participation and that outcome analyses were based on, at most, 60 pairs of students. It is unknown whether 225 represents the totality of eligible families in the 3 schools |
| Methods | Design: randomised controlled trial | |
| Participants | Location/setting: New Orleans, LA (USA) Sample size: 407 largely (90%) African American children and their families Mean age: 7.52 years (intervention = 7.37, control = 7.67) Sex: 38% female (intervention = 38% female, control = 39% female) Race/ethnicity: African American = 90%. The race/ethnicity of the remaining 10% of children was not specified | |
| Interventions | Intervention (207 children): as implemented, FAST consisted of 3‐hour sessions held over 8 consecutive weeks. Sessions consisted of 15 minutes of parent‐child time, a shared family meal, other family activities, and separate child play and parent discussion. The triallists did not provide detail on the content of the parent discussions, but these appeared to have both a parent self‐help group component and an alcohol/drug abuse education component. Some families included in the evaluation also attended FASTWORKS, a series of parent‐organised monthly support meetings that are intended to continue and extend the social network established during FAST Control (200 children): weekly (over 8 weeks) receipt of a commercial pamphlet on parenting | |
| Outcomes | Eligible measures (outcome domain)
Ineligible measures (reason)
Timing of outcome measurement: 1‐year follow‐up | |
| Notes | Study start date: September 1997 Study end date: Spring 1999 Funding source: US Department of Health and Human Services Conflict of interest: none noted. The evaluation was conducted by an independent research firm. The FAST organisation was involved in implementation planning | |
| Risk of bias | ||
| Bias | Authors' judgement | Support for judgement |
| Random sequence generation (selection bias) | Unclear risk | Comment: no details about randomisation are given in the report Quote: "randomly assigned to FAST or to the alternative treatment by Abt Associates staff" (p B2‐5) |
| Allocation concealment (selection bias) | Unclear risk | Comment: because no details about randomisation were given in the report, it is not clear if the investigators could have foreseen assignment conditions when randomisation occurred |
| Blinding of participants and personnel (performance bias) | High risk | Comment: the condition to which participants were assigned was known to both intervention providers and participants Quote: "the families assigned to FAST were visited by the FAST coordinator and a parent liaison and asked to join FAST; in addition, these families were asked if they would be part of our study. The families assigned to the alternative treatment were visited by an Abt Associates field staff member and asked to join the alternative treatment and to be in the study" (p B2‐5) |
| Blinding of outcome assessment (detection bias) (parent‐reported outcomes) | High risk | Comment: parents knew the conditions to which they were assigned |
| Blinding of outcome assessment (detection bias) (teacher‐reported outcomes) | Unclear risk | Comment: students were referred for participation in the study by teachers, but it is unclear whether the triallists kept teachers blind to the conditions to which the students were assigned |
| Incomplete outcome data (attrition bias): low attrition outcomes | Low risk | Comment: these outcomes all experienced low attrition (5% to 6%): parent‐reported internalising and externalising behaviour, parent‐reported family relations, parent‐reported involvement in the community and in school |
| Incomplete outcome data (attrition bias): high attrition outcomes | High risk | Comment: teacher‐reported internalising and externalising behaviour, grades, and absences all experienced high levels of attrition (24% to 34% of the sample) |
| Selective reporting (reporting bias) | Unclear risk | Comment: there is no information in the paper on which to base a judgement. The paper does seem thoroughly reported, although for studies conducted at this time, it would not be unusual to omit measured outcomes. The triallists do note that a pilot test was implemented and analyses were conducted at a single site in Wisconsin (USA), but results were not made available (see p B24‐5) |
| Other bias | High risk | Recruitment bias Comment: it is clear that participants and program staff knew the assignment condition before obtaining consent, leaving open the possibility that this knowledge may have affected the behaviour of the program staff or the participants or both. In addition, it is unclear whether all eligible families in the randomly assigned schools were approached to participate Quote: "the families assigned to FAST were visited by the FAST coordinator and a parent liaison and asked to join FAST; in addition, these families were asked if they would be part of our study. The families assigned to the alternative treatment were visited by an Abt Associates field staff member and asked to join the alternative treatment and to be in the study" (p B2‐5) |
| Methods | Design: cluster‐randomised trial, with stratification by region | |
| Participants | Location/setting: various communities in England (UK) Sample size: 158 schools Mean age: 5.5 years. Age not provided but inferred for the overall sample from the fact that these are Year 1 students Sex: not provided Race/ethnicity: not provided | |
| Interventions | Intervention (79 schools): "groups of parents and their children (usually around 5–8 families in each group) attend eight weekly 2.5‐hour group sessions after school, delivered by trained local partners…Sessions are designed to encourage good home routines around mealtimes, bedtimes and homework" (quote, p 4) Each session followed the same plan and included family activities, a shared family meal, separate parent and child group work, and parent‐child play time. Some families included in the evaluation also attended FASTWORKS, a series of parent‐organised monthly support meetings that are intended to continue and extend the social network established during FAST | |
| Outcomes | Eligible measures (outcome domain)
Ineligible measures (reason)
Timing of outcome measurement: approximately 15 to 18 months after FAST participation | |
| Notes | Study start date: mid‐2015 Study end date: mid‐2017 Funding source: Education Endowment Foundation Conflict of interest: none noted. The evaluation was conducted by an independent research firm. Implementation support was provided by Save the Children (UK), via a licence from the FAST organisation | |
| Risk of bias | ||
| Bias | Authors' judgement | Support for judgement |
| Random sequence generation (selection bias) | Low risk | Comment: statistical software (SPSS) was used to generate the random sequence |
| Allocation concealment (selection bias) | Low risk | Comment: given that randomisation was carried out using statistical software, the allocation sequence should not have been predictable in advance of enrolment |
| Blinding of participants and personnel (performance bias) | High risk | Comment: all participants and personnel knew the conditions to which participants were assigned |
| Blinding of outcome assessment (objective outcomes) | Low risk | Comment: child academic achievement was derived from state mandated examinations scored by teachers. While the teachers likely knew children’s assignment conditions, it does not seem likely that this knowledge would have influenced their scoring |
| Incomplete outcome data (attrition bias): high attrition outcomes | High risk | Comment: this trial employed randomisation at the school level. 35% of FAST schools and 19% of control schools dropped out of the trial. The study authors concluded that attrition likely represented an important source of bias in their study. All students were considered part of the sample to which their schools were assigned, but data for some students were missing (even after school‐level attrition was accounted for). In total, 50% of FAST students and 33% of control students did not provide outcome data |
| Selective reporting (reporting bias) | Low risk | Comment: the outcomes were specified in a preregistered protocol |
| Other bias | Low risk | Recruitment bias Comment: schools were assigned to conditions before parents were recruited into the programme. Participants and programme staff knew the assignment conditions before obtaining consent, leaving open the possibility that this knowledge may have influenced the behaviour of programme staff or participants, or both. However, child outcomes were intended to be collected for all children in FAST schools |
| Methods | Design: cluster‐randomised trial (clusters were schools) | |
| Participants | Location/setting: San Antionio, TX, and Phoenix, AZ (USA) Sample size: 3084 largely racial/ethnic minority students and their families Mean age: approximately 6.5 years. Age not provided in the various papers reporting on this study, but inferred from the grade level of the children Sex: not provided Race/ethnicity: Latino = approximately 74%, African American = 9%. The race/ethnicity of the remaining students was not specified | |
| Interventions | Intervention (approximately 1400* children): as implemented, FAST consisted of 8 weekly group meetings involving a shared meal (each week, 1 family won a gift card from a grocery store, and the following week that family bought or prepared the group meal; children participated in the set‐up before and cleaned up after the meal); family games; and other activities that encourage taking turns, sharing feelings, and delaying gratification Control (approximately 1400* children): described as business as usual *Analyses based on 2832 children | |
| Outcomes | Eligible measures (outcome domain)
Ineligible measures (reason)
Timing of outcome measurement: immediately after the FAST intervention | |
| Notes | Study start date: probably 2008 (Gamoran 2012) Study end date: probably 2010 Funding source: US National Institute of Child Health and Human Development Conflict of interest: none noted. The involvement of the FAST organisation is unclear. The paper does indicate that FAST was delivered by trained parents and professionals (p 209) but does not indicate the source of the training | |
| Risk of bias | ||
| Bias | Authors' judgement | Support for judgement |
| Random sequence generation (selection bias) | Unclear risk | Comment: the method used to generate the allocation sequence is not described in the paper Quote: "schools were randomly assigned to one of the two cohorts, and then they were randomly assigned to treatment and control groups" (p 6) |
| Allocation concealment (selection bias) | High risk | Comment: it is unclear whether school assignment conditions could have been foreseen in advance of or during enrolment. However, it is clear that participants and programme staff knew the assignment conditions before obtaining consent, leaving open the possibility that this knowledge may have influenced the behaviour of programme staff or participants, or both Quote: "all potential participants learned about the study, chose whether to consent to be in the study...Parents in the treatment schools also learned about FAST and chose whether to consent. Teachers also learned about the study, chose whether to participate" (p 7) |
| Blinding of participants and personnel (performance bias) | High risk | Comment: all participants and personnel knew the condition to which participants were assigned |
| Blinding of outcome assessment (detection bias) (teacher‐reported outcomes) | High risk | Comment: the study authors collected outcome information on students of teachers who, due to school‐level randomisation, appeared to have been aware of assignment conditions |
| Incomplete outcome data (attrition bias): low attrition outcomes | Low risk | Comment: the triallists attempted to collect teacher reports of internalising and externalising behaviour for all students assigned to conditions |
| Selective reporting (reporting bias) | High risk | Comment: the report does not provide parent‐reported outcomes due to "high levels of non‐random missingness for the parent outcomes data in the full sample" (quote) |
| Other bias | High risk | Recruitment bias Comment: schools were assigned to conditions before parents were recruited into the programme. Participants and programme staff knew the assignment conditions before obtaining consent, leaving open the possibility that this knowledge may have influenced the behaviour of programme staff or participants, or both Quote: "The research team and staff from the local social service agencies recruited families to the study at both FAST and comparison schools ... Potential participants learned about the study, chose whether to consent to the study, and received a $10 gift card as compensation for filling out a short 3‐page pre‐test questionnaire. Parents in the FAST schools also learned about FAST and chose whether to consent and participate in FAST" (p 210) |
| Methods | Design: randomised controlled trial | |
| Participants | Location/setting: Madison, WI (USA) Sample size: 38 Hmong families Mean age: 8.6 years Gender: 43% female Race/ethnicity: Hmong = 100% | |
| Interventions | Intervention (analyses based on 5 children and their families): FAST, as implemented in this study, was described as follows. The intervention was hosted by the community refugee centre; researchers requested that 1 parent attend with up to 3 children due to space limitations – although eventually, more and more family members attended; unlike many other FAST implementations, communal meals occurred at completion of the session because groups arrived at 9 am on Saturdays. The core components/processes used were team membership, parental compliance with requests during meals, coaching of parents, music, parent groups, children’s activity, and responsive play. Furthermore, study authors worked with Hmong elders to develop cultural adaptations for FAST Control (analyses based on 5 children and their families): wait‐list control | |
| Outcomes | Eligible measures (outcome domain)
Ineligible measures (reason)
Timing of outcome measurement: immediately after completion of FAST intervention | |
| Notes | Study start date: not stated Study end date: not stated Funding source: none mentioned Conflict of interest: the FAST developer was one of the co‐authors on this paper | |
| Risk of bias | ||
| Bias | Authors' judgement | Support for judgement |
| Random sequence generation (selection bias) | Unclear risk | Comment: no information is given in the study about the method used to assign families to conditions Quote: "randomly assigned to 'FAST now' or 'FAST later'" (p 118) |
| Allocation concealment (selection bias) | Unclear risk | Comment: because no details about randomisation were given in the report, it is not clear whether investigators could have foreseen assignment conditions when randomisation occurred |
| Blinding of participants and personnel (performance bias) | High risk | Comment: the condition to which participants were assigned was known to both intervention providers and participants |
| Blinding of outcome assessment (detection bias) (parent‐reported outcomes) | High risk | Comment: parents knew the conditions to which they were assigned |
| Incomplete outcome data (attrition bias): high attrition outcomes | High risk | Comment: the exact number of families randomised to conditions cannot be determined from the report. Outcome data are based on families from Cohort 1 who attended at least 1 FAST session and provided outcome data (10 of 38 families) |
| Selective reporting (reporting bias) | Unclear risk | Comment: there is no information in the paper on which to base a judgement. The paper does seem thoroughly reported, although for studies conducted at this time, it would not be unusual to omit measured outcomes |
| Other bias | Low risk | Comment: no other problems were identified |
| Methods | Design: cluster‐randomised controlled trial (classrooms within schools were randomly assigned to conditions) | |
| Participants | Location/setting: Milwaukee, WI (USA) Sample size: at baseline, 473 largely racial/ethnic minority students (African American and Latino) and their families Mean age: intervention = 7.9 years, control = 7.7 years Sex: intervention = 53% female, control = 61% female Race/ethnicity: not provided | |
| Interventions | Intervention (272 students at baseline, approximately 216 at follow‐up): as implemented, FAST involved the following: "structured family activity meetings were held for 8 consecutive weeks. Each FAST meeting, held during the evening in the school, was approximately 2 1⁄2 hours in length ... All members of the family were invited to participate as a family unit, with child and infant care provided as needed during the session. At least four trained facilitators, one on staff at the school (usually a guidance counselor or social worker), two community agency professionals, and a parent of a child in the school, led the sessions. Each weekly meeting included the following interactive units: 1) family communication activities (Feelings Charade; Scribbles) and shared meal (one hour); 2) adult dyads ‐ spouse or other adult communication (15 minutes); 3) adult self‐help group (45 minutes); 4) children‘s peer‐connecting group activity (1 hour); 5) parent and child quality time together using non‐directed ‐ special play (15 minutes); 6) full group assembly for lottery prizes, personal achievement announcements, and a goodbye ritual" (quote, p 9) Control (201 students at baseline, approximately 143 at follow‐up): FAME, which involved "weekly provision of parenting skills booklets which were mailed to the home during the same 8 weeks that FAST was conducted, along with an invitation to a lecture on parenting and family life" (quote, p 9) | |
| Outcomes | Eligible measures (outcome domain)
Ineligible measures (reason)
Timing of outcome measurement: immediately after FAST with 12‐month and 24‐month follow‐up | |
| Notes | Study start date: not stated Study end date: not stated Funding source: US National Institute on Drug Abuse Conflicts of interest: the FAST developer is a co‐author of this paper and authored a second paper describing results for this sample (McDonald 2006) | |
| Risk of bias | ||
| Bias | Authors' judgement | Support for judgement |
| Random sequence generation (selection bias) | Low risk | Comment: this is a cluster‐randomised trial. Clusters were assigned to conditions via a coin toss Quote: "randomly assigned (via a coin toss) … to either FAST or FAME during each of two semesters" (p 8) |
| Allocation concealment (selection bias) | Low risk | Comment: under the assumption that the coin tossing procedure was fair (e.g. there were rules regarding re‐flipping), then foreknowledge of the next assignment likely was not possible |
| Blinding of participants and personnel (performance bias) | High risk | Comment: the condition to which participants were assigned was known to both intervention providers and participants |
| Blinding of outcome assessment (detection bias) (parent‐reported outcomes) | High risk | Comment: parents knew their assignment conditions |
| Blinding of outcome assessment (detection bias) (teacher‐reported outcomes) | Unclear risk | Comment: the paper provides conflicting information about whether teachers were consistently blind to conditions |
| Incomplete outcome data (attrition bias): low attrition outcomes | Low risk | Comment: attrition was low (2% to 3%) for the following outcomes, all measured immediately after completion of the intervention and at 1‐year follow‐up: family attachment, parent involvement with school, internalising behaviour (parent rating), and externalising behaviour (parent teacher rating), with a mean difference in attrition rates of about 1 percentage point |
| Incomplete outcome data (attrition bias): high attrition outcomes | High risk | Comment: attrition was high (16% to 37%) for the following outcomes, all measured 2 years after completion of the intervention: family attachment, parent involvement with school, internalising behaviour (parent and teacher ratings), and externalising behaviour (parent and teacher ratings), with a mean difference in attrition rates of about 9 percentage points |
| Selective reporting (reporting bias) | Unclear risk | Comment: there is no information in the paper on which to base a judgement. The paper does seem thoroughly reported, although for studies conducted at this time, it would not be unusual to omit measured outcomes |
| Other bias | High risk | Recruitment bias Comment: because no details about randomisation were given in the report, it is not clear whether investigators could have foreseen assignment conditions when randomisation occurred. However, it is clear that participants and programme staff knew the assignment conditions before obtaining consent, leaving open the possibility that this knowledge may have influenced the behaviour of programme staff or participants, or both Quote: "it was a given ... that the families would be recruited from randomly assigned schools or classrooms, rather than assigning families at random once they had agreed to participate. The recruitment process itself is considered part of the FAST intervention, and we did not want to interfere with that aspect of the program" (p 7) |
AODA: Accessibility for Ontarians With Disabilities Act.
FAME: Family Education programme.
FAST: Families and Schools Together.
NFER: National Foundation for Educational Research.
RCT: randomised controlled trial.
SPSS: Statistical Package for the Social Sciences.
Characteristics of excluded studies [ordered by study ID]
Ir a:
| Study | Reason for exclusion |
| Not an RCT | |
| Intervention was not FAST | |
| Intervention was not FAST | |
| Not an RCT | |
| Not an RCT | |
| Not an RCT | |
| Not an RCT | |
| Not an RCT | |
| Not an empirical study | |
| Not an RCT | |
| Not an RCT | |
| Not an empirical study | |
| Not an empirical study | |
| Not an empirical study | |
| Not an RCT | |
| Intervention was not FAST | |
| Not an empirical study | |
| Not an empirical study |
FAST: Families and Schools Together.
RCT: randomised controlled trial.
Note: the studies identified in this table were selected for full‐text screening but were determined not eligible for review. We selected studies for full‐text screening if, on the basis of information in the titles and abstracts, they could not be definitively ruled ineligible. We have not listed in these tables studies screened at full text that were duplicates of, or supplementary reports to, an eligible study.
Data and analyses
| Outcome or subgroup title | No. of studies | No. of participants | Statistical method | Effect size |
| 1 Immediate post‐test Show forest plot | 2 | Std. Mean Difference (Fixed, 95% CI) | ‐0.06 [‐0.34, 0.22] | |
| Analysis 1.1  Comparison 1 Child school performance, Outcome 1 Immediate post‐test. | ||||
| 2 Long‐term follow‐up Show forest plot | 4 | Std. Mean Difference (Fixed, 95% CI) | ‐0.02 [‐0.11, 0.08] | |
| Analysis 1.2  Comparison 1 Child school performance, Outcome 2 Long‐term follow‐up. | ||||
| Outcome or subgroup title | No. of studies | No. of participants | Statistical method | Effect size |
| 1 Immediate post‐test, parent report Show forest plot | 5 | Std. Mean Difference (Fixed, 95% CI) | ‐0.05 [‐0.21, 0.10] | |
| Analysis 2.1  Comparison 2 Child internalising behaviour, Outcome 1 Immediate post‐test, parent report. | ||||
| 2 Immediate post‐test, teacher report Show forest plot | 5 | Std. Mean Difference (Fixed, 95% CI) | ‐0.09 [‐0.18, 0.00] | |
| Analysis 2.2  Comparison 2 Child internalising behaviour, Outcome 2 Immediate post‐test, teacher report. | ||||
| 3 Long‐term follow‐up, parent report Show forest plot | 4 | Std. Mean Difference (Fixed, 95% CI) | 0.03 [‐0.11, 0.17] | |
| Analysis 2.3  Comparison 2 Child internalising behaviour, Outcome 3 Long‐term follow‐up, parent report. | ||||
| 4 Long‐term follow‐up, teacher report Show forest plot | 4 | Std. Mean Difference (Fixed, 95% CI) | ‐0.06 [‐0.19, 0.07] | |
| Analysis 2.4  Comparison 2 Child internalising behaviour, Outcome 4 Long‐term follow‐up, teacher report. | ||||
| Outcome or subgroup title | No. of studies | No. of participants | Statistical method | Effect size |
| 1 Immediate post‐test, parent report Show forest plot | 4 | Std. Mean Difference (Fixed, 95% CI) | ‐0.04 [‐0.20, 0.12] | |
| Analysis 3.1  Comparison 3 Child externalising behaviour, Outcome 1 Immediate post‐test, parent report. | ||||
| 2 Immediate post‐test, teacher report Show forest plot | 4 | Std. Mean Difference (Fixed, 95% CI) | ‐0.02 [‐0.11, 0.07] | |
| Analysis 3.2  Comparison 3 Child externalising behaviour, Outcome 2 Immediate post‐test, teacher report. | ||||
| 3 Long‐term follow‐up, parent report Show forest plot | 4 | Std. Mean Difference (Fixed, 95% CI) | ‐0.19 [‐0.32, ‐0.05] | |
| Analysis 3.3  Comparison 3 Child externalising behaviour, Outcome 3 Long‐term follow‐up, parent report. | ||||
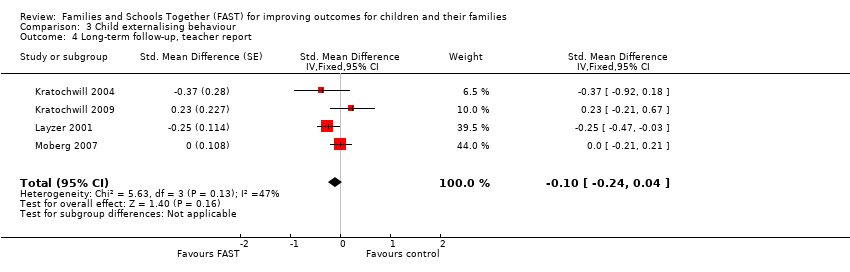
| 4 Long‐term follow‐up, teacher report Show forest plot | 4 | Std. Mean Difference (Fixed, 95% CI) | ‐0.10 [‐0.24, 0.04] | |
| Analysis 3.4  Comparison 3 Child externalising behaviour, Outcome 4 Long‐term follow‐up, teacher report. | ||||
| Outcome or subgroup title | No. of studies | No. of participants | Statistical method | Effect size |
| 1 Short‐term follow‐up Show forest plot | 1 | Std. Mean Difference (Fixed, 95% CI) | 0.02 [‐0.11, 0.15] | |
| Analysis 4.1  Comparison 4 Child school attendance, Outcome 1 Short‐term follow‐up. | ||||
| 2 Long‐term follow‐up Show forest plot | 2 | Std. Mean Difference (Fixed, 95% CI) | 0.03 [‐0.10, 0.16] | |
| Analysis 4.2  Comparison 4 Child school attendance, Outcome 2 Long‐term follow‐up. | ||||
| Outcome or subgroup title | No. of studies | No. of participants | Statistical method | Effect size |
| 1 Immediate post‐test Show forest plot | 1 | Std. Mean Difference (Fixed, 95% CI) | 0.34 [0.15, 0.53] | |
| Analysis 5.1  Comparison 5 Parental engagement with education, Outcome 1 Immediate post‐test. | ||||
| 2 Short‐term follow‐up Show forest plot | 1 | Std. Mean Difference (Fixed, 95% CI) | 0.20 [0.06, 0.33] | |
| Analysis 5.2  Comparison 5 Parental engagement with education, Outcome 2 Short‐term follow‐up. | ||||
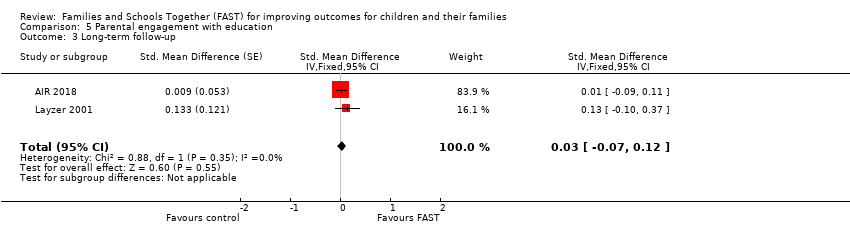
| 3 Long‐term follow‐up Show forest plot | 2 | Std. Mean Difference (Fixed, 95% CI) | 0.03 [‐0.07, 0.12] | |
| Analysis 5.3  Comparison 5 Parental engagement with education, Outcome 3 Long‐term follow‐up. | ||||
| Outcome or subgroup title | No. of studies | No. of participants | Statistical method | Effect size |
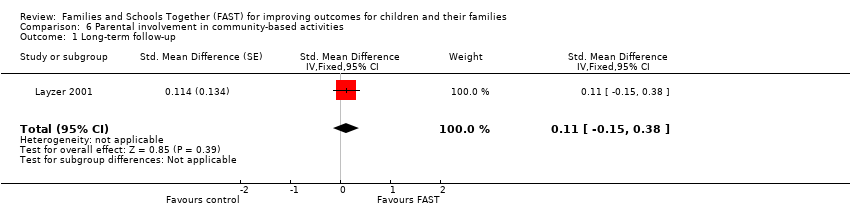
| 1 Long‐term follow‐up Show forest plot | 1 | Std. Mean Difference (Fixed, 95% CI) | 0.11 [‐0.15, 0.38] | |
| Analysis 6.1  Comparison 6 Parental involvement in community‐based activities, Outcome 1 Long‐term follow‐up. | ||||
| Outcome or subgroup title | No. of studies | No. of participants | Statistical method | Effect size |
| 1 Immediate post‐test Show forest plot | 4 | Std. Mean Difference (Fixed, 95% CI) | 0.03 [‐0.27, 0.33] | |
| Analysis 7.1  Comparison 7 Family relationships, Outcome 1 Immediate post‐test. | ||||
| 2 Short‐term follow‐up Show forest plot | 1 | Std. Mean Difference (Fixed, 95% CI) | 0.00 [‐0.12, 0.13] | |
| Analysis 7.2  Comparison 7 Family relationships, Outcome 2 Short‐term follow‐up. | ||||
| 3 Long‐term follow up Show forest plot | 4 | Std. Mean Difference (Fixed, 95% CI) | 0.08 [‐0.03, 0.19] | |
| Analysis 7.3  Comparison 7 Family relationships, Outcome 3 Long‐term follow up. | ||||

Fast logic model. Copyright © 2016 Families and Schools Together, Inc.: reproduced with permission.

Study flow diagram for the literature search.
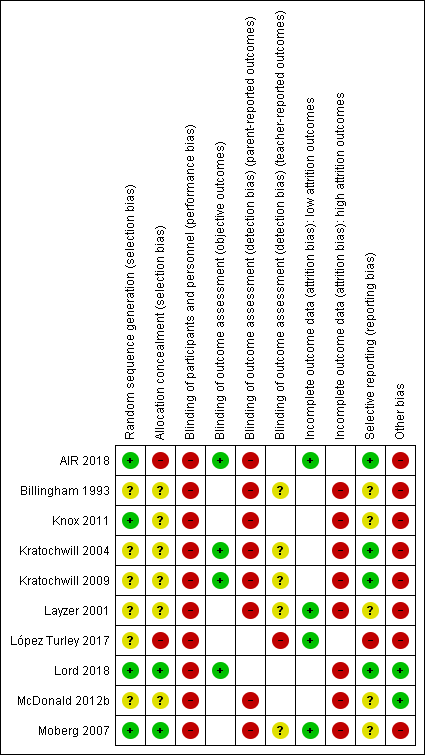
Risk of bias summary: review authors' judgements about each risk of bias item for each included study.

Risk of bias graph: review authors' judgements about each risk of bias item presented as percentages across all included studies.

Comparison 1 Child school performance, Outcome 1 Immediate post‐test.

Comparison 1 Child school performance, Outcome 2 Long‐term follow‐up.

Comparison 2 Child internalising behaviour, Outcome 1 Immediate post‐test, parent report.

Comparison 2 Child internalising behaviour, Outcome 2 Immediate post‐test, teacher report.

Comparison 2 Child internalising behaviour, Outcome 3 Long‐term follow‐up, parent report.

Comparison 2 Child internalising behaviour, Outcome 4 Long‐term follow‐up, teacher report.

Comparison 3 Child externalising behaviour, Outcome 1 Immediate post‐test, parent report.

Comparison 3 Child externalising behaviour, Outcome 2 Immediate post‐test, teacher report.

Comparison 3 Child externalising behaviour, Outcome 3 Long‐term follow‐up, parent report.
Comparison 3 Child externalising behaviour, Outcome 4 Long‐term follow‐up, teacher report.

Comparison 4 Child school attendance, Outcome 1 Short‐term follow‐up.

Comparison 4 Child school attendance, Outcome 2 Long‐term follow‐up.

Comparison 5 Parental engagement with education, Outcome 1 Immediate post‐test.

Comparison 5 Parental engagement with education, Outcome 2 Short‐term follow‐up.
Comparison 5 Parental engagement with education, Outcome 3 Long‐term follow‐up.
Comparison 6 Parental involvement in community‐based activities, Outcome 1 Long‐term follow‐up.

Comparison 7 Family relationships, Outcome 1 Immediate post‐test.

Comparison 7 Family relationships, Outcome 2 Short‐term follow‐up.

Comparison 7 Family relationships, Outcome 3 Long‐term follow up.
| Families and Schools Together (FAST) compared to no intervention (or care as usual) for children and their families | ||||||
| Patient or population: children and their families | ||||||
| Outcomes | Anticipated absolute effects* (95% CI) | Relative effect | № of participants | Certainty of the evidence | Comments | |
| Risk with no intervention (or care as usual) | Risk with FAST | |||||
| Child school performance: long‐term follow up | ‐ | Mean score in the intervention group was0.02 standard deviations lower | ‐ | 6276 children (approximately) (4 RCTs) | ⊕⊕⊕⊝ | Positive effect sizes indicate improvement. Evidence suggests that FAST probably does not have an important positive effect on child school performance at long‐term follow‐up |
| Child adverse events ‐ not measured | ‐ | ‐ | ‐ | ‐ | ‐ | ‐ |
| Parental substance abuse ‐ not measured | ‐ | ‐ | ‐ | ‐ | ‐ | ‐ |
| Parental stress ‐ not measured | ‐ | ‐ | ‐ | ‐ | ‐ | ‐ |
| Child internalising behaviours | ‐ | Mean score in the intervention group was 0.03 standard deviations lower (0.11 lower to 0.17 higher) | ‐ | 908 (approximately) (4 RCTs) | ⊕⊕⊝⊝ | Negative effect sizes indicate improvement. Evidence suggests that FAST probably does not result in an important reduction in child internalising behaviours |
| Child externalising behaviours | ‐ | Mean score in the intervention group was 0.19 standard deviations lower | ‐ | 754 (approximately) (4 RCTs) | ⊕⊕⊝⊝ | Negative effect sizes indicate improvement. FAST may result in a small and possibly important positive effect on parent reports of child externalising behaviour at follow‐up. However, teacher reports for this outcome suggest small and probably unimportant effect sizes, as did parent reports of child externalising behaviours immediately after completion of the intervention |
| Family relationships | ‐ | Mean score in the intervention group was 0.08 standard deviations higher | ‐ | 2569 (approximately) (4 RCTs) | ⊕⊕⊕⊝ | Positive effect sizes indicate improvement. FAST may result in a small and probably unimportant positive effect on parent reports of family relations |
| *The risk in the intervention group (and its 95% CI) is based on the assumed risk in the comparison group and the relative effect of the intervention (and its 95% CI). CI: confidence interval; FAST: Families and Schools Together; RCT: randomised controlled trial. | ||||||
| GRADE Working Group grades of evidence. | ||||||
| aCertainty of evidence downgraded because two studies were at high risk for recruitment bias and two studies were at high risk for incomplete outcome data (attrition bias). | ||||||
| Random sequence generation |
|
|
| Allocation concealment |
|
|
| Blinding of participants and personnel |
|
|
| Blinding of outcome assessment |
|
|
| Incomplete outcome data |
|
|
| Selective outcome reporting |
|
|
| Issue | Method |
| Measures of treatment effect | Continuous data Where necessary, we will compute effect measures from P values, t statistics, analysis of variance (ANOVA) tables, or other statistics |
| Unit of analysis issues | Cluster‐randomised trials Where clustering has been appropriately accounted for within the analysis of the original study data, clustered data can be used in a meta‐analysis. However, a 'unit of analysis' error occurs when data from cluster‐randomised trials have been analysed as though the unit of allocation has been the individual rather than the cluster. In these circumstances, corrections are required to produce accurate effect size estimates (Section 16.3.4; Higgins 2011c). To calculate the design effect, we need a measure of the relative variation both within and between clusters. This is known as the intraclass correlation coefficient (ICC). Where the ICC from the original trial is not available, we will use external estimates from similar studies to calculate the design effect. If there are no reported estimates in the literature, we will perform a sensitivity analysis using low (0.01), medium (0.05), and high (0.10) values for ICC. However, as the design effect must be rounded up for entry into RevMan 5 (Review Manager 2014), this approach may be unsuitable for small studies, and we may need to employ an alternative approach that multiplies the standard errors (SEs) of the effect size by the square root of the design effect. In either case, where we include cluster‐randomised trials in the meta‐analysis, we will clearly identify them and will explain the method of calculating effect size estimates and their standard errors. In these circumstances, we will employ a sensitivity analysis to test the robustness of any conclusions deduced from these methods (see Sensitivity Analysis below) |
| Multiple treatment arms We do not anticipate finding studies with multiple treatment groups. However, should we identify such studies, we will first combine all eligible intervention arms and compare these with all control arms, making a single, pair‐wise comparison. If such a strategy seems likely to prevent the investigation of important sources of heterogeneity, we will keep intervention arms separate and will compare each with a common control group, dividing the sample size of the latter proportionately across each comparison, thereby preventing double counting of individuals (Section 16.5.5; Higgins 2011c) | |
| Dealing with missing data | Where we are certain that missing data are 'missing at random' and unlikely to be related to the characteristics of the participants or study design, we will analyse the available data while ignoring the missing data (Higgins 2011c). Conversely, where there is no reason to believe that data are missing at random ‐ that is, as a result of publication or selective reporting bias ‐ we will work with a statistician to select replacement values using imputed mean values or multiple imputation methods |
| Assessment of reporting biases | Where 10 or more studies provide data on a particular outcome, we will draw funnel plots (estimated differences in treatment effects against their standard error). Symmetrical funnel plots are associated with low levels of bias. Asymmetrical funnel plots may reflect publication bias, but they can also reflect real relationships between trial size and effect size, such as when larger trials have lower compliance, and compliance is positively related to effect size. If we have reason to think that this is happening, we will look for a possible explanation in clinical variation across studies To test directly for publication bias, we will conduct a sensitivity analysis (see Sensitivity Analysis below) to compare results from published data vs unpublished data and data from other sources |
| Data synthesis | In future updates of this review, should we encounter serious funnel plot asymmetry, we will assume that neither the fixed‐effect nor the random‐effects models are appropriate and will present the results of both. Where both indicate the presence or absence of an effect, we will assume that we can have some confidence in the results. Where they disagree, we will report this In future, if some included studies report an outcome using dichotomous outcome measures and others use continuous measures, we will convert results from the former, from an OR to an SMD, as long as there is reason to assume that the underlying continuous measure approximates a normal or logistical distribution. Where this is not the case, we will conduct separate analyses |
| Subgroup analysis and investigation of heterogeneity | As the overuse of subgroup analysis is problematic (Deeks 2011), we will use subgroup analyses only to determine a small number of effect modifiers We will conduct the following 4 subgroup analyses.
N.B. Since the protocol was published (Macdonald 2017), the various FAST programmes have been renamed as Baby FAST, Elementary Level, Middle School Level, and High School Level FAST.
As no family size effects are noted in Crozier 2010, McDonald 2009b, and McDonald 2010, despite reports of differing average family sizes, we will not include family size in the subgroup analysis. |
| Sensitivity analysis | We will use sensitivity analyses to explore the impact of studies at high risk of bias on the robustness of review results, restricting the analyses to (1) studies or outcomes with low risk of assessment bias, (2) studies with low risk of attrition bias, and (3) studies with low risk of reporting bias. In addition:
|
| FAST: Families and Schools Together. | |
| Outcome or subgroup title | No. of studies | No. of participants | Statistical method | Effect size |
| 1 Immediate post‐test Show forest plot | 2 | Std. Mean Difference (Fixed, 95% CI) | ‐0.06 [‐0.34, 0.22] | |
| 2 Long‐term follow‐up Show forest plot | 4 | Std. Mean Difference (Fixed, 95% CI) | ‐0.02 [‐0.11, 0.08] | |
| Outcome or subgroup title | No. of studies | No. of participants | Statistical method | Effect size |
| 1 Immediate post‐test, parent report Show forest plot | 5 | Std. Mean Difference (Fixed, 95% CI) | ‐0.05 [‐0.21, 0.10] | |
| 2 Immediate post‐test, teacher report Show forest plot | 5 | Std. Mean Difference (Fixed, 95% CI) | ‐0.09 [‐0.18, 0.00] | |
| 3 Long‐term follow‐up, parent report Show forest plot | 4 | Std. Mean Difference (Fixed, 95% CI) | 0.03 [‐0.11, 0.17] | |
| 4 Long‐term follow‐up, teacher report Show forest plot | 4 | Std. Mean Difference (Fixed, 95% CI) | ‐0.06 [‐0.19, 0.07] | |
| Outcome or subgroup title | No. of studies | No. of participants | Statistical method | Effect size |
| 1 Immediate post‐test, parent report Show forest plot | 4 | Std. Mean Difference (Fixed, 95% CI) | ‐0.04 [‐0.20, 0.12] | |
| 2 Immediate post‐test, teacher report Show forest plot | 4 | Std. Mean Difference (Fixed, 95% CI) | ‐0.02 [‐0.11, 0.07] | |
| 3 Long‐term follow‐up, parent report Show forest plot | 4 | Std. Mean Difference (Fixed, 95% CI) | ‐0.19 [‐0.32, ‐0.05] | |
| 4 Long‐term follow‐up, teacher report Show forest plot | 4 | Std. Mean Difference (Fixed, 95% CI) | ‐0.10 [‐0.24, 0.04] | |
| Outcome or subgroup title | No. of studies | No. of participants | Statistical method | Effect size |
| 1 Short‐term follow‐up Show forest plot | 1 | Std. Mean Difference (Fixed, 95% CI) | 0.02 [‐0.11, 0.15] | |
| 2 Long‐term follow‐up Show forest plot | 2 | Std. Mean Difference (Fixed, 95% CI) | 0.03 [‐0.10, 0.16] | |
| Outcome or subgroup title | No. of studies | No. of participants | Statistical method | Effect size |
| 1 Immediate post‐test Show forest plot | 1 | Std. Mean Difference (Fixed, 95% CI) | 0.34 [0.15, 0.53] | |
| 2 Short‐term follow‐up Show forest plot | 1 | Std. Mean Difference (Fixed, 95% CI) | 0.20 [0.06, 0.33] | |
| 3 Long‐term follow‐up Show forest plot | 2 | Std. Mean Difference (Fixed, 95% CI) | 0.03 [‐0.07, 0.12] | |
| Outcome or subgroup title | No. of studies | No. of participants | Statistical method | Effect size |
| 1 Long‐term follow‐up Show forest plot | 1 | Std. Mean Difference (Fixed, 95% CI) | 0.11 [‐0.15, 0.38] | |
| Outcome or subgroup title | No. of studies | No. of participants | Statistical method | Effect size |
| 1 Immediate post‐test Show forest plot | 4 | Std. Mean Difference (Fixed, 95% CI) | 0.03 [‐0.27, 0.33] | |
| 2 Short‐term follow‐up Show forest plot | 1 | Std. Mean Difference (Fixed, 95% CI) | 0.00 [‐0.12, 0.13] | |
| 3 Long‐term follow up Show forest plot | 4 | Std. Mean Difference (Fixed, 95% CI) | 0.08 [‐0.03, 0.19] | |