Entrenamiento con ejercicios aeróbicos para pacientes adultos con fibromialgia
Resumen
Antecedentes
Habitualmente, a los pacientes con fibromialgia se les recomienda entrenamiento con ejercicios. Esta revisión es parte de una serie de revisiones acerca del entrenamiento con ejercicios para los pacientes con fibromialgia que reemplazará la revisión "Ejercicio para el tratamiento del síndrome de fibromialgia" publicada por primera vez en 2002.
Objetivos
• Evaluar los efectos beneficiosos y perjudiciales del entrenamiento con ejercicios aeróbicos en pacientes adultos con fibromialgia
• Evaluar las siguientes comparaciones específicas
० Ejercicio aeróbico versus condiciones de control (p.ej., tratamiento habitual, control en lista de espera, actividad física habitual)
० Ejercicio aeróbico versus intervenciones aeróbicas (p.ej., trote versus caminata rápida)
० Ejercicio aeróbico versus intervenciones sin ejercicios (p.ej., fármacos, educación)
No se evaluaron comparaciones específicas que incluían ejercicio aeróbico versus otras intervenciones con ejercicios (p.ej., ejercicio de resistencia, ejercicio acuático, ejercicio de flexibilidad, ejercicio combinado). Otras revisiones sistemáticas han examinado o examinarán estas comparaciones (Bidonde 2014; Busch 2013).
Métodos de búsqueda
Se hicieron búsquedas en la Cochrane Library, MEDLINE, Embase, Cumulative Index to Nursing and Allied Health Literature (CINAHL), Physiotherapy Evidence Database (PEDro), Thesis and Dissertation Abstracts, Allied and Complementary Medicine Database (AMED), en la World Health Organization International Clinical Trials Registry Platform (WHO ICTRP) y en el ClinicalTrials.gov registry hasta junio 2016, sin restricciones de idioma, y se revisaron las listas de referencias de ensayos recuperados para identificar ensayos potencialmente relevantes.
Criterios de selección
Se incluyeron ensayos controlados aleatorios (ECA) en adultos con diagnóstico de fibromialgia que comparaban intervenciones de entrenamiento aeróbico (actividad física dinámica que aumenta la frecuencia respiratoria y cardíaca hasta niveles submáximos durante un período prolongado) versus ningún ejercicio u otra intervención. Los resultados principales fueron la calidad de vida relacionada con la salud (CVRS), la intensidad del dolor, la rigidez, la fatiga, la función física, los retiros y los eventos adversos.
Obtención y análisis de los datos
Dos autores de la revisión de forma independiente seleccionaron los ensayos para la inclusión, extrajeron los datos, realizaron una evaluación del riesgo de sesgo y evaluaron la calidad del conjunto de pruebas para los principales resultados mediante el enfoque GRADE. Se utilizó un umbral de 15% para el cálculo de las diferencias clínicamente relevantes entre los grupos.
Resultados principales
Se incluyeron 13 ECA (839 pacientes). Los estudios estuvieron en riesgo de sesgo de selección, de realización y de detección (debido a la falta de cegamiento para los resultados autoinformados) y presentaron un riesgo bajo de sesgo de deserción y de informe. Se priorizaron los hallazgos donde el ejercicio aeróbico se comparó con un control de ningún ejercicio y se presentaron aquí de forma completa.
Ocho ensayos (con 456 participantes) aportaron evidencia de baja calidad sobre la intensidad del dolor, la fatiga, la rigidez y la función física; y evidencia de calidad moderada sobre los retiros y la CVRS al momento de la finalización de la intervención (seis a 24 semanas). Con la excepción de los retiros y los eventos adversos, las medidas de resultado principales fueron autoinformadas y se expresaron en una escala de 0 a 100 (los valores inferiores son mejores, las diferencias de medias [DM] negativas / diferencias de medias estandarizadas [DME] indican una mejoría). Los efectos del ejercicio aeróbico versus control fueron los siguientes: CVRS: media = 56,08; cinco estudios; N = 372; DM ‐7,89; IC del 95%: ‐13,23 a ‐2,55; mejoría absoluta del 8% (3% a 13%) y mejoría relativa del 15% (5% a 24%); intensidad del dolor: media = 65,31; seis estudios; N = 351; DM ‐11,06; IC del 95%: ‐18,34 a ‐3,77; mejoría absoluta del 11% (IC del 95%: 4% a 18%) y mejoría relativa del 18% (7% a 30%); rigidez: media = 69; un estudio; N = 143; DM ‐7,96; IC del 95%: ‐14,95 a ‐0,97; diferencia absoluta en la mejoría del 8% (1% a 15%) y cambio relativo en la mejoría del 11,4% (21,4% a 1,4%); función física: media = 38,32; tres estudios; N = 246; DM ‐10,16; IC del 95%: ‐15,39 a ‐4,94; cambio absoluto en la mejoría del 10% (15% a 5%) y cambio relativo en la mejoría del 21,9% (33% a 11%); y fatiga: media = 68; tres estudios; N = 286; DM ‐6,48; IC del 95%: ‐14,33 a 1,38; cambio absoluto en la mejoría del 6% (mejoría del 12% a 0,3% peor) y cambio relativo en la mejoría del 8% (mejoría del 16% a 0,4% peor). El análisis agrupado dio lugar a un cociente de riesgos (CR) de calidad moderada para los retiros (17 por 100 y 20 por 100 en los grupos de control y de intervención, respectivamente; ocho estudios; N = 456; CR 1,25; IC del 95%: 0,89 a 1,77; cambio absoluto del 5% más retiros con el ejercicio [3% menos a 12% más]).
Tres ensayos aportaron evidencia de baja calidad sobre los efectos a largo plazo (24 a 208 semanas posintervención) e informaron que los beneficios para el dolor y la función persistieron pero no para la CVRS ni la fatiga. Los retiros fueron similares, y los investigadores no evaluaron la rigidez ni los eventos adversos.
No existe seguridad acerca de los efectos de una intervención aeróbica versus otra, debido a que la evidencia fue de calidad baja a muy baja y se derivó de ensayos individuales solamente, lo cual impidió la realización de metanálisis. De igual manera, no existe seguridad acerca de los efectos del ejercicio aeróbico sobre los controles activos (es decir, educación, tres estudios; entrenamiento en el manejo del estrés, un estudio; medicación, un estudio) debido a la evidencia de calidad baja a muy baja proporcionada por los ensayos individuales. La mayoría de los estudios no midieron los eventos adversos; por lo tanto no existe seguridad acerca del riesgo de eventos adversos asociados con el ejercicio aeróbico.
Conclusiones de los autores
En comparación con el control, la evidencia de calidad moderada indica que el ejercicio aeróbico probablemente mejora la CVRS y los retiros por todas las causas y la evidencia de baja calidad sugiere que el ejercicio aeróbico puede disminuir levemente la intensidad del dolor, puede mejorar levemente la función física y puede dar lugar a una diferencia pequeña en la fatiga y la rigidez. Tres de los resultados informados lograron importancia clínica (CVRS, función física y dolor). Los efectos a largo plazo del ejercicio aeróbico pueden incluir poca o ninguna diferencia en el dolor, la función física y los retiros por todas las causas y no existe seguridad acerca de los efectos a largo plazo sobre los resultados restantes. La calidad de la evidencia se disminuyó debido al número pequeño de ensayos y participantes incluidos entre los ensayos, y debido a cuestiones relacionadas con el riesgo incierto o alto de sesgo (sesgos de realización, selección y detección). El ejercicio aeróbico parece ser bien tolerado (tasas similares de retiros a través de los grupos), aunque la evidencia sobre los eventos adversos es escasa, de manera que hay dudas en cuanto a su seguridad.
PICO
Resumen en términos sencillos
Ejercicios aeróbicos para pacientes adultos con fibromialgia
Esta revisión resume los efectos del ejercicio aeróbico para los adultos con fibromialgia.
¿Qué es el ejercicio aeróbico?
Los ejercicios aeróbicos, como caminar y nadar, dan lugar a una respiración más difícil y a una frecuencia cardíaca más rápida que en reposo. Los beneficios de realizar ejercicio aeróbico incluyen el fortalecimiento del corazón y la mejoría de la circulación, la disminución de la presión arterial, y ayuda en el control del azúcar sanguíneo y el peso.
¿Qué problemas causa la fibromialgia?
Los pacientes con fibromialgia presentan dolor corporal crónico y a menudo presentan mayor fatiga (se sienten cansados), rigidez, depresión y problemas para dormir.
Características de los estudios
Se buscaron estudios hasta junio de 2016 y se encontraron 13 estudios (839 individuos). La mayoría de los estudios (61,5%) incluyeron sólo participantes mujeres. La edad promedio de los participantes fue de 41 años (mínimo de 32 a un máximo de 56 años). Según los criterios de inclusión/exclusión, la mayoría de los participantes no estaba haciendo ejercicio antes de comenzar el estudio.
Las intervenciones aeróbicas se compararon con los controles (lista de espera, tratamiento habitual, actividades diarias habituales) durante seis a 24 semanas. En promedio, las sesiones de ejercicio se proporcionaron dos a tres veces por semana durante 35 minutos cada sesión. Los ejercicios incluyeron caminata, ciclismo, trote y ejercicios aeróbicos de bajo impacto y acuáticos. Los participantes hicieron ejercicios a diferentes intensidades, comenzando de forma suave y aumentando a medida que avanzaba el estudio. Todos los programas fueron supervisados.
Resultados clave al final del tratamiento
Se otorgó prioridad a los hallazgos sobre el ejercicio aeróbico comparado con un control de ningún ejercicio, los cuales se presentan aquí de forma completa. La evidencia de calidad moderada reveló que el ejercicio aeróbico mejoró la CVRS, y la evidencia de baja calidad mostró una mejoría en la función física y disminuyó el dolor, la fatiga y la rigidez en comparación con el control. Hubo un número similar de pacientes que abandonaron en el grupo de intervenciones aeróbicas y el grupo de comparación. Se informaron eventos adversos menores, pero la presentación de informes fue inconsistente en estos estudios.
Cuatro estudios exploraron los efectos a largo plazo a las 24 a 208 semanas después de la finalización de la intervención. Informaron beneficios para el dolor y la función física entre los pacientes que realizaron ejercicio y no observaron ningún otro efecto.
Mejores cálculos de lo que les sucedió a los pacientes con fibromialgia cuando realizaron ejercicio aeróbico en comparación con intervenciones de control
Cada resultado a continuación se midió en una escala de 0 a 100 en la cual las puntuaciones inferiores fueron mejores.
CVRS después de 12 a 24 semanas: Los pacientes que realizaron ejercicio presentaron una mejoría del 7% (o 7 puntos, con una variación de 3 a 13 puntos) y consideraron la CVRS como de 48 puntos versus 56 puntos en el grupo de control.
Dolor después de seis a 24 semanas: Los pacientes que realizaron ejercicio presentaron una mejoría del 11% (u 11 puntos, con una variación de 4 a 18 puntos) y consideraron que el dolor fue de 56 puntos versus 65 puntos en el grupo de control.
Fatiga después de 14 a 24 semanas: Los que realizaron ejercicio presentaron una mejoría del 6% (o 6 puntos, con una variación de 12 mejor a 0,3 peor) y consideraron que la fatiga fue de 63 puntos versus 68 puntos en el grupo de control.
Rigidez después de 16 semanas: Los que realizaron ejercicio presentaron una mejoría del 8% (u 8 puntos, con una variación de 1 a 15) y consideraron que la rigidez fue de 61 puntos versus 69 puntos en el grupo de control.
Función física después de ocho a 24 semanas: El grupo de ejercicio aeróbico presentó una mejoría del 10% (o 10 puntos, con una variación de 15 a 5) y los participantes consideraron que la función física fue de 37 puntos versus 46 puntos en el grupo de control.
Otros resultados:
Retiros del tratamiento
Un total de 20 de cada 100 pacientes abandonó el grupo de ejercicio aeróbico comparado con 17 de cada 100 del grupo de control (3% más, con una variación de 3% menos a 12% más) por cualquier motivo.
Eventos adversos.
No se tiene información precisa sobre los eventos adversos asociados con el ejercicio aeróbico. Algunos informes describen un aumento del dolor o la fatiga, y uno de los 496 participantes que realizaron ejercicio aeróbico presentó una fractura por estrés en el hueso del pie (metatarsiano). Lo anterior puede haberse debido a la intervención del azar.
Calidad de la evidencia
La evidencia muestra que el ejercicio aeróbico puede mejorar la CVRS, el dolor, la rigidez y la función física, y probablemente da lugar a un número similar de pacientes que abandonan en cada grupo. El ejercicio aeróbico no parece mejorar la fatiga. La calidad de la evidencia se consideró baja o moderada debido al número pequeño de pacientes incluidos en los estudios, algunas cuestiones que incluían el diseño del estudio y la certidumbre baja de los resultados.
Authors' conclusions
Summary of findings
| Aerobic exercise training compared with control for fibromyalgia | ||||||
| Patient or population: individuals with fibromyalgia Outcome: measured at the end of the intervention | ||||||
| Outcomes | Illustrative comparative risks* (95% CI) | Relative effect | Number of participants | Quality of the evidence | Comments | |
| Assumed risk | Corresponding risk | |||||
| Control | Aerobic exercise training | |||||
| Health‐related quality of life | Mean health‐related quality of life ranged across control groups from | Mean health‐related quality of life in the intervention groups was | 372 (5 studies) | ⊕⊕⊕⊝ | Absolute change 8% (3% to 13%) better Relative changec 15% (5% to 24%) better NNTB 6 (4 to 16)d | |
| Pain intensity Scale from 0 to 100 mm (0 is best) | Mean pain intensity ranged across control groups from | Mean pain intensity in the intervention groups was | 351 | ⊕⊕⊝⊝ | Absolute change 11% (4% to 18%) better Relative changec 18% (7% to 30%) better NNTB 4 (2 to 15)d | |
| Fatigue Scale from 0 to 100 mm (0 is best) | Mean fatigue ranged across control groups from | Mean fatigue in the intervention groups was 6.06 lower (‐12.41 lower to 0.30 higher) | 246 | ⊕⊕⊝⊝ | Absolute difference 6% improvement (12% improvement to 0.3% worse) Relative changec 8% improvement (16% improved to 0.4% worse) NNTB n/a | |
| Stiffness Follow‐up: 16 weeks | Mean stiffness in control groups was | Mean stiffness in the intervention groups was | 143 | ⊕⊕⊝⊝ | Absolute difference 8% (1% to 15%) improvement Relative changec 11% improvement (1% to 21% improved) NNTB 6 (3 to 218)d | |
| Physical function | Mean physical function ranged across control groups from | Mean physical function in the intervention groups was 10.16 lower (15.39 to 4.94 lower) | 246 | ⊕⊕⊝⊝ | Absolute change 10% (95% CI 15 to 5) improvement Relative changec 21.9% (95% CI 33.2 to 10.7) improvement NNTB 5 (3 to 13)d | |
| Withdrawals | 17 per 100 | 20 per 100 | RR 1.25 (0.89 to 1.77) | 456 | ⊕⊕⊕⊝ | Absolute change: 5% more withdrawals with exercise (3% fewer to 12% more) Relative change 25% more (11% fewer to 77% more) NNTH n/a |
| Adverse events Descriptive information | "the present study findings confirm earlier studies that have shown aerobic exercise to reduce tender point tenderness, increase work capacity without adverse side effects..." (Wigers 1996; pages 83‐84). The following statements show some minor adverse events following aerobic exercise training: "...unable to exercise after an injury" (Sanudo 2010; pages 1840), but it is unclear whether the injury was related to intervention participation: "One participant assigned to the short bout exercise withdrew after developing a metatarsal stress fracture" (Schachter 2003; page 347) | |||||
| *The basis for the assumed risk (e.g. the median control group risk across studies) is provided in footnotes. The corresponding risk (and its 95% confidence interval) is based on the assumed risk in the comparison group and the relative effect of the intervention (and its 95% CI). | ||||||
| GRADE Working Group grades of evidence | ||||||
| aStudy author (intervention length in weeks): King 2002 (12), Schachter 2003 and Kayo 2011 (16), Gowans 2001 (23), Sanudo 2010 (24) jStudy author (intervention length in weeks): Wigers 1996 (14), Kayo 2011 and Schachter 2003 (16), Sanudo 2010 (24) | ||||||
Background
Description of the condition
Fibromyalgia is a chronic condition characterized by widespread muscular pain and soft tissue tenderness (Mease 2005; Wolfe 2010; Schmidt‐Wilcke 2011). Fibromyalgia is often associated with other somatic complaints, disability, sleep disturbances, anxiety, cognitive dysfunction, depressive episodes, and physical deconditioning. These symptoms significantly affect quality of life and result in both physical and psychosocial disabilities with important implications for family, employment, and independence (Mease 2005). Several abnormalities in brain and neural function in patients with fibromyalgia appear to have a genetic basis (Arnold 2013; Staud 2002).
Canadian statistics reflect the self‐reported prevalence of fibromyalgia at 1.1% across all ages, with female diagnoses outnumbering male diagnoses (1.83% female to 0.33% male; McNalley 2006). Prevalence rates among European countries (France, Italy, Portugal, Spain) are estimated to range between 1.4% (France) and 3.7% (Italy), and fibromyalgia diagnoses are twice as common among females (Branco 2010). Nakamura and colleagues found the rate in Japan to be 2.1% (Nakamura 2014); this is higher than the fibromyalgia prevalence in China of about 0.05% (Zeng 2008). The American College of Rheumatology (ACR) has prepared new diagnostic criteria for fibromyalgia (Wolfe 2010; Wolfe 2011). Use of these new diagnostic criteria may change prevalence rates in North America. In Olmsted County, Minnesota, in the USA, prevalence with age‐ and sex‐adjusted criteria was estimated at 6.4% (Vincent 2013). In Germany, use of the new criteria revealed a prevalence rate of 2.1%, with a higher rate among females (2.4%) than males (1.8%; Wolfe 2013).
Fibromyalgia research reveals high levels of health care utilization and high costs associated with medical visits, drug prescriptions, and diagnostic testing (Hauser 2010; Kelley 2011). Individuals with fibromyalgia are often seen by health care professionals for concomitant medical issues (somatic comorbidity associated with fibromyalgia) and related pharmacological treatment. Several Cochrane systematic reviews and a Cochrane overview on the use of medications for treatment of fibromyalgia have yielded tier‐2 evidence of moderate pain relief with pregabalin (an antiepileptic; Wiffen 2013), amitriptyline (a tricyclic antidepressant; Moore 2012), milnacipran (a serotonin–norepinephrine reuptake inhibitor; Derry 2012), and monoamine oxidase inhibitors (Tort 2012). These Cochrane reviews have informed recent clinical practice guidelines (Macfarlane 2016). Systematic reviews of non‐pharmacological treatments have provided low‐quality evidence of the effectiveness of exercise (Bidonde 2014; Bidonde 2014a; Busch 2008), cognitive‐behavioral therapy (Bernardy 2013), and acupuncture (Deare 2013) in the management of fibromyalgia. Ablin 2013 noted that "recent evidence‐based interdisciplinary guidelines concur on the importance of treatments tailored to the individual patient and further emphasize the necessity of self management strategies which include exercise and psychological techniques."
People with fibromyalgia are often intolerant of physical activity and tend to have a sedentary lifestyle that increases risks of additional morbidity (Park 2007; Raftery 2009). Exercise is an important part of fibromyalgia management (Goldenberg 2004; Hauser 2010a; Rooks 2008) because individuals with fibromyalgia are often deconditioned by low cardiovascular fitness (Turk 2002), muscle strength, and muscle endurance (Bennett 1989; Bennett 1998). Whether physical deconditioning plays a role in the causal pathway of fibromyalgia is not clear, but several studies have demonstrated that individuals with fibromyalgia can perform different types of exercise (Bidonde 2014; Busch 2013; Carville 2008; Hauser 2010). Regular exercise is an important factor in countering age‐related loss of muscle, bone mass, and functional independence for the general population; therefore, individuals with fibromyalgia may improve their overall health and moderate risks associated with other chronic conditions by following an exercise program (Rooks 2008). Answers to questions regarding the best type of exercise, appropriate intensity, and delivery options for exercise interventions are still needed. This review on aerobic exercise training provides information that will guide clinicians and patients with fibromyalgia in designing the most effective aerobic exercise training interventions. Definitions for some of the terms utilized in this review can be found in the "Glossary of terms" (Table 1).
| Term | Definition |
| Agonist‐antagonist muscle contraction | Agonist muscles and antagonist muscles refer to muscles that cause or inhibit movement. Agonist muscles cause movement to occur through their own contraction, and antagonist muscles oppose a specific movement, for example, biceps (agonist) and triceps (antagonist) muscles |
| Amitriptyline | A widely use tricyclic antidepressant medication; it is used to treat several mental illnesses/disorders such as major depression, anxiety, psychosis, bipolar disorder, etc. Other uses include prevention of neuropathic pain such as fibromyalgia |
| Biomarker | In medicine, "biomarker" is a term that is often used to refer to measurable characteristics that reflect the severity or presence of some disease state. It is often an indicator of a particular disease state or some other psychological state of an organism |
| Cardiorespiratory fitness | The ability of the circulatory and respiratory systems to supply oxygen to muscles during sustained physical activity |
| Cognitive‐behavioral therapy | A form of therapy in which the goal is to diminish symptoms by correcting distorted thinking based on negative self‐perceptions and expectations |
| Concomitant | Existing or concurring with something else |
| Detraining | Losing physical and health effects gained during exercise training by stopping exercise |
| Exercise | Physical activity that is planned, structured, and repetitive, and [that] has as a final or intermediate objective of improvement or maintenance of physical fitness (Garber 2011) |
| Exercise training | Program that is designed to meet individual health and physical fitness goals; a single exercise session should include warm‐up, stretching, conditioning, and cool‐down components. The rate of progression depends on the individual's health status and exercise tolerance |
| Genetic | Considered a field of biology, genetics is the study of genes within living organisms; pertaining or according to genetics |
| Heart rate reserve (HRR) | Difference between resting heart rate (HRrest) and maximum heart rate (HRmax). Heart rate reserve is used to determine exercise heart rates |
| Hormones | Any of various internally secreted compounds, such as insulin or thyroxine, formed in endocrine glands that affect the functions of specifically receptive organs or tissues when transported to them by body fluids |
| Inflammatory | Pathology of or caused by inflammation; biological response of body tissues to harmful stimuli such as irritants, damaged cells, or pathogens |
| Maximal aerobic performance | Maximum rate of oxygen consumption as measured during incremental exercise |
| Maximum heart rate (HRmax) | The highest number of beats per minute your heart can reach during maximum physical exertion. This rate is individual and depends on hereditary factors and age |
| Microtrauma | Trauma to muscle cells |
| Milnacipran | A serotonin‐norepinephrine reuptake inhibitor |
| Min × d−1 | Minutes per day |
| Monoamine oxidase inhibitors | An oxidoreductase inhibitor of a single amino group neurotransmitter |
| Muscle strength | A physical test of the amount of force a muscle can generate |
| Neurotransmitters | Any of several chemical substances, such as epinephrine or acetylcholine, that transmit nerve impulses across a synapse to a postsynaptic element, such as another nerve, muscle, or gland |
| Non‐pharmacological | Treatment that does not include medication |
| OMERACT | OMERACT (Outcome Measures in Rheumatology) is an independent initiative of international health professionals interested in outcome measures in rheumatology. Over the past 20 years, OMERACT has served a critical role in the development and validation of clinical and radiographic outcome measures in rheumatoid arthritis, osteoarthritis, psoriatic arthritis, fibromyalgia, and other rheumatic diseases (www.omeract.org). OMERACT is linked to the Cochrane Collaboration Musculoskeletal Review Group, where outcomes endorsed by OMERACT are recommended for use in Cochrane Systematic Reviews |
| Pathophysiology | The physiology of abnormal or diseased organisms or their parts |
| Perceived exertion | Amount of effort that is perceived by someone, usually rated on a scale of 6 to 20 or 1 to 10 |
| Physical activity | Any bodily movement produced by skeletal muscles that results in energy expenditure above resting (basal) levels. Physical activity broadly encompasses exercise, sports, and physical activities done as part of daily living, occupation, leisure, and active transportation (Garber 2011) |
| Physical fitness | Ability to carry out daily tasks with vigor and alertness, without undue fatigue and with ample energy to enjoy (leisure) pursuits and to meet unforeseen emergencies. Physical fitness is operationalized as "[a set of] measurable health and skill‐related attributes" |
| Physical function | The capacity of an individual to carry out physical activities of daily living. Physical function reflects motor function and control, physical fitness, and habitual physical activity and is an independent predictor of functional independence, disability, and morbidity |
| Physiology | Branch of biology dealing with the functions and activities of living organisms and their parts, including all physical and chemical processes |
| Predicted maximum heart rate (HRmax‐p) | HRmax‐p is a score equivalent to maximum heart rate (HRmax). HRmax‐p may provide a way to define training intensities as percentages of maximum heart rate and to follow maximum heart rate changes due to training without an exhaustive maximal stress test |
| Pregabalin | An antiepileptic medication |
| Prevalence | Rate of occurrence of a condition, usually expressed on a per‐year basis |
| Skewness | Not every distribution of data is symmetrical ‐ sets of data that are not symmetrical are said to be "asymmetrical." The measure of how asymmetrical a distribution can be is called "skewness" |
| Sleep disturbance | A score derived from a questionnaire that measures sleep quantity and quality. The Medical Outcomes Survey Sleep Scale measures 6 dimensions of sleep (initiation, staying asleep, quantity, adequacy, drowsiness, shortness of breath, snoring) |
| Somatic comorbidities | Conditions of the body related to a disease |
| Symptoms | Patients' perceptions of an "abnormal" physical, emotional, or cognitive state |
| Tenderness | Pain evoked by tactile pressure |
Description of the intervention
For this review, we focused on studies that examined aerobic exercise training in the management of fibromyalgia. According to the American College of Sports Medicine (ACSM) guidelines for exercise testing and prescription, "aerobic exercise (also called cardiorespiratory or endurance exercise) represents a broad range of physical activities such as walking, jogging, cycling, and dancing performed at submaximal intensities that can be sustained from minutes to hours, depending in part on the fitness level of the individual and the intensity of the exercise. Aerobic exercise training represents organized regimens of physical activity that are repeated over time" (ACSM 2013). We also included two studies of leisure time physical activity ‐ a less structured intervention, in which participants were advised to perform moderate‐intensity aerobic activity on their own. Moderate and vigorous programs of aerobic exercise training and leisure time physical activity have been shown to improve physical fitness, lower risk of all‐cause and cardiovascular disease mortality and morbidity (Garber 2011), and achieve other health benefits (ACSM 2013, pages 7‐10).
The ACSM position paper on quantity and quality of exercise for developing fitness in apparently healthy adults provides well‐recognized and widely accepted guidelines for aerobic and other types of exercise training (Garber 2011). In its position paper, the ACSM recommends that for aerobic exercise, most adults should engage in moderate‐intensity cardiorespiratory exercise training using large muscle groups and rhythmical activities for 30 minutes or longer per day on five or more days per week for a total of 150 minutes or longer; or vigorous‐intensity cardiorespiratory exercise training for 20 minutes or longer per day on three or more days per week for a total of 75 minutes or longer per week; or a combination of moderate‐ and vigorous‐intensity exercise performed to achieve a total energy expenditure of 500 to 1000 metabolic equivalent (MET) minutes per week.
The ACSM position paper (Garber 2011) and subsequent publications (ACSM 2013) have described aerobic exercise training based on the FITT‐VP principle of exercise prescription: frequency (F), intensity (I), time or duration (T), type or mode (T), total volume (V), and progression (P), with increased training volume, as explained below.
-
F ‐ Exercise frequency refers to the number of times per week that a person exercises.
-
I ‐ Exercise intensity can be described in terms of heart rate, oxygen consumption (VO2), perceived exertion, or METs. No studies have compared all methods of exercise intensity at the same time, and these methods are not necessarily completely equivalent to each other (ACSM 2013). Exercise intensity is most accurately determined from data measured during tests of maximal aerobic performance. Such tests have not been commonly employed in fibromyalgia and exercise research. Although the calculation is subject to greater error, intensity is more commonly determined from predictive equations (ACSM 2013). Many studies included in this review used predictive heart rate calculations to determine the intensity of the exercise training intervention and described training intensity as a percentage of participants’ predicted maximal heart rate. The specific range of values used to classify exercise intensity as moderate or vigorous has changed over time, guided by research over the past 40 years (ACSM 2013). We have included in this review a table that shows the current classification of aerobic exercise intensities as described by Garber 2011 (Table 2).
| Intensity | %VO2 reserve/% HR reserve | % HRmax | Perceived exertion scale (RPE) 6 to 20 |
| Very light | < 37 | < 57 | RPE < 9 |
| Light | 37 to 45 | 57 to 63 | RPE 9 (very light) to 11 (fairly light) |
| Moderate | 46 to 63 | 64 to 76 | RPE 12 (fairly light) to 13 (somewhat hard) |
| Vigorous | 64 to 90 | 77 to 95 | RRE 14 (somewhat hard to 17 (very hard) |
| Near maximal to maximal | ≥ 91 | ≥ 96 | RPE ≥ 18 (very hard) |
HR: heart rate; RPE: rating of perceived exertion; VO2: oxygen consumption
-
T ‐ Time (duration) of exercise refers to the length of an exercise session.
-
T ‐ Exercise type (mode) refers to the actual activity done for aerobic exercise.
-
V ‐ Total volume of exercise refers to the product of frequency, intensity, and time (FIT) of aerobic exercise.
-
P ‐ The recommended rate of progression depends on the participant’s health status, physical fitness, training responses, and exercise program goals. Progression may consist of raising any of frequency, intensity, time, or type of exercise. The ACSM recommends increasing time of aerobic exercise first, then increasing training volume through changes in frequency, intensity, or time.
How the intervention might work
The pathophysiology of fibromyalgia includes changes in brain and neural structure and function, muscular physiology, hormonal factors, neurotransmitters, neuroendocrine transmitters, inflammatory markers, and genetic influences, resulting in augmented experiences and lowered inhibition of pain and other sensations (Jahan 2012; Marcus 2011;Schmidt‐Wilcke 2011). Muscle abnormalities that may result in weakness, fatigue, and muscle pain for individuals with fibromyalgia include reductions in type II fibers, abnormal muscle metabolism, excessive agonist–antagonist co‐contraction, lowered levels of adenosine triphosphate, and damage to nerve fibers (Park 2000;Schmidt‐Wilcke 2011). Mood disorders and psychiatric comorbidities, which also are associated with fibromyalgia, are linked to disturbed stress adaptation responses due to hypothalamic‐pituitary axis abnormalities and interactions among biological, psychological, and behavioral mechanisms (Jahan 2012; Schmidt‐Wilcke 2011).
Effective treatment and management strategies for fibromyalgia consist of non‐pharmacological therapies such as exercise (Nuesch 2013; Schmidt‐Wilcke 2011). Exercise, primarily aerobic exercise, is known to enhance feelings of “energy” and improve quality of life and cognitive function (Garber 2011). Regular exercise can also improve experiences of anxiety, depression, and pain, and can improve sleep quality (Busch 2011;Klaperski 2014; Moylan 2013; Yang 2012). Aerobic exercise alters neurotransmitters, neuromodulators, brain chemistry, and hypothalamic‐pituitary function (Barclay 2014; Klaperski 2014; Lopresti 2013; Moylan 2013; Puetz 2006). These elements are involved in brain function, and their improvement through exercise can lead to improved feelings of energy, improved mood, and reduced stress, anxiety, and depression (Klaperski 2014; Moylan 2013; Puetz 2006). With aerobic exercise, the hypothalamus releases increased levels of neurotransmitters including endorphins (Barclay 2014; Lopresti 2013; Scheef 2012). This increase in endorphin release results in decreased pain sensation and improved mood states and sleep quality (Scheef 2012; Yang 2012). Exercise may contribute to pain reduction by improving the physiological response to muscle microtrauma through increased resilience, repair, and resultant adaptation (McLoughlin 2011). Aerobic exercise also leads to reduced inflammation and oxidative stress in the body, which results in reduced anxiety and stress responses (Klaperski 2014; Moylan 2013). Overall, aerobic exercise can contribute to improved physiology, which can attenuate the alterations associated with fibromyalgia.
Why it is important to do this review
This is an update of a previously published Cochrane review on exercise for treating fibromyalgia (Busch 2002; Busch 2007). Review authors specifically evaluated the benefits of aerobic exercise training. Aerobic exercise has been recognized as beneficial for overall health and prevention/management of chronic conditions for more than 50 years (Bouchard 2012; Garber 2011). Increasing evidence has shown the benefits of aerobic exercise as a treatment for chronic conditions, including fibromyalgia (Nunan 2013). Aerobic exercise is the most easily accessible and most commonly recognized form of exercise, making it a reasonable recommendation and treatment strategy (Eyler 2003). However, current evidence showing the benefits of aerobic exercise for individuals with fibromyalgia is limited. A growing body of literature suggests that a review of these benefits is needed to accurately assess aerobic exercise effectiveness for improving the health of individuals with fibromyalgia. To provide indicators of the safety of aerobic exercise among patients with fibromyalgia, this review investigated adverse events and evaluated attrition rates and adherence to training protocols. New trials added to this update have served to strengthen the quality of the evidence.
Objectives
-
To evaluate the benefits and harms of aerobic exercise training for adults with fibromyalgia
-
To assess the following specific comparisons
-
Aerobic versus control conditions (eg, treatment as usual, wait list control, physical activity as usual)
-
Aerobic versus aerobic interventions (eg, running vs brisk walking)
-
Aerobic versus non‐exercise interventions (eg, medications, education)
-
We did not assess specific comparisons involving aerobic exercise versus other exercise interventions (eg, resistance exercise, aquatic exercise, flexibility exercise, mixed exercise). Other systematic reviews have examined or will examine these comparisons (Bidonde 2014; Busch 2013).
Methods
Criteria for considering studies for this review
Types of studies
We included trials described as randomized, even when methods of generating the random sequence were unclear or were not reported, or when the method of allocating participants was likely to be quasi‐random (ie, by alternation, date of birth, or a similar pseudo‐randomized method).
Types of participants
We included in the review studies that examined adults with fibromyalgia (≥ 18 years of age). We selected studies that used published criteria for the diagnosis (or classification) of fibromyalgia. Until recently, American College of Rheumatology (ACR) 1990 criteria have been used as the standard for classifying individuals as having fibromyalgia (Wolfe 1990). By this method, individuals are classified as having fibromyalgia when they have experienced widespread pain lasting longer than three months with at least 11 active tender points. Tender points are noted at 18 designated locations on the body and are defined as active if pain can be elicited by applying 4 kilogram tactile pressure.
A preliminary diagnostic tool, ACR 2010 (Wolfe 2010), which does not rely upon a physical tender point examination, is now available both as a clinician‐administered questionnaire and as a survey questionnaire (Wolfe 2011). This measure includes the Widespread Pain Index (19 areas representing anterior and posterior axis and limbs), in addition to a Symptom Severity Scale that contains items related to secondary symptoms such as fatigue, sleep disturbances, cognition, and somatic complaints. Scores on both measures are used to determine whether a person qualifies for a “case definition” of fibromyalgia. This tool has been found to correctly classify 88% of cases that meet ACR 1990 criteria, and it allows ongoing monitoring of symptom change among people with a current or previous fibromyalgia diagnosis (Wolfe 2010). Although measures focusing on tender point counts have been widely applied in clinical and research settings, the methods described by Wolfe 2010 and Wolfe 2011 promise to classify people with fibromyalgia more efficiently, while allowing improved monitoring of disease status over time.
Although some differences between published fibromyalgia diagnostic/classification criteria are known, for the purposes of this review, we considered all criteria to be acceptable and comparable.
Types of interventions
We examined trials that studied aerobic exercise training interventions (eg, cycling, walking) regardless of frequency, duration, or intensity. We defined aerobic exercise training as dynamic physical activity performed by using large muscle groups and rhythmical movements that increase heart rate and breathing rate above resting levels to submaximal levels for a prolonged period (Donatelle 2015).
In this review, we present data on interventions using the FITT‐VP method and express exercise intensity using both published percentages of maximum heart rate (HRmax) or heart rate reserve (HRR) and corresponding ACSM literal descriptors.
Comparator interventions included control (eg, treatment at usual, placebo, wait list control), other aerobic‐only exercise interventions (eg, low‐intensity walking), and non‐exercise interventions (eg, education, self‐management interventions).
Types of outcome measures
We designated seven outcomes as major outcomes ‐ heath‐related quality of life, pain intensity, fatigue, stiffness, physical function, number of participants who withdrew or dropped out, and adverse events ‐ and three as minor outcomes ‐ maximum cardiorespiratory function, submaximal cardiorespiratory function, and greater than 30% improvement in pain. In selecting these outcomes, we considered the consensus statement of Choy and associates (Choy 2009) regarding a core set of outcome measures for clinical trials in fibromyalgia, as well as anticipated effects of aerobic exercise training on physical fitness. We extracted data for the selected outcomes for any time points measured but included baseline, post‐treatment, and follow‐up data in this review. Review criteria required each included study to report measurement of one or more outcomes for at least one of these time periods.
Major outcomes
When an included study used more than one instrument to measure a particular outcome, we applied the following preferred hierarchy in choosing the outcome for analysis.
-
Health‐related quality of life (HRQL) ‐ This outcome consists of multidimensional indices used to measure general health status or health‐related quality of life, or both (Choy 2009). When included studies used more than one instrument to measure health‐related quality of life, we preferentially extracted data from the Fibromyalgia Impact Questionnaire (FIQ Total; Burckhardt 1991), followed by the Short Form Questionnaire (ie, SF‐36 Total or SF‐12 Total; Busija 2011; Ware 1993), and the EuroQol Group Quality of Life Questionnaire (EQ‐5D) (Wolfe 1997).
-
Pain intensity ‐ The International Association for the Study of Pain defined pain as “an unpleasant sensory and emotional experience associated with actual or potential tissue damage, or described in terms of such damage” (Merskey 1994). For the purposes of this review, we focused on a single aspect of the pain experience – pain intensity. When a single study reported more than one measure of pain intensity, we preferentially extracted measures of average pain intensity (as opposed to worst, least, or current pain) assessed by visual analogue scale (VAS), FIQ Pain, FIQ‐Translated, or McGill Pain VAS followed by the Numerical Pain Rating Scale. For studies that did not report unidimensional measures of pain intensity, we extracted composite measures that included pain intensity and interference (SF‐36 or Rand 36 Bodily Pain Scale) or pain intensity and suffering from pain (Mulitdimensional Pain Inventory ‐ Pain Severity Scale).
-
Fatigue ‐ Individuals with fibromyalgia and clinicians alike recognize fatigue as an important symptom of fibromyalgia (Choy 2009). Fatigue can be measured in a global manner, whereby an individual rates fatigue on a single‐item scale or using a multidimensional tool that breaks the experience of fatigue down into two or more dimensions, such as general fatigue, physical fatigue, mental fatigue, reduced motivation, reduced activity, and degree of interference with activities of daily living (Boomershine 2012). We accepted both unidimensional and multidimensional measures for this outcome. When included studies used more than one instrument to measure fatigue, we preferentially extracted data from the fatigue VAS (FIQ/FIQ‐Translated Fatigue, or single‐item fatigue VAS), followed by the SF‐36 or the Rand 36 Vitality Subscale, the Chalder Fatigue Scale (Total), the Fatigue Severity Scale, and the Multidimensional Fatigue Inventory.
-
Stiffness ‐ In focus groups conducted by Arnold 2008, individuals with fibromyalgia "... remarked that their muscles were constantly tense. Participants alternately described feeling as if their muscles were ‘lead jelly’ or ‘lead Jell‐O', and this resulted in a general inability to move with ease and a feeling of stiffness." A measure of stiffness commonly encountered in this literature is the FIQ Stiffness Subscale.
-
Physical function ‐ This outcome focuses on the basic actions and complex activities considered “essential for maintaining independence, and those considered discretionary that are not required for independent living, but may have an impact on quality of life” (Painter 1999). Cardiorespiratory fitness, neuromuscular attributes (eg, muscular strength, endurance, power), and muscle and joint flexibility are important determinants of physical function; therefore, this outcome is highly relevant as an outcome of exercise interventions. When more than one measure of physical function was available within a study, we preferentially extracted data from the FIQ Physical Impairment Scale (Burckhardt 1991), followed by the Health Assessment Questionnaire (HAQ) Disability Scale, the SF‐36 or the Rand 36 Physical Function Scale,the Sickness Impact Profile – Physical Disability Scale (Bergner 1981), and the Multidimensional Pain Inventory Household Chores Scale (Huskisson 1976; Huskisson 1983).
-
Adverse events ‐ We extracted the proportion of participants who experienced adverse events during the intervention (ie, injuries, exacerbations of pain, and/or other fibromyalgia symptoms); if this information was not available, we described the nature of the adverse events in a narrative report.
-
Withdrawals ‐ We recorded the proportion or number of participants who withdrew or dropped out of the study for any reason.
Minor outcomes
We present here a rationale and preference listing of minor outcomes. Among the three outcomes designated as minor outcomes, we included two fitness variables that potentially could be improved by aerobic exercise training.
-
Maximal cardiorespiratory function (CR max) ‐ Cardiorespiratory function is the ability of the heart, lungs, and circulatory system to efficiently supply oxygen and nutrients to working muscles. Rhythmical, aerobic‐type exercises involving large muscle groups are recommended for improving cardiovascular fitness. Maximal oxygen uptake (VO2max) is accepted as the best criterion for measuring cardiorespiratory fitness. Maximal oxygen uptake is the product of maximal cardiac output (L blood × min‐1) and the arterial‐venous oxygen difference (mL O2/L blood). Disadvantages of maximal tests include that they require the participant to exercise to the point of volitional fatigue and often require medical supervision and access to the emergency equipment. For this reason, maximal exercise testing is not always feasible in research, health, and fitness settings. For this review, we preferentially extracted data from maximal or symptom‐limited treadmill or cycle ergometer tests in units of mL/kg/min, energy expended, peak workload, or test duration. We also accepted data from exercise tests that yielded predicted maximum oxygen uptake.
-
Submaximal cardiorespiratory function (CR submax) ‐ Two major categories of submaximal tests are available: predictive and performance tests. Predictive tests are submaximal tests that are used to predict maximal aerobic capacity (Noonan 2000). Performance tests involve measuring responses to standardized physical activities that are typically encountered in everyday life. For this review, we preferentially extracted data on work completed at a specified exercise heart rate (eg, PWC170 test ‐ estimates physical work capacity at 170 beats per minute), followed by distance walked in six minutes (meters), the two‐minute walk test (meters), walking time for a set distance (seconds), an anaerobic threshold test, and timed walking distance (eg, Quarter Mile Walk Test).
-
Improvement in pain greater than 30% ‐ A 30% reduction is considered a benchmark for a moderately important change in pain intensity and is recommended by an Initiative on Methods, Measurement, and Pain Assessment in Clinical Trials (IMMPACT) for interpreting clinical trial efficacy (Dworkin 2008). When available, we extracted data on proportions of participants who met this criterion for intervention efficacy.
Search methods for identification of studies
The team Information Specialist conducted a comprehensive search of nine databases for physical activity interventions for adults with fibromyalgia. We screened citations found by electronic and manual searches and classified them by type of exercise training. This comprehensive search revealed physical activity intervention studies that included a subset of aerobic training interventions.
Electronic searches
We searched the following databases from database inception to June 2016 using current methods outlined in Chapter 6 of the Cochrane Handbook for Systematic Reviews of Interventions (Lefebvre 2011). We applied no language restrictions. We have provided full search strategies for each database in the appendices, as indicated in the list.
-
MEDLINE (OVID) 1946 to June 2016 (Appendix 1).
-
Embase (OVID), Embase Classic+Embase 1947 to June 2016 (Appendix 2).
-
Cochrane Library (Wiley) to the present (http://www.thecochranelibrary.com/view/0/index.html) (Appendix 3):
-
Cochrane Database of Systematic Reviews (Cochrane Reviews);
-
Database of Abstracts of Reviews of Effects (DARE);
-
Cochrane Central Register of Controlled Trials (CENTRAL);
-
Health Technology Assessment Database (HTA); and
-
NHS Economic Evaluation Database (EED).
-
-
Cumulative Index to Nursing and Allied Health Literature (CINAHL) (Ebsco) 1982 to June 2016 (Appendix 4).
-
Physiotherapy Evidence Database (PEDro) (www.pedro.org.au/) accessed to June 2016 (Appendix 5).
-
Dissertation Abstracts (ProQuest) accessed to June 2016 (Appendix 6).
-
Current Controlled Trials accessed to October 25, 2013 (discontinued) (Appendix 7).
-
Clinicaltrials.gov accessed from June 2014 to June 2016 (Appendix 7).
-
World Health Organization (WHO) International Clinical Trials Registry Platform (www.who.int/ictrp/) accessed to June 2016 (Appendix 8).
-
Allied and Complementary Medicine (AMED) (OVID) 1985 to June 2016 (Appendix 9).
Searching other resources
Two review authors independently reviewed reference lists from key journals, identified articles and reviews of all types of treatment for fibromyalgia, scrutinized all promising or potential references, and added appropriate titles to the search output.
Data collection and analysis
Review authors
Review authors were members of the Cochrane Musculoskeletal Group (CMSG) ‐ Exercise for Fibromyalgia Team (see Acknowledgments). The authors of this review were trained in data extraction using a standardized orientation program. Review authors worked independently and in pairs with at least one physical therapist in each pair to extract data. The team met regularly to discuss progress, to clarify procedures, to make decisions regarding inclusion or exclusion and classification of outcome variables, and to work collaboratively in the production of this review.
Selection of studies
Two review authors used a set of predetermined criteria to independently examine the titles and abstracts of studies generated by the searches (see Appendix 10). We retrieved full‐text publications for all abstracts of potential interest. We had all non‐English reports translated. Two review authors then independently examined the full‐text reports to determine whether studies met selection criteria (see Appendix 10). Review authors resolved disagreements and questions regarding interpretation of inclusion criteria through discussion with partners or by involvement of a third review team member if needed.
Data extraction and management
We used electronic data extraction forms developed and refined in our previous reviews to facilitate independent data extraction and consensus (Busch 2008). Pairs of review authors independently extracted data. We resolved disagreements by involving a third review author (AJB). Two review authors (AJB and JB) transferred data into Review Manager (RevMan 2014) software. We double‐checked that data were entered correctly by comparing data presented in the software against study reports. We noted in the Characteristics of included studies table whether outcome data were obtained directly from randomized controlled trial (RCT) authors or were transformed or estimated from a graph. If both unadjusted and adjusted values were reported for the same outcome, we extracted adjusted values. If data were analysed using an intention‐to‐treat (ITT) sample and another sample (eg, per‐protocol, as‐treated), we extracted ITT data.
We extracted the following data from the included studies.
-
Methods: study design, total duration of study and follow‐up (if applicable), and date of study.
-
Participants: N, mean age, age range, gender ratio, disease duration, diagnostic criteria, and inclusion and exclusion criteria.
-
Interventions, comparisons, concomitant treatments, recording:
-
for all interventions with an exercise component: intervention duration, frequency, duration of exercise sessions, intensity, progression model, mode, and congruence with ACSM guidelines (Appendix 11); and
-
for interventions with a non‐exercise component: frequency, duration, and main characteristics.
-
-
Outcomes: major and minor outcomes as indicated above. Additional outcomes assessed (recorded in the Characteristics of included studies section under "Outcomes Other"), means and standard deviations for tests at baseline and post intervention, and follow‐up for continuous outcomes. If post‐test data were not available, we extracted means and standard deviations of change scores.
-
Characteristics of trial design as outlined in the Assessment of risk of bias in included studies section.
-
Notes: funding for trial, language of the article, records of trial author contacts, and notable declarations of interest.
Assessment of risk of bias in included studies
Two review authors independently evaluated the risk of bias of each included study using a customized form based on the Cochrane "Risk of bias" tool (Higgins 2011a). The risk of bias tool addresses seven specific domains: sequence generation, allocation concealment, blinding of participants and personnel, blinding of outcome assessors, incomplete outcome data, selective outcome reporting (including publication bias), and other sources of bias. For "other" sources of bias, we considered sources such as baseline inequities despite randomization. We rated each criterion as introducing low, high, or unclear risk of bias according to information provided in the studies and sometimes through study author responses. We classified studies as having low risk of bias if all key domains had low risk of bias and no serious flaws. We assigned unclear risk when absence or ambiguity of information blocked assessors' ability to determine the potential for bias. In such cases, we revised assessments when study authors responded to our requests for more information. We resolved disagreements between review author pairs through consensus meetings or by involvement of a third review team member if needed.
Measures of treatment effect
For continuous data, we used group post‐test means and standard deviations to calculate effect sizes with RevMan 2014 software. We expressed effect sizes preferentially as mean differences (MDs) and 95% confidence intervals (95% CIs), but when different scales were used to measure the same outcome, we calculated standardized mean differences (SMDs) with corresponding 95% CIs instead. We analyzed dichotomous data as risk ratios (RRs) and 95% confidence intervals. We used RevMan 2014 software to generate forest plots to display study results.
In the comments column of summary of findings Table for the main comparison, we provided the absolute percent difference and the number needed to treat for an additional beneficial outcome (NNTB) or for an additional harmful outcome (NNTH). We provided the NNTB or NNTH only when the outcome showed a statistically significant difference. We calculated the NNTB for continuous measures using the Wells calculator (available at the CMSG Editorial Office). For dichotomous outcomes, such as adverse events, we calculated the NNTH from the control group event rate and the relative risk using the Visual Rx NNT calculator (Cates 2008).
In accordance with the Philadelphia Panel (Philadelphia Panel 2001), we assumed a minimal clinically important difference (MCID) of 15 points on a 100‐point continuous pain scale, and a relative difference of 15% on all functional scales, as clinically relevant. We used the MCID in calculating NNTB for continuous outcomes. For dichotomous outcomes, we calculated the absolute risk difference using the risk difference statistic available in RevMan 2014, and expressed the result as a percentage. For continuous outcomes, we calculated the absolute benefit as improvement in the intervention group minus improvement in the control group, expressed in original units.
We calculated the relative per cent change for dichotomous data as the risk ratio ‐ 1, and expressed this as a percentage. For continuous outcomes, we calculated the relative difference in changes from baseline as the absolute benefit divided by the baseline mean of the control group, expressed as a percentage.
Unit of analysis issues
Although many randomized controlled trials (RCTs) include only two parallel arms (ie, groups), some consist of three or four parallel arms; thus a single randomized trial can yield several relevant comparisons. This review examined any relevant comparisons that allowed evaluation of effects of aerobic exercise training interventions on people with fibromyalgia. For example, a three‐arm trial comparing aerobic versus drug treatment versus sham could appear in two separate analyses: aerobic versus sham and aerobic versus drug treatment. When a control group was used as a comparator twice in the same analysis, we halved the sample size of the control group (Deeks 2011).
Dealing with missing data
When numerical data were missing, we contacted the study author to request additional data required for analysis. We used open‐ended questions to request the information needed to assess risk of bias and/or treatment effects. When numerical data were available only in graphical form, we used Engauge version 5.1 (Mitchell 2012) to extrapolate means and standard deviations by digitalizing data points on the graphs provided.
For dichotomous outcomes (eg, number of withdrawals), we calculated the withdrawal rate by using the number of participants randomized in the group as the denominator. For continuous outcomes (eg, post‐test pain score), we calculated the MD or the SMD using the number of individuals analysed at that time point. When the number of individuals analysed was not presented for each time point, we used the number of individuals randomized to each group at baseline. When means were not reported, we accepted medians. When post‐test standard deviations were unavailable, we used standard deviations of pretest scores as estimates. When variance was expressed using statistics other than standard deviation (eg, standard error, confidence interval, P value), we computed standard deviations using the methods recommended in Chapter 7 of the Cochrane Handbook for Systematic Reviews of Interventions (Higgins 2011b). When we could not derive missing standard deviations using the methods described above, we imputed them from other studies included in the meta‐analysis.
Assessment of heterogeneity
We assessed clinical and methodological diversity in terms of participants, interventions, outcomes, and study characteristics for the included studies to determine whether a meta‐analysis was appropriate. We did this by reviewing data obtained from data extraction tables. We assessed statistical heterogeneity through visual inspection of the forest plot to look for obvious differences in results between studies, and through use of I² and Chi² statistical tests. As recommended in the Cochrane Handbook for Systematic Reviews of Interventions (Deeks 2011), we interpreted an I² value from 0% to 40% as might "not be important"; from 30% to 60% as may represent "moderate" heterogeneity; from 50% to 90% as may represent "substantial" heterogeneity; and from 75% to 100% as representing "considerable" heterogeneity. We interpreted the Chi² test with a P value ≤ 0.10 as indicating statistical heterogeneity.
When we removed a trial from the analysis, we noted changes in both heterogeneity and effect size. Because I² involves overlapping categories (eg, 0% to 40%, 30% to 60%) or "ambiguous" zones, we explored statistical heterogeneity thoroughly when noted (eg, I² between 50% and 60%). Given that values between 50% and 60% fall into an "ambiguous" zone, if we could find no apparent causes of heterogeneity, we kept the trial in the analysis and documented our decision.
Assessment of reporting biases
We planned to draw contour‐enhanced funnel plots (Sterne 2011) for each meta‐analysis to assess publication reporting bias if a large enough sample of studies (ie, more than 10 studies) was available/included in the meta‐analysis. As the statistical conditions were not met, we did not perform these analyses.
If the RCT protocol was available, we compared outcomes in the RCT protocol versus outcomes in the published report. For studies published after July 1, 2005, we screened the Clinical Trials Register at the International Clinical Trials Registry Platform of the World Health Organisation (http://apps.who.int/trialssearch) and at ClinicalTrials.gov (http://clinicaltrials.gov) to look for the RCT protocol.
We compared the fixed‐effect estimate against the random‐effects model to assess the possible presence of small sample bias (ie, by which the intervention effect is more beneficial in smaller studies) in the published literature. In the presence of small sample bias, the random‐effects estimate of the intervention is more beneficial than the fixed‐effect estimate (Sterne 2011).
Data synthesis
When two or more studies reported the same outcome and when interventions were deemed homogeneous enough, we pooled the data (meta‐analysis) using RevMan 2014. Before pooling data, we ensured the directionality of the data that permitted pooling; we arithmetically reversed selected scales as needed so higher values consistently had the same meaning. We ensured that scaling factors were consistent to permit calculation of MD (eg, 10‐cm scales expressed in mm to match 100‐mm scales). We presented results grouped by common comparator, for example, aerobics versus control, aerobics versus no exercise, aerobics versus aerobic intervention. We included all studies for adverse events and withdrawals.
"Summary of findings" table
We used GradePro (version 3.6; Schünemann 2011a) to prepare the "Summary of findings" table for major outcomes for aerobic exercise training versus no exercise control, at the end of the intervention. In the "Summary of findings" table, we integrated analysis of quality of evidence and magnitude of effect of the interventions. We downgraded the overall rating of quality of evidence for the study (outcome by outcome) by at least one grade (using GRADE) if the study had high or unclear risk of bias in at least one domain.
We used the five GRADE considerations (study limitations, consistency of effect, imprecision, indirectness, and publication bias) to assess the quality of the body of evidence at one of four levels.
-
High quality: Further research is very unlikely to change our confidence in the estimate of effect.
-
Moderate quality: Further research is likely to have an important impact on our confidence in the estimate of effect and may change the estimate.
-
Low quality: Further research is very likely to have an important impact on our confidence in the estimate of effect and is likely to change the estimate.
-
Very low quality: Research shows substantial uncertainty about the estimate.
We assigned GRADE quality ratings separately for the seven major outcomes. Because of the comprehensive nature of the outcome variable of health‐related quality of life, we gave it primacy over all other variables in the "Summary of findings" table and in the "Plain language summary."
Subgroup analysis and investigation of heterogeneity
We planned two subgroup analyses on two major outcomes (HRQL and pain intensity) for the aerobics versus control comparison.
-
To explore the relative effects of age: Subgroups for age were younger (≤ 45 years of age) and older (> 45 years of age). Forty‐five is proposed as the cut‐off because of changes in hormone levels and lifestyle (physical activity participation) that occur with aging (Shephard 1998).
-
To explore subgroups for exercise volume (frequency × duration × intensity) based upon American College of Sports Medicine (ACSM) criteria (meets ACSM criteria/does not meet ACSM criteria) according to ACSM 2013 9th Guidelines.
Sensitivity analysis
We planned to conduct a sensitivity analysis to assess how results of the meta‐analysis might be affected by selection, attrition (> 20%), and detection biases for post‐treatment pain intensity and HRQL outcomes in the main comparison.
Results
Description of studies
See Characteristics of included studies; Characteristics of excluded studies; and Characteristics of studies awaiting classification.
Results of the search
The search resulted in a total of 3684 records, which included 3646 journal records and 38 trial registry records. After we had removed 942 duplicates, 2742 records remained. We excluded 2529 records on citation and abstract screening. We assessed 213 full‐text articles and 20 protocols/trial registry records for eligibility and excluded 77 full‐text articles and seven protocols/trial registry records. We included 16 full‐text publications (13 primary studies, three companion papers) and three RCT protocols examining aerobic exercise training. On the most recent update to the search, we found five additional full‐text articles (three of which had trial registry records) that are awaiting full assessment. See Figure 1 for details.
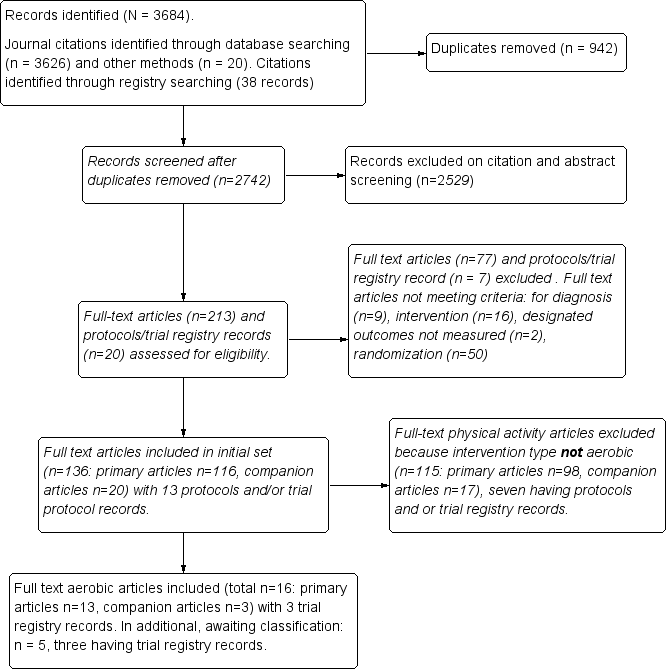
Study flow diagram.
Included studies
We considered for this review 16 full‐text reports and three registry records describing 13 unique aerobic exercise training studies and meeting our selection criteria. We used the three registry records (hereafter, RCT protocols) to assess the quality of studies (Fontaine 2010; Kayo 2011; Mannerkorpi 2010). We included the following 13 distinct RCTs for analysis: Fontaine 2007; Fontaine 2010; Gowans 2001; Kayo 2011; King 2002; Mannerkorpi 2010; Mengshoel 1992; Nichols 1994; Ramsay 2000; Sanudo 2010; Schachter 2003; Sencan 2004; and Wigers 1996. Although we found 16 separate article publications, we included only 13 studies. One publication (Fontaine 2011) reported additional variables from the Fontaine 2010 primary study; therefore, we included the two and counted them as one study for analysis (hereafter identified as Fontaine 2010). Similarly, Gowans 2002 reported additional variables from the primary article for Gowans 2001, and we counted these as one study for analysis (hereafter identified as Gowans 2001). One publication by Mengshoel published in 1993 reported additional variables from the Mengshoel 1992 primary study; therefore, we included the two and counted them as one study for analysis (hereafter identified as Mengshoel 1992). The average length of treatment was 15 weeks (minimum of six and maximum of 24 weeks); follow‐up data post intervention were available for seven trials (Fontaine 2010; Kayo 2011; King 2002; Mannerkorpi 2010; Ramsay 2000; Sencan 2004; Wigers 1996) and ranged from 24 to 208 weeks. All studies used a randomized clinical trial with a parallel group study design. In the recent update to the search, we identified five additional full‐text articles (with three registry records) that are awaiting assessment (Bjersing 2012; Duruturk 2015; Espí‐López 2016; Mendonca 2016; Sanudo 2015).
Studies were published between 1992 and 2011 and were conducted across eight countries, including Canada (3), United States (3), Brazil (1), Spain (1), Norway (2), Sweden (1), United Kingdom (1), and Turkey (1). All studies were written in English. We contacted six study authors (Fontaine 2007; Fontaine 2010; Kayo 2011; Mannerkorpi 2010; Sanudo 2010; Schachter 2003) using open‐ended questions to request information needed to assess risk of bias, the exercise intervention, and/or the treatment effect. We received responses from five study authors and have presented in Table 3 outcome measures extracted for all included studies.
| Outcome | Name of Instrument or index/subscale |
| Health‐related quality of life | FIQ Total (0‐100) |
| Pain intensity/interference | Current pain (VAS), FIQ pain (VAS), SF‐36 bodily pain (interference) |
| Fatigue | VAS (0‐100), FIQ fatigue (0‐100), SF‐36 vitality (0‐100), Fatigue Severity Scale (9‐63), Multidimensional Fatigue Inventory (4‐20) |
| Stiffness | FIQ stiffness |
| Physical function | SF‐36 physical functioning (0‐100), FIQ physical function (0‐100), Sickness Impact Profile (0‐68), Health Assessment Questionnaire (HAQ) |
| Maximal cardiorespiratory function | Oxygen uptake (VO2max), maximum work capacity (w) |
| Submaximal cardiorespiratory function | 6‐minute walk test (distance in meters), Astrand submaximal cycle ergometer test (heart rate at a steady state workload) |
| Adverse events | Not a standardized instrument or index/narrative information |
FIQ: Fibromyalgia Impact Questionnaire; HAQ: Health Assessment Questionnaire; SF‐36: Short Form 36; VAS: visual analogue scale; VO2max: maximal oxygen uptake
Six studies reported findings on multiple treatment arms (Kayo 2011; King 2002; Sanudo 2010; Schachter 2003; Sencan 2004; Wigers 1996); we included in the analysis arms comparing an aerobic exercise training group versus another aerobic exercise training group or versus a non‐exercise intervention. Information on which arms were included in the analyses can be found in the Characteristics of included studies section.
Participants
This review included 839 participants, of whom 750 were female. Nine studies included female participants only, three included participants of both genders, and one study (Ramsay 2000) did not specify the gender of participants. The average duration of disease or symptoms since diagnosis ranged from 5 to 11.5 years; three studies did not report this information (Ramsay 2000; Sanudo 2010; Schachter 2003). Average age of participants was 41 years (minimum to maximum, 32 to 56 years); one study (Ramsay 2000) did not report participants' age.
Fibromyalgia diagnosis was based on ACR 1990 (Wolfe 1990) criteria in all studies but one (Wigers 1996), in which participants had to fulfill the diagnostic criteria of Smythe 1979 and Yunus 1981. Retrospective investigation confirmed that 58 of the 60 participants in this study also fulfilled ACR 1990 criteria (Wolfe 1990).
Inclusion criteria for these trials included age (eg, 18 to 65, 30 to 55); a diagnosis of fibromyalgia; interest in exercising or willingness to comply with the exercise protocol; sedentary for six months before the trial; permission to exercise from family doctor; acceptance of randomization results; signed informed consent for study participation; stable on medications for at least three months before the start of the study; patient at the institution where the study took place or resident of the city where the study was conducted; discontinuation of medications for fibromyalgia four weeks before the start of the study; at least four years of schooling; involvement in medico‐legal cases (patients were not excluded); ability to manage a bicycle test at 50 watts or more; interest in exercising outdoors; and normal laboratory test results.
Exclusion criteria for trials consisted of presence of an acute or chronic medical condition or disease (eg, cancer; cardiovascular or respiratory disease; metabolic, musculoskeletal, and neurological conditions) interfering with moderate‐intensity aerobic exercise; inflammatory diseases (eg, systemic lupus erythematous, rheumatoid arthritis); other pain disorders; intention to seek professional help for depression or anxiety during the study period or intent to change medications that might affect mood; need for an assistive device to ambulate; enrollment in or intention to begin an aerobic exercise program or ongoing planned physical activity including exercise or participation in any regular aerobic exercise program within the six months before the study or meeting the US Surgeon 1996 recommendation for physical activity for the previous six months (not engaging in moderate physical activity for the previous six months for 30 minutes on five days per week or vigorous physical activity three times per week for 10 minutes each time during the previous month); unstable pharmacological treatment in the first month before study entry; and not speaking Swedish.
Interventions
We have provided a detailed description of trial interventions, including FITT‐VP parameters, in the Characteristics of included studies section and in Table 4. Fontaine 2007; Fontaine 2010; Kayo 2011; and Schachter 2003 met ACSM guidelines for healthy adults. Gowans 2001 met ACSM criteria for individuals who are sedentary/have no habitual activity/are extremely deconditioned. We have provided a summary of congruence with ACSM guidelines in Table 5.
| Author, year, intervention | Frequency, times per week – length in weeks | Intensity/ACSM intensity classification | Time/Duration/Session, minutes | Type/Mode | |
| Aerobic vs control | |||||
| 3 times/wk | 23 weeks | 60%‐75% age‐adjusted HRmax | 30' | Supervised water walking/running progressing to land walking/running | |
| 3 times/wk | 16 weeks | 40%‐50% HRR at week 1 to 60%‐70% HRR by week 16 | ˜ 60' | Supervised indoor or outdoor walking | |
| 3 times/wk | 12 weeks | 60%‐75% predicted HRmax | Starting duration 10 to 15' progressing to 20 to 40' | Supervised walking, aquacise (deep and shallow water), or low‐impact aerobics | |
| 2 times/wk | 20 weeks | 120‐150 beats per minute ACSM: moderate to vigorous | 60' | Supervised low‐impact aerobic dance program | |
| 3 times/wk | 8 weeks | 60%‐70% predicted HRmax/age ACSM: light to moderate | Unclear | Supervised fast‐paced walking on an indoor track | |
| 2 times/wk | 24 weeks | 60%‐65% HRmax (steady state aerobics) and 75%‐80% HRmax (interval training) ACSM: light to moderate and moderate to vigorous | 45‐60’ | Supervised aerobics including continuous walking with arm movements and jogging; interval training including aerobic dance and jogging | |
| Schachter 2003 Short bout | 3 to 5 times/wk | 16 weeks | 40%‐50% HRR at week 1, 60%‐70% HRR by week 10 ACSM: moderate at week 1, vigorous by week 10 | 2/d, 5' at week 1 to 15' | Home program of low‐impact aerobics to videotaped instructor and music, rhythmical movements of lower body muscles. Supervision at 0, 4, 8, and 12 weeks |
| Long bout | 3 to 5 times/wk | 16 weeks | 40%‐50% HRR at week 1, 60%‐70% HRR by week 10 ACSM: moderate at week 1; vigorous by week 10 | 10' at week 1 to 30' | Home program of low‐impact aerobics to videotaped instructor and music, rhythmical movements of lower body muscles. Supervision at 0, 4, 8, and 12 weeks |
| Sencan 2004 Aerobic exercise | 3 times/wk | 6 weeks | Not specified | 40’ | Cycle ergometry. Supervision unclear |
| 3 times/wk | 14 weeks | Tempo gradually increased up to, and decreased down from, 4 periods of 60%‐70% HRmax ACSM: light to moderate | 45’ | Supervised movement to music and games | |
| Aerobic vs aerobic2 | |||||
| Mannerkorpi 2010 AE: Nordic walking | 2 times/wk | 15 weeks | 10’ at RPE 9‐11 2' intervals of RPE 13‐15, alternated with 2' at RPE 10 to 11 ACSM: 10’ light, 2’ intervals moderate to vigorous alternated with 2’ light. | 20’ | Supervised walking in parks and forests with flat areas and small hills |
| AE2: low‐intensity walking | 1 time/wk | 15 weeks | RPE 9 to 11 | 20’ | Supervised walking in parks and forests with flat areas and small hills |
| AE: exercise class | 1 time/wk | 12 weeks | Not specified | 60’ | Supervised graded circuit exercises consisting of step‐ups, sitting to standing, skipping, jogging on the spot, alternate side bends, circling arms with increasing weights, plus encouragement to continue and increase exercises at home |
| AE2: single class | 1 session | 12 weeks | Not specified | 60’ | Demonstration of aerobic exercises, stretching and relaxation technique, plus written advice on aerobic exercises plus stretching and relaxation |
| Schachter 2003: AE: short bout | 3 to 5/wk | 16 weeks | 40%‐50% HRR at week 1, 60%‐70% HRR by week 10 | 2/d 5' up to 15' | Home program of low‐impact aerobics to videotaped instructor and music, rhythmical movements of lower body muscles. Supervision at 0, 4, 8, and 12 weeks |
| AE2: long bout | 3 to 5/wk | 16 weeks | 40%‐50% HRR at week 1, 60%‐70% HRR by week 10 ACSM: moderate at week 1, vigorous by weeks 10‐16 | 10' up to 30' | Home program of low‐impact aerobics to videotaped instructor and music, rhythmical movements of lower body muscles. Supervision at 0, 4, 8, and 12 weeks |
| Aerobic vs other (education or stress management training) | |||||
| Group session every 2 weeks AE: 5‐7 times/wk | 12 weeks | Moderate intensity ACSM: moderate | 10’ and increase daily 5’/wk to at least 30’ | Brisk walking and other modes of aerobic activity (+ group session/supervision) | |
| 5‐7 times/wk | 12 weeks | Moderate (breathing heavily but able to keep a conversation) + 15’ of above usual level ACSM: moderate Review authors used appropriate references to help translate "moderate" into action | 60’ | Walking (the most common form of LPA) and other forms (eg, garden/mowing the lawn); household activity (eg, vacuuming); and sports activity (eg, cycling, swimming, field hockey) (+ group sessions/supervision) | |
| 3 times/wk | 12 weeks | 60%‐75% predicted HRmax ACSM: light to moderate | Starting duration 10 to 15' progressing to 20 to 40' | Supervised walking, aquacise (deep and shallow water), or low‐impact aerobics | |
| 3 times/wk | 6 weeks | Not specified | 40’ | Cycle ergometry. Supervision unclear | |
| 3 times/wk | 14 weeks | Tempo gradually increased up to, and decreased down from, 4 periods at 60%‐70% HRmax ACSM: light to moderate | 45’ | Supervised movement to music and games | |
ACSM: American College of Sports Medicine; AE: aerobic exercise; FITT: frequency, intensity, time, and type of training; HRmax: maximum heart rate; HRR: heart rate reserve; RPE: rating of perceived exertion
| Met ACSM criteria | Did not meet ACSM criteria | Not enough information to judge |
| Fontaine 2007; Fontaine 2010; Kayo 2011; Schachter 2003 met ACSM guidelines for healthy adults. Gowans 2001 met ACSM criteria for individuals who are sedentary/have no habitual activity/are extremely deconditioned | King 2002: based on frequency and duration (only 3/wk, light to moderate); Mannerkorpi 2010: based on frequency and duration (only twice or once a week with 20' session duration); Mengshoel 1992: based on frequency of 2 times/wk; Nichols 1994: based on frequency and duration (only twice a week); Ramsay 2000: based on frequency (only once a week); Sanudo 2010: based on frequency (only twice a week) for aerobics; Wigers 1996: intensity too low, duration too short (only 18‐20’ at HR 60%‐70%) |
ACSM: American College of Sports Medicine; HR: heart rate
-
Aerobic versus control conditions (treatment as usual, wait list control, daily activities including physical activity as usual): Exercise frequency was three times per week in most studies. In Mengshoel 1992 and Sanudo 2010, exercise frequency was two times per week for 20 and 24 weeks, respectively. Duration varied from six weeks (Sencan 2004) to 24 weeks (Sanudo 2010). Investigators expressed intensity five different ways: percentage age‐adjusted heart rate (Gowans 2001), target heart rate (Mengshoel 1992), percentage maximum heart rate (HRmax; Sanudo 2010), predicted maximum heart rate (King 2002; Nichols 1994), and percentage heart rate reserve (HRR; Kayo 2011; Schachter 2003). One study (Sencan 2004) did not specify duration, and another study (Wigers 1996) provided a description involving tempo. Average intervention time was 35 minutes (minimum‐maximum: 20 to 60). The predominant mode of activity was walking (indoor or outdoor), in some cases accompanied by upper body movements or with progression to running; other modes included aerobic exercise on a stationary bicycle, low‐impact aerobics to music, rhythmical movements of lower body muscles, aquacise, and music and games. All interventions were supervised regularly or at specified times (Schachter 2003). We were unable to determine if the intervention was supervised in one study (Sencan 2004).
-
Aerobic versus aerobic: Investigators performed three sets of comparisons: Nordic walking versus low‐intensity walking (Mannerkorpi 2010); once‐per‐week exercise versus single exercise session and home program (Ramsay 2000); and one long versus two short bouts of aerobic exercise (Schachter 2003). Exercise frequency varied from one time per week to three times per week. One study (Ramsay 2000) did not specify intensity; another (Schachter 2003) expressed intensity in HRR; and another study (Mannerkorpi 2010) provided a rating of perceived exertion (RPE). Among the studies that reported intensity, intensity started light and increased to moderate or vigorous. Average duration of the intervention was 30 minutes. The mode involved supervised (Nordic or low‐intensity) walking in parks and forests with flat areas and small hills, low‐impact aerobics to music, rhythmical movements of lower body muscles, an unspecified home program, cardiovascular fitness classes plus stretching and relaxation, and written advice on aerobic exercises plus stretching and relaxation. Interventions were supervised in five of the six comparisons, and were self‐supervised in another (Ramsay 2000).
-
Aerobic versus other: We found three distinct sets of comparisons: aerobic exercise versus education (Fontaine 2007; Fontaine 2010; King 2002); aerobic exercise versus stress management training (Wigers 1996); and aerobic exercise versus medication (eg, paroxetine; Sencan 2004). Two trials reported frequency of exercise as five to seven times per week, and the other three reported exercise three times per week. Intensity was set at "moderate" (breathing heavily but able to keep a conversation), was reported as 60% to 75% predicted heart rate or with a tempo gradually increased up to, and decreased down from, four periods of high‐intensity training at 60% to 70% HRmax, and was not specified in one study (Sencan 2004). Average duration was 30 minutes. The aerobic mode involved walking (the most common form of leisure time physical activity) and other forms of movement; and sports activity (eg, cycling, swimming, field hockey), aquacise, low‐impact aerobics, and movement to music and games.
Excluded studies
We excluded 2529 records on citation and abstract screening, as they did not meet the inclusion criteria for this review (see Figure 1). We examined 213 full‐text articles and 20 RCT protocols, and we excluded 77 full‐text articles and seven RCT protocols. We excluded full‐text articles because they did not meet the selection criteria related to diagnosis of fibromyalgia (n = 9); intervention (n = 16); designated outcomes not measured (n = 2); or randomization (n = 50). The remaining 136 full‐text articles represented RCTs examining effects of physical activity interventions for fibromyalgia. We screened 115 additional articles to rule them out because the physical activity intervention did not have an aerobics‐only intervention; or the study was reviewed or was designated to be reviewed in another Cochrane Review in this series.
Risk of bias in included studies
We have provided results of the "Risk of bias" assessment for the 13 included studies in the Characteristics of included studies section and in Figure 2 and Figure 3. "Risk of bias" assessments were based on primary article data supplemented by study author responses.

Risk of bias graph: review authors' judgments about each risk of bias item presented as percentages across all included studies.
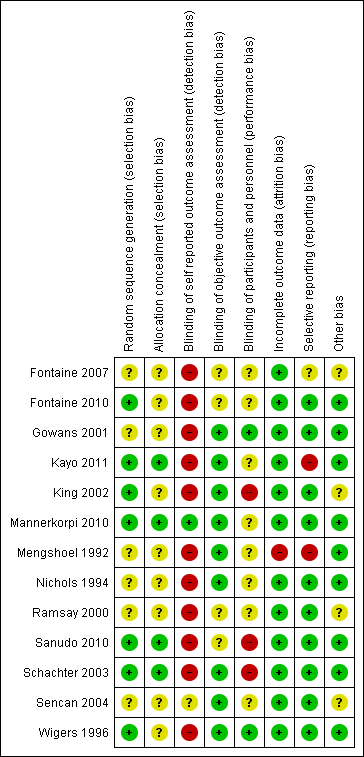
Risk of bias summary: review authors' judgments about each risk of bias item for each included study.
Allocation
Seven of the 13 studies used an acceptable method of random sequence generation (computer‐generated sequence, coin toss, drawing of cards or lots), and we rated them as low risk (Fontaine 2010; Kayo 2011; King 2002; Mannerkorpi 2010; Sanudo 2010; Schachter 2003; Wigers 1996). Six studies used allocation methods that were unclear (Fontaine 2007; Gowans 2001; Mengshoel 1992; Nichols 1994; Ramsay 2000; Sencan 2004).
We rated four studies as low risk because they utilized acceptable methods to conceal the allocation sequence, such as central allocation by telephone, Web‐based or pharmacy‐controlled randomization, or sequentially numbered opaque sealed envelopes (Kayo 2011; Mannerkorpi 2010; Sanudo 2010; Schachter 2003). We rated as presenting unclear risk nine studies that did not present sufficient information to allow definitive judgment (Fontaine 2007; Fontaine 2010; Gowans 2001; King 2002; Mengshoel 1992; Nichols 1994; Ramsay 2000; Sencan 2004; Wigers 1996).
Blinding
In exercise studies, blinding of participants and care providers from treatment allocation is very rare.
Performance bias
Among the included studies, we rated blinding of participants and personnel (performance bias) as low risk for two studies (Gowans 2001; Wigers 1996), unclear risk for eight studies (Fontaine 2007; Fontaine 2010; Mannerkorpi 2010; Mengshoel 1992; Nichols 1994; Ramsay 2000; Sanudo 2010; Sencan 2004), and high risk for three studies (King 2002; Sanudo 2010; Schachter 2003).
Detection bias
For detection bias, we separated assessment of blinded assessors for subjective and objective outcomes. Not all trials used a combination of both kinds of outcomes. While completing the "Risk of bias" tool, we were unable to insert "not applicable" or to leave the section blank (indicating that the outcome was not measured). We then chose "low risk" and inserted the comment "not applicable/this outcome was not measured."
For self‐reported outcomes (subjective), we rated 11 studies as high risk (Fontaine 2007; Fontaine 2010; Gowans 2001; Kayo 2011; King 2002; Mengshoel 1992; Nichols 1994; Ramsay 2000; Sanudo 2010; Schachter 2003; Wigers 1996); one study as low risk, as both interventions were considered equal (Mannerkorpi 2010); and one study using a placebo control as unclear risk (Sencan 2004), as we could not determine whether participants were aware of the intervention. For objective reported outcomes, nine studies blinded outcome assessors to participant group assignment, and we rated these studies as low risk (Gowans 2001; Kayo 2011; King 2002; Mannerkorpi 2010; Mengshoel 1992; Nichols 1994; Schachter 2003; Sencan 2004; Wigers 1996). We rated four studies as unclear risk (Fontaine 2007Fontaine 2010; Ramsay 2000; Sanudo 2010).
Incomplete outcome data
Twelve studies reported complete outcome data. Gowans 2001; Kayo 2011; Ramsay 2000; Sanudo 2010; Schachter 2003; and Wigers 1996 analyzed data using ITT. King 2002 reported post‐test data and analyzed them using ITT; at follow‐up, investigators provided only complete data with no analysis. Missing outcome data were balanced in numbers across intervention groups, with similar reasons for missing data reported across groups in Fontaine 2007; Mannerkorpi 2010; and Nichols 1994. Missing outcome data were balanced in numbers across intervention groups, and reasons for missing outcome data were unlikely to be related to true outcomes in Fontaine 2010. Sencan 2004 reported no missing data at post‐test. Mengshoel 1992 provided incomplete income data, and we rated this study as high risk.
Selective reporting
A priori RCTs protocols were available for three of the reviewed studies (Fontaine 2010, ClinicalTrials.gov NCT00383084; Kayo 2011, ClinicalTrials.gov ID NCT00498264; Mannerkorpi 2010, ClinicalTrials.gov ID NCT00643006). We rated 10 of the 13 studies as having low risk of selective reporting bias. These included two studies with an a priori RCT protocol (Fontaine 2010; Mannerkorpi 2010). In eight published reports, although RCT protocols were not available, it was clear that published reports included all expected outcomes (Gowans 2001; King 2002; Nichols 1994; Ramsay 2000; Sanudo 2010; Schachter 2003; Sencan 2004; Wigers 1996). We rated one study as having high risk of selective reporting. Kayo 2011 did not provide in the article outcome data for some key variables such as tender points, SF‐36 physical functioning, SF‐36 vitality, and SF‐36 mental health that would be expected. We rated two out of 13 studies as having unclear risk (Fontaine 2007; Mengshoel 1992). Overall, we rated risk of selective reporting bias as low (77%; Figure 2).
Other potential sources of bias
Overall, we rated risk due to other sources of bias as low (70%; Figure 2). We rated four studies as having unclear risk because information was insufficient for assessment of whether an important risk of bias existed (Fontaine 2007; King 2002; Ramsay 2000; Sencan 2004).
Poor adherence is another potential source of bias in exercise studies. None of the included studies reported detailed results of systematic data collection and analysis of participant adherence to exercise performance in a way that would allow the review authors to understand the volume of exercise training actually performed by participants.
Effects of interventions
See summary of findings Table for the main comparison for the main comparison ‐ aerobic exercise training compared with control conditions (treatment as usual, wait list control, daily activities including physical activity as usual). We have grouped results related to effects of interventions from the meta‐analysis to correspond to comparisons and objectives of the review. See below.
Aerobics versus control at the end of the intervention
Major outcomes
Five studies provided data for health‐related quality of life (Gowans 2001; Kayo 2011; King 2002; Sanudo 2010; Schachter 2003), six studies for pain intensity (Gowans 2001; Mengshoel 1992; Sanudo 2010; Schachter 2003; Sencan 2004; Wigers 1996), four for fatigue (Kayo 2011; Sanudo 2010; Schachter 2003; Wigers 1996) and physical function (Kayo 2011; Nichols 1994; Sanudo 2010; Schachter 2003), and one for the major outcome of stiffness (Schachter 2003). For this comparison, one study (Schachter 2003) included two aerobic exercise arms; the arms were aggregated for analyses and were compared with control conditions.
HRQL (self‐reported, FIQ Total, lower scores mean better health, negative numbers mean improvement)
Researchers in five studies (Gowans 2001; Kayo 2011; King 2002; Sanudo 2010; Schachter 2003) provided evidence of effect post intervention for aerobic exercise training compared with control (N = 372; mean difference (MD) ‐7.89, 95% confidence interval (CI) ‐13.23 to ‐2.55; Analysis 1.1). Absolute change was 8% (3% to 13%) and relative improvement with exercise was 15% (95% CI 5% to 24%); the number needed to treat for an additional beneficial outcome (NNTB) was 6 (4 to 16).
Pain intensity (self‐reported, 0 to 100 VAS scale, lower scores mean less pain, negative numbers mean improvement)
Data from six studies (Kayo 2011; Mengshoel 1992; Sanudo 2010; Schachter 2003; Sencan 2004; Wigers 1996) revealed a difference between aerobic exercise training and control favoring aerobic training post intervention (N = 351; MD ‐11.06, 95% CI ‐18.34 to ‐3.77; Analysis 1.3). Absolute change was 11% (4% to 18%) and relative change was 18% (95% CI 7% to 30%); the NNTB was 4 (2 to 15).
Fatigue (self‐reported, 0 to 100 scale, lower scores mean less fatigue, negative numbers mean improvement)
Data on fatigue were available for five studies (Kayo 2011; Mengshoel 1992; Sanudo 2010; Schachter 2003; Wigers 1996). Data on fatigue provided by Mengshoel 1992 were available only in ordinal format and were not included in the meta‐analysis; Mengshoel 1992 found no difference in fatigue between aerobic exercise and control when performing non‐parametric analysis. The meta‐analysis presented evidence of no statistically significant effect for aerobic exercise training compared with control post intervention (N = 286; MD ‐6.06, 95% CI ‐12.41 to 0.30; Analysis 1.6). Absolute difference was 6% improvement (12% improvement to 0.3% worse). Relative change was 8% (95% CI 16% improvement to 0.4%worse); the NNTB was not applicable.
Stiffness (self‐reported, 0 to 100 FIQ scale, lower scores mean less stiffness, negative numbers mean improvement)
Only one study provided data on stiffness (Schachter 2003), showing evidence of an effect of aerobic exercise training (two arms) compared with control post intervention (N = 143; MD ‐7.96, 95% CI ‐14.95 to ‐0.97; Analysis 1.7). Absolute difference shows 8% (1% to 15%) improvement. Relative change was 11% (95% CI 1% to 21%); the NNTB was 6 (3 to 218).
Physical function (self‐reported, 0 to 100 FIQ impairment scale, lower scores means fewer limitations, negative numbers mean improvement)
Four trials assessed physical function as an outcome (Kayo 2011; Nichols 1994; Sanudo 2010; Schachter 2003). Assessment of statistical heterogeneity among trials indicated I2 = 69% (ie, from 50% to 90% as may represent "substantial" heterogeneity). After we performed a sensitivity analysis and removed Nichols 1994, I2 was decreased to 0%. Evidence showed an effect of aerobic exercise training compared with control post intervention (N = 246; MD ‐10.16, 95% CI ‐15.39 to ‐4.94; Analysis 1.8). Absolute change was 10% (15% to 5%) improvement. Relative change was 21.9% (95% CI ‐33.2% to 10.7%); the NNTB was 5 (3 to 13).
Adverse events
Most studies did not measure adverse events, and other studies reported them incompletely; thus we are uncertain of the estimate.
The following statements show some of the adverse events that occurred after aerobic exercise training.
-
"...unable to exercise after an injury" (Sanudo 2010; page 1840), but it is unclear whether the injury was related to participation in the intervention.
-
"One participant assigned to the short bout exercise withdrew after developing a metatarsal stress fracture" (Schachter 2003; page 347).
One study author surmised that aerobic exercise is safe for individuals with fibromyalgia, as follows: "the present study findings confirm earlier studies that have shown aerobic exercise to reduce tender point tenderness, increase work capacity without adverse side effects..." (Wigers 1996; page 83 to 84).
All‐cause withdrawal rates for aerobic exercise training groups (n1/N1) versus control groups (n2/N2) were 12/27 versus 8/24 (Gowans 2001); 5/30 versus 5/30 (Kayo 2011); 4/46 versus 5/39 (King 2002); 7/18 versus 3/17 (Mengshoel 1992); 2/12 versus 3/12 (Nichols 1994); 4/22 versus 1/21 (Sanudo 2010); 21/56 versus 5/18 (Schachter 2003); 15/51 versus 5/18 (Schachter 2003); 0/20 and 0/20 (Sencan 2004) (not included in the analysis); and 4/20 versus 3/20 (Wigers 1996). We found no significant difference in all‐cause withdrawal between aerobic exercise and control groups (risk ratio (RR) 1.25, 95% CI 0.89 to 1.77; Analysis 1.9). Reasons for participant withdrawals are footnoted in the meta‐analysis (Analysis 1.9).
Minor outcomes
Four studies (Gowans 2001; King 2002; Mengshoel 1992; Sanudo 2010) evaluated effects of aerobic training on the minor outcome of submaximal cardiorespiratory function. Two studies (Schachter 2003; Wigers 1996) evaluated maximal cardiorespiratory function.
CR max (oxygen uptake)
Two arms of the same study presented data on this outcome (Schachter 2003). Results showed no differences between groups in cardiorespiratory function post intervention (N = 143; MD 1.60, 95% CI ‐0.06 to 3.26; Analysis 1.10).
CR submax (six‐minute walk test (m))
We found a statistically significant difference in submaximal cardiorespiratory function favoring the aerobic exercise training intervention post intervention (N = 169; MD 55.58 metres, 95% CI 27.20 to 83.96; Analysis 1.11)..
We did not include Mengshoel 1992 in the meta‐analysis; unlike the other three studies that measured CR submax, Mengshoel 1992 used an Astrand steady state cycle ergometry test to obtain heart rate (HR) at steady state and did not provide standard deviation (SD) values. Mengshoel 1992 found no difference in CR submax between aerobic exercise and control groups using non‐parametric analysis.
Improvement in pain greater than 30%
No studies reported data on this outcome.
Clincal significance
Two major outcomes met the threshold for clinically relevant differences (15%) in this comparison as follows: pain intensity (15%) and physical function (22%).
Aerobics versus control, subgroup analyses
We planned to carry out a subgroup analysis of the relative effects of age (≤ 45 years of age and > 45 years of age); we did not do this because of the proximity of mean age to the set cut‐off of 45 years. This proximity would have prevented us from seeing meaningful differences.
Subgroup analysis investigating effects of the intervention for studies meeting ACSM criteria for HRQL versus studies not meeting ACSM criteria for HRQL and pain intensity (Analysis 1.1; Analysis 1.3) showed no statistically significant differences (P > 0.05). We report these analyses as follows.
-
HRQL: studies that met ACSM (MD ‐8.66, 95% CI ‐17.77 to 0.44); those that did not meet ACSM (MD ‐6.77, 95% CI ‐12.97 to ‐0.57); test for subgroup differences: Chi² = 0.11, df = 1 (P = 0.74).
-
Pain intensity: studies that met ACSM (MD ‐5.89, 95% CI ‐18.79 to 6.95); those that did not meet ACSM (MD ‐14.90, 95% ‐21.36 to ‐8.44); test for subgroup differences: Chi² = 1.51, df = 1 (P = 0.22).
Aerobics versus control, sensitivity analyses
We explored effects of selection biases for HRQL and pain intensity outcomes and attrition biases for pain intensity. We did not find attrition rates greater than 20% for HRQL; therefore, we did not conduct this sensitivity analysis as planned.
Results of sensitivity analysis for HRQL (selection bias) showed no major impact on the direction and magnitude of estimates when we removed studies with high or unclear risk from the meta‐analyses. We have presented results in Table 6 and Analysis 1.2. Results of sensitivity analysis for pain intensity (selection bias) changed the effect size to a non‐significant result; this can potentially be interpreted as the influence of primary studies with high or unclear risks of bias on the direction and magnitude of estimates. We have presented these results in Table 6 and in Analysis 1.4 and Analysis 1.5. Pain intensity attrition bias sensitivity analysis effect estimates remained the same. However, these analyses must be interpreted with caution, as the number of studies included is small, and the analyses are exploratory in nature. It is possible that a risk may exist, but presently we do not know how much it might affects study results.
| Outcome | All studies MD (95% CI), number of studies (participants), I2 | Low risk of selection bias MD (95% CI), number of studies (participants), I2 | Low risk of attrition bias MD (95% CI), number of studies (participants), I2 | Detection bias |
| HRQL | ‐7.89 (‐13.23 to ‐2.55), 5 studies (372), I2= 58% | ‐10.47 (‐20.79 to ‐0.15), 3 studies (246), I2 = 77% | > 20% was not present ‐ this sensitivity analysis was not conducted | Sensitivity analysis not conducted |
| Pain | ‐11.06 (‐18.34 to ‐3.77), 6 studies (351), I2= 59% | ‐8.38 (‐17.88 to 1.12), 3 studies (246), I2 = 59% | ‐11.71 (‐19.93 to ‐3.50), 5 studies (326), I2 = 66% | Sensitivity analysis not conducted |
CI: confidence interval; HRQL: health‐related quality of life; MD: mean difference
We did not conduct sensitivity analysis for HRQL and pain intensity for detection bias as all of these outcomes were evaluated with self‐report instruments; therefore we deemed risk of bias to be high.
Aerobics versus control, long‐term effects
Four studies examined long‐term effects: Wigers 1996 (follow‐up at four years after the end of the 14‐week intervention), King 2002 (follow‐up at 24 weeks, 12 weeks after the end of the 16‐week intervention), Sencan 2004 (follow‐up at 26 weeks, 20 weeks after the end of the six‐week intervention), and Kayo 2011 (follow‐up at 28 weeks, 12 weeks after the end of the 16‐week intervention).
Major outcomes
HRQL (self‐reported, 0 to 100 FIQ Total scale, lower scores mean better health, negative numbers mean improvement)
Two studies examined the long‐term effects of aerobic exercise on HRQL: Kayo 2011 found a statistically significant effect favoring aerobic exercise (N = 60; MD ‐19.16, 95% CI ‐29.7 to ‐8.62; Analysis 2.1), whereas King 2002 found no statistically significant difference (MD ‐4.00, 95% CI ‐11.86 to 3.86).
Pain intensity (self‐reported, 0 to 100 mm VAS scale, lower scores mean less pain, negative numbers mean improvement)
Three studies examined long‐term effects of aerobic exercise on pain intensity (Kayo 2011; Sencan 2004; Wigers 1996) and found a statistically significant effect for the aerobic intervention at post‐test follow‐up (N = 134; MD ‐10.56, 95% CI ‐20.00 to ‐1.12; Analysis 2.2).
Fatigue (self‐reported, 0 to 100 mm VAS scale, lower scores mean less fatigue, negative numbers mean improvement)
Two studies examined the long‐term effects of aerobic exercise on fatigue (Kayo 2011; Wigers 1996). Kayo 2011 found a statistically significant effect favoring aerobic exercise (N = 60; MD ‐14.00, 95% CI ‐24.34 to ‐3.81; Analysis 2.3), whereas Wigers 1996 found no significant differences (N = 40; MD 5.00, 95% CI ‐12.69 to 22.69).
Physical function (self‐reported, 0 to 100 FIQ impairment scale, lower scores mean fewer limitations, negative numbers mean improvement)
One study examined the long‐term effects of aerobic exercise on physical function (Kayo 2011) and found a statistically significant effect favoring aerobic exercise (N = 60; MD ‐11.33, 95% CI ‐22.11 to ‐0.55; Analysis 2.4).
All‐cause withdrawal
Three studies provided sufficient data for evaluation of differences in all‐cause withdrawal: Kayo 2011; King 2002; and Wigers 1996. We excluded Sencan 2004 from the analysis because the sample size of the control group at follow‐up was not provided. By follow‐up, 22 of 70 had withdrawn from the aerobics groups compared with 25 of 70 in the control groups. Researchers found no significant differences in the proportion of participants who had withdrawn at follow‐up (N = 140; RR 0.75, 95% CI 0.47 to 1.22; Analysis 2.5).
Stiffness and adverse events
No studies reported data on these outcomes.
Minor outcomes
CR max (work capacity (w))
One study examined the long‐term effects of aerobic exercise on CR max (Wigers 1996) and found no evidence of an effect at four years (208 weeks) between aerobic and control groups (Analysis 2.6).
CR submax (six‐minute walk test (m))
One study examined the long‐term effects of aerobic exercise on CR submax (King 2002) and found no evidence of an effect at two years (24 weeks) between aerobic and control groups (Analysis 2.7).
Improvement in pain greater than 30%
No studies reported data on this outcome.
Aerobics versus aerobics at the end of the intervention
We did not pool studies, as these interventions (ie, population and mode) were not considered comparable across trials. Three studies provided data for this comparison: Mannerkorpi 2010 compared Nordic walking versus low‐intensity aerobic training; Ramsay 2000 compared supervised versus unsupervised aerobic exercise; and Schachter 2003 compared two short bouts versus one long bout of aerobic exercise per day. Results from these studies show the effect sizes found for each of the reported outcomes. Unless otherwise indicated, researchers measured HRQL, pain, fatigue, stiffness, and physical function on a 0 to 100 scale; lower scores are best, and negative numbers mean improvement.
Mannerkorpi 2010, which compared 15‐week Nordic walking (n = 28) versus low‐intensity aerobic training (n = 27), found evidence of no effect on HRQL (FIQ Total, scale 0 to 100; N = 55; MD ‐7.30, 95% CI ‐18.90 to 4.30; Analysis 3.1), pain intensity (100‐mm VAS; N = 57; MD ‐4.70, 95% CI ‐17.42 to 8.02; Analysis 3.2), fatigue (Multidimensional Fatigue Inventory, scale 4 to 20; N = 55; MD ‐0.33, 95% CI ‐0.87 to 0.20; Analysis 3.3), physical function (FIQ impairment scale, scale 0 to 100; MD ‐6.00, 95% CI ‐18.77 to 6.77; Analysis 3.5 ), all‐cause withdrawals (RR 1.21, 95% CI 0.36 to 4.13; Analysis 3.6), and CR submax (six‐minute walk test in meters; N = 55; MD 28.80, 95% CI ‐3.89 to 61.49). Regarding adverse effects, Mannerkorpi 2010 observed that "a temporary increase of pain was reported by several patients at exercise sessions, not only participants in the Nordic walking group but also participants in the low intensity walking group"; however, one participant in the Nordic walking group had increased pain and dropped out, and "only one patient interrupted the exercise program due to adverse effects of exercise. She had chronic trochanteritis, which deteriorated after a few exercise sessions" (page 8 of 10).
Ramsay 2000 compared participants undertaking supervised aerobic exercise (N = 37) versus participants attending a single exercise class with instructions to continue with a home program (N = 37). At 12 weeks, Ramsay 2000 found evidence of no effect on pain intensity (100‐mm VAS; N = 74; MD ‐3.00, 95% CI ‐15.38 to 9.38; Analysis 3.2). Ramsay 2000 did not clearly specify drop‐outs from the study; therefore, we were not able to pool the data. Ramsay 2000 reported no adverse events but measured physical function with a modified HAQ and presented data in medians and 25th and 75th percentiles. The HAQ is a 20‐item instrument with total scores ranging from 0 to 3 (with high scores denoting poorer function). Because no other trial in this review used the HAQ, we were not able to impute standard deviations for this trial. Using non‐parametric tests, Ramsay 2000 found no significant differences in HAQ scores between the two groups.
Schachter 2003, which compared 16‐week programs of one long bout per day (N = 51) versus two short bouts per day (N = 56) of low‐impact aerobics intensity, found no statistically significant between‐group differences in HRQL (FIQ Total, scale 0 to 100; N = 107; MD ‐1.00, 95% CI ‐7.75 to 5.75; Analysis 3.1), pain intensity (100‐mm VAS; N = 107; MD ‐5.00, 95% CI ‐14.00 to 4.00; Analysis 3.2), fatigue (FIQ fatigue, scale 0 to 100; N = 107; MD 0.10, 95% CI ‐0.28 to 0.48; Analysis 3.3), stiffness (FIQ stiffness, scale 0 to 100; N = 107; MD ‐2.00, 95% CI ‐10.53 to 6.53; Analysis 3.4), physical function (FIQ impairment scale, scale 0 to 100; N = 107; MD 5.00, 95% CI ‐4.02 to 14.02; Analysis 3.5), all‐cause withdrawals (N = 107; RR 0.78, 95% CI 0.46 to 1.35; Analysis 3.6), or CR max (VO2max, mL/kg; N = 107; MD 0.70, 95% CI ‐1.23 to 2.63; Analysis 3.7). Regarding adverse events, Schachter noted: "One participant assigned to the short bout exercise withdrew after developing a metatarsal stress fracture" (page 347).
No studies comparing two aerobic interventions provided data on Improvement in pain greater than 30%.
Aerobics versus other non‐exercise interventions at the end of the intervention
We did not pool studies, as we did not consider interventions and comparators comparable across trials. Five studies (six publications) provided data for this comparison (Fontaine 2007; Fontaine 2010; King 2002; Sencan 2004; Wigers 1996). Fontaine 2007; Fontaine 2010; and King 2002 compared aerobic exercise versus education, Wigers 1996 compared aerobic exercise versus stress management training, and Sencan 2004 compared aerobic exercise versus medication (ie, paroxetine). Our analyses show effect size on major and minor outcome variables for each of the included studies. Unless otherwise indicated, investigators measured HRQL, pain, and fatigue on a 0 to 100 scale, lower scores are best, and negative numbers mean improvement.
Fontaine 2007, which compared a 12‐week program of aerobic exercise (called "leisure time physical activity"; n = 22) versus education (n = 26), found evidence of no effect on HRQL (FIQ Total, scale 0 to 100; N = 33; MD ‐8.90, 95% CI ‐24.07 to 6.2; Analysis 4.1), fatigue (Fatigue Severity Scale; N = 32; SMD ‐0.14, 95% CI ‐0.84 to 0.56; Analysis 4.3), all‐cause withdrawal (N = 48; RR 1.03, 95% CI ‐0.45 to 2.40), and CR submax (six‐minute walk test, meters; N = 33; MD ‐4.30, 95% CI ‐99.14 to 90.54; Analysis 4.6). This study found statistically significant results for pain intensity (100‐mm VAS; N = 32; MD ‐15.00, 95% CI ‐29.95 to ‐0.05; Analysis 4.2) and reported no adverse events (ie, injuries, exacerbations, or other) for either group.
Fontaine 2010, which compared a 12‐week aerobics program (leisure time physical activity) (n = 43) versus education (n = 33), found statistically significant differences post intervention in HRQL (FIQ Total, scale 0 to 100; N = 73; MD ‐10.30, 95% CI ‐19.30 to ‐1.30; Analysis 4.1), pain intensity (100‐mm VAS; N = 73; MD ‐16.10, 95% CI ‐27.33 to ‐4.87; Analysis 4.2), and CR submax (six‐minute walk test, meters; N = 73; MD 42.80, 95% CI 3.40 to 82.20; Analysis 4.5); this study did not report between‐group differences post intervention in fatigue (Fatigue Severity Scale; N = 73; SMD 0.00, 95% CI ‐0.46 to 0.46; Analysis 4.3) or all‐cause withdrawal (N = 73; RR 0.99, 95% CI ‐0.33 to 3.00; Analysis 4.4). Neither group reported adverse events (ie, injuries, exacerbations, or other).
King 2002 compared a 12‐week aerobic intervention (n = 42) versus education (n = 41) and found evidence of no effects on HRQL (FIQ Total, scale 0 to 80; MD ‐4.40, 95% CI ‐10.75 to 1.95), all‐cause withdrawal (RR ‐0.56, 95% CI ‐0.18 to 1.76), or CR submax (six‐minute walk test, meters; MD 13.20, 95% CI ‐24.57 to 50.97). With regard to adverse events, study authors surmise, "No complications or adverse effects were observed during the study period among patients who completed the treatment protocols" (page 3 of 8).
Wigers 1996 compared a 14‐week aerobics program (n = 16) versus stress management training (n = 17) and noted no between‐group differences in pain intensity (100‐mm VAS; N = 40; MD ‐2.00, 95% CI ‐14.41 to 10.41; Analysis 4.2), fatigue (100‐mm VAS; N = 40; SMD ‐0.46, 95% CI ‐1.08 to 0.17; Analysis 4.3), or all‐cause withdrawal (N = 40; RR ‐0.80, 95% CI ‐0.25 to 2.55; Analysis 4.4) and reported no adverse events (ie, injuries, exacerbations, or other) for either group. Data on CR max post intervention show a statistically significant difference in favor of aerobic exercise training versus stress management therapy (measured by work capacity, watts; N = 40; MD 0.10, 95% CI 0.00 to 0.20; Analysis 4.5).
Sencan 2004 compared six weeks of aerobic exercise (ie, cycling; n = 20) versus medication (ie, paroxetine; n = 20) and found no evidence of effects on pain intensity (N = 40; MD 5.00, 95% CI ‐2.14 to 12.14; Analysis 4.2). Investigators reported no adverse events (ie, injuries, exacerbations, or other) for either group.
Stiffness, physical function, and improvement in pain greater than 30%
No studies reported data on these outcomes.
Discussion
This review is one of a series of reviews examining effects of physical activity interventions for individuals with fibromyalgia; this review focused on aerobic exercise training.
Summary of main results
Thirteen unique studies involving 839 people met our inclusion criteria. Nine studies compared aerobic exercise versus control, three compared one aerobic intervention versus another aerobic intervention, and five compared aerobic exercise versus a non‐exercise intervention.
-
Aerobics versus control studies: IThe eight trials that compared aerobic exercise training versus control included a total of 456 participants. Investigators reported statistically significant improvement at the end of the intervention (with two outcomes reaching clinical significance) and provided evidence of low to moderate quality favoring aerobic exercise training for health‐related quality of life (HRQL), pain intensity, stiffness, and physical function. Results showed no statistically significant differences in the number of participants who withdrew from exercise groups and control groups, and fatigue and other adverse events were difficult to evaluate because they were not reported in a systematic or standardized manner. A small quantiity of data revealed that those who participated in aerobic interventions had less pain and better physical function at long‐term follow‐up when compared with those in control groups; however, long‐term follow‐up revealed no differences in HRQL.
-
Aerobics versus aerobics studies: Three studies involving 248 people compared two forms of aerobic exercise. Owing to differences between interventions and comparators, we did not pool the data. One study compared Nordic walking versus low‐intensity walking, another compared aerobic exercise done in two short bouts versus one long bout per day, and a final study compared effects of a once‐per‐week exercise class versus a single exercise session and home program. Results showed no significant differences in major or minor outcomes between any of the interventions provided in these studies.
-
Aerobics versus other non‐exercise intervention studies: Four studies compared aerobic exercise versus self‐management training and education interventions, and one study compared aerobic exercise versus medication (paroxetine). Owing to differences between interventions and comparators, we did not pool the data. Results showed statistically significant differences favoring the aerobics program for HRQL (one of three trials) and pain intensity (two of four studies). Researchers noted no differences in fatigue nor in all‐cause withdrawals. No studies provided data on stiffness and physical function. Information on the number and quality of adverse events was scarce.
Overall completeness and applicability of evidence
Although additional studies with greater numbers of participants would increase our confidence in these results, and despite the issues mentioned above, it appears that aerobic exercise training can be effective in improving our major fibromyalgia outcomes of health‐related quality of life, pain intensity, stiffness, and physical function. Evidence on long‐term effects (24 to 208 weeks post intervention) shows that benefits for pain and function persisted, but benefits for HRQL or fatigue did not. Withdrawals were similar, and stiffness and adverse events were not measured. It is important to note that aerobic exercise training does not seem to be linked with greater withdrawal from programs. Indeed, results lead us to believe that this is an acceptable intervention for individuals with fibromyalgia. Aerobic exercise is a type of exercise that can be performed without the need for elaborate equipment or facilities; it is therefore an accessible form of exercise for individuals with fibromyalgia. Our limited evidence appears to support aerobic exercise training as part of the management of fibromyalgia. Although the body of literature has grown over the past decade, studies remain insufficient for subgroup analyses or evaluation of dose‐response relationships.
We evaluated exercise interventions against well‐accepted guidelines for improving cardiorespiratory fitness and health that outline frequency, intensity, time, type, and volume, as well as progression of aerobic exercise training (Garber 2011). Only four of 13 studies included interventions that were congruent with American College of Sports Medicine (ACSM) guidelines (Table 5). Interventions that fell short of the guidelines included exercise intensities and frequencies below recommendations and total accumulated durations less than the minimum 150 minutes per week for programs of moderate intensity. Few studies in the subgroup analyses (Analysis 1.1; Analysis 1.3) indicate that the effect of the intervention in studies not meeting ACSM guidelines is similar to effects on HRQL and pain intensity. Further, it does appear that aerobic exercise training programs providing lower training volumes than those recommended by ACSM can improve fibromyalgia symptoms. Nonetheless, ACSM guidelines may serve as a useful guide for individuals with fibromyalgia and for health care providers, as they provide ideas for starting, progressing, and maintaining aerobic exercise training programs associated with cardiorespiratory fitness and other health‐related benefits (eg, lower all‐cause mortality, lower risk of cardiovascular disease mortality and morbidity) (ACSM 2013; Garber 2011).
Included studies were published in Canada, United States, Brazil, Spain, Norway, Sweden, United Kingdom, and Turkey. These may represent only some of the total published papers on aerobic exercise and fibromyalgia. Most interventions reflected supervised group training, hence we do not know what home programs or individualized supervision would do to our quality of evidence levels. Most of our studies included only female participants. Additional studies that focus on interventions for males will indicate whether aerobic exercise training interventions have similar effects for men and women. Therefore, our findings are not easily generalized beyond a middle‐aged, largely Caucasian, female population.
Within the context of current practice, many programs targeting individuals with fibromyalgia are already implementing aerobic exercise training, such as walking or moving to music. Expensive or challenging equipment is not required for aerobic exercise training to be incorporated into practice, yet evidence shows a paucity of research examining these types of interventions.
Quality of the evidence
We extracted the evidence presented in this review from trials published in academic journals, from trial registries, and from information requested of trial authors. Using the GRADE system in rating our evidence for major outcomes, we found evidence of low to moderate quality for benefits in HRQL, pain intensity, fatigue, stiffness, and physical function with aerobic exercise training versus control at the end of treatment. We downgraded this evidence because of potential limitations related to imprecision (ie, total cumulative sample size lower than 400, wide confidence intervals), data based on results of one study, and limitations related to risk of bias. Sample sizes of aerobic exercise intervention groups among the 13 studies ranged from 10 to 56 participants. Although most of the individual studies were underpowered, aerobic exercise training versus control group meta‐analyses were sufficient to reveal differences for most variables. Reporting of adverse events was limited owing to inconsistency and lack of information among these studies, although it remains unclear whether injuries occurred, as the reporting is not explicit. Our analysis identified moderate‐quality evidence showing that withdrawal rates did not differ between aerobic exercise training and controls.
We rated the quality of evidence as low for long‐term benefits of aerobic exercise for pain intensity and all‐cause withdrawal owing to risk of bias (lack of allocation concealment, blinding) and imprecision (wide confidence intervals, small number of participants), and we further downgraded the level to very low for HRQL, fatigue, and physical function owing to considerable heterogeneity in study results, Investigators did not measure stiffness and adverse events (see Table 7).
| Quality assessment | Number of participants | Quality | Importance | |||||||
| Number of studies | Study design | Risk of bias | Inconsistency | Indirectness | Imprecision | Other comments | AE only | Control | ||
| HRQL (follow‐up 12 weeks after end of intervention; assessed with 0‐100 scale, lower is best) | ||||||||||
| 2 | Randomized trials | Seriousa | Seriousb | Not serious | Seriousc | 60 | 48 | ⊕⊝⊝⊝ | CRITICAL | |
| Pain intensity (follow‐up 12 weeks after end of intervention to 4 years; assessed with 0‐100 scale, lower is best) | ||||||||||
| 3 | Randomized trials | Seriousa | Not serious | Not serious | Seriousc | 64 | 70 | ⊕⊕⊝⊝ | CRITICAL | |
| Fatigue (follow‐up from 12 weeks after end of intervention to 4 years; assessed with 0‐100 scale, lower is best) | ||||||||||
| 2 | Randomized trials | Seriousa | Seriousb | Not serious | Seriousc | 50 | 50 | ⊕⊝⊝⊝ | IMPORTANT | |
| Stiffness: not measured | ||||||||||
| Physical function (follow‐up at 12 weeks after end of intervention; assessed with 0‐100 scale, lower is best) | ||||||||||
| 1 | Randomized trials | Seriousd | Not serious | Not serious | Seriousc | One study | 30 | 30 | ⊕⊝⊝⊝ | IMPORTANT |
| All‐cause withdrawal (follow‐up from 12 weeks after end of intervention to 4 years) | ||||||||||
| 3 | Randomized trials | Seriousa | Not serious | Not serious | Seriousc | 22/92 (23.9%) | 25/84 (29.8%) | ⊕⊕⊝⊝ | IMPORTANT | |
| Adverse events: not reported | ||||||||||
aIssues with allocation, detection, performance, selective reporting, and other biases
bConsiderable heterogeneity in results (I2 = 80%)
cNumber of participants lower than 400 rule of thumb, wide confidence interval
dIssues related to detection bias, performance bias, and selective reporting
AE: aerobic exercise; HRQL: health‐related quality of life
In comparisons of an aerobic intervention versus another, we found evidence of low to very low quality for benefits in HRQL, pain intensity, fatigue, stiffness, physical function, and all‐cause withdrawal. We downgraded the quality of evidence owing to issues with risk of bias (detection, performance, and other risks of bias), imprecision (wide confidence intervals and small numbers of participants), and heterogeneity of interventions (see Table 8).
| Quality assessment | Number of participants | Quality | Importance | |||||||
| Number of studies | Study design | Risk of bias | Inconsistency | Indirectness | Imprecision | Other considerations | AE intervention | AE control | ||
| HRQL, 0‐100, lower is best | ||||||||||
| 2 | Randomized trial | Seriousa | Not serious | Not serious | Seriousb | Studies not pooled | 79 | 83 | ⊕⊕⊝⊝ | CRITICAL |
| Pain intensity, 0‐100, lower is best | ||||||||||
| 3 | Randomized trial | Seriousb | Not serious | Not serious | Seriousc | Studies not pooled | 117 | 121 | ⊕⊕⊝⊝ | CRITICAL |
| Fatigue, 0‐100, lower is best | ||||||||||
| 2 | Randomized trial | Seriousa | Not serious | Not serious | Seriousb | Studies not pooled | 79 | 83 | ⊕⊕⊝⊝ | IMPORTANT |
| Stiffness, 0‐100, lower is best | ||||||||||
| 1 | Randomized trial | Seriousa | Not serious | Not serious | Seriousb | One study | 51 | 56 | ⊕⊝⊝⊝ | IMPORTANT |
| Physical function, 0‐100, lower is best | ||||||||||
| 2 | Randomized trial | Seriousa | Seriousd | Not serious | Seriousb | 80 | 84 | ⊕⊝⊝⊝ | IMPORTANT | |
| All‐cause withdrawals | ||||||||||
| 2 | Randomized trial | Seriousa | Not serious | Not serious | Seriousb | 20/85 (23.5%) | 25/89 (28.1%) | ⊕⊕⊝⊝ | IMPORTANT | |
| Adverse events: not reported | ||||||||||
aIssues of detection and performance bias
bIssues related to selection, detection, performance, and other risk of bias
cWide confidence intervals, number of participants less than 400 rule of thumb
dInterventions not similar across studies
AE: aerobic exercise; HRQL: health‐related quality of life
In comparisons of an aerobic intervention versus a non‐exercise (other) intervention, the quality of the evidence ranged from low to very low. We downgraded the quality of the evidence because of issues related to risk of bias, very low numbers of trial participants and wide confidence intervals, and inconsistency across comparators (see Table 9).
| Quality assessment | Number of participants | Quality | Importance | |||||||
| Number of studies | Study design | Risk of bias | Inconsistency | Indirectness | Imprecision | Other considerations | AE | Other | ||
| HRQL, 0‐100, lower is best (AE and lifestyle vs education or SMP) | ||||||||||
| 3 | Randomized trial | Seriousa | Not serious | Not serious | Seriousb | 97 | 92 | ⊕⊕⊝⊝ | CRITICAL | |
| Pain intensity, 0‐100, lower is best (AE only vs education or SMP and AE only vs medication) | ||||||||||
| 4 | Randomized trial | Seriousa | Seriousc | Not serious | Seriousb | 94 | 91 | ⊕⊝⊝⊝ | CRITICAL | |
| Fatigue, 0‐100, lower is best (AE and lifestyle vs education or SMP) | ||||||||||
| 3 | Randomized trial | Seriousa | Not serious | Not serious | Seriousb | 74 | 71 | ⊕⊕⊝⊝ | IMPORTANT | |
| Withdrawals | ||||||||||
| 4 | Randomized trial | Seriousa | Not serious | Not serious | Seriousb | 21/130 (16.2%) | 25/125 (20.0%) | ⊕⊕⊝⊝ | IMPORTANT | |
| Stiffness and physical function: not measured | ||||||||||
| Adverse events: reported for 1 study: King 2002: "No complications or adverse effects were observed during the study period among patients who completed the treatment protocols" (page 3 of 8) | ||||||||||
AE: aerobic; HRQL: health‐related quality of life; SMP: self‐management program
aIssues related to risk of bias
bLow number of participants (less than 400 rule of thumb) and wide confidence intervals
cComparator not similar across studies
AE: aerobic exercise; HRQL: health‐related quality of life; SMP: self‐management program
However, the robustness of study results remains questionable until we are certain whether participants in these trials were aware of their allocated group (ie, whether they were aware of the intervention to which they were assigned). Until we are certain of this, study results presented may tend to be overestimated. This is particularly true for self‐reported outcomes such as HRQL, pain intensity, fatigue, stiffness, and physical function. Therefore, evidence must be interpreted with caution.
Potential biases in the review process
Despite efforts to reduce the impact of publication bias on this review, the possibility remains that some studies (with positive or negative findings) may not have been identified by the search.
Contacting study authors for additional information enhanced the accuracy of the information reported in most cases, but this may have introduced a "response bias" into the risk of bias assessment.
We had to impute some values for missing data (such as standard deviations).
The small number of trials included in some analyses further reduced the robustness of these findings.
Other bias may have been introduced by limitations such as incomplete description of exercise protocols and inadequate documentation of adherence to exercise prescriptions.
In our review process, we attempted to control for biases in the following ways.
-
We applied no language restrictions.
-
We updated searches periodically and utilized multiple databases.
-
We complemented our searches with handsearching.
-
We contacted primary authors for clarification and additional information when indicated, although we did not always receive a response. We asked our questions in an open‐ended fashion, so as to avoid leading questions or answers.
-
By searching clinical trial registries (eg, clinicaltrials.gov), we enhanced the opportunity to identify unpublished trials and selective reporting of outcomes. Publication bias may lead to overestimation of a treatment effect by up to 12%.
-
Our multidisciplinary team represented a range of expertise (ie, in library science, systematic reviews and methods, critical appraisal, clinical rheumatology, exercise physiology, physiotherapy, kinesiology, and knowledge translation).
-
We used a standardized procedure to determine selection and inclusion of studies in the review, and review authors were trained in data extraction.
-
Two members of our multidisciplinary team also presented the perspective of consumers (ie, one team member had fibromyalgia, and another team member had another rheumatic disease).
-
We used intention‐to‐treat data preferentially.
Agreements and disagreements with other studies or reviews
Over the past 10 years, several reviews have assessed physical activity interventions for fibromyalgia. In light of their relevance to aerobic exercise, we have chosen to comment on five recent publications: Brosseau 2008 (a clinical practice guideline), Garcia‐Hermoso 2014 (a systematic review), Hauser 2010 (a systematic review), Thomas 2010 (a practical review), and Nuesch 2013 (a network meta‐analysis).
Brosseau 2008 provided clinical practice guidelines for aerobic fitness exercises in the management of fibromyalgia and presented evidence on 13 randomized controlled trials (RCTs; we included only four in this review) and three controlled clinical trials evaluating aerobic exercise for fibromyalgia. Brosseau 2008 reviewed trials of aquatics‐based aerobic exercise as well as interventions including mixed types of exercise such as components of muscle strengthening. We excluded these aquatic and mixed interventions from our present review. Brosseau 2008 assessed methodological quality using the Jadad scale and identified six of 16 trials as having high quality and remaining trials as showing low quality. In contrast, we used the Cochrane "Risk of bias" tool to assess methodological quality. In our review, we identified five studies with high risk of performance bias or reporting bias, and we noted low or unclear risks of bias in remaining categories of all studies. Brosseau 2008 identified inconclusive effects of aerobic exercise training alone on symptoms of fibromyalgia including pain and depression. Conversely, Brosseau 2008 identified aerobic exercise training as improving endurance, which in turn greatly improves physical function, even when only low to moderate exercise intensity is achieved. Brosseau 2008 identified challenges in interpreting results due to a diversity of outcome measures and instruments across primary studies. These challenges combined with the diversity of exercise types included in the Brosseau 2008 review prevented pooled analysis. Conversely, in our review, we were able to conduct pooled analyses identifying benefits of aerobic exercise training for health‐related quality of life, pain intensity, fatigue, stiffness, physical function, and submaximal cardiorespiratory function. Overall, both reviews support aerobic exercise training for the management of fibromyalgia.
Hauser 2010 was a systematic review and meta‐analysis that evaluated the efficacy of aerobic exercise in fibromyalgia. Review authors identified 28 RCTs comparing aerobic exercise versus a control, and seven RCTs comparing different types of aerobic exercise. In contrast to our review, these review authors included studies combining aerobics with other physical activities such as muscle strengthening and aquatic‐specific exercise training programs. We included in our review eight studies identified by Hauser 2010. Attrition rates identified by Hauser 2010 for combined aerobic and control groups were higher, at 67%, versus our 27.3% overall withdrawal rate. Further, Hauser 2010 identified that aerobic exercise training groups had lower rates of intervention program completion when compared with control intervention groups (78% vs 83%). Both reviews identified statistically significant reductions in pain intensity post aerobic exercise training, with effect sizes of standardized mean difference (SMD) ‐0.29 (95% confidence interval (CI) ‐0.46 to ‐0.13), specifically among land‐based aerobic exercise groups (Hauser 2010), whereas we have reported a mean difference (MD) of ‐10.39 on a 100‐point scale (SMD ‐0.48, small effect calculated for comparison). Both reviews identified significant reductions in fatigue and health‐related quality of life. Hauser 2010 found that aerobic exercise training programs improved physical fitness, with improvements similar to those noted in our review for submaximal cardiorespiratory function. Hauser 2010 identified a need for standardized outcome measures and standardized reporting of adverse events in future research. This important finding is congruent with our results, showing inconsistent and unspecified reporting of adverse events of exercise for this population.
Thomas 2010 was a practical review that evaluated aerobic exercise for fibromyalgia. This review included 19 primary articles evaluating land‐ or aquatic‐based exercise and comparing aerobic‐only exercise training versus non‐aerobic exercise training. Thomas 2010 identified nine RCTs of land‐based exercise groups compared with non‐exercise groups. We included five of these primary articles in our review. We excluded from our review the additional four primary articles identified in Thomas 2010 because they include strength training in addition to aerobic exercise in the training program. In contrast to our review, Thomas 2010 did not pool results from studies to identify overall benefits and risks of aerobic exercise, but review authors identified mixed outcomes , with some studies reporting significant improvements in pain, physical function, and aerobic capacity, and others reporting no differences. Thomas 2010 identified statistically significant improvements in pain with aerobic‐ and land‐based exercise among one of three primary articles, and lack of improvement in fatigue in another article. By contrast, we identified statistically significant effects on pain and fatigue in our review, although these improvements may not be clinically significant. Three of four primary articles in the Thomas 2010 review found that physical function significantly improved, similar to statistically significant improvements in physical function identified in our review. Three of four primary articles identified by Thomas 2010 evaluated significant improvements in maximal cardiorespiratory function (CR max) or submaximal cardiorespiratory function (CR submax) with aerobic‐ and land‐based exercise. In our review, we identified significant improvements in CR submax. Thomas 2010 identified a need for standard outcome measure reporting, adequately sized research investigations, and reporting of adherence in future studies. Similarly, we determined that future investigations should report adverse events associated with aerobic exercise.
Garcia‐Hermoso 2014 was a systematic review of 13 primary studies published to August 2013 evaluating the effectiveness and structure of exercise programs designed to improve functional capacity in patients with fibromyalgia. This review included four primary studies of aerobic exercise, two of which we included in the current review. We excluded from the current review two additional studies identified by Garcia‐Hermoso 2014 review authors ‐ one because trial used a single group design, and the second because we judged the belly dance intervention to represent mixed exercise (aerobic and resistance training, rather than strictly aerobic training). Both reviews evaluated randomized controlled interventions of aerobic exercise training compared with a control. In contrast to our review, Garcia‐Hermoso 2014 assessed the quality of methods by applying Physiotherapy Evidence Database (PEDro) criteria, rather than the Cochrane "Risk of bias" tool, as was used in our investigation. Our review identified greater diversity of aerobic training program details, with training program length ranging from 6 to 24 weeks, frequency from one to five times per week, duration from 5 to 60 minutes per session, and intensity from light to vigorous, compared with program length of 12 to 24 weeks, frequency of 0.5 to 2 times per week, duration of 45 to 60 minutes per session, and HRmax intensity of 75% to 80% (one study), as identified by Garcia‐Hermoso 2014. Our findings regarding CR submax are generally consistent with those of Garcia‐Hermoso 2014. Authors of the Garcia‐Hermoso 2014 review identified a large effect size for benefits of aerobic exercise training in improving CR submax (SMD 0.85, 95% CI 0.57 to 1.12), but we identified an effect estimate of MD 62.81 m on the six‐minute walk test, with 95% CI of 26.19 to 99.44 (moderate; SMD 0.58, 95% CI 0.27 to 0.89, calculated for comparison). Similar to our review, Garcia‐Hermoso 2014 noted that adverse events are not well reported by most investigators.
Nuesch 2013 conducted a network meta‐analysis (NMA) evaluating pharmacological and non‐pharmacological interventions for adults with fibromyalgia. NMA is a method used to assess the comparative effectiveness of experimental treatments among similar populations that have not been compared directly in a randomized clinical trial. Unlike the meta‐analysis conducted for this review, which summarized the results of trials that evaluated similar interventions, NMA compares results from two or more studies that have one treatment in common. Nuesch included 33 trials of aerobic exercise as one of the non‐pharmacological interventions evaluated. Both reviews found that aerobic exercise training improved pain intensity, although analysis limited to groups of 50 or more patients within the Nuesch 2013 review reduced the degree of identified improvements. Both reviews found that aerobic exercise was associated with improvements in health‐related quality of life. In contrast to the Nuesch 2013 review, we identified significant reductions in fatigue with aerobic exercise for fibromyalgia. Neither our review nor Nuesch 2013 could identify clinically relevant differences of pain intensity or fatigue outcome measures. Consistent with our findings, Nuesch 2013 identified a need for large‐scale studies of high methodological quality to compare interventions of aerobic exercise for this population.

Study flow diagram.

Risk of bias graph: review authors' judgments about each risk of bias item presented as percentages across all included studies.

Risk of bias summary: review authors' judgments about each risk of bias item for each included study.

Comparison 1 AE versus control (end of intervention), Outcome 1 HRQL, FIQ Total, 0‐100, lower is best.

Comparison 1 AE versus control (end of intervention), Outcome 2 HRQL, sensitivity.selection bias.

Comparison 1 AE versus control (end of intervention), Outcome 3 Pain, intensity, 0‐100, lower is best.

Comparison 1 AE versus control (end of intervention), Outcome 4 Pain, sensitivity.selection bias.
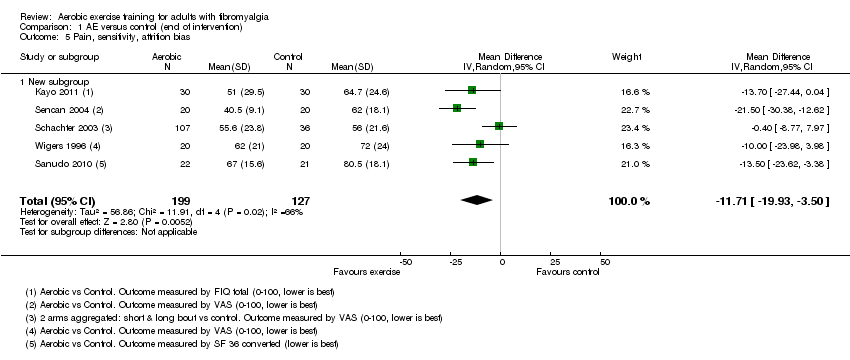
Comparison 1 AE versus control (end of intervention), Outcome 5 Pain, sensitivity, attrition bias.

Comparison 1 AE versus control (end of intervention), Outcome 6 Fatigue, 0‐100 mm, lower is best.

Comparison 1 AE versus control (end of intervention), Outcome 7 Stiffness, 0‐100 mm, lower is best.

Comparison 1 AE versus control (end of intervention), Outcome 8 Physical Ftn, 0‐100 mm, lower is best.

Comparison 1 AE versus control (end of intervention), Outcome 9 Withdrawals.

Comparison 1 AE versus control (end of intervention), Outcome 10 CR max, VO2max, mL/kg/min.

Comparison 1 AE versus control (end of intervention), Outcome 11 CR submax, 6MWT (distance ‐ meters, higher is best).

Comparison 2 AE versus control (long term), Outcome 1 HRQL, 0‐100, lower is best.

Comparison 2 AE versus control (long term), Outcome 2 Pain intensity, 0‐100, lower is best.

Comparison 2 AE versus control (long term), Outcome 3 Fatigue, 0‐100, lower is best.

Comparison 2 AE versus control (long term), Outcome 4 Physical Ftn, 0‐100, lower is best.

Comparison 2 AE versus control (long term), Outcome 5 Withdrawals.

Comparison 2 AE versus control (long term), Outcome 6 CR max, work capacity (W).

Comparison 2 AE versus control (long term), Outcome 7 CR submax, 6MWT (meters, higher is best).

Comparison 3 AE versus AE (end of intervention), Outcome 1 HRQL, 0‐100, lower is best.

Comparison 3 AE versus AE (end of intervention), Outcome 2 Pain intensity, 0‐100, lower is best.

Comparison 3 AE versus AE (end of intervention), Outcome 3 Fatigue, 0‐100, lower is best.

Comparison 3 AE versus AE (end of intervention), Outcome 4 Stiffness, 0‐100, lower is best.

Comparison 3 AE versus AE (end of intervention), Outcome 5 Physical Ftn, 0‐100, lower is best.

Comparison 3 AE versus AE (end of intervention), Outcome 6 Withdrawals.

Comparison 3 AE versus AE (end of intervention), Outcome 7 CR max, VO2max, mL/kg/min.

Comparison 3 AE versus AE (end of intervention), Outcome 8 CR submax, 6MWT (distance ‐ meters, higher is best).

Comparison 4 AE versus other (end of intervention), Outcome 1 HRQL, 0‐100, lower is best.

Comparison 4 AE versus other (end of intervention), Outcome 2 Pain intensity, 0‐100, lower is best.

Comparison 4 AE versus other (end of intervention), Outcome 3 Fatigue, 0‐100, lower is best.

Comparison 4 AE versus other (end of intervention), Outcome 4 Withdrawals.

Comparison 4 AE versus other (end of intervention), Outcome 5 CR max, work capacity (w).

Comparison 4 AE versus other (end of intervention), Outcome 6 CR submax, 6 MWT(distance ‐ meters, higher is best).
| Aerobic exercise training compared with control for fibromyalgia | ||||||
| Patient or population: individuals with fibromyalgia Outcome: measured at the end of the intervention | ||||||
| Outcomes | Illustrative comparative risks* (95% CI) | Relative effect | Number of participants | Quality of the evidence | Comments | |
| Assumed risk | Corresponding risk | |||||
| Control | Aerobic exercise training | |||||
| Health‐related quality of life | Mean health‐related quality of life ranged across control groups from | Mean health‐related quality of life in the intervention groups was | 372 (5 studies) | ⊕⊕⊕⊝ | Absolute change 8% (3% to 13%) better Relative changec 15% (5% to 24%) better NNTB 6 (4 to 16)d | |
| Pain intensity Scale from 0 to 100 mm (0 is best) | Mean pain intensity ranged across control groups from | Mean pain intensity in the intervention groups was | 351 | ⊕⊕⊝⊝ | Absolute change 11% (4% to 18%) better Relative changec 18% (7% to 30%) better NNTB 4 (2 to 15)d | |
| Fatigue Scale from 0 to 100 mm (0 is best) | Mean fatigue ranged across control groups from | Mean fatigue in the intervention groups was 6.06 lower (‐12.41 lower to 0.30 higher) | 246 | ⊕⊕⊝⊝ | Absolute difference 6% improvement (12% improvement to 0.3% worse) Relative changec 8% improvement (16% improved to 0.4% worse) NNTB n/a | |
| Stiffness Follow‐up: 16 weeks | Mean stiffness in control groups was | Mean stiffness in the intervention groups was | 143 | ⊕⊕⊝⊝ | Absolute difference 8% (1% to 15%) improvement Relative changec 11% improvement (1% to 21% improved) NNTB 6 (3 to 218)d | |
| Physical function | Mean physical function ranged across control groups from | Mean physical function in the intervention groups was 10.16 lower (15.39 to 4.94 lower) | 246 | ⊕⊕⊝⊝ | Absolute change 10% (95% CI 15 to 5) improvement Relative changec 21.9% (95% CI 33.2 to 10.7) improvement NNTB 5 (3 to 13)d | |
| Withdrawals | 17 per 100 | 20 per 100 | RR 1.25 (0.89 to 1.77) | 456 | ⊕⊕⊕⊝ | Absolute change: 5% more withdrawals with exercise (3% fewer to 12% more) Relative change 25% more (11% fewer to 77% more) NNTH n/a |
| Adverse events Descriptive information | "the present study findings confirm earlier studies that have shown aerobic exercise to reduce tender point tenderness, increase work capacity without adverse side effects..." (Wigers 1996; pages 83‐84). The following statements show some minor adverse events following aerobic exercise training: "...unable to exercise after an injury" (Sanudo 2010; pages 1840), but it is unclear whether the injury was related to intervention participation: "One participant assigned to the short bout exercise withdrew after developing a metatarsal stress fracture" (Schachter 2003; page 347) | |||||
| *The basis for the assumed risk (e.g. the median control group risk across studies) is provided in footnotes. The corresponding risk (and its 95% confidence interval) is based on the assumed risk in the comparison group and the relative effect of the intervention (and its 95% CI). | ||||||
| GRADE Working Group grades of evidence | ||||||
| aStudy author (intervention length in weeks): King 2002 (12), Schachter 2003 and Kayo 2011 (16), Gowans 2001 (23), Sanudo 2010 (24) jStudy author (intervention length in weeks): Wigers 1996 (14), Kayo 2011 and Schachter 2003 (16), Sanudo 2010 (24) | ||||||
| Term | Definition |
| Agonist‐antagonist muscle contraction | Agonist muscles and antagonist muscles refer to muscles that cause or inhibit movement. Agonist muscles cause movement to occur through their own contraction, and antagonist muscles oppose a specific movement, for example, biceps (agonist) and triceps (antagonist) muscles |
| Amitriptyline | A widely use tricyclic antidepressant medication; it is used to treat several mental illnesses/disorders such as major depression, anxiety, psychosis, bipolar disorder, etc. Other uses include prevention of neuropathic pain such as fibromyalgia |
| Biomarker | In medicine, "biomarker" is a term that is often used to refer to measurable characteristics that reflect the severity or presence of some disease state. It is often an indicator of a particular disease state or some other psychological state of an organism |
| Cardiorespiratory fitness | The ability of the circulatory and respiratory systems to supply oxygen to muscles during sustained physical activity |
| Cognitive‐behavioral therapy | A form of therapy in which the goal is to diminish symptoms by correcting distorted thinking based on negative self‐perceptions and expectations |
| Concomitant | Existing or concurring with something else |
| Detraining | Losing physical and health effects gained during exercise training by stopping exercise |
| Exercise | Physical activity that is planned, structured, and repetitive, and [that] has as a final or intermediate objective of improvement or maintenance of physical fitness (Garber 2011) |
| Exercise training | Program that is designed to meet individual health and physical fitness goals; a single exercise session should include warm‐up, stretching, conditioning, and cool‐down components. The rate of progression depends on the individual's health status and exercise tolerance |
| Genetic | Considered a field of biology, genetics is the study of genes within living organisms; pertaining or according to genetics |
| Heart rate reserve (HRR) | Difference between resting heart rate (HRrest) and maximum heart rate (HRmax). Heart rate reserve is used to determine exercise heart rates |
| Hormones | Any of various internally secreted compounds, such as insulin or thyroxine, formed in endocrine glands that affect the functions of specifically receptive organs or tissues when transported to them by body fluids |
| Inflammatory | Pathology of or caused by inflammation; biological response of body tissues to harmful stimuli such as irritants, damaged cells, or pathogens |
| Maximal aerobic performance | Maximum rate of oxygen consumption as measured during incremental exercise |
| Maximum heart rate (HRmax) | The highest number of beats per minute your heart can reach during maximum physical exertion. This rate is individual and depends on hereditary factors and age |
| Microtrauma | Trauma to muscle cells |
| Milnacipran | A serotonin‐norepinephrine reuptake inhibitor |
| Min × d−1 | Minutes per day |
| Monoamine oxidase inhibitors | An oxidoreductase inhibitor of a single amino group neurotransmitter |
| Muscle strength | A physical test of the amount of force a muscle can generate |
| Neurotransmitters | Any of several chemical substances, such as epinephrine or acetylcholine, that transmit nerve impulses across a synapse to a postsynaptic element, such as another nerve, muscle, or gland |
| Non‐pharmacological | Treatment that does not include medication |
| OMERACT | OMERACT (Outcome Measures in Rheumatology) is an independent initiative of international health professionals interested in outcome measures in rheumatology. Over the past 20 years, OMERACT has served a critical role in the development and validation of clinical and radiographic outcome measures in rheumatoid arthritis, osteoarthritis, psoriatic arthritis, fibromyalgia, and other rheumatic diseases (www.omeract.org). OMERACT is linked to the Cochrane Collaboration Musculoskeletal Review Group, where outcomes endorsed by OMERACT are recommended for use in Cochrane Systematic Reviews |
| Pathophysiology | The physiology of abnormal or diseased organisms or their parts |
| Perceived exertion | Amount of effort that is perceived by someone, usually rated on a scale of 6 to 20 or 1 to 10 |
| Physical activity | Any bodily movement produced by skeletal muscles that results in energy expenditure above resting (basal) levels. Physical activity broadly encompasses exercise, sports, and physical activities done as part of daily living, occupation, leisure, and active transportation (Garber 2011) |
| Physical fitness | Ability to carry out daily tasks with vigor and alertness, without undue fatigue and with ample energy to enjoy (leisure) pursuits and to meet unforeseen emergencies. Physical fitness is operationalized as "[a set of] measurable health and skill‐related attributes" |
| Physical function | The capacity of an individual to carry out physical activities of daily living. Physical function reflects motor function and control, physical fitness, and habitual physical activity and is an independent predictor of functional independence, disability, and morbidity |
| Physiology | Branch of biology dealing with the functions and activities of living organisms and their parts, including all physical and chemical processes |
| Predicted maximum heart rate (HRmax‐p) | HRmax‐p is a score equivalent to maximum heart rate (HRmax). HRmax‐p may provide a way to define training intensities as percentages of maximum heart rate and to follow maximum heart rate changes due to training without an exhaustive maximal stress test |
| Pregabalin | An antiepileptic medication |
| Prevalence | Rate of occurrence of a condition, usually expressed on a per‐year basis |
| Skewness | Not every distribution of data is symmetrical ‐ sets of data that are not symmetrical are said to be "asymmetrical." The measure of how asymmetrical a distribution can be is called "skewness" |
| Sleep disturbance | A score derived from a questionnaire that measures sleep quantity and quality. The Medical Outcomes Survey Sleep Scale measures 6 dimensions of sleep (initiation, staying asleep, quantity, adequacy, drowsiness, shortness of breath, snoring) |
| Somatic comorbidities | Conditions of the body related to a disease |
| Symptoms | Patients' perceptions of an "abnormal" physical, emotional, or cognitive state |
| Tenderness | Pain evoked by tactile pressure |
| Intensity | %VO2 reserve/% HR reserve | % HRmax | Perceived exertion scale (RPE) 6 to 20 |
| Very light | < 37 | < 57 | RPE < 9 |
| Light | 37 to 45 | 57 to 63 | RPE 9 (very light) to 11 (fairly light) |
| Moderate | 46 to 63 | 64 to 76 | RPE 12 (fairly light) to 13 (somewhat hard) |
| Vigorous | 64 to 90 | 77 to 95 | RRE 14 (somewhat hard to 17 (very hard) |
| Near maximal to maximal | ≥ 91 | ≥ 96 | RPE ≥ 18 (very hard) |
| HR: heart rate; RPE: rating of perceived exertion; VO2: oxygen consumption | |||
| Outcome | Name of Instrument or index/subscale |
| Health‐related quality of life | FIQ Total (0‐100) |
| Pain intensity/interference | Current pain (VAS), FIQ pain (VAS), SF‐36 bodily pain (interference) |
| Fatigue | VAS (0‐100), FIQ fatigue (0‐100), SF‐36 vitality (0‐100), Fatigue Severity Scale (9‐63), Multidimensional Fatigue Inventory (4‐20) |
| Stiffness | FIQ stiffness |
| Physical function | SF‐36 physical functioning (0‐100), FIQ physical function (0‐100), Sickness Impact Profile (0‐68), Health Assessment Questionnaire (HAQ) |
| Maximal cardiorespiratory function | Oxygen uptake (VO2max), maximum work capacity (w) |
| Submaximal cardiorespiratory function | 6‐minute walk test (distance in meters), Astrand submaximal cycle ergometer test (heart rate at a steady state workload) |
| Adverse events | Not a standardized instrument or index/narrative information |
| FIQ: Fibromyalgia Impact Questionnaire; HAQ: Health Assessment Questionnaire; SF‐36: Short Form 36; VAS: visual analogue scale; VO2max: maximal oxygen uptake | |
| Author, year, intervention | Frequency, times per week – length in weeks | Intensity/ACSM intensity classification | Time/Duration/Session, minutes | Type/Mode | |
| Aerobic vs control | |||||
| 3 times/wk | 23 weeks | 60%‐75% age‐adjusted HRmax | 30' | Supervised water walking/running progressing to land walking/running | |
| 3 times/wk | 16 weeks | 40%‐50% HRR at week 1 to 60%‐70% HRR by week 16 | ˜ 60' | Supervised indoor or outdoor walking | |
| 3 times/wk | 12 weeks | 60%‐75% predicted HRmax | Starting duration 10 to 15' progressing to 20 to 40' | Supervised walking, aquacise (deep and shallow water), or low‐impact aerobics | |
| 2 times/wk | 20 weeks | 120‐150 beats per minute ACSM: moderate to vigorous | 60' | Supervised low‐impact aerobic dance program | |
| 3 times/wk | 8 weeks | 60%‐70% predicted HRmax/age ACSM: light to moderate | Unclear | Supervised fast‐paced walking on an indoor track | |
| 2 times/wk | 24 weeks | 60%‐65% HRmax (steady state aerobics) and 75%‐80% HRmax (interval training) ACSM: light to moderate and moderate to vigorous | 45‐60’ | Supervised aerobics including continuous walking with arm movements and jogging; interval training including aerobic dance and jogging | |
| Schachter 2003 Short bout | 3 to 5 times/wk | 16 weeks | 40%‐50% HRR at week 1, 60%‐70% HRR by week 10 ACSM: moderate at week 1, vigorous by week 10 | 2/d, 5' at week 1 to 15' | Home program of low‐impact aerobics to videotaped instructor and music, rhythmical movements of lower body muscles. Supervision at 0, 4, 8, and 12 weeks |
| Long bout | 3 to 5 times/wk | 16 weeks | 40%‐50% HRR at week 1, 60%‐70% HRR by week 10 ACSM: moderate at week 1; vigorous by week 10 | 10' at week 1 to 30' | Home program of low‐impact aerobics to videotaped instructor and music, rhythmical movements of lower body muscles. Supervision at 0, 4, 8, and 12 weeks |
| Sencan 2004 Aerobic exercise | 3 times/wk | 6 weeks | Not specified | 40’ | Cycle ergometry. Supervision unclear |
| 3 times/wk | 14 weeks | Tempo gradually increased up to, and decreased down from, 4 periods of 60%‐70% HRmax ACSM: light to moderate | 45’ | Supervised movement to music and games | |
| Aerobic vs aerobic2 | |||||
| Mannerkorpi 2010 AE: Nordic walking | 2 times/wk | 15 weeks | 10’ at RPE 9‐11 2' intervals of RPE 13‐15, alternated with 2' at RPE 10 to 11 ACSM: 10’ light, 2’ intervals moderate to vigorous alternated with 2’ light. | 20’ | Supervised walking in parks and forests with flat areas and small hills |
| AE2: low‐intensity walking | 1 time/wk | 15 weeks | RPE 9 to 11 | 20’ | Supervised walking in parks and forests with flat areas and small hills |
| AE: exercise class | 1 time/wk | 12 weeks | Not specified | 60’ | Supervised graded circuit exercises consisting of step‐ups, sitting to standing, skipping, jogging on the spot, alternate side bends, circling arms with increasing weights, plus encouragement to continue and increase exercises at home |
| AE2: single class | 1 session | 12 weeks | Not specified | 60’ | Demonstration of aerobic exercises, stretching and relaxation technique, plus written advice on aerobic exercises plus stretching and relaxation |
| Schachter 2003: AE: short bout | 3 to 5/wk | 16 weeks | 40%‐50% HRR at week 1, 60%‐70% HRR by week 10 | 2/d 5' up to 15' | Home program of low‐impact aerobics to videotaped instructor and music, rhythmical movements of lower body muscles. Supervision at 0, 4, 8, and 12 weeks |
| AE2: long bout | 3 to 5/wk | 16 weeks | 40%‐50% HRR at week 1, 60%‐70% HRR by week 10 ACSM: moderate at week 1, vigorous by weeks 10‐16 | 10' up to 30' | Home program of low‐impact aerobics to videotaped instructor and music, rhythmical movements of lower body muscles. Supervision at 0, 4, 8, and 12 weeks |
| Aerobic vs other (education or stress management training) | |||||
| Group session every 2 weeks AE: 5‐7 times/wk | 12 weeks | Moderate intensity ACSM: moderate | 10’ and increase daily 5’/wk to at least 30’ | Brisk walking and other modes of aerobic activity (+ group session/supervision) | |
| 5‐7 times/wk | 12 weeks | Moderate (breathing heavily but able to keep a conversation) + 15’ of above usual level ACSM: moderate Review authors used appropriate references to help translate "moderate" into action | 60’ | Walking (the most common form of LPA) and other forms (eg, garden/mowing the lawn); household activity (eg, vacuuming); and sports activity (eg, cycling, swimming, field hockey) (+ group sessions/supervision) | |
| 3 times/wk | 12 weeks | 60%‐75% predicted HRmax ACSM: light to moderate | Starting duration 10 to 15' progressing to 20 to 40' | Supervised walking, aquacise (deep and shallow water), or low‐impact aerobics | |
| 3 times/wk | 6 weeks | Not specified | 40’ | Cycle ergometry. Supervision unclear | |
| 3 times/wk | 14 weeks | Tempo gradually increased up to, and decreased down from, 4 periods at 60%‐70% HRmax ACSM: light to moderate | 45’ | Supervised movement to music and games | |
| ACSM: American College of Sports Medicine; AE: aerobic exercise; FITT: frequency, intensity, time, and type of training; HRmax: maximum heart rate; HRR: heart rate reserve; RPE: rating of perceived exertion | |||||
| Met ACSM criteria | Did not meet ACSM criteria | Not enough information to judge |
| Fontaine 2007; Fontaine 2010; Kayo 2011; Schachter 2003 met ACSM guidelines for healthy adults. Gowans 2001 met ACSM criteria for individuals who are sedentary/have no habitual activity/are extremely deconditioned | King 2002: based on frequency and duration (only 3/wk, light to moderate); Mannerkorpi 2010: based on frequency and duration (only twice or once a week with 20' session duration); Mengshoel 1992: based on frequency of 2 times/wk; Nichols 1994: based on frequency and duration (only twice a week); Ramsay 2000: based on frequency (only once a week); Sanudo 2010: based on frequency (only twice a week) for aerobics; Wigers 1996: intensity too low, duration too short (only 18‐20’ at HR 60%‐70%) | |
| ACSM: American College of Sports Medicine; HR: heart rate | ||
| Outcome | All studies MD (95% CI), number of studies (participants), I2 | Low risk of selection bias MD (95% CI), number of studies (participants), I2 | Low risk of attrition bias MD (95% CI), number of studies (participants), I2 | Detection bias |
| HRQL | ‐7.89 (‐13.23 to ‐2.55), 5 studies (372), I2= 58% | ‐10.47 (‐20.79 to ‐0.15), 3 studies (246), I2 = 77% | > 20% was not present ‐ this sensitivity analysis was not conducted | Sensitivity analysis not conducted |
| Pain | ‐11.06 (‐18.34 to ‐3.77), 6 studies (351), I2= 59% | ‐8.38 (‐17.88 to 1.12), 3 studies (246), I2 = 59% | ‐11.71 (‐19.93 to ‐3.50), 5 studies (326), I2 = 66% | Sensitivity analysis not conducted |
| CI: confidence interval; HRQL: health‐related quality of life; MD: mean difference | ||||
| Quality assessment | Number of participants | Quality | Importance | |||||||
| Number of studies | Study design | Risk of bias | Inconsistency | Indirectness | Imprecision | Other comments | AE only | Control | ||
| HRQL (follow‐up 12 weeks after end of intervention; assessed with 0‐100 scale, lower is best) | ||||||||||
| 2 | Randomized trials | Seriousa | Seriousb | Not serious | Seriousc | 60 | 48 | ⊕⊝⊝⊝ | CRITICAL | |
| Pain intensity (follow‐up 12 weeks after end of intervention to 4 years; assessed with 0‐100 scale, lower is best) | ||||||||||
| 3 | Randomized trials | Seriousa | Not serious | Not serious | Seriousc | 64 | 70 | ⊕⊕⊝⊝ | CRITICAL | |
| Fatigue (follow‐up from 12 weeks after end of intervention to 4 years; assessed with 0‐100 scale, lower is best) | ||||||||||
| 2 | Randomized trials | Seriousa | Seriousb | Not serious | Seriousc | 50 | 50 | ⊕⊝⊝⊝ | IMPORTANT | |
| Stiffness: not measured | ||||||||||
| Physical function (follow‐up at 12 weeks after end of intervention; assessed with 0‐100 scale, lower is best) | ||||||||||
| 1 | Randomized trials | Seriousd | Not serious | Not serious | Seriousc | One study | 30 | 30 | ⊕⊝⊝⊝ | IMPORTANT |
| All‐cause withdrawal (follow‐up from 12 weeks after end of intervention to 4 years) | ||||||||||
| 3 | Randomized trials | Seriousa | Not serious | Not serious | Seriousc | 22/92 (23.9%) | 25/84 (29.8%) | ⊕⊕⊝⊝ | IMPORTANT | |
| Adverse events: not reported | ||||||||||
| aIssues with allocation, detection, performance, selective reporting, and other biases bConsiderable heterogeneity in results (I2 = 80%) cNumber of participants lower than 400 rule of thumb, wide confidence interval dIssues related to detection bias, performance bias, and selective reporting AE: aerobic exercise; HRQL: health‐related quality of life | ||||||||||
| Quality assessment | Number of participants | Quality | Importance | |||||||
| Number of studies | Study design | Risk of bias | Inconsistency | Indirectness | Imprecision | Other considerations | AE intervention | AE control | ||
| HRQL, 0‐100, lower is best | ||||||||||
| 2 | Randomized trial | Seriousa | Not serious | Not serious | Seriousb | Studies not pooled | 79 | 83 | ⊕⊕⊝⊝ | CRITICAL |
| Pain intensity, 0‐100, lower is best | ||||||||||
| 3 | Randomized trial | Seriousb | Not serious | Not serious | Seriousc | Studies not pooled | 117 | 121 | ⊕⊕⊝⊝ | CRITICAL |
| Fatigue, 0‐100, lower is best | ||||||||||
| 2 | Randomized trial | Seriousa | Not serious | Not serious | Seriousb | Studies not pooled | 79 | 83 | ⊕⊕⊝⊝ | IMPORTANT |
| Stiffness, 0‐100, lower is best | ||||||||||
| 1 | Randomized trial | Seriousa | Not serious | Not serious | Seriousb | One study | 51 | 56 | ⊕⊝⊝⊝ | IMPORTANT |
| Physical function, 0‐100, lower is best | ||||||||||
| 2 | Randomized trial | Seriousa | Seriousd | Not serious | Seriousb | 80 | 84 | ⊕⊝⊝⊝ | IMPORTANT | |
| All‐cause withdrawals | ||||||||||
| 2 | Randomized trial | Seriousa | Not serious | Not serious | Seriousb | 20/85 (23.5%) | 25/89 (28.1%) | ⊕⊕⊝⊝ | IMPORTANT | |
| Adverse events: not reported | ||||||||||
| aIssues of detection and performance bias bIssues related to selection, detection, performance, and other risk of bias cWide confidence intervals, number of participants less than 400 rule of thumb dInterventions not similar across studies AE: aerobic exercise; HRQL: health‐related quality of life | ||||||||||
| Quality assessment | Number of participants | Quality | Importance | |||||||
| Number of studies | Study design | Risk of bias | Inconsistency | Indirectness | Imprecision | Other considerations | AE | Other | ||
| HRQL, 0‐100, lower is best (AE and lifestyle vs education or SMP) | ||||||||||
| 3 | Randomized trial | Seriousa | Not serious | Not serious | Seriousb | 97 | 92 | ⊕⊕⊝⊝ | CRITICAL | |
| Pain intensity, 0‐100, lower is best (AE only vs education or SMP and AE only vs medication) | ||||||||||
| 4 | Randomized trial | Seriousa | Seriousc | Not serious | Seriousb | 94 | 91 | ⊕⊝⊝⊝ | CRITICAL | |
| Fatigue, 0‐100, lower is best (AE and lifestyle vs education or SMP) | ||||||||||
| 3 | Randomized trial | Seriousa | Not serious | Not serious | Seriousb | 74 | 71 | ⊕⊕⊝⊝ | IMPORTANT | |
| Withdrawals | ||||||||||
| 4 | Randomized trial | Seriousa | Not serious | Not serious | Seriousb | 21/130 (16.2%) | 25/125 (20.0%) | ⊕⊕⊝⊝ | IMPORTANT | |
| Stiffness and physical function: not measured | ||||||||||
| Adverse events: reported for 1 study: King 2002: "No complications or adverse effects were observed during the study period among patients who completed the treatment protocols" (page 3 of 8) | ||||||||||
| AE: aerobic; HRQL: health‐related quality of life; SMP: self‐management program aIssues related to risk of bias bLow number of participants (less than 400 rule of thumb) and wide confidence intervals cComparator not similar across studies AE: aerobic exercise; HRQL: health‐related quality of life; SMP: self‐management program | ||||||||||
| Outcome or subgroup title | No. of studies | No. of participants | Statistical method | Effect size |
| 1 HRQL, FIQ Total, 0‐100, lower is best Show forest plot | 5 | 372 | Mean Difference (IV, Random, 95% CI) | ‐7.89 [‐13.23, ‐2.55] |
| 1.1 Met ACSM | 3 | 253 | Mean Difference (IV, Random, 95% CI) | ‐8.66 [‐17.77, 0.44] |
| 1.2 Did not meet ACSM | 2 | 119 | Mean Difference (IV, Random, 95% CI) | ‐6.77 [‐12.97, ‐0.57] |
| 2 HRQL, sensitivity.selection bias Show forest plot | 3 | 246 | Mean Difference (IV, Random, 95% CI) | ‐10.47 [‐20.79, ‐0.15] |
| 3 Pain, intensity, 0‐100, lower is best Show forest plot | 6 | 351 | Mean Difference (IV, Random, 95% CI) | ‐11.06 [‐18.34, ‐3.77] |
| 3.1 Met ACSM | 2 | 203 | Mean Difference (IV, Random, 95% CI) | ‐5.89 [‐18.72, 6.95] |
| 3.2 Did not meet ACSM | 4 | 148 | Mean Difference (IV, Random, 95% CI) | ‐14.90 [‐21.36, ‐8.44] |
| 4 Pain, sensitivity.selection bias Show forest plot | 3 | 246 | Mean Difference (IV, Random, 95% CI) | ‐8.38 [‐17.88, 1.12] |
| 5 Pain, sensitivity, attrition bias Show forest plot | 5 | 326 | Mean Difference (IV, Random, 95% CI) | ‐11.71 [‐19.93, ‐3.50] |
| 5.1 New subgroup | 5 | 326 | Mean Difference (IV, Random, 95% CI) | ‐11.71 [‐19.93, ‐3.50] |
| 6 Fatigue, 0‐100 mm, lower is best Show forest plot | 4 | 286 | Mean Difference (IV, Random, 95% CI) | ‐6.06 [‐12.41, 0.30] |
| 7 Stiffness, 0‐100 mm, lower is best Show forest plot | 1 | Mean Difference (IV, Random, 95% CI) | Totals not selected | |
| 8 Physical Ftn, 0‐100 mm, lower is best Show forest plot | 3 | 246 | Mean Difference (IV, Random, 95% CI) | ‐10.16 [‐15.39, ‐4.94] |
| 9 Withdrawals Show forest plot | 8 | 456 | Risk Ratio (M‐H, Random, 95% CI) | 1.25 [0.89, 1.77] |
| 10 CR max, VO2max, mL/kg/min Show forest plot | 1 | 143 | Mean Difference (IV, Random, 95% CI) | 1.60 [‐0.06, 3.26] |
| 11 CR submax, 6MWT (distance ‐ meters, higher is best) Show forest plot | 3 | 169 | Mean Difference (IV, Random, 95% CI) | 55.58 [27.20, 83.96] |
| Outcome or subgroup title | No. of studies | No. of participants | Statistical method | Effect size |
| 1 HRQL, 0‐100, lower is best Show forest plot | 2 | 108 | Mean Difference (IV, Random, 95% CI) | ‐11.16 [‐25.99, 3.68] |
| 2 Pain intensity, 0‐100, lower is best Show forest plot | 3 | 134 | Mean Difference (IV, Random, 95% CI) | ‐10.56 [‐18.00, ‐1.12] |
| 3 Fatigue, 0‐100, lower is best Show forest plot | 2 | 100 | Mean Difference (IV, Random, 95% CI) | ‐5.93 [‐24.34, 12.47] |
| 4 Physical Ftn, 0‐100, lower is best Show forest plot | 1 | 60 | Mean Difference (IV, Random, 95% CI) | ‐11.33 [‐22.11, ‐0.55] |
| 5 Withdrawals Show forest plot | 3 | 176 | Risk Ratio (M‐H, Random, 95% CI) | 0.75 [0.47, 1.22] |
| 6 CR max, work capacity (W) Show forest plot | 1 | 40 | Mean Difference (IV, Random, 95% CI) | 0.10 [‐0.06, 0.26] |
| 7 CR submax, 6MWT (meters, higher is best) Show forest plot | 1 | 48 | Mean Difference (IV, Random, 95% CI) | 41.5 [‐17.91, 100.91] |
| Outcome or subgroup title | No. of studies | No. of participants | Statistical method | Effect size |
| 1 HRQL, 0‐100, lower is best Show forest plot | 2 | Mean Difference (IV, Random, 95% CI) | Totals not selected | |
| 2 Pain intensity, 0‐100, lower is best Show forest plot | 3 | Mean Difference (IV, Fixed, 95% CI) | Totals not selected | |
| 3 Fatigue, 0‐100, lower is best Show forest plot | 2 | Std. Mean Difference (IV, Random, 95% CI) | Totals not selected | |
| 4 Stiffness, 0‐100, lower is best Show forest plot | 1 | Mean Difference (IV, Random, 95% CI) | Totals not selected | |
| 5 Physical Ftn, 0‐100, lower is best Show forest plot | 2 | Mean Difference (IV, Random, 95% CI) | Totals not selected | |
| 6 Withdrawals Show forest plot | 2 | Risk Ratio (M‐H, Random, 95% CI) | Totals not selected | |
| 7 CR max, VO2max, mL/kg/min Show forest plot | 1 | Mean Difference (IV, Random, 95% CI) | Totals not selected | |
| 8 CR submax, 6MWT (distance ‐ meters, higher is best) Show forest plot | 1 | Mean Difference (IV, Random, 95% CI) | Totals not selected | |
| Outcome or subgroup title | No. of studies | No. of participants | Statistical method | Effect size |
| 1 HRQL, 0‐100, lower is best Show forest plot | 3 | Mean Difference (IV, Random, 95% CI) | Totals not selected | |
| 2 Pain intensity, 0‐100, lower is best Show forest plot | 4 | Mean Difference (IV, Random, 95% CI) | Totals not selected | |
| 2.1 AE only vs education or SMP | 3 | Mean Difference (IV, Random, 95% CI) | 0.0 [0.0, 0.0] | |
| 2.2 AE only vs medication | 1 | Mean Difference (IV, Random, 95% CI) | 0.0 [0.0, 0.0] | |
| 3 Fatigue, 0‐100, lower is best Show forest plot | 3 | Std. Mean Difference (IV, Random, 95% CI) | Totals not selected | |
| 4 Withdrawals Show forest plot | 4 | Risk Ratio (M‐H, Random, 95% CI) | Totals not selected | |
| 5 CR max, work capacity (w) Show forest plot | 1 | Mean Difference (IV, Random, 95% CI) | Totals not selected | |
| 6 CR submax, 6 MWT(distance ‐ meters, higher is best) Show forest plot | 3 | Mean Difference (IV, Random, 95% CI) | Totals not selected | |