Selección individualizada de dosis de gonadotrofina con marcadores de la reserva ovárica para pacientes sometidas a fecundación in vitro más inyección intracitoplasmática de espermatozoides (FIV/ICSI)
Resumen
Antecedentes
Durante un ciclo de fecundación in vitro más inyección intracitoplasmática de espermatozoides (FIV/ICSI), las pacientes reciben diariamente dosis de la gonadotrofina hormona foliculoestimulante (FSH) para inducir el desarrollo de múltiples folículos en los ovarios. En general, la dosis de FSH se asocia con el número de ovocitos recuperado. A menudo se considera conveniente una respuesta normal a la estimulación, por ejemplo, la recuperación de cinco a 15 ovocitos. La respuesta deficiente y la hiperrespuesta se asocian con mayores probabilidades de cancelación de ciclos. La hiperrespuesta también se asocia con un aumento en el riesgo de síndrome de hiperestimulación ovárica (SHEO). Con frecuencia los médicos individualizan la dosis de FSH según las características de la paciente que predicen la respuesta ovárica, como la edad. Más recientemente, los médicos han empezado a utilizar pruebas de la reserva ovárica (PRO) para predecir la respuesta ovárica sobre la base de la medición de diversos marcadores biológicos como la FSH basal (FSHb), el recuento de folículos antrales (RFA) y la hormona anti‐Mülleriana (AMH). No está claro si la individualización de la dosis de FSH según estos marcadores mejora los resultados clínicos.
Objetivos
Evaluar los efectos de la selección individualizada de dosis de gonadotrofina según marcadores de la reserva ovárica en pacientes sometidas a FIV/ICSI.
Métodos de búsqueda
Se hicieron búsquedas en el registro especializado del Grupo Cochrane de Ginecología y Fertilidad (Cochrane Gynaecology and Fertility Group Specialised Register), Cochrane Central Register of Studies Online, MEDLINE, Embase, CINAHL, LILACS, DARE, ISI Web of Knowledge, ClinicalTrials.gov y en el portal de búsquedas de la World Health Organisation International Trials Registry Platform, desde su inicio hasta el 27 de julio de 2017. Se revisaron las listas de referencias de revisiones relevantes y estudios incluidos.
Criterios de selección
Se incluyeron los ensayos que compararon diferentes dosis de FSH en pacientes con un perfil definido según las PRO (es decir, pacientes con una respuesta prevista baja, normal o alta según la AMH, el RFA y la FSHb) y ensayos que compararon una estrategia individualizada de dosis (según al menos una medida de las PRO) versus dosis uniforme o un algoritmo individualizado de dosis diferente.
Obtención y análisis de los datos
Se utilizaron los procedimientos metodológicos estándar recomendados por la Colaboración Cochrane. Los resultados primarios fueron nacidos vivos/embarazo en curso y SHEO grave. Los resultados secundarios incluyeron embarazo clínico, SHEO moderado o grave, embarazo múltiple, producción de ovocitos, cancelaciones de ciclos, y dosis total y duración de la administración de FSH.
Resultados principales
Se incluyeron 20 ensayos (N = 6088); sin embargo, estos ensayos con comparaciones múltiples se consideraron como ensayos separados en esta revisión. El metanálisis se vio limitado debido a la heterogeneidad clínica. La calidad de la evidencia varió de muy baja a moderada. Las limitaciones principales fueron la imprecisión y el riesgo de sesgo asociado con la falta de cegamiento.
Comparaciones directas de dosis en las pacientes según la respuesta prevista
Toda la evidencia fue de calidad baja o muy baja.
Debido a las diferencias en las comparaciones de dosis, se recomienda precaución al interpretar los resultados de cinco ensayos pequeños que evaluaron pacientes con una respuesta prevista baja. Las estimaciones del efecto fueron muy poco precisas, y un aumento en la dosis de FSH puede tener o no una repercusión sobre las tasas de nacidos vivos/embarazo en curso, SHEO y embarazo clínico.
De igual manera, en las pacientes con una respuesta prevista normal (nueve estudios, tres comparaciones), dosis mayores pueden repercutir o no en la probabilidad de nacidos vivos/embarazo en curso (p.ej., 200 versus 100 unidades internacionales): OR 0,88, IC del 95% 0,57 a 1,36; N = 522; dos estudios; I2 = 0%) o embarazo clínico. Los resultados fueron poco precisos, y todavía es posible un efecto beneficioso o perjudicial. Hubo muy pocos eventos en el resultado SHEO para poder establecer conclusiones.
En las pacientes con una respuesta prevista alta, dosis inferiores pueden tener o no una repercusión sobre las tasas de nacidos vivos/embarazo en curso (OR 0,98; IC del 95%: 0,66 a 1,46; N = 521; un estudio), el SHEO y el embarazo clínico. Sin embargo, es probable que las dosis inferiores reduzcan la probabilidad de SHEO moderado o grave (OR de Peto 2,31; IC del 95%: 0,80 a 6,67; N = 521; un estudio).
Estudios de algoritmo de las PRO
Cuatro ensayos compararon un algoritmo según la PRO con un grupo control sin PRO. Las tasas de nacidos vivos/embarazo en curso y de embarazo clínico no parecieron diferir en más de unos pocos puntos porcentuales (respectivamente: OR 1,04, IC del 95%: 0,88 a 1,23; N = 2823, cuatro estudios; I2 = 34%; OR 0,96, IC del 95%: 0,82 a 1,13, cuatro estudios, I2=0%, evidencia de calidad moderada). Sin embargo, es probable que los algoritmos de las PRO reduzcan la probabilidad de SHEO moderado o grave (OR de Peto 0,58; IC del 95%: 0,34 a 1,00; N = 2823; cuatro estudios; I2 = 0%, evidencia de baja calidad). No hubo evidencia suficiente para determinar si hubo diferencias entre los grupos en las tasas de SHEO grave (OR 0,54; IC del 95%: 0,14 a 1,99; N = 1494; tres estudios; I2 = 0%, evidencia de baja calidad). Los resultados indican que si las probabilidades de nacidos vivos con una dosis estándar son del 26%, la probabilidad con una dosis según la PRO sería del 24% al 30%. Si las probabilidades de SHEO moderado o grave con una dosis estándar son del 2,5%, la probabilidad con una dosis según la PRO sería del 0,8% al 2,5%. Estos resultados se deben examinar con precaución debido a la heterogeneidad en los diseños de los estudios.
Conclusiones de los autores
No se encontró que el ajuste de la dosis de FSH en cualquier población particular según la PRO (PRO baja, normal, alta), influyera en las tasas de nacidos vivos/embarazo en curso, pero no es posible descartar diferencias debido a las limitaciones de los tamaños de la muestra. En las pacientes con una respuesta prevista alta, dosis inferiores de FSH parecieron reducir la incidencia general de SHEO moderado y grave. Evidencia de calidad moderada indica que la individualización según la PRO produce tasas similares de nacidos vivos/embarazo en curso a una política de darles a todas las pacientes 150 UI. Sin embargo, en todos los casos, los intervalos de confianza son consistentes con un aumento o disminución en la tasa de alrededor de cinco puntos porcentuales con la dosis según la PRO (p.ej., del 25% al 20% ó 30%). Aunque pequeña, una diferencia de esta magnitud podría ser importante para muchas mujeres. Además, los algoritmos de las PRO redujeron la incidencia de SHEO en comparación con la dosis estándar de 150 UI, probablemente al facilitar las reducciones en las dosis de las pacientes con una respuesta prevista alta. Sin embargo, el tamaño del efecto no está claro. Los estudios incluidos fueron heterogéneos en cuanto al diseño, lo que limitó la interpretación de las estimaciones agrupadas y muchos de los estudios incluidos tuvieron un riesgo de sesgo alto.
La evidencia actual no proporciona una justificación clara para el ajuste de la dosis estándar de 150 UI en el caso de las pacientes con una respuesta baja o normal, especialmente porque un aumento en la dosis por lo general se asocia con una dosis total de FSH mayor y, por lo tanto, con mayor costo. Sin embargo, una disminución en la dosis en las pacientes con una respuesta prevista alta puede reducir el SHEO.
PICO
Resumen en términos sencillos
Dosis de estimulación individualizada según marcadores de la reserva ovárica en pacientes sometidas a fecundación in vitro más inyección intracitoplasmática de espermatozoides (FIV/ICSI)
Antecedentes
Al planificar un ciclo de FIV, los médicos a menudo deciden la dosis de los fármacos de estimulación sobre la base de ciertas características de cada mujer, como la edad. Se han desarrollado nuevas pruebas que algunos especialistas consideran que pueden predecir mejor la respuesta de una mujer a la estimulación para la FIV. Estas pruebas se llaman pruebas de la reserva ovárica y son una medida general del número de ovocitos disponibles en los ovarios. No está claro si el ajuste de las dosis de los fármacos de estimulación según las pruebas individuales de la reserva ovárica puede ayudar a aumentar las probabilidades de la paciente de quedar embarazada y tener un recién nacido. Tampoco está claro si las pruebas ayudan a mejorar la seguridad del ciclo de FIV, al disminuir las probabilidades de una enfermedad grave conocida como síndrome de hiperestimulación ovárica (SHEO).
Características de los estudios
En esta revisión se incluyeron dos tipos de estudios. Los estudios de comparación directa de dosis reclutaron pacientes con una respuesta prevista a la estimulación para la FIV considerada deficiente, normal o excesiva según la prueba de la reserva ovárica. Luego los investigadores asignaron al azar a estas pacientes a diferentes dosis de FSH para determinar si las diferentes dosis repercutirían en los resultados de la FIV.
Los estudios de algoritmo de las PRO dividieron a un grupo más grande de pacientes en pacientes cuya dosis de estimulación se basó en la prueba de la reserva ovárica y pacientes que recibieron una dosis estándar de medicación de estimulación o una dosis basada en otra característica de la paciente (diferente de la reserva ovárica).
En total, se incluyeron 20 ensayos controlados aleatorizados que incluyeron a 6088 mujeres.
Resultados clave
1. Estudios de comparación directa de dosis (evidencia de calidad baja o muy baja)
En las pacientes en las que se previó una respuesta deficiente o normal a la estimulación según la prueba de la reserva ovárica, el aumento de la dosis de la medicación de estimulación no pareció influir en las probabilidades de quedar embarazada ni de tener un recién nacido, ni en las probabilidades de SHEO. Sin embargo, los estudios incluidos fueron pequeños y compararon dosis diferentes de la medicación. Lo anterior impidió afirmar con seguridad que no hay diferencias entre las dosis. En las pacientes en las que se previó una respuesta deficiente, si las probabilidades de nacidos vivos con 150 UI son del 11%, entonces la probabilidad con 300/340 UI sería del 3,8% al 16%. En las pacientes en las que se previó una respuesta normal, si la probabilidad de nacidos vivos o embarazo en curso con 150 UI es del 19%, entonces la probabilidad con 200/225 UI sería del 12% al 31%.
En las pacientes en las que se previó una respuesta excesiva a la estimulación, la reducción de la dosis de estimulación puede afectar o no las probabilidades de tener un recién nacido. Si la probabilidad de nacidos vivos con 100 UI es del 26%, entonces la probabilidad con 150 UI sería del 18% al 33%. Sin embargo, puede reducir la tasa de SHEO. Si las probabilidades de SHEO moderado o grave con una dosis inferior son del 1,6%, entonces la probabilidad con una dosis mayor sería del 1,3% al 9,6%.
2. Estudios de algoritmo de las PRO
Evidencia de calidad moderada de estos estudios indica que el uso de una prueba de la reserva ovárica para decidir la dosis de estimulación en general no tuvo mucho efecto sobre las probabilidades de quedar embarazada y tener un recién nacido, pero podría haber habido una diferencia relativamente pequeña de una forma u otra. En general, pareció disminuir las probabilidades de presentar SHEO en comparación con administrarles a todas las pacientes la misma dosis de la medicación de estimulación, pero esta evidencia fue de calidad baja. Los resultados de esta revisión indican que si las probabilidades de nacidos vivos con una dosis estándar fueron del 26%, la probabilidad con una dosis según una prueba de la reserva ovárica sería del 24% al 30%, y que si las probabilidades de SHEO moderado a grave con una dosis estándar fueron del 2,5%, la probabilidad con una dosis según una prueba de la reserva ovárica sería del 0,8% al 2,5%.
Calidad de la evidencia
La calidad de la evidencia se consideró muy baja a moderada debido a las limitaciones en el diseño de los estudios (ya que los investigadores y las participantes a menudo supieron que tratamiento se asignó) y a la imprecisión estadística, ya que los estudios incluyeron a muy pocas pacientes para proporcionar resultados significativos para los criterios más importantes, como tener un recién nacido.
Authors' conclusions
Summary of findings
| ORT‐based algorithm compared to standard dose of FSH for women undergoing IVF/ICSI | ||||||
| Patient or population: women undergoing IVF/ICSI | ||||||
| Outcomes | Anticipated absolute effects* (95% CI) | Relative effect | № of participants | Certainty of the evidence | Evidence summary | |
| Risk with 150 IU FSH | Risk with ORT‐based algorithm | |||||
| Live birth or ongoing pregnancy | 258 per 1000 | 266 per 1000 | OR 1.04 | 2823 | ⊕⊕⊕⊝ | Although the effect estimate remains imprecise, the pooled evidence suggests it is unlikely that ORT‐algorithms impacted on rates of live birth or ongoing pregnancy |
| OHSS | Severe 8 per 1000 | 4 per 1000 | OR 0.54 | 1494 | ⊕⊕⊝⊝ | Although the effect estimate remains imprecise, the pooled evidence suggests that ORT‐algorithms reduce the incidence of OHSS by an unspecified amount. |
| Moderate or severe 25 per 1000 | 14 per 1000 | OR 0.58 | 2823 | |||
| Clinical pregnancy | 321 per 1000 | 313 per 1000 | OR 0.96 | 2823 | ⊕⊕⊕⊝ | Although the effect estimate remains imprecise, the pooled evidence suggests it is unlikely that ORT algorithms impacted on rates of clinical pregnancy |
| *The risk in the intervention group (and its 95% confidence interval) is based on the assumed risk in the comparison group and the relative effect of the intervention (and its 95% CI). | ||||||
| GRADE Working Group grades of evidence | ||||||
| aDowngraded one level for serious risk of bias, associated mainly with performance bias due to lack of blinding and/or selective reporting. | ||||||
| Anticipated low responders: higher compared to lower dose of FSH for women undergoing IVF/ICSI | ||||||
| Patient or population: women undergoing IVF/ICSI who are anticipated to have a low‐response to stimulation based on one or more ORT measure | ||||||
| Outcomes | Anticipated absolute effects* (95% CI) | Relative effect | № of participants | Certainty of the evidence | Evidence summary | |
| Risk with lower dose | Risk with higher dose | |||||
| Live birth or ongoing pregnancy | ||||||
| 300/450 IU vs 150 IU | 109 per 1000 | 80 per 1000 | OR 0.71 (0.32 to 1.58) | 286 | ⊕⊕⊝⊝ | It was difficult to determine whether the different doses impacted on rates of live birth or ongoing pregnancy, therefore there is no evidence to suggest increased dosing in low responders is beneficial. |
| 400/450 IU vs 300 IU | 161 per 1000 | 129 per 1000 | OR 0.77 (0.19 to 3.19) | 62 | ||
| 600 IU vs 450 IU | 108 per 1000 | 139 per 1000 | OR 1.33 | 356 | ||
| Ovarian hyperstimulation syndrome (OHSS) | ||||||
| 300/450 IU vs 150 IU | Severe 0 per 1000 | 0 per 1000 | Not estimable | 286 | ⊕⊝⊝⊝ | It was not possible to determine whether the different doses impacted on rates of OHSS, as the event rates were too low. |
| Moderate or severe 0 per 1000 | 0 per 1000 | Not estimable | 286 | |||
| 400/450 IU vs 300 IU | Severe 0 per 1000 | 0 per 1000 | Not estimable | 62 | ||
| Moderate or severe 0 per 1000 | 0 per 1000 | Not estimable | 62 | |||
| 600 IU vs 450 IU | Severe 0 per 1000 | 0 per 1000 | Not estimable | 356 | ||
| Moderate or severe 0 per 1000 | 0 per 1000 | OR 7.23 | 356 | |||
| Clinical pregnancy | ||||||
| 300/450 IU vs 150 IU | 184 per 1000 | 101 per 1000 | OR 0.50 | 286 | ⊕⊕⊝⊝ | It was difficult to determine whether the dose differences impacted on rates of clinical pregnancy, therefore there is no evidence to suggest increased dosing in low responders is beneficial, and it may even be detrimental compared to a dose of 150 IU. |
| 400/450 IU vs 300 IU | 127 per 1000 | 109 per 1000 | OR 0.84 | 110 | ||
| 600 IU vs 450 IU | 159 per 1000 | 177 per 1000 | OR 1.14 | 356 | ||
| *The risk in the intervention group (and its 95% confidence interval) is based on the assumed risk in the comparison group and the relative effect of the intervention (and its 95% CI). | ||||||
| GRADE Working Group grades of evidence | ||||||
| aDowngraded one level for serious risk of bias associated mainly with performance bias due to lack of blinding and/or selective reporting. | ||||||
| Anticipated normal responders: higher compared to lower dose of FSH for women undergoing IVF/ICSI | ||||||
| Patient or population: women undergoing IVF/ICSI who are anticipated to have a normal response to stimulation based on at least one ORT measure | ||||||
| Comparison | Anticipated absolute effects* (95% CI) | Relative effect | № of participants | Certainty of the evidence | Evidence summary | |
| Risk with lower dose | Risk with higher dose | |||||
| Outcome:live birth or ongoing pregnancy | ||||||
| 200 IU vs 100 IU | 204 per 1000 | 184 per 1000 | OR 0.88 | 522 | ⊕⊕⊝⊝ | It was difficult to determine whether the dose differences impacted on rates of live birth or ongoing pregnancy, therefore there is no evidence to suggest increased dosing in normal responders is beneficial. |
| 225/200 IU vs 150 IU | 193 per 1000 | 198 per 1000 | OR 1.03 | 277 | ||
| 300 IU vs 225 IU | 397 per 1000 | 300 per 1000 | OR 0.65 | 135 | ||
| Outcome:ovarian hyperstimulation syndrome (OHSS) | ||||||
| 200 IU vs 100 IU | Severe 4 per 1000 | 1 per 1000 | OR 0.14 (0.00 to 6.96) | 522 | ⊕⊝⊝⊝ | It was impossible to determine whether the dose differences impacted on rates of OHSS |
| Moderate or severe 31 per 1000 | 19 per 1000 | OR 0.62 (0.21 to 1.87) | 522 | |||
| 225/200 IU vs 150 IU | Severe 8 per 1000 | 8 per 1000 | OR 1.00 | 740 | ||
| Moderate or severe 27 per 1000 | 32 per 1000 | OR 1.21 | 740 | |||
| 300 IU vs 225 IU | Severe 15 per 1000 | 2 per 1000 | OR 0.14 (0.00 to 6.92) | 135 (1 RCT) | ||
| Moderate or severe 44 per 1000 | 30 per 1000 | OR 0.67 | 135 | |||
| Outcome:clinical pregnancy | ||||||
| 200 IU vs 100 IU | 202 per 1000 | 179 per 1000 | OR 0.86 (0.73 to 1.31) | 330 (1 RCT) | ⊕⊕⊝⊝ | It was difficult to determine whether the dose differences impacted on rates of clinical pregnancy, therefore there is no evidence to suggest increased dosing in normal responders is beneficial. |
| 225/200 IU vs 150 IU | 236 per 1000 | 232 per 1000 | OR 0.98 | 1037 | ||
| 300 IU vs 225 IU | 441 per 1000 | 418 per 1000 | OR 0.91 | 135 | ||
| *The risk in the intervention group (and its 95% confidence interval) is based on the assumed risk in the comparison group and the relative effect of the intervention (and its 95% CI). | ||||||
| GRADE Working Group grades of evidence | ||||||
| aDowngraded one level for serious risk of bias associated mainly with performance bias due to lack of blinding and/or selective reporting and/or selection bias due to unclear methods of randomisation. | ||||||
| Anticipated high responders: higher compared to lower dose of FSH for women undergoing IVF/ICSI | ||||||
| Patient or population: women undergoing IVF/ICSI who are anticipated to have a hyper‐response to stimulation based on at least one ORT measure | ||||||
| Comparison | Anticipated absolute effects* (95% CI) | Relative effect | № of participants | Certainty of the evidence | Evidence summary | |
| Risk with lower dose | Risk with higher dose | |||||
| Outcome:live birth or ongoing pregnancy | ||||||
| 150 IU vs 100 IU | 255 per 1000 | 251 per 1000 | OR 0.98 | 521 (1 RCT) | ⊕⊕⊝⊝ | It was difficult to determine whether the dose differences impacted on rates of live birth or ongoing pregnancy, therefore there is no evidence to suggest increased dosing in hyper responders is beneficial |
| Outcome:ovarian hyperstimulation syndrome (OHSS) | ||||||
| 150 IU vs 100 IU | Severe 16 per 1000 | 11 per 1000 | OR 0.72 | 521 (1 RCT) | ⊕⊝⊝⊝ | It was not possible to definitively say whether dose differences impacted on rates of OHSS, but there could be a reduction with lower doses. |
| Moderate or severe 16 per 1000 | 36 per 1000 | OR 2.31 | 521 (1 RCT) | |||
| Outcome:clinical pregnancy | ||||||
| 150 IU vs 100 IU | 275 per 1000 | 301 per 1000 | OR 1.14 | 521 (1 RCT) | ⊕⊕⊝⊝ | It was difficult to determine whether the dose differences impacted on rates of clinical pregnancy, therefore there is no evidence to suggest increased dosing in hyper responders is beneficial. |
| *The risk in the intervention group (and its 95% confidence interval) is based on the assumed risk in the comparison group and the relative effect of the intervention (and its 95% CI). | ||||||
| GRADE Working Group grades of evidence | ||||||
| aDowngraded one level for serious risk of bias associated mainly with performance bias due to lack of blinding and/or selective reporting. | ||||||
Background
Description of the condition
As many as 15% of couples experience difficulties getting pregnant and are defined as being subfertile (Thoma 2013). Treatments are available to help these couples conceive, such as intrauterine insemination, ovulation induction, in vitro fertilisation (IVF), and intracytoplasmic sperm injection (ICSI). IVF, with or without ICSI (referred to as IVF/ICSI when used together), is the leading treatment for most causes of infertility; however, the success rate remains modest at approximately 15% to 20% per cycle started and 30% per cumulative cycle (including fresh and all frozen embryo transfers) (Dyer 2016; Gunby 2010; Toftager 2017).
During an IVF/ICSI cycle, daily doses of the gonadotropin follicle‐stimulating hormone (FSH) are used to induce multifollicular development in the ovaries. Generally the number of eggs retrieved depends on the dose of FSH; however, individual women's responses vary (Andersen 2006; Sunkara 2011). A low or poor ovarian response has been classified as the retrieval of three or fewer oocytes (Ferraretti 2011), and it often results in cycle cancellation, poor outcomes, and consequent stress and disappointment to the couple. The prevalence of poor response increases with age: approximately 10% to 15% of women aged 35 to 40 experience a poor response (Ferraretti 2011). Conversely, a hyper‐response (or high response) is often defined as the retrieval of 15 to 20 or more oocytes and is associated with an exponential increase in the risk of ovarian hyperstimulation syndrome (OHSS) (Steward 2014; Youssef 2016). The incidence of OHSS is difficult to determine as there is no strict consensus definition (ASRM 2016). Historically, mild and moderate forms of OHSS were reasonably common, occurring in approximately 0% to 30% and 3% to 6% of cycles, respectively (Delvigne 2002). Severe OHSS is much less common but has potential to cause thromboembolic phenomena, multiple organ failure and even death (Delvigne 2002). More recent estimates of the incidence of moderate OHSS range from 0.6% to 5% per IVF/ICSI cycle (ASRM 2016; Calhaz‐Jorge 2016; Kawwass 2015). Estimates of the rate of hospitalisation due to severe OHSS range from less than 0.01% to 0.3% of cycles (Kupka 2014; Harris 2016). This rate increases with the number of oocytes retrieved, reaching 4% with the retrieval of over 20 oocytes (Harris 2016).
The aim of most IVF cycles is to produce an embryo that leads to the live birth of a baby. Most specialists consider that obtaining a number of high‐quality oocytes is an important step in this process and that the number of retrieved oocytes depends on many patient and treatment factors, two of which are the dose of FSH administered and the size of the pool of recruitable follicles. Up to certain limits, an increase in the FSH dose may increase the number of growing follicles and the resulting oocyte yields (Broer 2013b). As a consequence, the use of a very low dose of FSH may increase the risk of poor response. Conversely, a very high dose of FSH may increase the risk of hyper‐response (in women with sufficient ovarian reserve). Although the retrieval of 5 to 15 eggs is correlated with the best chance of pregnancy and live birth (Sunkara 2011), it does not (necessarily) follow that increasing the FSH dose in order to obtain more eggs, for example in women with a previous or predicted poor response, will increase the probability of pregnancy for an individual woman.
Description of the intervention
Clinicians may use a test of a woman's ovarian reserve to select the starting FSH dose for ovarian stimulation (Fauser 2017). This is done to reduce the variation in ovarian response. In general, this means administering higher doses to women with a low ovarian reserve test (ORT) result and lower doses to women with a high ORT result. Multifactorial dose‐selection algorithms have also been developed, combining one or more ORT results with other patient characteristics such as age (La Marca 2012).
The oldest ovarian reserve test (ORT) is basal FSH (bFSH), measured in serum in the early follicular phase of a menstrual cycle. This was later supplemented by the antral follicular count (AFC) and more recently with anti‐Müllerian hormone (AMH). AFC is measured by ultrasound and is a count of the number of antral follicles measuring about 2 mm to 10 mm (according to standard criteria) that are available in both ovaries (Broekmans 2010). It indicates the number of gonadotrophin‐sensitive follicles available for stimulation in an IVF cycle. AMH is a protein expressed and secreted by the granulosa cells of the ovary and reflects the size of antral and pre‐antral follicles (Visser 2006). AMH can be measured in serum and is a more direct and independent measure of the growing pre‐antral and antral follicular pool (Seifer 2002; Van Rooij 2002).
How the intervention might work
ORT‐based individualisation of the FSH dose requires two components. First, there must be an ORT that can predict a woman's response when given a particular dose of FSH. Second, there must be a dose‐response relationship between FSH and ovarian response, enabling manipulation of the response through adjustment of the dose administered.
In relation to the first component (prediction of response), diagnostic test studies have reported that ORT can be used to predict ovarian response to stimulation, with AMH and AFC being superior to bFSH (Broekmans 2006; Broer 2013a; Broer 2013b; Broer 2014; La Marca 2014). One meta‐analysis of individual patient data found that for predicting excessive response, AMH and AFC showed similarly high performance (areas under the receiver operator characteristic curves (AUC) of 0.81 and 0.79, respectively) (Broer 2013a). However, bFSH had lower predictive value (AUC of 0.66). Predictive performance was improved by combining AMH and AFC (AUC 0.85). A second meta‐analysis showed that AFC and AMH as single tests both had high predictive value for poor response (AUC 0.78 and 0.76, respectively) and that combining these two tests did not substantially improve prediction (AUC 0.80, P = 0.19) (Broer 2013b).
In relation to the second component (dose‐response relationship), a recent study indicated that increasing the dose of FSH increases oocyte yield in women with AMH between 5 pmol/L and 50 pmol/L (Arce 2014). For example, women who receive higher FSH doses will produce more follicles than those receiving lower FSH doses. However, the capacity to manipulate a woman's ovarian response may largely depend on her ovarian reserve. In particular, if a woman has relatively few antral follicles (and consequently is predicted to have a low ovarian response), then it may not be possible to compensate for this fact by increasing the FSH dose (Klinkert 2005; Lekamge 2008). It is important to remember that the relationship between the stimulation response and probability of pregnancy is poorly understood, so the use of surrogate outcomes such as number of eggs retrieved does not necessarily reveal the effects on pregnancy and live birth (Vail 2003). In fact, the above‐mentioned individual patient data analysis found that ORTs did not improve prediction of ongoing pregnancy following IVF more than age alone (Broer 2013b).
Why it is important to do this review
IVF/ICSI is expensive and invasive, and it requires extensive clinical monitoring. Those desiring a pregnancy often have to make a substantial financial investment, including time away from work, and the process is associated with a high emotional burden. If tailoring the dose of FSH can increase the likelihood of an appropriate response, it has the potential to increase pregnancy and live birth while reducing cancelled cycles (for either poor or hyper‐response) and OHSS. Individualised FSH dosing also has the potential to be more cost‐effective. On the other hand, an individualised approach to FSH dosing may be associated with greater cost in terms of price of FSH medication (if increased dose is recommended), cost of ORT testing itself, and increased administrative burden and complexity in monitoring of IVF cycles. However, there is no up‐to‐date review of the relevant literature.
Objectives
To assess the effects of individualised gonadotropin dose selection using markers of ovarian reserve in women undergoing IVF/ICSI.
Methods
Criteria for considering studies for this review
Types of studies
Published and unpublished randomized controlled trials (RCTs) were eligible for inclusion. We excluded non‐randomised and quasi‐randomised studies (e.g. studies with evidence of inadequate sequence generation such as allocation by alternate days or patient numbers), as they are associated with a high risk of bias (Higgins 2011). We did not use data from ongoing studies but will incorporate their results in future updates of the review. Cross‐over trials would have been eligible, but as cross‐over is not a valid design in the context of fertility trials, we would have considered only data from the first phase in meta‐analyses.
Several trial designs are appropriate to the broad goal of investigating aspects of individualised FSH (Tajik 2013). Broadly, the two types of design included in this review are:
-
direct dose comparison studies, randomising women within a given ORT range to one of several doses of FSH; and
-
ORT‐algorithm studies, randomising women either to dose selection according to their ORT value using an algorithm, or to dose selection without ORT or using an alternative algorithm.
The first type of design (direct dose comparison studies) allocates women of a given ORT profile to one of two (or more) doses of FSH, in order to compare the responses of similar women under each of the doses. An example would be a trial of women with low AMH (predicted low responders) who are randomized to two different doses of FSH (e.g. 150 international units (IU) vs 300 IU). This type of design is useful for establishing whether there is a dose‐response relationship between FSH and outcome in subgroups of women, or for identifying the optimal FSH dose for women with a given set of predictive characteristics. This design is able to tell us whether certain groups of women would benefit from a particular FSH dose (Tajik 2013). We will use the terms low and high responders to refer to the predicted response of women, and the terms poor and hyper‐response to refer to the observed response of women to ovarian stimulation, usually measured by the number of oocytes retrieved.
The second type of design (ORT‐algorithm studies) randomises women either to FSH dose selection determined by an algorithm including ORT, or to a standard FSH dose (i.e. for all women regardless of their ORT). In this design, all women in the control arm receive the same dose of FSH, and women in the intervention arm receive different doses of FSH according to their individual characteristics, such as AMH level. A variant of this type of design randomises women to one of two (or more) individualised dose‐selection algorithms/policies, where the comparator algorithms may or may not include ORT. The purpose of designs of this type is to compare an ORT‐individualised dose‐selection algorithm versus either a uniform dose or alternative dose‐selection policy.
We included studies of both design types in separate comparisons in this review. Sometimes, trials were not explicitly presented as falling into one of the above types of design, but nonetheless it was possible to interpret and analyze them in such a way that they were equivalent. In these cases, the trials were eligible for this review.
Types of participants
Direct dose comparison studies
For these studies to be eligible, the study population had to be women undergoing IVF/ICSI, categorised as either predicted low, normal or high responders based on at least one ORT (AMH, bFSH, or AFC) (or providing data that enabled categorisation by review authors). Studies including unselected populations were not eligible unless we could obtain data from eligible subgroups within the studies.
ORT‐algorithm studies
Studies of this type had to include a (possibly unselected) population of women undergoing IVF/ICSI.
Studies in women who did not plan to undergo embryo transfer, for example women planning oocyte donation or fertility preservation, or who were receiving donated oocytes, were excluded. We excluded studies including only women with polycystic ovarian syndrome (PCOS), which represents a distinct clinical entity and likely warrant unique individualised dosing algorithms. We included studies including only some women with PCOS and attempted to obtain the data excluding them. There were no exclusion criteria related to age, cause of infertility, or previous IVF/ICSI exposure.
Types of interventions
Included interventions
Studies comparing ovarian stimulation doses with each other (direct dose comparison studies) or comparing ORT‐based FSH dose individualisation versus an alternative dosing policy (ORT‐algorithm studies) were eligible for inclusion. Eligible individualised policies include those where the dose was selected, at least in part, using the woman's ORT measure (e.g. AMH, AFC, bFSH). We also included policies of dose selection on the basis of combinations of characteristics, provided one or more ORTs were amongst the considered factors. Studies comparing doses of human menopausal gonadotropin (HMG), which contains both FSH and luteinising hormone, were also eligible.
Additionally, we included ORT‐algorithm studies comparing different preparations and brands, provided that the dose‐selection algorithm varied between study arms. This reflected the more pragmatic nature of the questions being answered by these designs. Studies that allowed dose adjustment following a certain number of days of administration of the randomized dose were eligible as long as that adjustment was permitted in both study arms. This was subject to sensitivity analysis.
Excluded interventions
For direct dose comparison studies, we excluded studies comparing different preparations, brands, or routes of administration, since treatment effects in these studies might not be attributable to differences in dose.
We excluded:
-
studies comparing HMG to pure FSH preparations;
-
studies using medications other than gonadotropins, such as clomiphene citrate or letrozole;
-
studies comparing doses of corifollitropin alfa;
-
studies comparing step‐up/step‐down protocols, or protocols amending the FSH dose in only one arm after commencing stimulation, for example coasting or withholding FSH for a number of days; and
-
studies comparing different stimulation regimens (for example, GnRH agonist versus GnRH antagonist).
Types of outcome measures
Primary outcomes
-
Live birth or ongoing pregnancy. Ongoing pregnancy was defined as evidence of a gestational sac with fetal heart motion at or after twelve weeks' gestation, confirmed with ultrasound (Harbin Consensus Workshop Group 2014). Ongoing pregnancy data were only used when live birth data were not available. In the event that studies included multiple cycles for an individual woman, we also reported cumulative live birth. If studies reported the live birth outcome of the fresh transfer and the first frozen transfer for women with freeze‐all cycles, we also reported this outcome separately. We counted multiple live births (e.g. twins or triplets) as one live birth event.
-
Severe ovarian hyperstimulation syndrome (OHSS) (as defined by authors).
Secondary outcomes
-
Clinical pregnancy, defined as evidence of an intrauterine gestational sac on ultrasound or other definitive signs of pregnancy, including ectopic pregnancy.
-
Time to clinical pregnancy.
-
Moderate or severe OHSS (as defined by study authors).
-
Multiple pregnancy in randomized women.
-
Multiple pregnancy in women with clinical pregnancy, noting that this does not reflect a randomized comparison.
-
Number of oocytes retrieved per woman randomized.
-
Poor response to stimulation (as defined and prespecified by trial authors).
-
Normal response to stimulation (as defined and prespecified by trial authors).
-
Hyper‐response to stimulation (as defined and prespecified by trial authors).
-
Cycle cancellations for hyper‐response (including freeze‐all cycles).
-
Cycle cancellations for poor response.
-
Cycle cancellations for poor or hyper‐response.
-
Women with at least one transferable embryo.
-
Total dose of FSH.
-
Duration of FSH administration.
-
Cost per woman randomized.
-
Cumulative live birth rate.
Search methods for identification of studies
We searched for all published and unpublished RCTs that met our inclusion criteria, without language or date restriction and in consultation with the Cochrane Gynaecology and Fertility Group (CGF) Information Specialist.
Electronic searches
We searched the following electronic databases, trial registers and websites in November 2016 and on the 27th July 2017.
-
The Gynaecology and Fertility Group (CGF) Specialised Register of Controlled Trials (searched 27th July 2017) (Appendix 1).
-
The Cochrane Central Register of Studies Online (CRSO) (searched 27th July 2017) (Appendix 2).
-
MEDLINE (from 1946 to 27th July 2017) (Appendix 3).
-
Embase (from 1980 to 27th July 2017) (Appendix 4).
-
CINAHL (from 1961 to 27th July 2017) (Appendix 5).
We combined the MEDLINE search with the Cochrane highly sensitive search strategy for identifying randomized trials, described in section 6.4.11 of the Cochrane Handbook of Systematic Reviews of Interventions (Higgins 2011). We combined the Embase and CINAHL searches with trial filters developed by the Scottish Intercollegiate Guidelines Network (SIGN) (www.sign.ac.uk/methodology/filters.html#random).
We searched other electronic sources of trials from their inception to 27th July 2017.
-
Trial registers for ongoing and registered trials: www.clinicaltrials.gov (a service of the US National Institutes of Health) and www.who.int/trialsearch/Default.aspx (the World Health Organisation International Trials Registry Platform search portal).
-
DARE (Database of Abstracts of Reviews of Effects) on the Cochrane Library: onlinelibrary.wiley.com/o/cochrane/cochrane_cldare_articles_fs.html (for reference lists from relevant non‐Cochrane reviews);
-
The Web of Knowledge: wokinfo.com/ (another source of trials and conference abstracts).
-
OpenGrey: www.opengrey.eu/ for unpublished literature from Europe.
-
LILACS database: regional.bvsalud.org/php/index.php?lang=en.
-
PubMed and Google Scholar (for recent trials not yet indexed in the major databases).
We detail the search strategies used in the Appendices.
Searching other resources
We handsearched reference lists of articles retrieved by the search and contacted experts in the field to obtain additional data. We also handsearched relevant journals and conference abstracts that were not covered in the CGF register, in liaison with the Information Specialist.
Data collection and analysis
Selection of studies
After an initial screen of titles and abstracts retrieved by the search, we retrieved the full texts of all potentially eligible studies. Two review authors independently examined these full‐text articles for compliance with the inclusion criteria and selected studies eligible for inclusion in the review. We corresponded with study investigators as required to clarify study eligibility. We resolved disagreements as to study eligibility by discussion or by involving a third review author. We documented the selection process with a PRISMA flow chart.
Data extraction and management
Two review authors independently extracted data from eligible studies using a data extraction form designed and pilot‐tested by the authors. We resolved any disagreements by discussion or by involving a third review author. Data extracted included study characteristics and outcome data. Where studies had multiple publications, we collated the multiple reports; the study rather than the report was the unit of interest in the review. Studies with multiple reports had a single study ID with multiple references.
We corresponded with study investigators for further information on methods, results or both, as required.
Assessment of risk of bias in included studies
Two review authors independently assessed the included studies for risk of bias using the Cochrane 'Risk of bias' assessment tool, which considers bias arising from: selection (random sequence generation and allocation concealment), performance (blinding of participants and personnel), detection (blinding of outcome assessors), attrition (incomplete outcome data), reporting (selective reporting), and other causes (Higgins 2011). We resolved any disagreements by discussion or by involving a third review author. We described all judgements fully and presented the conclusions in the 'Risk of bias' table, which we incorporated into the interpretation of the review findings both qualitatively and formally, by means of sensitivity analyses. Where identified studies failed to report the primary outcome of live birth but did report interim outcomes such as pregnancy, we undertook informal assessment as to whether the interim values (e.g. pregnancy rates) were similar to those reported in studies that also reported live birth.
We considered the following methods of random sequence generation adequate.
-
Referring to a random number table.
-
Using a computer random number generator.
-
Coin tossing.
-
Shuffling cards or envelopes.
-
Throwing dice.
-
Drawing of lots.
We considered it insufficient to state that the study was 'randomized' and rated these studies at unclear risk of bias.
We considered the following methods of allocation concealment adequate.
-
Central allocation (including telephone, Internet‐based and pharmacy‐controlled randomization).
-
Sequentially numbered, opaque, sealed envelopes (SNOSE).
We considered blinding of participants and personnel to carry a low risk of bias if there was a description of adequate blinding measures, for example administering doses that were identical in appearance. There was potential for performance bias, as some methods and outcomes were not strictly objective, such as cycle cancellation for poor or hyper‐response, number of eggs collected, embryo selection for embryo transfer, decision to freeze all embryos, etc. Additionally, in trials that allowed dose adjustment during stimulation, there was potential for performance bias, so we considered the risk to be high in these cases.
We considered the domain 'Blinding of outcome assessors' to be relevant only for OHSS outcomes, and we rated it as low risk for other outcome variables. This is because diagnosis and classification of OHSS can be subjective. For OHSS outcomes, we rated the domain as being at low risk of bias if there was some description of adequate blinding measures. For example, if the text stated that diagnosis of OHSS was done by a clinician not involved in the trial, we rated the risk of bias as low for this domain.
We considered studies with a loss to follow‐up of 15% or more as being at high risk of attrition bias. This cutoff is arbitrary, but there is value in prespecifying a criterion in order to reduce post hoc decisions.
We considered studies that had collected more outcome measures than were reported in the paper as being at high risk of reporting bias. It was often difficult to determine which outcomes they measured unless a study protocol was available. Therefore, in the absence of a protocol, we might have rated the risk of bias as unclear. However, if a study reported all expected outcomes, we assigned a low risk rating.
Measures of treatment effect
For dichotomous data (e.g. live birth rates), we used the numbers of events in the control and intervention groups of each study to calculate Mantel‐Haenszel odds ratios (ORs). If event rates in a particular analysis were low, however, we preferred Peto's method (e.g. multiple pregnancy and OHSS). For continuous data (e.g. total dose of FSH), if all studies reported exactly the same outcomes we calculated the mean difference (MD) between treatment groups. Had studies reported time‐to‐event data, we would have used hazard ratios (HRs) as the measure of treatment effect.
We reversed the direction of effect of individual studies to ensure consistency across trials (for example, in direct dose comparison studies, consistently ordering the higher and lower doses). We presented 95% confidence intervals (CIs) for all outcomes. Where data to calculate ORs or MDs were not available, we utilized the data available to proceed with the most reasonable analysis available (e.g. test statistics, P values). We emphasised the magnitude, precision, and direction of effects rather than relying on arbitrary and uninformative standards of statistical significance.
Unit of analysis issues
We performed the primary analysis with the denominator of randomized women; we also included per pregnancy data for the outcome of multiple pregnancy, as this better reflects the proportion of pregnancies that were multiple, but readers should interpret these results with caution, as they do not represent a randomized comparison. For time to clinical pregnancy, we had anticipated that the unit of time in the analysis would have been the cycle; however, no study reported this outcome (two trials reported time to ongoing pregnancy only: Oudshoorn 2017; Van Tilborg 2017). We summarized in narrative data that did not allow valid analyses. Where studies followed up women over multiple treatment cycles, we included 'cumulative' birth events in the numerator as a separate outcome.
Dealing with missing data
For all outcomes, we carried out analyses on an intention‐to‐treat basis as far as possible, that is, we attempted to analyze all participants in the group to which they were randomized, regardless of whether or not they received the allocated intervention. The denominator for each outcome was the number randomized, except for the outcome 'multiple pregnancy in women with clinical pregnancy'. In relation to the primary outcome live birth, we assumed that those who dropped out of the study did not have a successful treatment outcome. When necessary, we contacted the authors of included studies to obtain missing data.
Additional statistical analyses were required for an intention‐to‐treat analysis of the outcome 'number of oocytes'. It was common for studies to exclude cycles cancelled when reporting this outcome. This is akin to active censoring, which violates the randomization in the study and biases the estimated treatment effect. In these cases, we recalculated the mean numbers of oocytes including all randomized participants by setting the values for participants with cancelled cycles to zero and including these women in the divisor. We also had to impute the corresponding standard deviations, which would be larger than those calculated using only uncensored patients. On the basis of simulations, we determined that adding half the difference between the reported and the new mean to the reported standard deviation produced a suitably adjusted estimate. This amounted to a small adjustment (less than one oocyte). These imputed standard deviations have the disadvantage of probably being wrong, but the advantage of being an improvement over the reported values. For one study (Tasker 2010), individual patient data were available, allowing us to conduct multiple imputation for any cancelled cycles. Some studies reported the median rather than the mean number of oocytes. Because the distribution of numbers of oocytes is skewed, we imputed the mean by adding one to the median. This small adjustment was deemed to be appropriate on the basis of analyses conducted using the Tasker 2010 data. Finally, the skewed distribution meant that meta‐analysis based on an assumption of a normal distribution was not appropriate. Accordingly, we adopted a method for the meta‐analysis of skewed data (method 1 in Higgins 2008). Briefly, this involves approximating the difference in log scale means and a corresponding standard error, based on the summary data available. These were synthesised using the generic inverse variance functionality in RevMan. For these reasons, the mean differences reported here differ slightly from those in the papers.
Assessment of heterogeneity
We considered whether the clinical and methodological characteristics of the included studies were sufficiently similar for meta‐analysis to provide a clinically meaningful summary. We assessed statistical heterogeneity by the measure of the I2. We interpreted an I2 measurement greater than 50% as indicating substantial heterogeneity (Higgins 2003), although we acknowledge that this threshold is essentially arbitrary.
Assessment of reporting biases
In view of the difficulty of detecting and correcting for publication bias and other reporting biases, we aimed to minimise their potential impact by ensuring a comprehensive search for eligible studies and by being alert for duplication of data. If there had been 10 or more studies in an analysis, we would have used a funnel plot to explore the possibility of small study effects (a tendency for estimates of the intervention effect to be more beneficial in smaller studies).
Data synthesis
Although we had anticipated that the included studies would display considerable protocol heterogeneity, the data synthesis scheme we had proposed in the review protocol could not comfortably accommodate the variety of eligible direct dose comparison studies we identified in the search. Accordingly, we modified it, and the modified scheme we eventually used is described here (see also Differences between protocol and review).
For direct dose comparison studies (women with a given ORT measurement randomized to one of several doses), we considered the following comparisons.
-
Comparison 1. All pairwise dose comparisons tested in women predicted to have a low response on the basis of one or more ORT.
-
Comparison 2. All pairwise dose comparisons tested in women predicted to have a normal response on the basis of one or more ORT.
-
Comparison 3. All pairwise dose comparisons tested in women predicted to have a high response on the basis of one or more ORT.
We made a post hoc decision to pool studies within each predicted response category (low, normal, high) if they shared the same comparator dose (e.g. to pool a trial comparing 200 IU vs 150 IU with another trial comparing 300 IU vs 150 IU). We made this decision in the final stages of the review after observing that most of the included studies compared different dose sets. This pooling, to the extent that it is interpretable, answered a broader question of the data: compared to a dose of 150 IU, does a higher dose offer any benefit in women with predicted low‐response? Readers should consider these pooled comparisons as summaries of the studies, rather than as unified estimates of underlying treatment effects.
We used the following cutoffs to guide the categorisation of women as required based on categorisations used previously (e.g. Arce 2014; Jayaprakasan 2010; Oudshoorn 2017).
-
AMH < 7 pmol/L, AFC < 7, bFSH > 10 IU/L categorised as predicted low responders.
-
AMH 7 pmol/L to 21 pmol/L, AFC 7 to 15 categorised as predicted normal responders (bFSH is not considered to be reliable predictor for normal response).
-
AMH > 21 pmol/L, AFC > 15 categorised as predicted high responders (bFSH is not considered to be reliable predictor for hyper‐response).
We considered the ORT values of the cohorts in each study as a potential source of heterogeneity but determined that it would not be feasible to stratify the trials further on the basis of type of ORT.
In the review protocol, we noted that it was not possible to anticipate the combinations of study arms that would be compared in ORT‐algorithm studies. Accordingly, we modified the basic scheme we had proposed in the protocol to accommodate the eligible trials we found in the search (see Differences between protocol and review) and presented the modified scheme we used here.
For ORT‐algorithm studies (women randomized to either have a dose selected according to their ORT value using an algorithm, or to a uniform dose/dose selected using an alternative algorithm), we considered the following comparisons.
-
Comparison 4. ORT‐based dose selection algorithm for ovarian stimulation vs dose selection without ORT (including uniform dosing policies).
-
Comparison 5. ORT‐based dose selection algorithm for ovarian stimulation vs alternative ORT‐based dose selection algorithm.
Within comparison 4, we stratified the trials according to the comparator arm and did not consider it to be meaningful to pool across strata. Specifically, we deemed it appropriate to pool studies comparing ORT‐based algorithms to a uniform dose if that dose was the same in the different studies. We did not pool studies with non‐ORT dose selection algorithms as comparator interventions with the studies with uniform dose control groups, however. We would stress that pooled estimates derived from comparison 4 should be considered as summaries of the effects estimated in the included studies, rather than an estimate of a distinct underlying treatment effect.
The trials included in comparison 5 each made a unique comparison between ORT‐based algorithms, and we did not consider it appropriate to pool these studies.
Any increase in the odds of a particular outcome under a higher dose (for direct dose comparison studies) or under an ORT‐based algorithm (ORT‐algorithm studies), regardless of whether it was beneficial (e.g. live birth) or detrimental (e.g. adverse effects), was displayed graphically in the meta‐analyses to the right of the centre line. Any decrease in the odds of an outcome was displayed to the left. For comparison 5, comparing ORT‐based algorithms against one another, the decision of which algorithm to treat as the comparator and which to treat as the 'experimental' treatment was essentially arbitrary.
When trials reported outcomes for total dose of FSH and duration of FSH as medians, we treated these as means, assuming a symmetrical distribution; however, this assumption will be poor.
Subgroup analysis and investigation of heterogeneity
We intended to conduct subgroup analyses where at least one trial fitted within each subgroup, data were available and substantial heterogeneity existed, to determine the separate evidence within the following subgroups for primary outcomes only.
-
Predicted response category (e.g. high responders, normal responders, low responders). The stratification of women into predicted response categories was already a feature of our analysis plan for direct dose comparison studies. However, we intended to consider the evidence, where available, for subgroups determined by predicted response category in ORT‐algorithm studies.
-
Age (less than 35 years, 35 to 40 years, more than 40 years)
-
IVF protocol type (e.g. long GnRH agonist, short GnRH agonist (or 'Flare'), antagonist)
Where we detected substantial heterogeneity, we explored possible explanations in sensitivity analyses. We incorporated statistical heterogeneity into our interpretation of results, paying particular attention to any variation in the direction of effect.
Sensitivity analysis
We planned to conduct sensitivity analyses for the primary outcomes to determine whether the conclusions were robust to arbitrary decisions made regarding the eligibility and analysis. These analyses included consideration of whether the review conclusions would have differed if:
-
eligibility had been restricted to studies at low risk of bias (defined as studies rated as being at low risk of bias with respect to sequence generation and allocation concealment, and not rated as at high risk of bias in any of the domains assessed);
-
a random‐effects model had been adopted;
-
ongoing pregnancy data were not combined with live birth data; or
-
studies that allowed dose adjustment.
Summary of findings table
We prepared 'Summary of findings' tables using GRADEpro software and Cochrane methods (GRADEpro GDT 2014; Higgins 2011). These tables evaluated the overall quality of the body of evidence for the main review outcomes (live birth or ongoing pregnancy, OHSS, clinical pregnancy) in each of the main comparisons of the review, using GRADE criteria. There was one comparison for each patient subgroup in the direct dose comparison studies (predicted low responders, normal responders, high responders) and a further comparison for use of ORT‐based algorithms versus dosing without ORT. GRADE criteria relate to study limitations (i.e. risk of bias), inconsistency of effect, imprecision, indirectness and publication bias. Two review authors independently made judgements on evidence quality (high, moderate, low, or very low), resolving disagreements by discussion. We justified, documented, and incorporated these judgements into the reporting of results for each outcome.
We extracted study data, formatted our comparisons in data tables and prepared a 'Summary of findings' table before writing the results and conclusions of the review.
Results
Description of studies
Results of the search
Our searches yielded 2422 unique articles (Figure 1). We excluded 2381 records based on screening the title and abstract and retrieved the full text of 41 records for more detailed assessment. We excluded 21 articles, mostly because they did not meet review criteria. Among the trials excluded from the review were six ongoing studies, whose status trial investigators confirmed in four cases (EUCT2012‐004969‐40; NCT02430740; NCT02739269; Singh 2015). We were unable to contact the investigators of NCT01794208 or to ascertain the status of CTRI/2016/10/007367 from the investigators.

Study flow diagram.
We included 20 studies in the review, including 3 that we essentially treat as multiple trials for the purposes of this review (Arce 2014; Harrison 2001; Van Tilborg 2017). Most studies were published as full‐text articles; however, one study was available as an abstract only, and we obtained the individual participant data from the trialists to enable further data analysis (Tasker 2010).
Included studies
Study design and setting
We included 20 parallel‐design randomized controlled trials in the review. Seventeen studies had two arms (Allegra 2017; Bastu 2016; Cavagna 2006; Hoomans 2002; Jayaprakasan 2010; Klinkert 2005; Lan 2013; Lefebrve 2015; Magnusson 2017; Nyboe Andersen 2017; Olivennes 2015; Oudshoorn 2017; Out 2004; Popovic‐Todorovic 2003; Tan 2005; Tasker 2010; YongPYK 2003), two studies had four arms (Harrison 2001; Van Tilborg 2017), and one had five arms (Arce 2014). Two studies had additional trial arms that were not relevant and which we excluded from this review (Arce 2014; Bastu 2016).
Most studies took place in European countries, including Denmark (Popovic‐Todorovic 2003), Ireland (Harrison 2001), Italy (Allegra 2017), the Netherlands (Klinkert 2005; Oudshoorn 2017; Van Tilborg 2017), the UK (Jayaprakasan 2010; Out 2004; Tasker 2010; YongPYK 2003), and Sweden (Magnusson 2017). Three studies were conducted across multiple European countries (Arce 2014; Nyboe Andersen 2017; Olivennes 2015). Two studies took place in Canada (Lefebrve 2015; Tan 2005), and there was one study each from Brazil (Cavagna 2006), Turkey (Bastu 2016), and Vietnam (Lan 2013), along with one in multiple Asian countries (Hoomans 2002). Eleven studies took place in a single centre (Allegra 2017; Bastu 2016; Cavagna 2006; Harrison 2001; Jayaprakasan 2010; Klinkert 2005; Lan 2013; Lefebrve 2015; Magnusson 2017; Tasker 2010; YongPYK 2003), and nine were multicentre (Arce 2014; Hoomans 2002; Nyboe Andersen 2017; Olivennes 2015; Oudshoorn 2017; Out 2004; Popovic‐Todorovic 2003; Tan 2005; Van Tilborg 2017).
Two of the direct dose comparison studies were conducted in tandem as part of a wider cohort study (Oudshoorn 2017; Van Tilborg 2017). One of these studies is essentially treated as two separate trials for the purpose of this review under the same reference in different comparisons (Van Tilborg 2017). Further, these trials are all merged to produce one ORT‐algorithm study (Oudshoorn 2017).
Participants and interventions
All studies but Harrison 2001 had inclusion criteria based on age. Most studies used a long agonist protocol; however, four used an antagonist protocol (Arce 2014; Bastu 2016; Nyboe Andersen 2017; Out 2004), one used a microdose flare protocol (Lefebrve 2015), and two did not require the use of any specific stimulation protocol (Oudshoorn 2017; Van Tilborg 2017). Ten studies permitted dose adjustment during the stimulation phase (Allegra 2017; Harrison 2001; Klinkert 2005; Lan 2013; Magnusson 2017; Nyboe Andersen 2017; Olivennes 2015; Out 2004; Popovic‐Todorovic 2003; Tan 2005), while six studies did not permit adjustment for any reason (Arce 2014; Bastu 2016; Cavagna 2006; Hoomans 2002; Jayaprakasan 2010; Lefebrve 2015); in one study it was unclear (Tasker 2010). Two studies permitted dose‐adjustment only between IVF cycles (Oudshoorn 2017; Van Tilborg 2017), which is only relevant for the outcome of cumulative live birth rate reported in this study (over 18 months).
Direct dose comparison studies
All 13 direct dose comparison studies (including three studies that are used twice in different comparisons/subgroups) focused on a population defined as either predicted low, normal, or high responders based on at least one ORT measure (AMH, AFC or bFSH), or reported on at least one of these measures demographically (as per the review protocol). Five studies involved predicted low responders (Bastu 2016; Harrison 2001; Klinkert 2005; Lefebrve 2015; Van Tilborg 2017); nine studies, predicted normal responders (Arce 2014; Cavagna 2006; Harrison 2001; Hoomans 2002; Jayaprakasan 2010; Out 2004; Tan 2005; Van Tilborg 2017; YongPYK 2003); and two studies, predicted high responders (Arce 2014; Oudshoorn 2017). Of the ORTs, six used AMH to define their population or reported AMH as a demographic (Arce 2014; Bastu 2016; Jayaprakasan 2010; Lefebrve 2015; Oudshoorn 2017; Van Tilborg 2017), seven used or reported AFC (Arce 2014; Bastu 2016; Klinkert 2005; Jayaprakasan 2010; Lefebrve 2015; Oudshoorn 2017; Van Tilborg 2017), and all but two used or reported bFSH (Oudshoorn 2017; Van Tilborg 2017). There was significant variation in the thresholds and application of ORT as eligibility criteria. For example, some trials required participants to satisfy all ORT criteria to be eligible (e.g. Jayaprakasan 2010 required participants to have bFSH of less than 12 IU/L and AFC 8 to 21), and other trials permitted participants to satisfy at least one of a number of criteria (e.g. Bastu 2016 required participants to meet at least two of the three following criteria: age over 40 years, previous poor response, abnormal ORT measure).
Each of the five studies in low responders employed a separate comparison, and we pooled these as follows.
-
300/400 IU vs 150 IU: 300 IU vs 150 IU (Klinkert 2005), 450 IU vs 150 IU (Van Tilborg 2017).
-
400/450 IU vs 300 IU: 400 IU vs 300 IU (Harrison 2001), 450 IU vs 300 IU (Bastu 2016).
-
600 IU vs 450 IU: (Lefebrve 2015).
There were three separate pooled comparisons among the nine studies in predicted normal responders.
-
200 vs 100 IU (Hoomans 2002; Tan 2005).
-
225/200 IU vs 150 IU (Cavagna 2006; Harrison 2001; Out 2004; Van Tilborg 2017; YongPYK 2003).
-
300 vs 225 IU (Jayaprakasan 2010).
A five‐arm dosing study used a novel FSH (FE 999049), expressed in µg rather than IU, which is not directly translatable to IU. Therefore, we were unable to pool the data from this trial with the other studies and instead present the five dosing arms in separate forest plots for each outcome in incremental comparisons (i.e. 5.2 µg versus 6.9 µg, 6.9 µg versus 8.6 µg, 8.6 µg, versus 10.3 µg, 10.3 µg versus 12.1 µg).
The study with five arms also had a strata of women included in the comparison for predicted high responders (Arce 2014), along with a second study (Oudshoorn 2017). In total, the 13 direct dose comparison studies included 752 low responders, 1774 normal responders, and 618 high responders.
ORT‐algorithm studies
There were eight ORT‐algorithm studies included, which generally recruited women of a broader ORT spectrum. We merged the data from two of the direct dose comparison studies conducted in tandem as part of a wider cohort study, Oudshoorn 2017 and Van Tilborg 2017, and included them as one ORT‐algorithm study (Oudshoorn 2017). All eight studies used or reported AFC, all but two also used or reported AMH (Popovic‐Todorovic 2003; Oudshoorn 2017), and all but two also used bFSH (Magnusson 2017; Oudshoorn 2017).
Five studies compared an ORT‐based algorithm to a method that did not use any ORT, either a standard dose of 150 IU (Nyboe Andersen 2017; Olivennes 2015; Oudshoorn 2017; Popovic‐Todorovic 2003), or an algorithm not using ORT (Allegra 2017). In this latter study, the dose selection in the non‐ORT arm was based solely on age (women aged 35 years or less received 150 IU, those aged more than 35 years old received 225 IU). Three studies compared two different ORT‐based algorithms with each other. One study compared an AMH‐based algorithm versus an AFC‐based algorithm (Lan 2013), one study compared an AFC‐based algorithm versus an algorithm using both AFC and AMH (Magnusson 2017), and one study compared an algorithm based on a number of markers (age, bFSH, oestradiol, and polycystic ovaries status) versus an algorithm based on AMH and AFC in addition to the other markers (Tasker 2010). In total, the eight ORT‐algorithm studies included 3888 participants, 3017 of whom contributed to a comparison between an ORT‐algorithm and a non‐ORT method of dose selection, and 871 to a comparison of two different ORT‐based algorithms.
Excluded studies
We excluded 14 studies, 13 of which did not measure or report at least one of AMH, bFSH, AFC, and another that we discovered had been quasi‐randomised following author correspondence (Berkkanoglu 2010, Berkkanoglu 2017 [pers comm]) (Characteristics of excluded studies).
A further six studies are ongoing (Characteristics of ongoing studies), and one trial is awaiting assessment (Characteristics of studies awaiting classification).
Risk of bias in included studies
We assessed the risk of bias for each included trial (Characteristics of included studies). We present the results in the 'Risk of bias' summary and graph (Figure 2; Figure 3).

Risk of bias summary: review authors' judgements about each risk of bias item for each included study.

Risk of bias graph: review authors' judgements about each risk of bias item presented as percentages across all included studies.
Allocation
Nineteen studies were at low risk of selection bias related to sequence generation, as the studies used computer‐generated random numbers. Trialists of one study described it as 'randomized' only, and it was not possible to contact the study authors for further information, therefore we rated the risk of bias for this study as unclear (Cavagna 2006).
Eighteen studies were at low risk of bias allocation concealment, as the studies used SNOSE (Bastu 2016; Klinkert 2005; Lefebrve 2015; Tasker 2010; YongPYK 2003), employed a double‐blind design with patient numbers corresponding to boxes containing medication (Out 2004; Tan 2005), concealed allocation within an electronic randomization and case‐report system (Arce 2014; Jayaprakasan 2010; Magnusson 2017; Nyboe Andersen 2017; Olivennes 2015; Oudshoorn 2017; Van Tilborg 2017), or used third‐party randomization (Allegra 2017; Harrison 2001; Lan 2013; Popovic‐Todorovic 2003). We graded two studies as being at unclear risk, as we could not obtain any description of allocation concealment through author correspondence (Cavagna 2006; Hoomans 2002).
Blinding
Performance and detection bias
We considered blinding of participants and personnel to be important in this review, as knowledge of trial allocation may impact on the decisions made by staff during the participants' IVF cycle, for example whether to increase or decrease the dose in studies permitting dose adjustment, when to trigger, whether to cancel the cycle for poor or hyper‐response, what efforts to make to obtain eggs at egg retrieval, etc. We assessed the domain of detection bias for subjective outcomes only, i.e. OHSS. Indeed, one of the included studies in predicted low responders found that clinicians were more likely to cancel cycles in the lower‐dose arm, despite strict rules for cancellation. These authors hypothesised that the treating clinicians were more likely to cancel the cycle in women they knew were on a lower rather than higher dose of FSH.
We judged 11 studies to be at high risk of bias for both domains, as there was no effort made to blind participants, personnel or outcome assessors (Allegra 2017; Cavagna 2006; Jayaprakasan 2010; Klinkert 2005; Lan 2013; Lefebrve 2015; Olivennes 2015; Oudshoorn 2017; Popovic‐Todorovic 2003; Van Tilborg 2017; YongPYK 2003). Two studies did not report the only subjective outcome of this study (OHSS), so we rated these as being at low risk, as the domain does not apply (Harrison 2001; Tasker 2010). Six studies employed some level of blinding: in three studies, medications were indistinguishable, and all participants and personnel were blind, so we rated these trials as being at low risk of bias (Hoomans 2002; Magnusson 2017; Out 2004). In three studies, only trial staff were blinded, with no participant blinding (Arce 2014; Bastu 2016; Nyboe Andersen 2017). The studies did not include any description of any safeguards to prevent participants from disclosing their study dose to trial staff, so we rated these studies as being at unclear risk of bias. In a third case, authors described the study as being double‐blind; however, the methods seem to indicate that blinding was broken as early as day 4 of FSH administration, which would therefore leave the study open for the most part, warranting a rating of high risk (Tan 2005).
Incomplete outcome data
We rated 18 studies as being at low risk for incomplete outcome data, as there were few withdrawals or dropouts. Many studies had a number of women who did not reach the stage of embryo transfer and therefore did not have the opportunity to conceive during the study period. We did not consider these participants to contribute to the attrition numbers but rather as not achieving pregnancy or live birth. One study described the exclusion of 19 participants; however, it was not clear which trial arms these participants were excluded from, so it was not possible to assess if the number and reasons were balanced (Harrison 2001). Another study was published as an abstract only, and authors provided the individual participant data from the trial (Hamoda 2017 [pers comm]). The data provided appeared to have a large amount of missing data, and outcomes were not available for a significant number of participants (Tasker 2010). We rated these two studies as being at high risk of bias.
Selective reporting
A number of studies were at high risk of reporting bias, as they were not registered prospectively and failed to report important outcomes such as live birth and OHSS (Allegra 2017; Cavagna 2006; Harrison 2001; Hoomans 2002; Klinkert 2005; Out 2004; Popovic‐Todorovic 2003; Tan 2005; Tasker 2010). Although trial registration was not introduced as mandatory until 2005, the potential for selective reporting remains.
Two studies were at high risk because they either changed the definition of at least one outcome from that listed on the original trial registration (the definition of a good oocyte yield in Allegra 2017) or did not report the same outcomes as those listed (total doses administered in Arce 2014). Another study provided the outcomes of poor response and hyper‐response to stimulation only within subgroups of women, and it was not possible to extract the overall data per trial arm (Nyboe Andersen 2017). These authors declined to provide the data per trial arm without providing an adequate reason (Helmgaard 2017b [pers comm]).
Six studies were registered prospectively and reported all outcomes listed at trial registration (Bastu 2016; Jayaprakasan 2010; Magnusson 2017; Olivennes 2015; Oudshoorn 2017; Van Tilborg 2017). Another study listed a number of outcomes on the trial registration that they did not report in the paper; however, the authors provided the data for these outcomes (Lefebrve 2015, Lefebvre 2017 [pers comm]). We rated these five studies as being at low risk of bias.
Other potential sources of bias
Most studies had no additional sources of possible bias. One study stopped early on the basis the O'Brien and Fleming 1979 rules (O'Brien 1979), which are known to be associated with a biased estimate of effect (Allegra 2017). The analyses in the trial correctly adjusted for the early stopping – however, from our point of view as systematic review authors, the uncorrected summary data available will represent a biased estimate of the treatment effect. One study does not appear to have performed a power calculation, and the decision to complete recruitment on the basis of interim results may have induced bias (Hoomans 2002). Another study was available as an abstract only, therefore detailed information about the study methodology was not available. Although the study authors provided the individual participant data, there were a lot of missing values (Hamoda 2017 [pers comm]; Tasker 2010). We attempted to minimise this bias by performing multiple imputation on the data set, however. One trial performed an interim analysis, and used these interim results to inform a decision to increase the trial sample size; however, there does not appear to be any correction for P value spending (Nyboe Andersen 2017). It is unclear whether or not this would bias the data available for this review.
Effects of interventions
See: Summary of findings for the main comparison ORT‐based algorithm compared to standard dose of FSH for women undergoing IVF/ICSI; Summary of findings 2 Anticipated low‐responders: higher compared to lower dose of FSH for women undergoing IVF/ICSI; Summary of findings 3 Anticipated normal‐responders: higher compared to lower dose of FSH for women undergoing IVF/ICSI; Summary of findings 4 Anticipated high‐responders: higher compared to lower dose of FSH for women undergoing IVF/ICSI
We present the results separately for direct dose comparison and ORT‐algorithm studies. Within the direct dose comparison studies, we subdivide the results according to each predicted responder category (low, normal, high).
Direct dose comparison studies
1. Predicted low responders
Five studies included women who were predicted to have a low response based on at least one ORT measure (Bastu 2016; Harrison 2001; Klinkert 2005; Lefebrve 2015; Van Tilborg 2017). We pooled the studies within this comparison in cases where the control dose was identical.
-
300/450 IU versus 150 IU (Klinkert 2005; Van Tilborg 2017)
-
400/450 IU versus 300 IU (Bastu 2016; Harrison 2001)
-
600 IU versus 450 IU (Lefebrve 2015).
These comparisons are displayed within subgroups on one forest plot for illustrative purposes only (no overall pooling; summary of findings Table 2).
Primary outcomes
1.1 Live birth or ongoing pregnancy
Two studies reported live birth (Lefebrve 2015; Van Tilborg 2017), and two reported ongoing pregnancy (Bastu 2016; Klinkert 2005). The estimates of difference in live birth/ongoing pregnancy rate between the dose‐comparisons were very imprecise, and there is little information about the true treatment effect, so we graded the body of evidence as low quality (Analysis 1.1, Figure 4).

Forest plot of comparison: 1 Anticipated low responders: higher vs lower dose, outcome: 1.1 Live birth or ongoing pregnancy per woman randomised.
-
300/450 IU versus 150 IU (OR 0.71, 95% CI 0.32 to 1.58; N = 286; 2 studies; I2 = 0%). This suggests that if the chance of live birth with 150 IU is 11%, then the chance with 300/340 IU would be 3.8% to 16%.
-
400/450 IU versus 300 IU (OR 0.77, 95% CI 0.19 to 3.19; N = 62; 1 study). This suggests that if the chance of live birth with 300 IU is 16%, then the chance with 400/450 IU would be 3.5% to 38%.
-
600 IU versus 450 IU (OR 1.33, 95% CI 0.71 to 2.52; N = 356; 1 study). This suggests that if the chance of live birth with 450 IU is 11%, then the chance with 600 IU would be 7.9% to 23%.
One study also reported the outcome of cumulative live birth in two ways (Van Tilborg 2017).
-
Cumulative live birth – following one IVF cycle (fresh and frozen transfers). The evidence in relation to cumulative live birth when comparing 450 IU versus 150 IU was also consistent with notable effects in either direction or of no difference (OR 0.78, 95% CI 0.35 to 1.73; N = 234; Analysis 1.18). This suggests that if the chance of cumulative live birth with 150 IU is 13%, then the chance with 450 IU would be 5.1% to 21%.
-
Cumulative live birth – following 18 months of IVF (defined as an ongoing pregnancy leading to a live birth occurring within 18 months of randomization). The evidence when comparing 450 IU with 150 IU for cumulative live birth after 18 months of IVF was also consistent with notable effects in either direction or of no difference (OR 0.78, 95% CI 0.46 to 1.32; N = 234; Analysis 1.19). This suggests that if the chance of cumulative live birth with 150 IU is 42%, then the chance with 450 IU would be 25% to 49%.
1.2 Severe ovarian hyperstimulation syndrome (OHSS)
Four studies reported severe OHSS; however, there were no incidents of severe OHSS in any of the studies (Bastu 2016; Klinkert 2005; Lefebrve 2015; Van Tilborg 2017Analysis 1.2).
Secondary outcomes
1.3 Clinical pregnancy
All five studies reported this outcome, and we graded the body of evidence as low quality (Analysis 1.3).
One subgroup showed higher pregnancy rates in participants in the lower dosing arm; however, the effect remains imprecise.
-
300/450 IU versus 150 IU (OR 0.50, 95% CI 0.25 to 1.00; N = 286; 2 studies; I2 = 0%). This suggests that if the chance of clinical pregnancy with 150 IU is 18%, then the chance with 300/450 IU would be between 5.3% and 18%.
In the other two subgroups, the results are imprecise and remain consistent with effects in either direction, or of no effect.
-
400/450 IU versus 300 IU (OR 0.84, 95% CI 0.26 to 2.69; N = 110; 2 studies; I2 = 0%). This suggests that if the chance of clinical pregnancy with 300 IU is 13%, then the chance with 400/450 IU would be between 3.7% and 28%.
-
600 IU versus 450 IU (OR 1.14, 95% CI 0.66 to 1.99; N = 356, 1 study). This suggests that if the chance of clinical pregnancy with 450 IU is 16%, then the chance with 600 IU would be 11% to 27%. This study also reported the cumulative clinical pregnancy rate; however, this was not an outcome of this review.
1.4 Time to clinical pregnancy
None of the studies in predicted low responders reported this outcome; Van Tilborg 2017 reported the time to ongoing pregnancy, but not time to clinical pregnancy.
1.5 Moderate or severe OHSS
All five studies reported this outcome; however, there were no incidents of moderate or severe OHSS in three studies (Bastu 2016; Klinkert 2005; Van Tilborg 2017Analysis 1.5). In the study comparing 600 IU and 450 IU, there was only one occurrence of moderate OHSS in the higher dose arm, so the effect is too imprecise to provide any useful information (Lefebrve 2015).
1.6 Multiple pregnancy rate per woman randomized
Four studies reported multiple pregnancy (Analysis 1.6). In two studies there were no cases of multiple pregnancy in either of the study arms (Bastu 2016; Klinkert 2005). In another there were two events in the 150 IU arm and one in the 450 IU arm (Peto OR 0.55, 95% CI 0.06 to 5.31; N = 234; Van Tilborg 2017). As the event rates were so low, we did not interpret these results any further. In the fourth study there were four multiple pregnancies in the 450 IU arm and eight in the 600 IU arm (Peto OR 0.49, 95% CI 0.16 to 1.55; N = 356; Lefebrve 2015).
We also calculated the multiple pregnancy rates per clinical pregnancy, with similar results (Analysis 1.20).
1.7 Number of oocytes retrieved per woman randomized
All five studies reported this outcome (Analysis 1.7). These are mean differences on the log scale and should not be misinterpreted as numbers of eggs.
In comparing 300/450 IU versus 150 IU, the pooled effect suggests a higher number of oocytes are collected in the higher dose arms (log(MD) oocytes 0.69, 95% CI 0.50 to 0.88; N = 286; 2 studies; I2 = 90%). This pooled estimate should be treated with caution owing to the high statistical heterogeneity.
In the other two comparisons, there did not appear to be any difference in the number of eggs collected; however, the effects remain imprecise, and there could be small effects in either direction.
-
400/450 IU versus 300 IU (log(MD) oocytes −0.03, 95% CI −0.30 to 0.24; N = 110; 2 studies, I2 = 38%).
-
600 IU versus 450 IU (log(MD) oocytes 0.08, 95% CI −0.04 to 0.20; N = 356).
1.8 Poor response to stimulation
Two trials within the same subgroup reported this outcome (Analysis 1.8). One study defined a poor response as the collection of fewer than four oocytes or cycle cancellation due to poor response (Klinkert 2005), and the second study defined a poor response as cycle cancellation for poor response or the retrieval of fewer than five oocytes (Van Tilborg 2017). The pooled effect demonstrates that there were fewer cases of poor response among women receiving 300/450 IU than 150 IU.
-
300/450 IU versus 150 IU (OR 0.52, 95% CI 0.32 to 0.84; N = 286; 2 studies; I2 = 0%). This suggests that if the chance of a poor response with 150 IU is 65%, then the chance with 400/450 IU would be 37% to 61%.
1.9 Normal response to stimulation
None of the studies in predicted low responders reported this outcome specifically in the paper. However, we calculated it as the difference between the number of women randomized and the number with either poor or hyper‐response in one trial that reported both of these outcomes (Van Tilborg 2017). Therefore, the resulting definition is women with the retrieval of 5 to 15 oocytes or cycle cancellation for any reason other than a poor or hyper‐response (Analysis 1.9). The result suggests there is a higher rate of normal response among women administered 450 IU compared to 150 IU.
-
300/450 IU versus 150 IU (OR 1.79, 95% CI 1.05 to 3.04; N = 234). This suggests that if the chance of a normal response with 150 IU is 33%, then the chance with 450 IU would be 34% to 60%.
1.10 Hyper‐response to stimulation
One study reported this outcome, defining it as cycle cancellation owing to excessive response or more than 15 oocytes at retrieval (Analysis 1.10). The result suggests 450 IU leads to more cases of hyper‐response than 150 IU.
-
300/450 IU versus 150 IU (OR 4.53, 95% CI 0.94 to 21.82; N = 234; Van Tilborg 2017). This suggests that if the chance of a hyper‐response with 150 IU is 1.7%, then the chance with 450 IU would be 1.6% to 27%.
1.11 Cycle cancellations for poor response
All five studies reported this outcome (Analysis 1.11). In the first subgroup, the rate of cycle cancellation for poor response was higher among women in the lower‐dose group; however, this result is largely influenced by one trial, and heterogeneity remains high.
-
300/450 IU versus 150 IU (OR 0.23, 95% CI 0.11 to 0.47; N = 286; 2 studies; I2 = 88%). This suggests that if the chance of cycle cancellation for poor response with 150 IU is 28%, then the chance with 300/450 IU would be 4.1% to 15%.
In the other two groupings, the effects of different doses were unclear, and the confidence intervals remain wide.
-
400/450 IU versus 150 IU (OR 1.47, 95% CI 0.62 to 3.49; N = 110; 2 studies; I2 = 0%). This suggests that if the chance of cycle cancellation for poor response with 150 IU is 22%, then the chance with 400/450 IU would be 15% to 49%.
-
600 IU versus 450 IU (OR 0.86, 95% CI 0.50 to 1.50; N = 356; 1 study). This suggests that if the chance of cycle cancellation for poor response with 450 IU is 18%, then the chance with 600 IU would be 10% to 25%.
1.12 Cycle cancellations for hyper‐response or freeze‐all
All studies reported this outcome; however, in four studies there were no events (Bastu 2016; Harrison 2001; Klinkert 2005; Lefebrve 2015). In one study, there was only one event of cycle cancellations for hyper‐response, so the effect estimates remain very imprecise (Analysis 1.12).
-
400/450 IU versus 150 IU (Peto OR 7.93, 95% CI 0.16 to 400.62; N = 234; Van Tilborg 2017).
1.13 Cycle cancellations for poor or hyper‐response
This outcome refers to the cancellation of an IVF/ICSI treatment cycle due to poor response or hyper‐response, excluding cancellations for other reasons (such as uterine anomaly). In predicted low responders, there was only one case of cancellation for hyper‐response, so the outcome primarily reflects the outcome of cycle cancellation for poor response (Analysis 1.13).
In one case there was a clear benefit from 300/450 IU over 150 IU in reducing the number of cycle cancellations from poor or hyper‐response.
-
300/450 IU versus 150 IU (OR 0.25, 95% CI 0.13 to 0.50; N = 286; 2 studies; I2 = 87%). This suggests that if the chance of cycle cancellation for poor or hyper‐response with 150 IU is 28%, then the chance with 300/450 IU would be 4.8% to 16%. Readers should treat this estimate with caution owing to the high statistical heterogeneity.
However, in the other two subgroups the effect is less clear.
-
400/450 IU versus 300 IU (OR 1.47, 95% CI 0.62 to 3.49; N = 110; 2 studies; I2 = 0%). This suggests that if the chance of cycle cancellation for poor or hyper‐response with 300 IU is 22%, then the chance with 400/450 IU would be 15% to 49%.
-
600 IU versus 450 IU (OR 0.86, 95% CI 0.50 to 1.50; N = 356; 1 study). This suggests that if the chance of cycle cancellation for poor or hyper‐response with 450 IU is 18%, then the chance with 600 IU would be 10% to 25%.
1.14 Proportion of women with at least one transferable embryo
This outcome refers to the number of women who had at least one embryo available for transfer, either for a fresh embryo transfer or for a freeze‐all strategy. In most cases, the estimate of the difference in the number of women with at least one embryo available to transfer between the two groups was very imprecise (Analysis 1.14).
-
400/450 IU versus 300 IU (OR 0.71, 95% CI 0.31 to 1.60; N = 110; 2 studies; I2 = 0%). This suggests that if the chance of having at least one transferable embryo with 300 IU is 73%, then the chance with 400/450 IU would be 45% to 81%.
-
600 IU versus 450 IU (OR 1.19, 95% CI 0.78 to 1.82; N = 356; 1 study). This suggests that if the chance of having at least one transferable embryo with 450 IU is 57%, then the chance with 600 IU would be 51% to 71%.
However in one subgroup, more women had at least one transferable embryo among those administered a higher dose.
-
300/450 IU versus 150 IU (OR 1.76, 95% CI 1.07 to 2.87; N = 286; 2 studies; I2 = 76%). This suggests that if the chance of having at least one transferable embryo with 150 IU is 59%, then the chance with 300/450 IU would be 61% to 81%. Readers should treat this result with caution owing to the high statistical heterogeneity.
1.15 Total dose of FSH
All studies reported this outcome. In all groupings, participants in the higher dosing arm received a higher total dose of FSH on average than women in the lower dosing arm (Analysis 1.15).
-
300/450 IU versus 150 IU (MD IU 2780, 95% CI 2570 to 3000; N = 286; 2 studies; I2 = 98%).
-
400/450 IU versus 300 IU (MD IU 1110, 95% CI 910 to 1310; N = 110; 2 studies; I2 = 94%).
-
600 IU versus 450 IU (MD IU 1200, 95% CI 1070 to 1330; N = 356; 1 study).
We would urge caution in relation to this outcome, however, as the effect of censoring due to cancelled cycles cannot be accounted for, and there is high statistical heterogeneity.
1.16 Duration of FSH administration
Four studies reported this outcome (Analysis 1.16). In all cases, the pooled effects suggest that higher doses reduce the duration of FSH administration.
-
300/450 IU versus 150 IU (MD days −0.70, 95% CI −1.48 to 0.08; N = 234; 1 study).
-
400/450 IU versus 300 IU (MD ‐0.67, 95% CI ‐1.39 to 0.06; participants = 110; studies = 2; I2 = 0%)
-
600 IU versus 450 IU (MD days −1.00, 95% CI −1.27 to −0.73; N = 356; 1 study).
We would urge caution in relation to this outcome, however, as it is not possible to account for the effect of censoring due to cancelled cycles.
1.17 Cost per woman randomized
None of the studies in predicted low responders reported this outcome; however, the outcome was available pooled across two sub‐studies in this review (one poor responder and one normal responder), which were published as one trial (Van Tilborg 2017). The total cost was higher among women administered 450/225 IU compared to those given 150 IU (EUR 6397 versus EUR 5298; MD EUR 1099, 95% CI 562 to 1591).
2. Predicted normal responders
Nine studies included women with predicted normal response, as determined by at least one ORT measure (Arce 2014; Cavagna 2006; Harrison 2001; Hoomans 2002; Jayaprakasan 2010; Out 2004; Tan 2005; Van Tilborg 2017; YongPYK 2003; summary of findings Table 3). The studies are pooled under the following comparisons.
-
200 IU versus 100 IU (Hoomans 2002; Tan 2005).
-
225/200 IU versus 150 IU.
-
200 versus 150 IU (Cavagna 2006; Harrison 2001; Out 2004).
-
225 versus 150 IU (Van Tilborg 2017; YongPYK 2003).
-
-
300 IU versus 225 IU (Jayaprakasan 2010).
These comparisons are also presented together in one forest plot for display purposes only (no overall pooling).
-
Dose‐response effects (no pooling). Arce 2014 reported doses as 5.2 µg, 6.9 µg, 8.6 µg. 10.3 µg, and 12.1 µg rather than as international units (IU). As these doses cannot be translated into the doses described in the other studies, we present information on the dose response between increasing dose groups in separate forest plots and in descriptions in the text.
Primary outcomes
2.1 Live birth or ongoing pregnancy
Five studies reported this outcome: three reported live birth (Arce 2014; Jayaprakasan 2010; Van Tilborg 2017), and two reported ongoing pregnancy (Hoomans 2002; Tan 2005). We rated the evidence as low quality.
In two of the comparisons, there is no clear impact of different doses on the probability of live birth, and although the confidence intervals encompass the possibility of small effects in either direction, the point estimates sit close to the line of no effect, which makes any benefit from higher doses of FSH unlikely (Analysis 2.1; Figure 5).

Forest plot of comparison: 2 Anticipated normal responders: higher vs lower dose, outcome: 2.1 Live birth or ongoing pregnancy.
-
200 versus 100 IU (OR 0.88, 95% CI 0.57 to 1.36; N = 522; 2 studies; I2 = 0%). This suggests that if the chance of live birth or ongoing pregnancy with 100 IU is 20%, then the chance with 200 IU would be 13% to 26%.
-
225/200 versus 150 IU (OR 1.03, 95% CI 0.57 to 1.86; N = 277; 1 study). This suggests that if the chance of live birth or ongoing pregnancy with 150 IU is 19%, then the chance with 200/225 IU would be 12% to 31%.
-
300 IU versus 225 IU (OR 0.65, 95% CI 0.32 to 1.32; N = 135, 1 study). This suggests that if the chance of live birth with 225 IU is 40%, then the chance with 300 IU would be 17% to 47%. In the third comparison, the confidence interval remains wide, and it is not clear whether there is any effect from 300 IU versus 225 IU.
-
Additionally, live birth rates and associated standard errors (SEs) across the five dose groups in order of increasing dose were 32% (11), 32% (11), 35% (11), 25% (10), and 29% (10). These data neither confirm nor rule out dose effects on live birth (Analysis 2.21; Figure 6).

Forest plot of comparison: 2 Anticipated normal responders: higher vs lower dose, outcome: 2.21 Dose‐response: live birth or ongoing pregnancy.
Two trials reported cumulative live birth rates, using two definitions (Arce 2014; Van Tilborg 2017).
-
Cumulative live birth – following one IVF cycle (fresh and frozen transfers) (Analysis 2.18). In the comparison of 200/225 versus 150 IU, the OR was 0.88 (95% CI 0.51 to 1.52; N = 277; 1 study). This suggests that if the chance of cumulative live birth with 150 IU is 26%, then the chance with 225 IU would be between 15% and 35%. Cumulative live birth rates (SEs) across the five dose groups were 37% (11), 42% (11), 35% (11), 30% (10), and 38% (11) (Analysis 2.22). These data neither confirm nor rule out dose effects on cumulative live birth.
-
Cumulative live birth – following 18 months of IVF (defined as an ongoing pregnancy leading to a live birth occurring within 18 months of randomization). The evidence in relation to cumulative live birth rate after 18 months of IVF, when comparing 225 IU with 150 IU, was consistent with notable effects in either direction or of no difference (OR 1.01, 95% CI 0.63 to 1.62; N = 277; Analysis 2.19, Van Tilborg 2017). This suggests that if the chance of cumulative live birth with 150 IU is 47%, then the chance with 225 IU would be between 36% and 59%.
2.2 Severe OHSS
Eight of the nine trials reported this outcome; however, there were no incidents of severe OHSS in four of the studies (Arce 2014; Cavagna 2006; Hoomans 2002; YongPYK 2003). We graded the body of evidence as of very low quality, and the effect estimates remain very imprecise.
-
200 IU versus 100 IU (Peto OR 0.14, 95% CI 0.00 to 6.96; N = 522; 2 studies; I2 = 0%; Analysis 2.2).
-
225/200 IU versus 150 IU (Peto OR 1.00, 95% CI 0.20 to 5.02; N = 740; 4 studies; I2 = 15%; Analysis 2.2).
-
300 IU versus 225 IU (Peto OR 0.14, 95% CI 0.00 to 6.92; N = 135, 1 study; Analysis 2.2).
-
In the multiple‐dosing trial there were no cases of severe OHSS (Arce 2014).
Secondary outcomes
2.3 Clinical pregnancy
Eight studies in predicted normal responders reported this outcome (Analysis 2.3). In each case the point estimates suggest no benefit from increased doses on the probability of pregnancy; however, the estimates are imprecise and consistent with small effects in either direction. We graded the body of evidence as low quality.
-
200 IU versus 100 IU (OR 0.86, 95% CI 0.50 to 1.49; N = 330; 1 study). This suggests that if the chance of clinical pregnancy with 100 IU is 20%, then the chance with 200 IU would be 11% to 27%.
-
225/200 IU versus 150 IU (OR 0.98, 95% CI 0.73 to 1.31; N = 1037; 5 studies; I2 = 0%). This suggests that if the chance of clinical pregnancy with 150 IU is 24%, then the chance with 200/225 IU would be 18% to 29%.
-
300 IU versus 225 IU (OR 0.91, 95% CI 0.46 to 1.80; N = 135, 1 study). This suggests that if the chance of clinical pregnancy with 225 IU is 44%, then the chance with 300 IU would be 27% to 59%.
-
In the multiple‐dosing study, clinical pregnancy rates were essentially identical to birth rates, since only one pregnancy did not progress to live birth; rates (SEs) across the five dose groups were 31% (11), 32% (11), 35% (11), 25% (10), and 33% (10) (Analysis 2.23). These data neither confirm nor rule out dose effects on clinical pregnancy.
2.4 Time to clinical pregnancy
None of the studies in predicted normal responders reported this outcome (Van Tilborg 2017 reported the time to ongoing pregnancy, but not time to clinical pregnancy).
2.5 Moderate or severe OHSS
The estimates for this outcome are based on a small number of events in eight studies, and therefore the effect estimates remain imprecise, and we rated the evidence as very low quality (Analysis 2.5).
-
200 IU versus 100 IU (Peto OR 0.62, 95% CI 0.21 to 1.87; N = 522; 2 studies; I2 = 0%). This suggests that if the chance of moderate or severe OHSS with 100 IU is 3.1%, then the chance with 200 IU would be 0.7% to 5.6%.
-
225/200 IU versus 150 IU (Peto OR 1.21, 95% CI 0.51 to 2.85; N = 740; 4 studies; I2 = 49%) This suggests that if the chance of moderate or severe OHSS with 150 IU is 2.7%, then the chance with 225/200 IU would be 1.4% to 7.3%.
-
300 IU versus 225 IU (Peto OR 0.67, 95% CI 0.11 to 3.99; N = 135, 1 study). With only five total events, we refrain from interpreting this result any further.
-
There were no incidents of moderate or severe OHSS observed in any of the study arms of the multiple‐dosing study (Arce 2014).
2.6 Multiple pregnancy in randomized women
Five trials reported the outcome of multiple pregnancy, and as there were only a small number of events in each comparison, the point estimates were imprecise and consistent with substantial effects in either direction (Analysis 2.6).
-
200 IU versus 100 IU (Peto OR 0.97, 95% CI 0.38 to 2.52; N = 330; 1 study). This suggests that if the chance of multiple pregnancy with 100 IU is 5.5% then the chance with 200 IU would be between 2.2% and 13%.
-
225/200 IU versus 150 IU (Peto OR 1.91, 95% CI 0.38 to 9.69; N = 400; 2 studies; I2 = 0%).
-
300 IU versus 225 IU (Peto OR 7.61, 95% CI 0.47 to 123.02; N = 135; Jayaprakasan 2010). In this study there were only two multiple pregnancies, both in the 300 IU arm.
-
There were no multiple pregnancies in the multiple‐dosing study (Arce 2014).
We also analyzed the data as multiple pregnancy in women with clinical pregnancy, with similar results (Analysis 2.20).
2.7 Number of oocytes per woman randomized
These are mean differences on the log scale, and should not be misinterpreted as numbers of eggs.
All studies in normal responders reported this outcome (Analysis 2.7). The first two comparisons suggest a higher egg yield from higher doses of FSH.
-
200 IU versus 100 IU (log(MD) oocytes 0.46, 95% CI 0.36 to 0.57; N = 330; 2 studies, I2 = 98%). Readers should interpret this pooled estimate with caution owing to the high observed statistical heterogeneity.
-
225/200 IU versus 150 IU (log(MD) oocytes 0.16, 95% CI 0.08 to 0.24; N = 463; 5 studies, I2 = 44%).
-
300 IU versus 225 IU (log(MD) oocytes 0.03, 95% CI −0.17 to 0.23, N = 135, 1 study). In the third comparison, the evidence did not rule out differences in either direction in the number of oocytes retrieved depending on FSH dose.
-
In the multiple‐dosing study, the mean (standard deviation; SD) numbers of oocytes collected across dose groups were 4 (2.5), 6 (5.1), 7 (4), 6.9 (3.8), and 9 (5.1) (Analysis 2.24); these have been recalculated to include cancelled cycles, and SDs estimated according to the method described in Data synthesis. We also note that the authors reported a dose‐response effect, although their analysis excluded small numbers of cancelled cycles.
2.8 Poor response to stimulation
Two trials reported poor response to stimulation, defining it either as obtaining no more than three oocytes (Arce 2014), or cycle cancellation owing to insufficient growth/five oocytes or fewer at retrieval (Van Tilborg 2017). In both comparisons there were fewer cases of poor response among women administered higher doses of FSH.
-
225 IU versus 150 IU (OR 0.50, 95% CI 0.30 to 0.83; N = 277; 1 study; Analysis 2.8). This suggests that if the chance of a poor response with 150 IU is 40% then the chance with 225 IU would be between 17% and 36%.
-
In the multiple‐dosing study the proportion (SE) of participants with poor response across the dose groups was 37% (11), 32% (11), 20% (9), 10% (7), and 14% (8) (Analysis 2.25). These data neither confirm nor rule out dose effects on poor response.
2.9 Normal response to stimulation
Only two trials reported this outcome. Arce 2014 defined a normal response as obtaining 4 to 14 oocytes. Van Tilborg 2017 calculated the outcome as the difference between the number of women randomized and the number with either poor or hyper‐responses. Therefore the resulting definition is women in whom 5 to 15 oocytes were retrieved or whose cycle was cancelled for any reason other than a poor or hyper‐response. There was no clear difference in the occurrence of normal response in different dose comparisons.
-
225 IU versus 150 IU (OR 1.26, 95% CI 0.78 to 2.04; N = 277; 1 study; Analysis 2.9). This suggests that if the chance of a normal response with 150 IU is 56% then the chance with 225 IU would be between 50% and 73%.
-
In the multiple dosing study the proportion (SE) of participants with normal response across the dose groups was 63% (11), 58% (11), 75% (10), 90% (7), and 76% (9) (Analysis 2.26).
2.10 Hyper‐response to stimulation
The same two studies reported this outcome, with Arce 2014 defining it as women with 15 or more eggs collected and Van Tilborg 2017 as women with either more than 15 eggs collected or cancellation for hyper‐response. In one trial there were more cases of hyper‐response among women in the higher dosing arm.
-
225 IU versus 150 IU (OR 4.08, 95% CI 1.47 to 11.34; N = 277; 1 study; Analysis 2.10). This suggests that if the chance of a hyper‐response with 150 IU is 3.6% then the chance with 225 IU would be between 5.2% and 30%.
-
In the multiple‐dosing study the proportion (SE) of participants with hyper‐response across the dose groups was 0% (0), 11% (7), 5% (5), 0% (0), and 10% (6) (Analysis 2.27). These data neither confirm nor rule out dose effects on hyper‐response.
2.11 Cycle cancellations for poor response
This outcome was available for all studies. In all cases, administration of a higher dose of FSH led to fewer cycle cancellations for poor response; however, the effect was of variable magnitude and precision.
-
200 IU versus 100 IU (OR 0.33, 95% CI 0.16 to 0.66; N = 522; 2 studies; I2 = 60%; Analysis 2.11). This suggests that if the chance of cancellation for poor response with 100 IU is 11%, then the chance with 200 IU would be 4.1% to 9.5%.
-
225/200 IU versus 150 IU (OR 0.56, 95% CI 0.36 to 0.88; N = 1037; 5 studies; I2 = 13%; Analysis 2.11). This suggests that if the chance of cancellation for poor response with 150 IU is 10%, then the chance with 225/220 IU would be 4.0% to 9.4%.
-
300 IU versus 225 IU. There was only one cancellation for poor response in both arms (OR 0.11, 95% CI 0.01 to 2.01; N = 135, 1 study; Analysis 2.11).
-
Cancellation rates for poor response (SEs) across the dose groups in the multiple‐dosing study were 11% (7), 5% (5), 5% (5), 0% (0), and 5% (5) (Analysis 2.28). These data neither confirm nor rule out dose effects on cycle cancellation for poor response.
2.12 Cycle cancellations for hyper‐response or freeze‐all per woman randomized
This outcome refers to cycle cancellations only for reasons of poor or hyper‐response (excluding cancellations for other reasons), and all studies reported it. As the occurrence of cancellation for hyper‐response in this population was low, the pooled effects are associated with a large degree of imprecision (Analysis 2.12).
-
200 IU versus 100 IU (Peto OR 1.93, 95% CI 0.20 to 18.62; N = 522; 2 studies; I2 = 62%).
-
225/200 IU versus 150 IU (Peto OR 2.28, 95% CI 0.99 to 5.26; N = 1037; 5 studies; I2 = 0%). This suggests that if the chance of cancellation for hyper‐response with 150 IU is 1.4%, then the chance with 225/200 IU would be 1.3% to 6.7%.
-
In the comparison of 300 IU versus 225 IU, there was only one cancellation for hyper‐response in both arms (OR 1.02, 95% CI 0.06 to 16.57; N = 135, 1 study).
-
In the multiple‐dosing study there were no cycles cancelled for hyper‐response in any of the five dose arms (Arce 2014).
2.13 Cycle cancellations for poor or hyper‐response
In combining the cycle cancellations for hyper and poor response (2.11 and 2.12 above), most comparisons suggest that a higher dose is associated with fewer cancellations overall (Analysis 2.13).
-
200 IU versus 100 IU (OR 0.37, 95% CI 0.19 to 0.72; N = 522; 2 studies; I2 = 10%). This suggests that if the chance of cycle cancellation with 100 IU is 13%, then the chance with 200 IU would be between 2.7% to 9.5%.
-
225/200 IU versus 150 IU (OR 0.76, 95% CI 0.51 to 1.13; N = 1037; 5 studies; I2 = 0%). This suggests that if the chance of cycle cancellation with 150 IU is 12%, then the chance with 225/200 IU would be between 6.5% to 13%.
-
300 IU versus 225 IU (OR 0.19, 95% CI 0.02 to 1.68; N = 135, 1 study). This suggests that if the chance of cycle cancellation with 225 IU is 7.4%, then the chance with 300 IU would be between 0.2% to 15%.
-
In the multiple‐dosing study there were only cancellations for poor response, therefore the rates (SE) for total cancellation are the same as presented above across the dose groups: 11% (7), 5% (5), 5% (5), 0% (0), and 5% (5) (Analysis 2.28). These data neither confirm nor rule out dose effects on cycle cancellation for poor response.
2.14 Women with at least one transferable embryo
This outcome refers to the number of women who had at least one embryo available for transfer, either for a fresh embryo transfer or for a freeze‐all strategy. All studies reported or calculated this outcome and suggest possible benefit from higher dose; however, this was not as clear in some comparisons (Analysis 2.14).
-
200 IU versus 100 IU (OR 1.58, 95% CI 0.95 to 2.64; N = 522; 2 studies; I2 = 78%). This suggests that if the chance of having at least one transferable embryo with 100 IU is 84%, then the chance with 200 IU would be 83% to 93%.
-
225/200 IU versus 150 IU (OR 1.06, 95% CI 0.76 to 1.47; N = 1037; 5 studies; I2 = 64%). This suggests that if the chance of having at least one transferable embryo with 150 IU is 83%, then the chance with 225/200 IU would be 79% to 88%.
-
300 IU versus 225 IU (OR 1.75, 95% CI 0.60 to 5.13; N = 135, 1 study). This similarly unclear evidence suggests that if the chance of having at least one transferable embryo with 225 IU is 85%, then the chance with 300 IU would be 78% to 97%.
-
In the dose‐response study the percentages (SEs) with at least one embryo available were 89% (7), 84% (8), 90% (7), 85% (8), and 90% (6) (Analysis 2.29). These data neither confirm nor rule out dose effects on women having at least one transferable embryo.
2.15 Total dose of FSH
In all comparisons, participants randomized to a higher daily dose of FSH received a higher total dose during their IVF/ICSI cycle (Analysis 2.15).
-
200 IU versus 100 IU (MD IU 795.79, 95% CI 656.67 to 934.91; N = 522; 2 studies; I2 = 8%).
-
225/200 IU versus 150 IU (MD IU 503.12, 95% CI 456.23 to 550.00; N = 1037; 5 studies; I2 = 71%). Readers should treat this pooled estimate with caution owing to the high statistical heterogeneity.
-
300 IU versus 225 IU (MD IU 725, 95% CI 597 to 853; N = 135, 1 study).
-
In the multiple‐dosing study, mean (SD) total doses were 47.9 µg (12.0), 59.2 µg (12.7), 72.7 µg (11.7), 80.9 µg (15.0), and 95.1 µg (28.7) (Analysis 2.30). It is not possible to convert these to IU to permit pooling with the other trials.
However, we recommend caution when interpreting these results, as cancellations for poor response were essentially censored, making it impossible to impute doses; these cancellations were considerably more common in the lower dosing arms.
2.16 Duration of FSH administration
Eight trials reported this outcome (Analysis 2.16). In most cases, a higher dose of FSH was associated with a shorter duration of FSH; however, we recommend caution when interpreting these results, as cancellations were censored, making it impossible to impute days of stimulation; these cancellations were considerably more common in the lower dosing arms.
-
200 IU versus 100 IU (MD days −1.80, 95% CI −2.21 to −1.39; N = 330; 1 study).
-
225/200 IU versus 150 IU (MD days −0.25, 95% CI −0.51 to 0.01; N = 961; 4 studies; I2 = 76%). This pooled estimate should be treated with caution owing to the high statistical heterogeneity.
-
300 IU versus 225 IU (MD days −0.30, 95% CI −0.79 to 0.19; N = 135, 1 study).
-
In the multiple‐dosing study, mean (SD) days stimulated were 9.2 (2.3), 8.6 (1.8), 8.5 (1.4), 7.9 (1.5), and 7.9 (2.4) (Analysis 2.31), and we note tentatively that the mean duration decreases across the groups.
2.17 Cost per woman randomized
None of the studies in predicted normal responders reported this outcome; however, the outcome was available pooled across two sub‐studies in this review (one low responder and one normal responder) which were published as one trial (Van Tilborg 2017). The total cost was higher among women administered 450/225 IU compared to those given 150 IU (EUR 6397 versus EUR 5298; MD EUR 1099, 95% CI 562 to 1591).
3. Predicted high responders
There are two studies included in this comparison, one of which was a dose‐response study including 123 predicted high responder participants, reporting outcomes in groups given five doses (5.2 µg, 6.9 µg, 8.6 µg, 10.3 µg, and 12.1µg) of a novel gonadotropin (follitropin delta), so translation to IU is not possible (Arce 2014;summary of findings Table 4). The second trial compared doses of 150 IU versus 100 IU in women with AFC over 15 (Oudshoorn 2017). Data from the two studies are presented in separate forest plots, as below.
-
150 IU versus 100 IU (Oudshoorn 2017).
-
Dose‐response effects (no pooling): 5.2 µg, 6.9 µg, 8.6 µg. 10.3 µg, 12.1 µg (Arce 2014). These doses cannot be translated into the doses described in the other studies, so we present information on the dose response between increasing dose groups in separate forest plots and describe them in the text.
Primary outcomes
3.1 Live birth or ongoing pregnancy
Both trials reported live birth, and in both cases there was insufficient evidence to determine whether there was any difference in live birth rate between the doses investigated; we cannot rule out moderate effects in either direction. We graded the body of evidence as low quality.
-
150 IU versus 100 IU (OR 0.98, 95% CI 0.66 to 1.46; N = 521; 1 study; Analysis 3.1; Figure 7). This suggests that if the chance of live birth with 100 IU is 26%, then the chance with 150 IU would be 18% to 33%.
-
Birth rates (SEs) across the five dose groups were 39% (10), 42% (10), 38% (10), 25% (9), and 46% (10) (Analysis 3.21; Figure 8). These data neither confirm nor rule out dose effects on live birth.

Forest plot of comparison: 3 Anticipated high‐responders: higher vs lower dose, outcome: 3.1 Live birth or ongoing pregnancy.

Forest plot of comparison: 3 Anticipated high‐responders: higher vs lower dose, outcome: 3.21 Dose‐response: live birth or ongoing pregnancy.
Additionally, both trials reported the cumulative live birth rate, one using two definitions.
-
Cumulative live birth rate – following one IVF cycle (fresh and frozen transfers).
-
150 IU versus 100 IU (OR 1.16, 95% CI 0.81 to 1.65; N = 521; 1 study; Analysis 3.18). This suggests that if the chance of cumulative live birth with 100 IU is 36%, then the chance with 150 IU would be between 31% and 48%.
-
Cumulative birth rates (SEs) across the five dose groups were 43% (10), 54% (10), 46% (10), 38% (10), and 50% (10) (Analysis 3.23). These data neither confirm nor rule out dose effects on live birth.
-
-
Cumulative live birth – following 18 months of IVF (defined as an ongoing pregnancy leading to a live birth occurring within 18 months of randomization) (Analysis 3.19).150 IU versus 100 IU (OR 1.16, 95% CI 0.80 to 1.68; N = 521; 1 study). This suggests that if the chance of cumulative live birth with 100 IU is 66%, then the chance with 150 IU would be between 61% and 77%.
3.2 Severe OHSS
Both trials reported severe OHSS, and in both cases there were too few events to make any assessment regarding the effect of the different doses on the probability of this outcome. We graded the body of evidence as very low quality.
-
150 IU versus 100 IU (Peto OR 0.72, 95% CI 0.16 to 3.19; N = 521; 1 study; Analysis 3.2).
-
Severe OHSS rates (SEs) were 0% (0), 0% (0), 4% (4), 0% (0), and 8% (5) (Analysis 3.24). The event rates are too low to make a reasonable inference regarding a treatment effect.
Secondary outcomes
3.3 Clinical pregnancy
Both trials reported clinical pregnancy rate, and in both cases there was no obvious benefit of higher or lower dose on the probability of pregnancy; however, the evidence is consistent with moderate effects in either direction. We graded the body of evidence as low quality.
-
150 IU versus 100 IU (OR 1.14, 95% CI 0.78 to 1.66; N = 521; 1 study; Analysis 3.3). This suggests that if the chance of clinical pregnancy with 100 IU is 28%, then the chance with 150 IU would be 23% to 39%.
-
Clinical pregnancy rates (SEs) across the five dose groups were 39% (10), 46% (10), 38% (10), 25% (9), and 46% (10) (Analysis 3.22). These data neither confirm nor rule out dose effects on clinical pregnancy.
3.4 Time to clinical pregnancy
None of the studies in predicted high responders reported this outcome (Oudshoorn 2017 reported the time to ongoing pregnancy, but not time to clinical pregnancy).
3.5 Moderate or severe OHSS
Both trials reported moderate/severe OHSS, and in both cases there was a trend towards increased risk of moderate/severe OHSS with increasing dose; however, even a small reduction in risk is possible.
-
150 IU versus 100 IU (Peto OR 2.31, 95% CI 0.80 to 6.67; N = 521; 1 study; Analysis 3.5). This suggests that if the chance of moderate or severe OHSS with 100 IU is 1.6%, then the chance with 150 IU would be 1.3% to 9.6%.
-
Rates (SE) of moderate or severe OHSS across the five dose groups were 0% (0), 0% (0), 4% (4), 4% (4), and 12% (6) (Analysis 3.25). Event rates are too low to make any reasonable inference here. We rated the body of evidence for this outcome as very low quality.
3.6 Multiple pregnancy in randomized women
Both trials reported this outcome; however, the number of multiple pregnancies was very small, so we do not interpret the results further.
-
150 IU versus 100 IU (Peto OR 1.87, 95% CI 0.19 to 18.09; N = 521; 1 study; Analysis 3.6). The multiple pregnancy rates were also calculated per clinical pregnancy, with similar results (Analysis 3.20).
-
There were no multiple pregnancies in the multiple‐dosing arm study (Arce 2014).
3.7 Number of oocytes per woman randomized
Both trials reported this outcome and indicate higher oocyte yield with higher doses of FSH. These are mean differences are on the log scale and should not be misinterpreted as numbers of eggs.
-
150 IU versus 100 IU (log(MD) oocytes 0.67, 95% CI 0.55 to 0.79; N = 521; 1 study; Analysis 3.7).
-
The mean (SD) numbers of eggs collected across the five dose groups in the second study were 5.9 (3.9), 9.1 (6.4), 10.2 (5), 13.6 (7.8), and 14.4 (5.8) (Analysis 3.26), where these have been recalculated to include cancelled cycles, and SDs have been estimated according to the method described in Data synthesis. We note tentatively that the means increase with increasing dose. We also note that the authors reported a dose‐response effect, although their analysis excluded small numbers of cancelled cycles.
3.8 Poor response to stimulation
One study defined a poor response as cycle cancellation for poor response or the retrieval of fewer than five oocytes (Oudshoorn 2017), and the second study defined poor response as the retrieval of fewer than four oocytes (Arce 2014).
-
150 IU versus 100 IU (OR 0.15, 95% CI 0.09 to 0.25; N = 521; 1 study; Analysis 3.8). This suggests that if the chance of a poor response with 100 IU is 36%, then the chance with 150 IU would be 4.8% to 12%.
-
Rates (SE) of poor response across the five dose groups in the second trial were 35% (10), 15% (7), 8% (6), 8% (6), and 0% (0) (Analysis 3.27). These data neither confirm nor rule out dose effects on poor response, although we note that the rate decreases across the dose groups.
3.9 Normal response to stimulation
Both trials reported this outcome. One study reported poor and hyper‐response and calculated the normal events as the difference between them, the resulting definition being the number of women with 5 to 15 oocytes collected or with cycle cancellation of any reason other than poor or hyper‐response (Oudshoorn 2017). The second trial defined a normal response as the retrieval of 4 to 14 oocytes (Arce 2014). The results suggest a similar number of women achieving a normal response among those administered different doses.
-
150 IU versus 100 IU (OR 1.07, 95% CI 0.76 to 1.50; N = 521; 1 study; Analysis 3.9). This suggests that if the chance of a normal response with 100 IU is 53%, then the chance with 150 IU would be 46% to 62%.
-
The proportion of participants (SE) with normal response across the five dose groups was 57% (10), 58% (10), 79% (8), 54% (10), and 50% (10) (Analysis 3.28). These data neither confirm nor rule out dose effects on normal response.
3.10 Hyper‐response to stimulation
One study defined a hyper‐response as cycle cancellation for excessive response or the retrieval of more than 15 oocytes (Oudshoorn 2017), and the second study defined it as collection of more than 14 oocytes (Arce 2014). There were significantly more women having a hyper‐response among those administered 150 IU compared to those given 100 IU.
-
150 IU versus 100 IU (OR 5.04, 95% CI 3.17 to 8.02; N = 521; 1 study; Analysis 3.10). This suggests that if the chance of a hyper‐response with 100 IU is 11%, then the chance with 150 IU would be 28% to 50%.
-
The proportion of participants (SE) with hyper‐response across the five dose groups was 9% (6), 19% (8), 21% (8), 38% (10), and 50% (10) (Analysis 3.29). These data neither confirm nor rule out dose effects on hyper‐response, although we note that the rate increases across the dose groups.
3.11 Cycle cancellations for poor response
In one trial, the pooled results suggest that cancellation for poor response occurs more in women administered 100 IU than those given 150 IU.
-
150 IU versus 100 IU (OR 0.13, 95% CI 0.06 to 0.28; N = 521; 1 study; Analysis 3.11). This suggests that if the chance of a cycle cancellation for poor response with 100 IU is 21%, then the chance with 150 IU would be 1.5% to 6.8%.
-
Cancellation rates for poor response (SEs) across the five dose groups were 0% (0), 0% (0), 4% (5), 0% (0), and 0% (0) (Analysis 3.30). The event rates are too low to allow any meaningful inference.
3.12 Cycle cancellations for hyper‐response
The pooled results suggest that cancellation for hyper‐response occurs more in women administered 150 IU compared to 100 IU.
-
150 IU versus 100 IU (OR 5.28, 95% CI 2.16 to 12.90; N = 521; 1 study; Analysis 3.12). This suggests that if the chance of a cycle cancellation for hyper‐response with 100 IU is 2.4%, then the chance with 150 IU would be 4.9% to 24%.
-
Cancellation rates (SEs) for hyper‐response across the five dose groups were 0% (0), 4% (4), 0% (0), 4% (4), and 0% (0) (Analysis 3.31).
3.13 Cycle cancellations for poor or hyper‐response
The rate of cycle cancellation for either a poor or hyper‐response (combining 3.11 and 3.12 above) was higher among women given 100 IU than in women given 150 IU, as this outcome was denominated by higher overall rates of cancellation for poor response than for hyper‐response.
-
150 IU versus 100 IU (OR 0.57, 95% CI 0.36 to 0.89; N = 521; 1 study; Analysis 3.13). This suggests that if the chance of a cycle cancellation for poor or hyper‐response with 100 IU is 23%, then the chance with 150 IU would be 9.8% to 21%.
-
Cancellation rates (SEs) across the five dose groups were 0% (0), 4% (4), 4% (4), 4% (4), and 0% (0) (Analysis 3.32). Event rates are too low to permit inference.
3.14 Women with at least one transferable embryo
This outcome refers to the number of women who had at least one embryo available for transfer, either for a fresh embryo transfer or for a freeze‐all strategy.
-
150 IU versus 100 IU (OR 2.33, 95% CI 1.53 to 3.55; N = 521; 1 study; Analysis 3.14). This suggests that if the chance of a having at least one embryo for transfer with 100 IU is 69%, then the chance with 150 IU would be significantly higher: 77% to 89%.
-
The rate (SEs) of women with at least one transferable embryo across the five dose groups were 91% (6), 88% (6), 92% (6), 79% (8), and 96 (4) (Analysis 3.33). No dose‐response is evident, and the second highest dose group appears to have fewer women with transferable embryos.
3.15 Total dose of FSH
-
150 IU versus 100 IU. The total dose of FSH administered was higher among women administered a higher daily dose of FSH (MD IU 345.00, 95% CI 280.34 to 409.66; N = 521; Analysis 3.15).
-
In the multiple‐dosing study, mean total doses (SDs) were 51.8 (11.2), 64.0 (14.3), 71.3 (16.1), 81.1 (13.7), and 100.0 (14.7) (Analysis 3.34). It is not possible to carry out any robust analysis using these summary measures, although we note tentatively that the mean total dose decreases across the groups.
We would urge caution in relation to this outcome, however, as it is not possible to account for the effect of censoring due to cancelled cycles.
3.16 Duration of FSH administration
-
150 IU versus 100 IU. The pooled results demonstrate that the duration of FSH administration was less in women administered the higher dose (MD days −1.40, 95% CI −1.91 to −0.89; N = 521; 1 study; Analysis 3.16).
-
In the multiple‐dosing study, mean days stimulated (SDs) were 10 (2.2), 9.3 (2.1), 8.3 (1.9), 7.9 (1.3), and 8.3 (1.2) (Analysis 3.35). It isn't possible to carry out any robust analysis using these summary measures, although we note tentatively that the mean duration decreases across the first four groups.
We would urge caution in relation to this outcome however, as it is not possible to account for the effect of censoring due to cancelled cycles.
3.17 Cost per woman randomized
None of the studies in predicted high responders reported this outcome according to the review outcomes; however, the outcome was available for Oudshoorn 2017, which reported that the total cost was similar in women administered 150 IU compared to those given 100 IU (EUR 4714 versus EUR 4622; MD EUR −92, 95% CI −479 to 325).
ORT‐algorithm studies
4. ORT‐based algorithm compared to standard dose OR non‐ORT algorithm
Five studies were included in this comparison: four comparing an ORT‐based algorithm to a standard dose of 150 IU (Nyboe Andersen 2017; Olivennes 2015; Oudshoorn 2017; Popovic‐Todorovic 2003), and one comparing an ORT‐based algorithm to an algorithm that did not use any ORT (Allegra 2017; summary of findings Table for the main comparison). We created one of these trials by merging results from two other trials (three dose comparisons) reported in comparisons one and three (Oudshoorn 2017; Van Tilborg 2017), and we reference it here as Oudshoorn 2017.
As the trials in this comparison display considerable protocol heterogeneity, with different algorithms tested in each, we would advise the reader to interpret pooled estimates loosely as summaries of the existing studies, rather than as unified estimates of underlying treatment effects.
Primary outcomes
4.1 Live birth or ongoing pregnancy
Data on live births were available for three studies (Nyboe Andersen 2017; Olivennes 2015; Oudshoorn 2017), and one study reported ongoing pregnancy (Popovic‐Todorovic 2003). There was no clear evidence of a difference between the groups in live birth rate (OR 1.04, 95% CI 0.88 to 1.23; N = 2823; 4 studies; I2 = 34%; Analysis 4.1; Figure 9). This suggests that if the chance of live birth with a standard dose is 26%, the chance with dosing based on an ORT‐algorithm would be between 24% and 30%. We graded the body of evidence as moderate quality.

Forest plot of comparison: 4 ORT‐based algorithm vs standard dose or non‐ORT based algorithm, outcome: 4.1 Live birth or ongoing pregnancy per woman randomised.
4.2 Severe OHSS
The occurrence of severe OHSS was reported or confirmed following author correspondence for four studies (Allegra 2017; Olivennes 2015; Oudshoorn 2017; Popovic‐Todorovic 2003). A fifth study only provided OHSS for the combined outcome of moderate/severe, and it was not possible to obtain the number of severe events (Nyboe Andersen 2017). We are unable to comment on the effects on severe OHSS, since there was a total of only nine events across two studies, and we graded the body of evidence as low quality; therefore, we refrain from interpreting these results further (Analysis 4.2).
-
ORT‐based algorithm versus 150 IU (Peto OR 0.54, 95% CI 0.14 to 1.99; N = 1494; 3 studies; I2 = 0%).
-
ORT‐based algorithm versus non ORT‐based algorithm: no events (Allegra 2017).
Secondary outcomes
4.3 Clinical pregnancy
There did not appear to be any substantial difference in the rate of clinical pregnancy when comparing an ORT‐based algorithm to a standard dose of 150 IU (OR 0.96, 95% CI 0.82 to 1.13; N = 2823; 4 studies; I2 = 11%), but there was greater uncertainty when comparing to a non‐ORT based algorithm (OR 0.88, 95% CI 0.48 to 1.61; N = 194; Analysis 4.3). This suggests that if the chance of clinical pregnancy with a standard dose of 150 IU is 32%, the chance with dosing based on an ORT‐algorithm would be between 28% and 35%, and if the chance with a non‐ORT based algorithm is 33%, then the chance with an ORT‐based algorithm would be between 19% and 45%. We graded the body of evidence as moderate quality.
4.4 Time to clinical pregnancy
None of the studies reported this outcome (Oudshoorn 2017 reported the time to ongoing pregnancy, but not time to clinical pregnancy).
4.5 Moderate or severe OHSS
The pooled evidence suggested that the use of an ORT‐based algorithm reduced the incidence of moderate or severe OHSS when compared to a standard dose of 150 IU (Peto OR 0.58, 95% CI 0.34 to 1.00; N = 2823; 4 studies; I2 = 0%), but there were no events observed when comparing to a non‐ORT algorithm (not estimable, 0 events in each arm, 1 study; Analysis 4.5;Figure 10). This suggests that if the chance of moderate or severe OHSS with a standard dose is assumed to be 2.5%, the chance with dosing based on an ORT‐algorithm would be between 0.8% and 2.5%. We graded the body of evidence as low quality.

Forest plot of comparison: 4 ORT‐based algorithm vs standard dose or non‐ORT based algorithm, outcome: 4.5 Moderate or severe OHSS.
4.6 Multiple pregnancy in randomized women
There was insufficient evidence to determine whether there was a difference in the rate of multiple pregnancies when comparing a standard dose of 150 IU to an ORT‐based algorithm, although the confidence interval was consistent with small effects in either direction (Peto OR 0.77, 95% CI 0.43 to 1.36; N = 2823; 4 studies; I2 = 0%; Analysis 4.6). This suggests that if the chance of multiple pregnancy with a standard dose is 2.0%, the chance with dosing based on an ORT‐algorithm would be between 0.9% and 2.7%. We also calculated the data as multiple pregnancy in women with clinical pregnancy, with similar results (Analysis 4.20). The trial comparing an ORT‐based algorithm to a non‐ORT based algorithm did not report this outcome (Allegra 2017).
4.7 Number of oocytes retrieved per woman randomized
These are mean differences on the log scale and should not be misinterpreted as numbers of eggs.
All five trials reported this outcome (Analysis 4.7). There is evidence of a higher number of oocytes retrieved in women using an ORT‐based algorithm compared to a standard dose of 150 IU (log(MD) oocytes 0.16, 95% CI 0.11 to 0.20; N = 1770; 4 studies, I2 = 99%). However, the heterogeneity is very high, with different studies reporting effects in different directions, indicating that there is scope for substantial variation according to the particular algorithm used and/or the characteristics of the treated population.
The estimate of the effect of ORT‐based versus non‐ORT‐based algorithm suggests that there are probably higher numbers of oocytes for the former compared to the latter (log(MD) oocytes 0.12, 95% CI −0.02 to 0.26, N = 194), although the magnitude of the difference is unclear given the width of the CI.
4.8 Poor response to stimulation
This outcome was available for three studies, which defined a poor response as the retrieval of fewer than five oocytes (Popovic‐Todorovic 2003), fewer than nine oocytes (Allegra 2017), and either cycle cancellation for poor response or the retrieval of fewer than five oocytes (Oudshoorn 2017). The pooled effect would be consistent with a small decrease or anything up to a substantial increase in the probability of poor response under an ORT‐algorithm compared to standard dosing; however, the heterogeneity is very high (OR 1.16, 95% CI 0.90 to 1.50; N = 1294; 2 studies; I2 = 89%; Analysis 4.8). By contrast, the probability of poor response was reduced under an ORT‐algorithm compared to a non‐ORT algorithm; however, the magnitude of the reduction is imprecise (OR 0.50, 95% CI 0.27 to 0.92; N = 194; Analysis 4.8; Allegra 2017).
This suggests that if the chance of a poor response with a standard dose is 26%, then the chance with ORT‐algorithm dosing would be between 24% and 34%. Further, if the chance of retrieving eight or fewer oocytes with a non‐ORT algorithm was 40%, then the chance with ORT‐algorithm dosing would be between 16% and 38%.
Another study reported the total number of women experiencing either a poor or hyper‐response as an aggregate outcome and declined to provide the number of women experiencing a poor response and hyper‐response separately (Nyboe Andersen 2017).
4.9 Normal response to stimulation
Four studies reported this outcome and defined a normal response as retrieval of 5 to 14 oocytes (Popovic‐Todorovic 2003), 5 to 15 oocytes (or cycle cancellation for any reason other than a poor or hyper‐response) (Oudshoorn 2017), and 8 to 14 oocytes (Allegra 2017; Nyboe Andersen 2017).
The pooled effect suggested an increase in the probability of a normal response to stimulation when using an ORT‐algorithm compared to standard dosing (OR 1.22, 95% CI 1.04 to 1.43; N = 2623; 3 studies; I2 = 0%; Analysis 4.9) or non‐ORT algorithm dosing (OR 2.13, 95% CI 1.20 to 3.78; N = 194; Analysis 4.9; Allegra 2017). This suggests that if the chance of having a normal response with a standard dose is 45%, then the chance with ORT‐algorithm dosing would be between 46% and 54%, and further, if the chance with a non‐ORT algorithm was 42%, then the chance with ORT‐algorithm dosing would be between 47% and 74%.
4.10 Hyper‐response to stimulation
This outcome was available for three studies. All defined a hyper‐response as 15 or more oocytes retrieved (Allegra 2017; Popovic‐Todorovic 2003; Oudshoorn 2017; Analysis 4.10).
The use of an ORT‐algorithm appeared to reduce the number of women with a hyper‐response compared to a standard dose of 150 IU; however, heterogeneity was high (OR 0.56, 95% CI 0.42 to 0.76; N = 1294; 2 studies; I2 = 81%). There was insufficient evidence to determine whether there was any difference between the groups when comparing an ORT‐based algorithm to a non‐ORT based algorithm (OR 0.57, 95% CI 0.25 to 1.31; N = 194; Allegra 2017). This suggests that if the chance of having a hyper‐response with a standard dose is 21%, then the chance with ORT‐algorithm dosing would be between 9.8% and 16%, and further, if the chance with a non‐ORT algorithm was 17%, then the chance with ORT‐algorithm dosing would be between 4.9% and 21%.
As described above, we were unable to clarify this outcome, which appears to have been recorded but not reported for one study (Nyboe Andersen 2017).
4.11 Cycle cancellations for poor response
Cycle cancellation due to poor response was an uncommon event, so the effect estimates are imprecise when comparing an ORT‐based algorithm to a standard dose of 150 IU (OR 1.19, 95% CI 0.89 to 1.60; N = 2823; 4 studies; I2 = 0%; Analysis 4.11), or a non‐ORT based algorithm (OR 0.14, 95% CI 0.01 to 2.83; N = 194; Analysis 4.11; Allegra 2017). This suggests that if the chance of having a cycle cancellation for poor response with a standard dose is 6.5%, then the chance with ORT‐algorithm dosing would be between 5.8% and 9.9%.
4.12 Cycle cancellations for hyper‐response
An ORT‐based algorithm resulted in fewer cancellations for hyper‐response than a standard dose of 150 IU (OR 0.37, 95% CI 0.24 to 0.57; N = 2823; 4 studies; I2 = 3%; Analysis 4.12). This suggests that if the chance of having a cycle cancellation for hyper‐response with a standard dose is 5.3%, then the chance with ORT‐algorithm dosing would be between 1.3% and 3.1%. However, there was insufficient evidence to determine whether there was any difference in cancellation rates for hyper‐response in the study comparing an ORT‐based algorithm with a non‐ORT based algorithm (OR 0.95, 95% CI 0.40 to 2.27; N = 194; Analysis 4.12; Allegra 2017). This suggests that if the chance of having cycle cancellation for hyper‐response with a non‐ORT algorithm is 12%, then the chance with ORT‐algorithm dosing would be between 5.2% and 24%.
4.13 Cycle cancellations for poor or hyper‐response
Cycle cancellation or freeze‐all due to hyper‐response occurred less often than cancellation for poor response, so the occurrence of cancellation for a poor response contributed more to this analysis. Overall, the pooled evidence suggested a reduced probability of cycle cancellations for either poor or hyper‐response using an ORT‐based algorithm compared to a standard dose of 150 IU (OR 0.78, 95% CI 0.61 to 1.00; N = 2823; 4 studies; I2 = 0%); however, there was no effect when comparing an ORT‐based algorithm with a non‐ORT algorithm (OR 0.73, 95% CI 0.32 to 1.69; N = 194; Allegra 2017; Analysis 4.13). This suggests that if the chance of having a cycle cancellation for poor or hyper‐response with a standard dose is 12%, then the chance with ORT‐algorithm dosing would be between 7.5% and 12%, and further, if the chance with a non‐ORT algorithm was 15%, then the chance with ORT‐algorithm dosing would be between 5.4% and 23%.
4.14 Women with at least one transferable embryo
Four studies reported this outcome, which refers to the number of women with at least one embryo available to transfer, i.e. either undergoing a fresh transfer, or having a freeze‐all (Allegra 2017; Olivennes 2015; Oudshoorn 2017; Popovic‐Todorovic 2003; Analysis 4.14). The estimate of the difference in the number of women with embryos available to transfer was imprecise and consistent with nontrivial effects in either direction when comparing an ORT‐based algorithm with a standard dose of 150 IU (OR 0.90, 95% CI 0.74 to 1.10; N = 2823; 4 studies; I2 = 0%), or a non‐ORT algorithm (OR 1.15, 95% CI 0.57 to 2.33; N = 194; Allegra 2017). This suggests that if the chance of having at least one transferable embryo with a standard dose is 84%, then the chance with ORT‐algorithm dosing would be between 80% and 85%, and further, if the chance with a non‐ORT algorithm was 79%, then the chance with ORT‐algorithm dosing would be between 68% and 90%.
4.15 Total dose of FSH
When comparing an ORT‐based algorithm to standard dose of 150 IU, the pooled mean total dose of FSH administered was lower in the ORT‐based algorithm group (MD IU −157.00, 95% CI −215.54 to −98.45; N = 1494; 3 studies; I2 = 96%; Analysis 4.15). However, the three studies included in this estimate report very different results for this outcome, and the large effect reported here is largely due to a single trial that reports a much lower total dose in the ORT‐algorithm arm (Olivennes 2015). All three trials comparing ORT‐based algorithm to 150 IU reported this outcome; however, the doses used by one study were in a drug‐specific unit (µg) that we could not pool with the other studies (which used a unit of IU). This study reported a significantly higher average total dose in women in the standard dosing arm (mean (SD) 90.0 µg (25.3) versus 103.7 µg (33.6) P < 0.001; Nyboe Andersen 2017).
In the study comparing an ORT‐based algorithm to a non‐ORT algorithm, there was no clear evidence of a difference in total dose between the two arms (MD IU−11.00, 95% CI −210.30 to 188.30; N = 194; Analysis 4.15; Allegra 2017).
Readers should treat these results with caution due to handling of censored cycle cancellations.
4.16 Duration of FSH administration
When comparing an ORT‐based algorithm to standard dose of 150 IU, the average duration of stimulation in days was slightly longer in the ORT‐based algorithm group (MD days 0.23, 95% CI 0.09 to 0.37; N = 2823; 4 studies; I2 = 14%; Analysis 4.16); however, there was no difference in days of FSH exposure when comparing an ORT‐algorithm to a non‐ORT algorithm (MD days −0.40, 95% CI −0.84 to 0.04; N = 194; Analysis 4.16; Allegra 2017).
These results should be treated with caution due to handling of censored cycle cancellations.
5. ORT‐based algorithm versus different ORT‐based algorithm
Three trials compared different ORT algorithms against each other: AMH versus AFC (Lan 2013), AFC plus AMH versus AFC alone (Magnusson 2017), and AMH plus AFC plus bFSH versus bFSH alone (Tasker 2010).
5.1 AMH‐based algorithm versus AFC‐based algorithm
One trial (N = 348) made this comparison (Lan 2013).
Primary outcomes
5.1.1 Live birth or ongoing pregnancy
The trial did not report this outcome.
5.1.2 Severe OHSS
There were no events in either study arm (Analysis 5.2).
Secondary outcomes
5.1.3 Clinical pregnancy
The confidence intervals were wide and encompassed the possibility of an effect in either direction (OR 0.82, 95% CI 0.53 to 1.27; N = 348, low‐quality evidence; Analysis 5.3). This suggests that if the chance of clinical pregnancy with an AFC algorithm is 39%, then the chance with an AMH algorithm would be between 25% and 45%.
5.1.4 Time to clinical pregnancy
The trial did not report this outcome.
5.1.5 Moderate or severe OHSS
Findings were inconclusive, but there appeared to be a higher probability of moderate or severe OHSS in those with an AMH‐based dose compared to an AFC‐based dose (Peto OR 4.28, 95% CI 0.96 to 19.07; N = 348, very low‐quality evidence; Analysis 5.5). This suggests that if the chance of moderate or severe OHSS with dosing based on AFC is 0.6%, then the chance with dosing using AMH would be between 0.6% and 9.9%.
5.1.6 Multiple pregnancy in randomized women
The confidence interval was consistent with substantial effects in multiple pregnancy rates in either direction (Peto OR 1.21, 95% CI 0.66 to 2.23; N = 348; Analysis 5.6). This suggests that if the chance of multiple pregnancy with dosing based on AFC is 13%, then the chance with dosing using AMH would be between 8.7% and 24%. We also calculated the multiple pregnancy rates per clinical pregnancy, with similar results (Analysis 5.19).
5.1.7 Number of oocytes retrieved per woman randomized
These are mean differences on the log scale and should not be misinterpreted as numbers of eggs.
There were more oocytes retrieved in women with dose‐selection using an AFC algorithm compared to an algorithm using AMH (log(MD) oocytes −0.25, 95% CI −0.37 to −0.13; N = 348; Analysis 5.7).
5.1.8 Poor response to stimulation
Findings were suggestive of a higher rate of poor response in the arm using the AMH algorithm than in the arm using an AFC algorithm, although the confidence interval crossed the line of no effect (OR 2.25, 95% CI 0.94 to 5.35; N = 348; Analysis 5.8).
5.1.9 Normal response to stimulation
This outcome was defined as the retrieval of 8 to 12 oocytes. There was no clear difference between the groups in the number of participants experiencing a normal response, but confidence intervals were wide (OR 1.38, 95% CI 0.87 to 2.17; N = 348; Analysis 5.9).
5.1.10 Hyper‐response to stimulation
This outcome was defined as more than 12 oocytes. There were fewer women with more than 12 eggs collected among those allocated to an AMH‐based algorithm, compared to an AFC‐based algorithm (OR 0.45, 95% CI 0.23 to 0.88; N = 348; Analysis 5.10).
5.1.11 Cycle cancellations for poor response
We could not draw any conclusions, as the rate of cycle cancellation for poor response was low and therefore the confidence intervals for the effect estimates are imprecise (OR 1.51, 95% CI 0.25 to 9.14; N = 348; Analysis 5.11).
5.1.12 Cycle cancellations for hyper‐response
We could not draw any conclusions, as the rate of cycle cancellation for hyper‐response was low, so the confidence intervals for the effect estimates are imprecise (OR 0.54, 95% CI 0.23 to 1.25; N = 348; Analysis 5.12). This suggests that if the chance of cycle cancellation for hyper‐response with an AFC algorithm is 9.2%, then the chance with an AMH algorithm would be between 2.3% and 11%.
5.1.13 Cycle cancellations for poor or hyper‐response
We could not draw any conclusions, as the rate of cycle cancellation for poor or hyper‐response was low, so the confidence intervals for the effect estimates are imprecise (OR 0.64, 95% CI 0.30 to 1.38; N = 348; Analysis 5.13). This suggests that if the chance of cycle cancellation for either poor or hyper‐response with an AFC algorithm is 10%, then the chance with an AMH algorithm would be between 3.3% and 14%.
5.1.14 Women with at least one transferable embryo
This outcome refers to the number of women who had at least one embryo available for transfer, either for a fresh embryo transfer or for a freeze‐all strategy. We could not draw any conclusions, as the confidence intervals are imprecise and consistent with large effects in either direction (OR 1.21, 95% CI 0.36 to 4.03; N = 348; Analysis 5.14). This suggests that if the chance of having at least one transferable embryo with an AFC algorithm is 97%, then the chance with an AMH algorithm would be between 91% and 99%.
5.1.15 Total dose of FSH
We could not draw any conclusions, as the confidence intervals are imprecise and could be consistent with small effects in either direction (MD IU −178.00, 95% CI −413.88 to 57.88, N = 348; Analysis 5.15). We would urge caution when interpreting this result, as it was not possible to account for censored data arising from cancelled cycles.
5.1.16 Duration of FSH administration
There was no clear evidence of a difference between the two dosing algorithms in the duration of FSH administration (MD 0.20 days, 95% CI −0.11 to 0.51, N = 348; Analysis 5.16). We would urge caution when interpreting this result as it was not possible to account for censored data arising from cancelled cycles.
5.2 AMH plus AFC‐based algorithm versus AFC‐based algorithm
One study (N = 308) made this comparison (Magnusson 2017).
Primary outcomes
5.2.1 Live birth or ongoing pregnancy
The confidence intervals were wide and encompassed the possibility of an effect in either direction (OR 1.18, 95% CI 0.72 to 1.93; N = 308, moderate‐quality evidence; Analysis 6.1; Figure 11). This suggests that if the chance of live birth with a ORT dosing using AFC only is 27%, then the chance with dosing based on AFC and AMH would be between 21% and 42%.

Forest plot of comparison: 6 AMH + AFC‐based algorithm vs AFC‐based algorithm, outcome: 6.1 Live birth or ongoing pregnancy.
5.2.2 Severe OHSS
Findings were inconclusive, as there were only five events in total (Peto OR 0.68 95% CI 0.12 to 4.00; N = 308, low‐quality evidence; Analysis 6.2).
Secondary outcomes
5.2.3 Clinical pregnancy
The confidence intervals were wide and encompassed the possibility of an effect in either direction (OR 1.37, 95% CI 0.84 to 2.23; N = 308, moderate‐quality evidence; Analysis 6.3). This suggests that if the chance of clinical pregnancy with ORT dosing using AFC only is 27%, then the chance with dosing based on AFC and AMH would be between 24% and 45%.
5.2.4 Time to clinical pregnancy
This outcome was not reported.
5.2.5 Moderate or severe OHSS
The confidence intervals were wide and encompassed the possibility of an effect in either direction (Peto OR 0.85 95% CI 0.26 to 2.83; N = 308, low‐quality evidence; Analysis 6.5). This suggests that if the chance of moderate or severe OHSS with a ORT dosing using AFC only is 3.8%, then the chance with dosing based on AFC and AMH would be between 1.0% and 10.0%.
5.2.6 Multiple pregnancy in randomized women
There were no multiple pregnancies in either study arm (Analysis 6.6; Analysis 6.19).
5.2.7 Number of oocytes retrieved per woman randomized
These are mean differences on the log scale and should not be misinterpreted as numbers of eggs.
There were fewer oocytes retrieved in women with dose‐selection using an AFC plus AMH algorithm compared to an algorithm using AFC only (log(MD) oocytes −0.19, 95% CI −0.31 to −0.07; N = 308; Analysis 6.7).
5.2.8 Poor response to stimulation
This outcome was defined as the retrieval of fewer than five oocytes. There were substantially more women with a poor response among those in the algorithm using AMH and AFC, compared to that using an algorithm using AFC only (OR 2.82, 95% CI 1.52 to 5.25; N = 308; Analysis 6.8).
5.2.9 Normal response to stimulation
This outcome was defined as the retrieval of 5 to 12 oocytes. There was no clear evidence of a difference between the groups in the number of participants experiencing a normal response (OR 0.71, 95% CI 0.45 to 1.12; N = 308; Analysis 6.9).
5.2.10 Hyper‐response to stimulation
This outcome was defined as more than 12 oocytes. Findings were consistent with effects in either direction (OR 0.72, 95% CI 0.43 to 1.23; N = 308; Analysis 6.10).
5.2.11 Cycle cancellations for poor response
We could not draw any conclusions, as the rate of cycle cancellation for poor response was low, so the confidence intervals for the effect estimates are imprecise (OR 1.83, 95% CI 0.53 to 6.40; N = 308; Analysis 6.11). This suggests that if the chance of cycle cancellation for poor response with a ORT dosing using AFC only is 2.6%, then the chance with dosing based on AFC and AMH would be between 1.4% and 14%.
5.2.12 Cycle cancellations for hyper‐response
We could not draw any conclusions, as the rate of cycle cancellation for hyper‐response was low, so the confidence intervals for the effect estimates are imprecise (OR 0.50, 95% CI 0.12 to 2.05; N = 308; Analysis 6.12). This suggests that if the chance of cycle cancellation for hyper‐response with a ORT dosing using AFC only is 3.8%, then the chance with dosing based on AFC and AMH would be between 0.5% and 7.6%.
5.2.13 Cycle cancellations for poor or hyper‐response
We could not draw any conclusions, as the rate of cycle cancellation for poor or hyper‐response was low, so the confidence intervals for the effect estimates are imprecise (OR 1.03, 95% CI 0.42 to 2.55; N = 308; Analysis 6.13). This suggests that if the chance of cycle cancellation for poor or hyper‐response with a ORT dosing using AFC only is 6.4%, then the chance with dosing based on AFC and AMH would be between 2.8% and 15%.
5.2.14 Women with at least one transferable embryo
This outcome refers to the number of women who had at least one embryo available for transfer, either for a fresh embryo transfer or for a freeze‐all strategy. We could not draw any conclusions, as the confidence intervals are wide and imprecise and consistent with large effects in either direction (OR 1.04, 95% CI 0.50 to 2.19; N = 308; Analysis 6.14). This suggests that if the chance of having at least one transferable embryo with ORT dosing using AFC only is 90%, then the chance with dosing based on AFC and AMH could be between 81% and 95%.
5.2.15 Total dose of FSH
We could not draw any conclusions, as the confidence intervals are wide and imprecise and consistent with small effects in either direction (MD IU 81.00, 95% CI −111.93 to 273.93, N = 308; Analysis 6.15).
We would urge caution when interpreting this result, as it was not possible to account for censored data arising from cancelled cycles.
5.2.16 Duration of FSH administration
Participants in the AMH plus AFC‐dosing algorithm had a longer duration of stimulation than those in the group using AFC‐dosing algorithm (MD days 0.50 days, 95% CI 0.10 to 0.90, N = 308; Analysis 6.16).
We would urge caution when interpreting this result, as it was not possible to account for censored data arising from cancelled cycles.
5.3 AMH plus AFC plus bFSH‐based algorithm versus bFSH‐based algorithm
One study (N = 286) made this comparison (Tasker 2010).
Primary outcomes
5.3.1 Live birth or ongoing pregnancy
Findings were inconclusive but were suggestive of a lower event rate in the AMH plus AFC plus bFSH group (OR 0.54, 95% CI 0.28 to 1.04; N = 215, very low‐quality evidence; Analysis 7.1). This suggests that if the chance of live birth with dosing based on bFSH is 28%, then the chance with dosing using AMH, AFC and bFSH would be between 10% and 29%. However, readers should treat this result with caution, as the review team extracted the data from individual participant data, which had substantial amounts of missingness.
5.3.2 Severe OHSS
The trial did not report this outcome.
Secondary outcomes
5.3.3 Clinical pregnancy
The clinical pregnancy rate appeared to be lower in the participants having dose‐selection based on an algorithm using AMH, AFC and bFSH (OR 0.51, 95% CI 0.28 to 0.93; N = 215, very low‐quality evidence; Analysis 7.3). This suggests that if the chance of clinical pregnancy with dosing based on bFSH alone is 36%, then the chance with dosing using AMH, AFC, and bFSH would be between 14% and 35%.
5.3.4 Time to clinical pregnancy
The trial did not report this outcome.
5.3.5 Moderate or severe OHSS
The trial did not report this outcome.
5.3.6 Multiple pregnancy in randomized women
The trial did not report this outcome.
5.3.7 Number of oocytes retrieved per woman randomized
There was no clear difference between the groups in the average number of oocytes retrieved (log(MD) oocytes −0.20, 95% CI −0.81 to 0.41; N = 215; Analysis 7.7).
5.3.8 Poor response to stimulation
This outcome was defined as the retrieval of fewer than five oocytes. We could not draw any conclusions, as the confidence intervals are wide and imprecise (OR 1.46, 95% CI 0.77 to 2.79; N = 215; Analysis 7.8).
5.3.9 Normal response to stimulation
This outcome was defined as the retrieval of 5 to 14 oocytes. There was no clear evidence of a difference between the groups (OR 0.75, 95% CI 0.42 to 1.35; N = 215; Analysis 7.9).
5.3.10 Hyper‐response to stimulation
This outcome was defined as retrieval of more than 14 oocytes. We could not draw any conclusions, as the confidence intervals are wide and imprecise (OR 0.93, 95% CI 0.45 to 1.93; N = 215; Analysis 7.10).
5.3.11 Cycle cancellations for poor response
The trial did not report this outcome.
5.3.12 Cycle cancellations for hyper‐response
The trial did not report this outcome.
5.3.13 Cycle cancellations for poor or hyper‐response
The trial did not report this outcome.
5.3.14 Women with at least one transferable embryo
The trial did not report this outcome.
5.3.15 Total dose of FSH
We could not draw any conclusions, as the confidence intervals are wide and consistent with small effects in either direction (MD IU −148.00, 95% CI −433.61 to 137.61, N = 215; Analysis 7.15). We would urge caution when interpreting this result, as it was not possible to account for censored data arising from cancelled cycles.
5.3.16 Duration of FSH administration
There was no clear evidence of a difference between the groups in the duration of FSH administration (MD 0.00 days, 95% CI −0.60 to 0.60, N = 215; Analysis 7.16). We would urge caution when interpreting this result, as it was not possible to account for censored data arising from cancelled cycles.
Sensitivity analyses
We stated in the Methods that we would conduct sensitivity or subgroup analyses by excluding studies with various characteristics. As the evidence was limited for most outcomes and associated with significant imprecision, most of the planned sensitivity analyses are moot; if we start with an imprecise estimate, and then take some data away, nothing additional can be learned. If we switch to a random‐effects analysis, the estimates and confidence limits for live birth change by no more than 0.01. In addition, we have presented pooled estimates for our ORT‐algorithm studies. However, these are intended not to represent estimates of underlying treatment effects, but rather summaries of the results of the individual studies. The considerable protocol variation between ORT‐algorithm studies precludes effect estimation. Contrary to popular belief, this in turn precludes random‐effects meta‐analysis.
Discussion
Summary of main results
Direct dose comparison studies
Predicted low responders
This review included five studies in predicted low responders, each testing a different combination of FSH doses against each other. Four trials reported the primary outcome 'live birth or ongoing pregnancy', and there was insufficient evidence to determine whether there was any difference in the probability of this outcome when women were randomized to multiple doses. For example, if we assume a birth rate of 11% in women treated with 150 IU, then the results of one analysis would be consistent with live birth rates as low as 3.8% or as high as 16.2% in the higher dose (300/450 IU) arm. The effect on cumulative live birth remains unknown, as it was only available for one trial (Van Tilborg 2017).
All five studies reported clinical pregnancy, and the pooled results of one comparison suggest that women administered 150 IU had a higher chance of achieving pregnancy than women administered 300 or 450 IU (albeit with imprecision). This did not translate into an increase in live birth rate, however, since in one of the trials 10 of 24 pregnancies in the lower dosing arm were subsequently lost (Van Tilborg 2017). This may or may not be attributable to chance. In the other two comparisons, sample sizes were too small to draw a conclusion.
There were no events of severe OHSS, the primary safety outcome of this review. Moreover, only one case of moderate OHSS occurred. Therefore we are unable to make any inferences about dose effects on this outcome. However, OHSS is expected to occur only very rarely in a population of women with low predicted ovarian response. Our best available surrogates are cancellation for hyper‐response (or freeze‐all) and excessive response to stimulation. Although the event rates for the former are too low to be useful, it seems reasonably clear that using 150 IU instead of higher doses reduces hyper‐response in this subgroup, as Van Tilborg 2017 reported. However, this must be balanced against the probability of cancellation for poor response, which was higher in the lower dose arms of this trial. The rate of normal response favoured the use of a higher dose of 450 IU.
Only one of the five studies in this cohort had a point estimate indicating a benefit of increasing dose on birth, such that, on balance, it appears unlikely that increasing dose will improve outcomes of live birth or OHSS in this population.
Predicted normal responders
There were nine studies included in this comparison, eight of which were available for pooling in meta‐analysis. One could not be compared to the rest, as the type of FSH used was expressed in a different unit. In a similar trend to that seen for the low responder group, there was no observed influence from higher or lower doses on the probability of live birth, OHSS or clinical pregnancy. However the estimates were imprecise and remain consistent with small effects in either direction.
It was difficult to assess the five‐arm trial for dose‐response effects on clinical outcomes, as the numbers of participants and event rates were low.
As with predicted low responders, there is evidence of effects of increasing dose on preclinical outcomes such as oocyte yield and cycle cancellation, but the evidence reported in this review does not suggest that these effects translate into differences in clinical outcomes such as live birth or clinical pregnancy (discussed further below).
Predicted high responders
There were only two studies in this comparison, one trial comparing 150 IU versus 100 IU in women with AFC or more than 15, and a five‐arm study in women with AMH between 15 pmol/L and 55 pmol/L comparing five different doses of FSH. There was no observed effect of dose reduction below 150 IU on the probability of live birth or clinical pregnancy. However, 100 IU did seem to reduce the occurrence of moderate or severe OHSS compared to 150 IU. This observed benefit from lower doses may be weighed against the disadvantages, as a reduced dose also led to the retrieval of fewer oocytes, an increased chance of cancellation for poor response, more overall cancellations, and fewer women with at least one embryo for transfer; however, these effects did not translate into a reduced probability of clinical outcomes, which could be due to a number of reasons including lack of power, as discussed further below. The event rates in the five‐arm trial are consistent with the treatment effects reported in this study.
ORT‐algorithm studies
These studies were divided into two comparisons: those comparing an ORT‐based algorithm to a standard dose of 150 IU or another algorithm which did not use ORT, and those comparing two different ORT‐based algorithms.
ORT‐based algorithm versus standard dose or non‐ORT based algorithm
There were five trials comparing ORT‐based algorithms to a standard dose of 150 IU or an algorithm not using ORT, and these studies were subgrouped according to whether the control arm was a standard dose of 150 IU or a non‐ORT based algorithm. Pooling within subgroups was conducted with the caveat that the pooled effects should be interpreted as summaries of the effects estimated in the included studies, rather than an estimate of a distinct underlying treatment effect, as the individual ORT algorithms were different.
When comparing ORT algorithms with 150 IU, on aggregate the studies probably rule out large advantages or disadvantages of ORT‐based algorithms on live birth. Point estimates for three of four studies were close to the line of null effect. For each of the two large studies in the comparison, if we were to assume a control group live birth rate of around 20%, estimated treatment group rates would not differ by more than four or five percentage points in either direction (i.e. between 15% and 25%). One trial is somewhat discordant, if not completely inconsistent, with the others, suggesting a benefit of indeterminate magnitude when using an ORT algorithm (Popovic‐Todorovic 2003). It is not possible to know whether the apparent difference in this trial proceeds from genuine superiority of the particular algorithm tested compared to the others, from effects of performance bias or selective reporting, or from chance. Further, as this trial was conducted over a decade earlier than the other trials in this comparison, the difference may be a consequence of changes in the general IVF population and in IVF techniques over time. To the extent that we consider the pooled estimate to represent a meaningful summary of this heterogeneous assortment of trials, birth rates under ORT algorithms do not appear to differ meaningfully from those resulting from a uniform fixed 150 IU dose. There were too few cases of severe OHSS to discuss effects on this outcome. If we extended our definition to include both moderate and severe cases, however, then ORT algorithms were consistently associated with reduced OHSS. This subjective outcome might be particularly prone to performance and detection biases arising from a lack of blinding.
Only one study compared an ORT‐based algorithm with a non‐ORT algorithm, which used only age. The authors found that the ORT algorithm increased the number of oocytes retrieved, reduced the probability of a poor response, and increased the probability of a normal response (with the caveat that the definition of 'normal response' was not prespecified, which probably would have changed the inference of the trial). However, there were insufficient events to determine effects on either pregnancy or OHSS, with no moderate or severe cases in either arm.
ORT‐based algorithm versus different ORT‐based algorithm
Three studies were included in the comparison of different approaches to ORT‐based dosing (e.g. AMH versus AFC).
There was insufficient evidence of differences in live birth rate between an AFC‐only algorithm and another using both AMH and AFC (Magnusson 2017), although the results would be consistent with advantages of either. Any possible disadvantage of adding AMH to the algorithm would be small (and counterintuitive), however. The clinical pregnancy results supported these observations. There were too few moderate or severe OHSS events to assess which algorithm was safer in this regard.
Another study suggested a disadvantage of adding AMH and AFC to basal FSH to select dose, in relation to clinical pregnancy and birth (Tasker 2010). These results constitute very weak evidence, however, as we pieced them together from an incomplete data set with a higher portion of missing data, and therefore we do not interpret them further.
A third study compared AMH and AFC‐based dose selection. Live birth was not reported, and the clinical pregnancy estimate was imprecise (Lan 2013). However, the upper confidence limit suggested at most a small advantage of AMH compared to AFC in this regard, and potentially a large disadvantage. Investigators did not observe any severe OHSS, although there may have been an advantage of indeterminate magnitude of AFC in relation to moderate OHSS; however, this was based on only a few events.
Across all comparisons, we found no impact of dosing on the probability of multiple pregnancy, although estimates were too imprecise to rule anything out.
Overall completeness and applicability of evidence
Applicability of the evidence
There were 20 trials included in this review investigating the utility of tailoring FSH doses based on individual ORT measures. Unfortunately, the included studies varied in their design, restricting meta‐analysis to subgroups within comparisons, with the caveat that these pooled estimates are unlikely to represent unified underlying treatment effects due to clinically heterogeneous trials. For example, in comparison one, all five included studies compared unique combinations of doses of FSH.
Across the first three comparisons investigated (direct dose comparison studies investigating effects of different doses in different populations), there were apparent effects of increasing dose on the 'upstream' outcomes of IVF, including:
-
oocyte yield, in terms of the average number of oocytes retrieved (although effect sizes were variable and often reasonably modest – e.g. an MD of 0.3 on the log scale translates to about a 1.3 factor increase, or the difference between six and eight eggs);
-
the number of women categorised as having either a poor (e.g. fewer than 5 oocytes), normal, or hyper‐response (e.g. more than 15 oocytes);
-
the chance of cycle cancellation for either a poor or hyper‐response; and
-
the probability of women having at least one embryo available for transfer (or freezing).
Importantly, demonstrable effects on these outcomes fall short of demonstrating effects on clinical outcomes. In the (larger) ORT‐algorithm studies, we also saw apparent effects on upstream outcomes but were able to get a slightly better idea of the (lack of) effects on live birth compared to uniform 150 IU dosing. It is impossible to establish how much of the observed variation was attributable to the particular algorithm used in each trial, however.
There are a number of possible reasons as to why effects on these upstream outcomes did not apparently translate into effects on clinical outcomes, namely live birth and pregnancy.
First of all, detection of treatment effects on relatively common events (such as having an embryo available for transfer) or on continuous outcomes (such as average number of oocytes retrieved) is possible with smaller sample sizes than those required to detect treatment effects for rarer binary outcomes, such as live birth. Underpowering for the primary outcomes of this review in the individual direct dose comparison studies is not surprising, as many of these studies appear to have been designed to answer mechanistic research questions, so they based sample size on preclinical outcomes such as the number of oocytes retrieved (e.g. Arce 2014; Harrison 2001; Klinkert 2005; Lefebrve 2015). While ORT‐algorithm studies were larger, they were often powered on the basis of reasonably large effect sizes for the outcome of pregnancy or live birth, such as 15% or more (e.g. Magnusson 2017), or else they were designed only to be pilot studies (e.g. Lan 2013).
Secondly, most included studies only assessed the outcome of pregnancy (and birth) following a fresh embryo transfer, and only a few trials reported cumulative rates (following the transfer of a fresh and all frozen embryos). This is important because it could be that an increased dose of FSH leads to higher freeze‐all rates for excessive response, as was observed in a number of comparisons among predicted normal and high responders. In most of the included studies, women with freeze‐all cycles were not given an opportunity to conceive in the study because the result of the first frozen transfer was not captured. Further, a higher dose of FSH may yield more oocytes and therefore more embryos for frozen transfer (in addition to any fresh transfer). However, the utility of having extra candidate embryos for transfer remains uncertain, since the included studies did not test the probability of these leading to a live birth in a frozen cycle. It was for this reason that this review captured the outcome 'women with at least one transferable embryo' which was a count of the women who either underwent fresh embryo transfer or who had a freeze‐all cycle (for any reason). However, the limitations remain that this outcome does not consider the number of transferable embryos each women had, and further, that an outcome related to the number of embryos remains a surrogate, rather than a clinically important, outcome. This review did not capture the outcome of 'number of transferable embryos', which may have provided an indication of whether higher observed rates of hyper‐response and freeze‐all in the higher dosing arms resulted in a higher number of embryos available for transfer. However, ultimately, availability of more embryos (for transfer or freezing) does not definitively lead to a higher chance of pregnancy and live birth (as discussed below).
The above two points suggest that there may be an unobserved but true effect from individual dose selection on the outcome of live birth. It is worth emphasising that there may not be any association between upstream outcomes (e.g. increased number of oocytes or cycle cancellation) and the probability of pregnancy or live birth. Previous observational research has suggested that the optimum number of oocytes retrieved during an IVF cycle is between 5 and 15, and the retrieval of 20 or more oocytes reduces the probability of pregnancy from a fresh IVF cycle (Sunkara 2011). However, it does not necessarily follow that, for example, if a women has four oocytes collected in her first cycle, that she will benefit from an increased number of oocytes retrieved in her second cycle (which may or may not be achieved by increasing her FSH dose). This correlation is only an observation that women who do obtain between 5 and 15 oocytes at retrieval have a higher probability of pregnancy and live birth.
Another possible reason for the observed effect on upstream outcomes but not clinical outcomes is that the increased FSH dose, possibly in combination with excess oestrogen production in the ovaries, can have a detrimental effect on the quality of the endometrium, reducing its receptivity and therefore the probability of implantation (Bourgain 2003; Kolibianakis 2002). Such suggestions have led to the increasing implementation of the freeze‐all strategy as routine, whereby all embryos are frozen for transfer in a subsequent non‐stimulated cycle (Wong 2017). Indeed, the aforementioned observational study excluded cycles in which a freeze‐all strategy was employed (Sunkara 2011).
Moreover, there may be an additional effect of increased FSH dosing on the oocytes themselves, and subsequently on the number and quality of embryos available for transfer (or freezing). In one study included in this review, increasing doses of FSH led to increased oocyte yield but simultaneously reduced the fertilisation rate, resulting in fewer blastocysts per oocyte (Arce 2014). Similar trends were apparent in other included studies (Harrison 2001; Hoomans 2002). Several studies have demonstrated an effect of increasing FSH dose on the oocyte quality and aneuploidy rate in animal models (McGowan 1985; Roberts 2005; Sugano 1997). However, research has not consistently detected the same effect in humans (La Marca 2017; Labarta 2017; Ting 2009). This reinforces the need for caution regarding the use of surrogate outcomes such as the number of oocytes retrieved or the number of women achieving a 'normal response', which is commonly used as a primary outcome in IVF trials (Arce 2014; Bastu 2016; Jayaprakasan 2010; Klinkert 2005; Lan 2013; Lefebrve 2015; Magnusson 2017).
Finally, the role of performance bias is also a relevant consideration, as many of these upstream outcomes (e.g. number of oocytes retrieved, cycle cancellation) can be prone to bias arising from the clinician's knowledge of trial allocation. This could contribute to the treatment effects observed for these outcomes (however, this is equally likely to affect the primary outcome of live birth).
Applicability of different trial designs
There were two different trial designs included in this review:
-
Direct dose comparison studies: recruiting a subgroup of women based on an ORT measure (e.g. AFC of 0 to 7) and randomising them to two or more doses of FSH (e.g. 450 IU versus 150 IU).
-
ORT‐algorithm studies: recruiting a more general group of women, and randomising them to dose selection based on their individual ORT measure compared to either a standard dose, an algorithm not using an ORT, or a different ORT‐based algorithm (e.g. AMH‐based algorithm versus 150 IU).
Direct dose comparison studies answer the following question: in women within a given ORT range, do different doses result in better outcomes? The interpretation of these studies is simple and directly applicable to practice. ORT‐algorithm studies instead answer the question of whether an algorithm that assigns women to doses of FSH according to their ORT is better than giving everyone the same dose (or alternatively, than using a different algorithm). The general applicability of ORT‐algorithm trial results to practice is less clear. Many of the ORT‐algorithm studies compared an ORT‐based algorithm to the consistent administration of 150 IU. In practice, clinicians often tailor the FSH dose to some extent, based on characteristics such as age, presence of PCOS, and response to stimulation in previous cycles. Only one study, Allegra 2017, considered the value of using ORT to tailor the dose, compared to tailoring the dose without ORT (specifically on the basis of age). The review therefore provides limited information about the comparative effectiveness of ORT dosing compared to routine practice. Moreover, all of the ORT‐algorithm studies excluded women with PCOS, who are known to be at higher risk of hyper‐response (Aljawoan 2012), and one study specifically excluded women who had previous poor or hyper‐response to ovarian stimulation (Olivennes 2015). Many of the study cohorts are therefore unlikely to be representative of typical subfertile populations. However, the exclusion of PCOS women from these trials is sensible, as they are known to respond variably and usually excessively to ovarian stimulation. This matters in the context of this review, since there are reasons to expect individualisation to be more or less effective depending on a woman's ovarian reserve (Arce 2014). On balance, however, we decided not to downgrade the assessed quality of the evidence due to this apparent indirectness, as the extent of the indirectness varies depending on the clinical practice within different fertility clinics.
Heterogeneity in studied populations
We also note that ORT values of women classified as predicted low, normal, or high responders varied between the studies. For example in the low‐responder population the median AFC in two sub‐studies was 3 (Bastu 2016; Van Tilborg 2017), while in another two studies it was 9 (Lefebrve 2015). Further, we permitted the definition of a population subgroup (low, normal, or high responders) on the basis of one or more ORT measures, specifically: AMH, AFC, or bFSH. Extensive literature indicates that these measures are not equally useful for predicting response to stimulation; AMH appears be superior to AFC, and both appear to be superior to bFSH (Broekmans 2006; Broer 2013a; Broer 2013b; Broer 2014). Additionally, and as mentioned below, we included any trials comparing different FSH doses, so long as the trial population could be categorised as predicted: low, normal, or high responders based on available ORT data. This may have led to the inclusion of studies with more clinically heterogeneous populations. For example, a study that we included in the comparison in 'predicted low responders' because all bFSH of more than 8.5 IU/L (for example, Harrison 2001) would include more clinically diverse women than a study defining their trial population as women with AFC of 0 to 7 (Van Tilborg 2017). Indeed, most of the trials in the normal responder category defined their trial population on the basis of bFSH alone, so these trials are likely to contain a mixture of normal and high responders as per AFC and AMH (however, we do not have this information). Further, the different ORT measures have other strengths and weaknesses other than their predictive capacities. The strength of AMH is the investigator‐independence and stability, and limitations include the use of different assays and difficulty in translating values between assays (Broer 2014). The strength of AFC is that it is easily measured during other routine ultrasound assessment and thus has limited additional cost; however, the weakness is the potential for inter‐observer variation.
Often, this clinical and design heterogeneity between trials might be expected to strengthen the external validity of the review. In this case, however, since we usually observed only one trial comparing any particular pair of interventions, differences between populations serve as an unwelcome source of between‐study confounding. Despite this, we made a post hoc decision to pool a number of these trials, and this may contribute to the observed statistical heterogeneity in several of the review outcomes, especially average number of oocytes retrieved and total dose and duration of FSH administration. Moreover, this is a research question where the ORT values used to classify women are crucial, since it is the utility of these thresholds for the purpose of matching people to doses that is under investigation. This heterogeneity is a clear barrier to making a unified judgement regarding the effectiveness and safety of ORT dosing.
Uncertainty regarding safety
There is an expectation that ORT‐based dosing might reduce incidence of OHSS. Because event rates were so low, this review provides little information about this outcome, especially for the case of severe OHSS. However, it appears that using ORT algorithms may, in general, reduce the incidence of OHSS. However, the effect size remains unclear, and high‐quality analyses of large observational data sets may be needed to fill this gap.
Quality of the evidence
Evidence quality ranged from very low to moderate. The main limitations were imprecision and risk of bias associated with lack of blinding.
We conducted GRADE assessments for the main review comparisons; for effects of increasing dose in predicted low, normal, and high responders; and for ORT algorithm versus dosing without ORT. We did this separately for the outcomes live birth, moderate and severe OHSS, and clinical pregnancy. Our assessments were generally consistent across the comparisons: we considered quality of evidence to be low for live birth for all comparisons except for comparison 4 (ORT algorithms versus dosing without ORT), where we judged the evidence to be of moderate quality. We downgraded live birth in all comparisons for high risk of bias in the individual studies. We were particularly concerned about performance bias due to a lack of blinding in many of the studies. Patients are monitored during ovarian stimulation, and clinicians make judgements about dose adjustments and about whether or not to cancel IVF cycles that are not going well. There is clearly scope for knowledge of treatment assignment to influence these decisions. There was some evidence of this in one included trial, where a greater proportion of under‐performing cycles were cancelled in the 150 IU compared to the individualised (higher dose) arm (Van Tilborg 2017). The trial authors hypothesised that the treating clinicians were more likely to cancel the cycle of women on a lower dose of FSH than in women with a higher FSH dose. In most comparisons we further downgraded for imprecision; confidence intervals were so wide as to be consistent with a plurality of plausible scenarios.
We considered the evidence to be of very low quality for the outcome of OHSS (moderate and severe) for all comparisons, since there were very few cases, so the effects of individualised dosing on this outcome were often unclear. However, using an ORT‐based algorithm does appear to reduce the probability of moderate or severe OHSS compared to a standard dose of 150 IU.
We considered the evidence relating to clinical pregnancy to be of low quality for all dose comparisons, and moderate quality for comparisons of ORT algorithms versus dosing without ORT; limitations were risk of bias and imprecision (as for live birth).
Potential biases in the review process
We conducted a comprehensive search with the help of an experienced Trials Search Co‐ordinator, as well as extensive manual searching in an effort to retrieve all eligible studies; however, it remains possible that we may not have identified unpublished studies. We did identify one study that was published only as a conference abstract (Tasker 2010). We were unable to construct a funnel plot to investigate the possible extent of publication bias because fewer than 10 studies were available for all comparisons.
Although we contacted authors for additional information, we could not obtain all of the requested information, either because some trial authors did not provide this, or because we did not receive any reply to our queries. This may have introduced bias due to the inclusion of trials with insufficient information. Furthermore, there remains the potential for study authors to provide inaccurate information and overly positive answers.
It was difficult to decide on the structure of this review at the protocol stage (without knowing the types of studies or comparisons that would be included), so we planned to analyse each combination of protocols separately (e.g. for direct dose comparison studies: 150 IU versus 300 IU separate from 150 IU versus 450 IU, and for ORT‐algorithm studies: AMH‐based individualisation versus bFSH‐based individualisation, and AMH‐based individualisation versus AFC‐based individualisation, etc.). It would not be meaningful to pool trials investigating different combinations of biomarkers in their study arms (for example, pooling a study of AMH‐based individualisation versus bFSH‐based individualisation with a study of AFC‐based individualisation versus bFSH‐based individualisation). At the outset of the review, we planned to pool only direct dose comparison trials that compared the same doses against one another. However, while conducting the review we found that most of the included studies had compared different dose sets, which made pooling impossible and limited the utility of the data. Therefore, we made a post hoc decision to pool studies in which the comparator dose (lower dose for predicted low and normal responders, and higher dose for predicted high responders) was the same (only within the same predicted response group). For example, in poor responders we pooled a trial comparing 150 IU versus 300 IU with a trial comparing 150 versus 450 IU. This is a major deviation from the protocol. Further, and of minor consequence, we decided to display all outcome data within a predicted response category on the same forest plots to streamline the review and improve visibility of trial results. As a consequence, review comparisons appear as 'subgroup' results (corresponding to different dose combinations) and are reported in the 'Summary of findings' tables. This is not normally recommended. However, after considering many possible configurations, we settled on the scheme presented here as the clearest way to present this complex review.
We also made other more minor post hoc decisions during the review process. For example, we decided to use the Peto OR for analysing multiple pregnancy data, as this outcome occurred at lower rates than anticipated. Another post hoc and arbitrary decision was to avoid the interpretation of treatment effects when there were five or fewer events in both trial arms.
As described previously, this review included two types of studies (direct dose comparison and ORT‐algorithm studies) that answer different questions regarding the utility of individualised FSH dosing, and some may view the inclusion of direct dose comparison studies as only indirectly addressing the review aims.
Agreements and disagreements with other studies or reviews
Although there is a lot of literature regarding the predictive ability of ORT measures and the association between increased dose and outcomes, we are aware of only one similar review of randomized controlled trials (Van Tilborg 2016). This review was also a systematic review on the same topic and included seven studies. The discrepancy between the number of included studies in Van Tilborg 2016 and our review appears largely due to differences in trial eligibility; the eligibility criteria in the other review was randomized trials "in which ORTs were used to determine the gonadotrophin starting dose", which resulted in the exclusion of some trials that we considered eligible. For example, we included studies that measured at least one ORT on all participants and provided the descriptions (e.g. mean and SD), as long as the study population could be reasonably categorised into predicted low, normal, or high responders. In contrast, Van Tilborg 2016 excluded these trials (e.g. Cavagna 2006; Hoomans 2002; Out 2004; YongPYK 2003). Additionally, this earlier review performed the literature search across only three databases, which may be the reason that review authors did not identify Tasker 2010 (a conference abstract) or Lan 2013. Further, although the review aimed to include only randomized studies, it did include one quasi‐randomised study that we excluded based on author correspondence explaining that participants were allocated to trial arms based on their patient number rather than a truly random sequence (Berkkanoglu 2010).
These review authors elected not to pool any of the studies due to clinical and methodological heterogeneity of the studies, which we also encountered and was the reason that we only pooled some subgroups of studies in this review. Lack of author correspondence also led to different risk of bias judgements between the reviews, as we were able to obtain further clarification. Additionally, some of the outcomes for included studies differed, as we made adjustments to outcomes that were not reported appropriately according to the intention‐to‐treat principle. For example, we adjusted for censoring of the number of oocytes collected, which was commonly reported with the denominator of number of women reaching oocyte retrieval rather than the denominator of number of women randomized. Despite these differences and the additional trials included in our more recent review, the conclusions are similar. Both reviews state that there appears to be some benefit from individualising on upstream outcomes such as rates of hyper‐response and the number of oocytes retrieved, but information on the most important clinical outcomes is limited. In light of recently published studies, we go slightly further than this by pointing out that differences in birth rates according to use of ORT are probably no more than a few percentage points, but OHSS risk may be reduced by ORT algorithms. Both reviews stated that most of the evidence is of low quality.
A similar author team has also conducted another review focusing on different doses in women under the age of 39 but not considering any ORT (Sterrenburg 2011).

Study flow diagram.

Risk of bias summary: review authors' judgements about each risk of bias item for each included study.

Risk of bias graph: review authors' judgements about each risk of bias item presented as percentages across all included studies.

Forest plot of comparison: 1 Anticipated low responders: higher vs lower dose, outcome: 1.1 Live birth or ongoing pregnancy per woman randomised.

Forest plot of comparison: 2 Anticipated normal responders: higher vs lower dose, outcome: 2.1 Live birth or ongoing pregnancy.

Forest plot of comparison: 2 Anticipated normal responders: higher vs lower dose, outcome: 2.21 Dose‐response: live birth or ongoing pregnancy.

Forest plot of comparison: 3 Anticipated high‐responders: higher vs lower dose, outcome: 3.1 Live birth or ongoing pregnancy.

Forest plot of comparison: 3 Anticipated high‐responders: higher vs lower dose, outcome: 3.21 Dose‐response: live birth or ongoing pregnancy.

Forest plot of comparison: 4 ORT‐based algorithm vs standard dose or non‐ORT based algorithm, outcome: 4.1 Live birth or ongoing pregnancy per woman randomised.

Forest plot of comparison: 4 ORT‐based algorithm vs standard dose or non‐ORT based algorithm, outcome: 4.5 Moderate or severe OHSS.

Forest plot of comparison: 6 AMH + AFC‐based algorithm vs AFC‐based algorithm, outcome: 6.1 Live birth or ongoing pregnancy.

Comparison 1 Anticipated low responders: higher vs lower dose, Outcome 1 Live birth or ongoing pregnancy.

Comparison 1 Anticipated low responders: higher vs lower dose, Outcome 2 Severe OHSS.

Comparison 1 Anticipated low responders: higher vs lower dose, Outcome 3 Clinical pregnancy.

Comparison 1 Anticipated low responders: higher vs lower dose, Outcome 5 Moderate or severe OHSS.

Comparison 1 Anticipated low responders: higher vs lower dose, Outcome 6 Multiple pregnancy in randomised women.

Comparison 1 Anticipated low responders: higher vs lower dose, Outcome 7 Log(N oocytes retrieved); data presented on the log scale ‐ cannot interpret pooled estimates as N of oocytes.

Comparison 1 Anticipated low responders: higher vs lower dose, Outcome 8 Poor response to stimulation.

Comparison 1 Anticipated low responders: higher vs lower dose, Outcome 9 Normal response to stimulation.

Comparison 1 Anticipated low responders: higher vs lower dose, Outcome 10 Hyper‐response to stimulation.

Comparison 1 Anticipated low responders: higher vs lower dose, Outcome 11 Cycle cancellations for poor response.

Comparison 1 Anticipated low responders: higher vs lower dose, Outcome 12 Cycle cancellations for hyper‐response.

Comparison 1 Anticipated low responders: higher vs lower dose, Outcome 13 Cycle cancellations for poor or hyper‐response.

Comparison 1 Anticipated low responders: higher vs lower dose, Outcome 14 Women with at least one transferable embryo.

Comparison 1 Anticipated low responders: higher vs lower dose, Outcome 15 Total dose of FSH.

Comparison 1 Anticipated low responders: higher vs lower dose, Outcome 16 Duration of FSH administration.

Comparison 1 Anticipated low responders: higher vs lower dose, Outcome 18 Cumulative live birth: 1 cycle (fresh + frozen).

Comparison 1 Anticipated low responders: higher vs lower dose, Outcome 19 Cumulative live birth: 18 months.

Comparison 1 Anticipated low responders: higher vs lower dose, Outcome 20 Multiple pregnancy in women with clinical pregnancy.

Comparison 2 Anticipated normal responders: higher vs lower dose, Outcome 1 Live birth or ongoing pregnancy.

Comparison 2 Anticipated normal responders: higher vs lower dose, Outcome 2 Severe OHSS.

Comparison 2 Anticipated normal responders: higher vs lower dose, Outcome 3 Clinical pregnancy.

Comparison 2 Anticipated normal responders: higher vs lower dose, Outcome 5 Moderate or severe OHSS.

Comparison 2 Anticipated normal responders: higher vs lower dose, Outcome 6 Multiple pregnancy in randomised women.

Comparison 2 Anticipated normal responders: higher vs lower dose, Outcome 7 Log(N oocytes retrieved); data presented on the log scale ‐ cannot interpret pooled estimates as N of oocytes.

Comparison 2 Anticipated normal responders: higher vs lower dose, Outcome 8 Poor response to stimulation.

Comparison 2 Anticipated normal responders: higher vs lower dose, Outcome 9 Normal response to stimulation.

Comparison 2 Anticipated normal responders: higher vs lower dose, Outcome 10 Hyper‐response to stimulation.

Comparison 2 Anticipated normal responders: higher vs lower dose, Outcome 11 Cycle cancellations for poor response.

Comparison 2 Anticipated normal responders: higher vs lower dose, Outcome 12 Cycle cancellations for hyper‐response.

Comparison 2 Anticipated normal responders: higher vs lower dose, Outcome 13 Cycle cancellations for poor or hyper‐response.

Comparison 2 Anticipated normal responders: higher vs lower dose, Outcome 14 Women with at least one transferable embryo.

Comparison 2 Anticipated normal responders: higher vs lower dose, Outcome 15 Total dose of FSH.

Comparison 2 Anticipated normal responders: higher vs lower dose, Outcome 16 Duration of FSH administration.

Comparison 2 Anticipated normal responders: higher vs lower dose, Outcome 18 Cumulative live birth: 1 cycle (fresh + frozen).

Comparison 2 Anticipated normal responders: higher vs lower dose, Outcome 19 Cumulative live birth: 18 months.

Comparison 2 Anticipated normal responders: higher vs lower dose, Outcome 20 Multiple pregnancy in women with clinical pregnancy.

Comparison 2 Anticipated normal responders: higher vs lower dose, Outcome 21 Dose‐response: live birth or ongoing pregnancy.

Comparison 2 Anticipated normal responders: higher vs lower dose, Outcome 22 Dose‐response: cumulative live birth: 1 cycle (fresh + frozen).

Comparison 2 Anticipated normal responders: higher vs lower dose, Outcome 23 Dose‐response: clinical pregnancy.

Comparison 2 Anticipated normal responders: higher vs lower dose, Outcome 24 Dose‐response: log(N oocytes retrieved); data presented on the log scale ‐ cannot interpret pooled estimates as N of oocytes.

Comparison 2 Anticipated normal responders: higher vs lower dose, Outcome 25 Dose‐response: poor response to stimulation.

Comparison 2 Anticipated normal responders: higher vs lower dose, Outcome 26 Dose‐response: normal response to stimulation.

Comparison 2 Anticipated normal responders: higher vs lower dose, Outcome 27 Dose‐response: hyper‐response to stimulation.

Comparison 2 Anticipated normal responders: higher vs lower dose, Outcome 28 Dose‐response: cycle cancellations for poor response.

Comparison 2 Anticipated normal responders: higher vs lower dose, Outcome 29 Dose‐response: women with at least one transferable embryo.

Comparison 2 Anticipated normal responders: higher vs lower dose, Outcome 30 Dose‐response: total dose of FSH.

Comparison 2 Anticipated normal responders: higher vs lower dose, Outcome 31 Dose‐response: duration of FSH administration.

Comparison 3 Anticipated high‐responders: higher vs lower dose, Outcome 1 Live birth or ongoing pregnancy.

Comparison 3 Anticipated high‐responders: higher vs lower dose, Outcome 2 Severe OHSS.

Comparison 3 Anticipated high‐responders: higher vs lower dose, Outcome 3 Clinical pregnancy.

Comparison 3 Anticipated high‐responders: higher vs lower dose, Outcome 5 Moderate or severe OHSS.

Comparison 3 Anticipated high‐responders: higher vs lower dose, Outcome 6 Multiple pregnancy in randomised women.

Comparison 3 Anticipated high‐responders: higher vs lower dose, Outcome 7 Log(N oocytes retrieved); data presented on the log scale ‐ cannot interpret pooled estimates as N of oocytes.

Comparison 3 Anticipated high‐responders: higher vs lower dose, Outcome 8 Poor response to stimulation.

Comparison 3 Anticipated high‐responders: higher vs lower dose, Outcome 9 Normal response to stimulation.

Comparison 3 Anticipated high‐responders: higher vs lower dose, Outcome 10 Hyper‐response to stimulation.

Comparison 3 Anticipated high‐responders: higher vs lower dose, Outcome 11 Cycle cancellations for poor response.

Comparison 3 Anticipated high‐responders: higher vs lower dose, Outcome 12 Cycle cancellations for hyper‐response.

Comparison 3 Anticipated high‐responders: higher vs lower dose, Outcome 13 Cycle cancellations for poor or hyper‐response.

Comparison 3 Anticipated high‐responders: higher vs lower dose, Outcome 14 Women with at least one transferable embryo.

Comparison 3 Anticipated high‐responders: higher vs lower dose, Outcome 15 Total dose of FSH.

Comparison 3 Anticipated high‐responders: higher vs lower dose, Outcome 16 Duration of FSH administration.
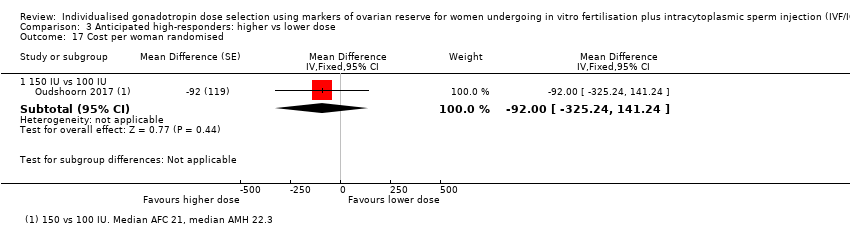
Comparison 3 Anticipated high‐responders: higher vs lower dose, Outcome 17 Cost per woman randomised.

Comparison 3 Anticipated high‐responders: higher vs lower dose, Outcome 18 Cumulative live birth: 1 cycle (fresh + frozen).

Comparison 3 Anticipated high‐responders: higher vs lower dose, Outcome 19 Cumulative live birth: 18 months.

Comparison 3 Anticipated high‐responders: higher vs lower dose, Outcome 20 Multiple pregnancy in women with clinical pregnancy.

Comparison 3 Anticipated high‐responders: higher vs lower dose, Outcome 21 Dose‐response: live birth or ongoing pregnancy.

Comparison 3 Anticipated high‐responders: higher vs lower dose, Outcome 22 Dose‐response: clinical pregnancy.

Comparison 3 Anticipated high‐responders: higher vs lower dose, Outcome 23 Dose‐response: cumulative live birth:1 cycle (fresh + frozen).

Comparison 3 Anticipated high‐responders: higher vs lower dose, Outcome 24 Dose‐response: severe OHSS.

Comparison 3 Anticipated high‐responders: higher vs lower dose, Outcome 25 Dose‐response: moderate or severe OHSS.

Comparison 3 Anticipated high‐responders: higher vs lower dose, Outcome 26 Dose‐response: log(N oocytes retrieved); data presented on the log scale ‐ cannot interpret pooled estimates as N of oocytes.
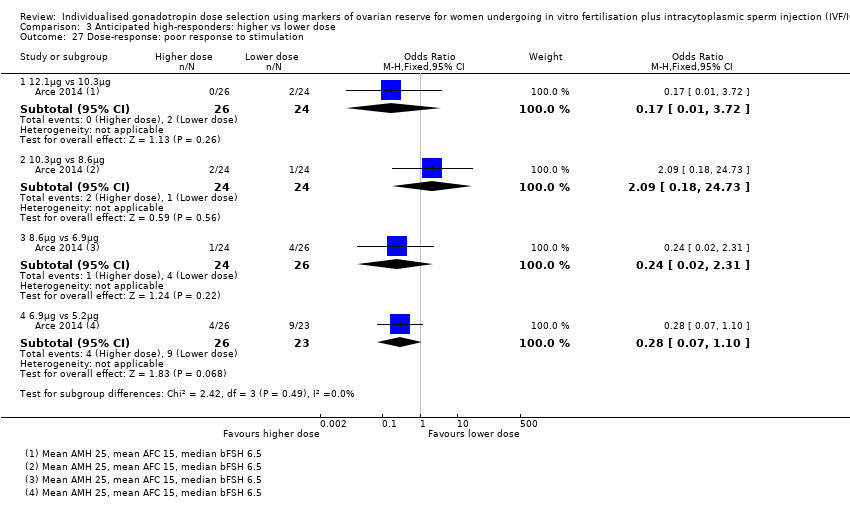
Comparison 3 Anticipated high‐responders: higher vs lower dose, Outcome 27 Dose‐response: poor response to stimulation.

Comparison 3 Anticipated high‐responders: higher vs lower dose, Outcome 28 Dose‐response: normal response to stimulation.

Comparison 3 Anticipated high‐responders: higher vs lower dose, Outcome 29 Dose‐response: hyper‐response to stimulation.

Comparison 3 Anticipated high‐responders: higher vs lower dose, Outcome 30 Dose‐response: cycle cancellations for poor response.

Comparison 3 Anticipated high‐responders: higher vs lower dose, Outcome 31 Dose‐response: cycle cancellations for hyper‐response.

Comparison 3 Anticipated high‐responders: higher vs lower dose, Outcome 32 Dose‐response: cycle cancellations for poor or hyper‐response.

Comparison 3 Anticipated high‐responders: higher vs lower dose, Outcome 33 Dose‐response: women with at least one transferable embryo.

Comparison 3 Anticipated high‐responders: higher vs lower dose, Outcome 34 Dose‐response: total dose of FSH.

Comparison 3 Anticipated high‐responders: higher vs lower dose, Outcome 35 Dose‐response: duration of FSH administration.

Comparison 4 ORT‐based algorithm vs standard dose or non‐ORT based algorithm, Outcome 1 Live birth or ongoing pregnancy.

Comparison 4 ORT‐based algorithm vs standard dose or non‐ORT based algorithm, Outcome 2 Severe OHSS.

Comparison 4 ORT‐based algorithm vs standard dose or non‐ORT based algorithm, Outcome 3 Clinical pregnancy.

Comparison 4 ORT‐based algorithm vs standard dose or non‐ORT based algorithm, Outcome 5 Moderate or severe OHSS.

Comparison 4 ORT‐based algorithm vs standard dose or non‐ORT based algorithm, Outcome 6 Multiple pregnancy in randomised women.

Comparison 4 ORT‐based algorithm vs standard dose or non‐ORT based algorithm, Outcome 7 Log(N oocytes retrieved); data presented on the log scale ‐ cannot interpret pooled estimates as N of oocytes.

Comparison 4 ORT‐based algorithm vs standard dose or non‐ORT based algorithm, Outcome 8 Poor response to stimulation.

Comparison 4 ORT‐based algorithm vs standard dose or non‐ORT based algorithm, Outcome 9 Normal response to stimulation.

Comparison 4 ORT‐based algorithm vs standard dose or non‐ORT based algorithm, Outcome 10 Hyper‐response to stimulation.

Comparison 4 ORT‐based algorithm vs standard dose or non‐ORT based algorithm, Outcome 11 Cycle cancellations for poor response.

Comparison 4 ORT‐based algorithm vs standard dose or non‐ORT based algorithm, Outcome 12 Cycle cancellations for hyper‐response.

Comparison 4 ORT‐based algorithm vs standard dose or non‐ORT based algorithm, Outcome 13 Cycle cancellations for poor or hyper‐response.

Comparison 4 ORT‐based algorithm vs standard dose or non‐ORT based algorithm, Outcome 14 Women with at least one transferable embryo.

Comparison 4 ORT‐based algorithm vs standard dose or non‐ORT based algorithm, Outcome 15 Total dose of FSH.

Comparison 4 ORT‐based algorithm vs standard dose or non‐ORT based algorithm, Outcome 16 Duration of FSH administration.

Comparison 4 ORT‐based algorithm vs standard dose or non‐ORT based algorithm, Outcome 18 Cumulative live birth: 1 cycle (fresh + frozen).

Comparison 4 ORT‐based algorithm vs standard dose or non‐ORT based algorithm, Outcome 19 Cumulative live birth: 18 months.

Comparison 4 ORT‐based algorithm vs standard dose or non‐ORT based algorithm, Outcome 20 Multiple pregnancy in women with clinical pregnancy.

Comparison 5 AMH‐based algorithm vs AFC‐based algorithm, Outcome 2 Severe OHSS.

Comparison 5 AMH‐based algorithm vs AFC‐based algorithm, Outcome 3 Clinical pregnancy.

Comparison 5 AMH‐based algorithm vs AFC‐based algorithm, Outcome 5 Moderate or severe OHSS.

Comparison 5 AMH‐based algorithm vs AFC‐based algorithm, Outcome 6 Multiple pregnancy in randomised women.

Comparison 5 AMH‐based algorithm vs AFC‐based algorithm, Outcome 7 Log(N oocytes retrieved); data presented on the log scale ‐ cannot interpret pooled estimates as N of oocytes.

Comparison 5 AMH‐based algorithm vs AFC‐based algorithm, Outcome 8 Poor response to stimulation.

Comparison 5 AMH‐based algorithm vs AFC‐based algorithm, Outcome 9 Normal response to stimulation.

Comparison 5 AMH‐based algorithm vs AFC‐based algorithm, Outcome 10 Hyper‐response to stimulation.

Comparison 5 AMH‐based algorithm vs AFC‐based algorithm, Outcome 11 Cycle cancellations for poor response.

Comparison 5 AMH‐based algorithm vs AFC‐based algorithm, Outcome 12 Cycle cancellations for hyper‐response.

Comparison 5 AMH‐based algorithm vs AFC‐based algorithm, Outcome 13 Cycle cancellations for poor or hyper‐response.

Comparison 5 AMH‐based algorithm vs AFC‐based algorithm, Outcome 14 Women with at least one transferable embryo.

Comparison 5 AMH‐based algorithm vs AFC‐based algorithm, Outcome 15 Total dose of FSH.

Comparison 5 AMH‐based algorithm vs AFC‐based algorithm, Outcome 16 Duration of FSH administration.

Comparison 5 AMH‐based algorithm vs AFC‐based algorithm, Outcome 19 Multiple pregnancy in women with clinical pregnancy.

Comparison 6 AMH + AFC‐based algorithm vs AFC‐based algorithm, Outcome 1 Live birth or ongoing pregnancy.

Comparison 6 AMH + AFC‐based algorithm vs AFC‐based algorithm, Outcome 2 Severe OHSS.

Comparison 6 AMH + AFC‐based algorithm vs AFC‐based algorithm, Outcome 3 Clinical pregnancy.

Comparison 6 AMH + AFC‐based algorithm vs AFC‐based algorithm, Outcome 5 Moderate or severe OHSS.

Comparison 6 AMH + AFC‐based algorithm vs AFC‐based algorithm, Outcome 6 Multiple pregnancy in randomised women.

Comparison 6 AMH + AFC‐based algorithm vs AFC‐based algorithm, Outcome 7 Log(N oocytes retrieved); data presented on the log scale ‐ cannot interpret pooled estimates as N of oocytes.

Comparison 6 AMH + AFC‐based algorithm vs AFC‐based algorithm, Outcome 8 Poor response to stimulation.

Comparison 6 AMH + AFC‐based algorithm vs AFC‐based algorithm, Outcome 9 Normal response to stimulation.

Comparison 6 AMH + AFC‐based algorithm vs AFC‐based algorithm, Outcome 10 Hyper‐response to stimulation.

Comparison 6 AMH + AFC‐based algorithm vs AFC‐based algorithm, Outcome 11 Cycle cancellations for poor response.

Comparison 6 AMH + AFC‐based algorithm vs AFC‐based algorithm, Outcome 12 Cycle cancellations for hyper‐response.

Comparison 6 AMH + AFC‐based algorithm vs AFC‐based algorithm, Outcome 13 Cycle cancellations for poor or hyper‐response.

Comparison 6 AMH + AFC‐based algorithm vs AFC‐based algorithm, Outcome 14 Women with at least one transferable embryo.

Comparison 6 AMH + AFC‐based algorithm vs AFC‐based algorithm, Outcome 15 Total dose of FSH.

Comparison 6 AMH + AFC‐based algorithm vs AFC‐based algorithm, Outcome 16 Duration of FSH administration.

Comparison 6 AMH + AFC‐based algorithm vs AFC‐based algorithm, Outcome 18 Live birth or ongoing pregnancy (including FET for freeze‐all).

Comparison 6 AMH + AFC‐based algorithm vs AFC‐based algorithm, Outcome 19 Multiple pregnancy in women with clinical pregnancy.

Comparison 7 AMH + AFC + bFSH‐based algorithm vs bFSH‐based algorithm, Outcome 1 Live birth or ongoing pregnancy.

Comparison 7 AMH + AFC + bFSH‐based algorithm vs bFSH‐based algorithm, Outcome 3 Clinical pregnancy.

Comparison 7 AMH + AFC + bFSH‐based algorithm vs bFSH‐based algorithm, Outcome 7 Log(N oocytes retrieved); data presented on the log scale ‐ cannot interpret pooled estimates as N of oocytes.

Comparison 7 AMH + AFC + bFSH‐based algorithm vs bFSH‐based algorithm, Outcome 8 Poor response to stimulation.

Comparison 7 AMH + AFC + bFSH‐based algorithm vs bFSH‐based algorithm, Outcome 9 Normal response to stimulation.

Comparison 7 AMH + AFC + bFSH‐based algorithm vs bFSH‐based algorithm, Outcome 10 Hyper‐response to stimulation.

Comparison 7 AMH + AFC + bFSH‐based algorithm vs bFSH‐based algorithm, Outcome 15 Total dose of FSH.

Comparison 7 AMH + AFC + bFSH‐based algorithm vs bFSH‐based algorithm, Outcome 16 Duration of FSH administration.
| ORT‐based algorithm compared to standard dose of FSH for women undergoing IVF/ICSI | ||||||
| Patient or population: women undergoing IVF/ICSI | ||||||
| Outcomes | Anticipated absolute effects* (95% CI) | Relative effect | № of participants | Certainty of the evidence | Evidence summary | |
| Risk with 150 IU FSH | Risk with ORT‐based algorithm | |||||
| Live birth or ongoing pregnancy | 258 per 1000 | 266 per 1000 | OR 1.04 | 2823 | ⊕⊕⊕⊝ | Although the effect estimate remains imprecise, the pooled evidence suggests it is unlikely that ORT‐algorithms impacted on rates of live birth or ongoing pregnancy |
| OHSS | Severe 8 per 1000 | 4 per 1000 | OR 0.54 | 1494 | ⊕⊕⊝⊝ | Although the effect estimate remains imprecise, the pooled evidence suggests that ORT‐algorithms reduce the incidence of OHSS by an unspecified amount. |
| Moderate or severe 25 per 1000 | 14 per 1000 | OR 0.58 | 2823 | |||
| Clinical pregnancy | 321 per 1000 | 313 per 1000 | OR 0.96 | 2823 | ⊕⊕⊕⊝ | Although the effect estimate remains imprecise, the pooled evidence suggests it is unlikely that ORT algorithms impacted on rates of clinical pregnancy |
| *The risk in the intervention group (and its 95% confidence interval) is based on the assumed risk in the comparison group and the relative effect of the intervention (and its 95% CI). | ||||||
| GRADE Working Group grades of evidence | ||||||
| aDowngraded one level for serious risk of bias, associated mainly with performance bias due to lack of blinding and/or selective reporting. | ||||||
| Anticipated low responders: higher compared to lower dose of FSH for women undergoing IVF/ICSI | ||||||
| Patient or population: women undergoing IVF/ICSI who are anticipated to have a low‐response to stimulation based on one or more ORT measure | ||||||
| Outcomes | Anticipated absolute effects* (95% CI) | Relative effect | № of participants | Certainty of the evidence | Evidence summary | |
| Risk with lower dose | Risk with higher dose | |||||
| Live birth or ongoing pregnancy | ||||||
| 300/450 IU vs 150 IU | 109 per 1000 | 80 per 1000 | OR 0.71 (0.32 to 1.58) | 286 | ⊕⊕⊝⊝ | It was difficult to determine whether the different doses impacted on rates of live birth or ongoing pregnancy, therefore there is no evidence to suggest increased dosing in low responders is beneficial. |
| 400/450 IU vs 300 IU | 161 per 1000 | 129 per 1000 | OR 0.77 (0.19 to 3.19) | 62 | ||
| 600 IU vs 450 IU | 108 per 1000 | 139 per 1000 | OR 1.33 | 356 | ||
| Ovarian hyperstimulation syndrome (OHSS) | ||||||
| 300/450 IU vs 150 IU | Severe 0 per 1000 | 0 per 1000 | Not estimable | 286 | ⊕⊝⊝⊝ | It was not possible to determine whether the different doses impacted on rates of OHSS, as the event rates were too low. |
| Moderate or severe 0 per 1000 | 0 per 1000 | Not estimable | 286 | |||
| 400/450 IU vs 300 IU | Severe 0 per 1000 | 0 per 1000 | Not estimable | 62 | ||
| Moderate or severe 0 per 1000 | 0 per 1000 | Not estimable | 62 | |||
| 600 IU vs 450 IU | Severe 0 per 1000 | 0 per 1000 | Not estimable | 356 | ||
| Moderate or severe 0 per 1000 | 0 per 1000 | OR 7.23 | 356 | |||
| Clinical pregnancy | ||||||
| 300/450 IU vs 150 IU | 184 per 1000 | 101 per 1000 | OR 0.50 | 286 | ⊕⊕⊝⊝ | It was difficult to determine whether the dose differences impacted on rates of clinical pregnancy, therefore there is no evidence to suggest increased dosing in low responders is beneficial, and it may even be detrimental compared to a dose of 150 IU. |
| 400/450 IU vs 300 IU | 127 per 1000 | 109 per 1000 | OR 0.84 | 110 | ||
| 600 IU vs 450 IU | 159 per 1000 | 177 per 1000 | OR 1.14 | 356 | ||
| *The risk in the intervention group (and its 95% confidence interval) is based on the assumed risk in the comparison group and the relative effect of the intervention (and its 95% CI). | ||||||
| GRADE Working Group grades of evidence | ||||||
| aDowngraded one level for serious risk of bias associated mainly with performance bias due to lack of blinding and/or selective reporting. | ||||||
| Anticipated normal responders: higher compared to lower dose of FSH for women undergoing IVF/ICSI | ||||||
| Patient or population: women undergoing IVF/ICSI who are anticipated to have a normal response to stimulation based on at least one ORT measure | ||||||
| Comparison | Anticipated absolute effects* (95% CI) | Relative effect | № of participants | Certainty of the evidence | Evidence summary | |
| Risk with lower dose | Risk with higher dose | |||||
| Outcome:live birth or ongoing pregnancy | ||||||
| 200 IU vs 100 IU | 204 per 1000 | 184 per 1000 | OR 0.88 | 522 | ⊕⊕⊝⊝ | It was difficult to determine whether the dose differences impacted on rates of live birth or ongoing pregnancy, therefore there is no evidence to suggest increased dosing in normal responders is beneficial. |
| 225/200 IU vs 150 IU | 193 per 1000 | 198 per 1000 | OR 1.03 | 277 | ||
| 300 IU vs 225 IU | 397 per 1000 | 300 per 1000 | OR 0.65 | 135 | ||
| Outcome:ovarian hyperstimulation syndrome (OHSS) | ||||||
| 200 IU vs 100 IU | Severe 4 per 1000 | 1 per 1000 | OR 0.14 (0.00 to 6.96) | 522 | ⊕⊝⊝⊝ | It was impossible to determine whether the dose differences impacted on rates of OHSS |
| Moderate or severe 31 per 1000 | 19 per 1000 | OR 0.62 (0.21 to 1.87) | 522 | |||
| 225/200 IU vs 150 IU | Severe 8 per 1000 | 8 per 1000 | OR 1.00 | 740 | ||
| Moderate or severe 27 per 1000 | 32 per 1000 | OR 1.21 | 740 | |||
| 300 IU vs 225 IU | Severe 15 per 1000 | 2 per 1000 | OR 0.14 (0.00 to 6.92) | 135 (1 RCT) | ||
| Moderate or severe 44 per 1000 | 30 per 1000 | OR 0.67 | 135 | |||
| Outcome:clinical pregnancy | ||||||
| 200 IU vs 100 IU | 202 per 1000 | 179 per 1000 | OR 0.86 (0.73 to 1.31) | 330 (1 RCT) | ⊕⊕⊝⊝ | It was difficult to determine whether the dose differences impacted on rates of clinical pregnancy, therefore there is no evidence to suggest increased dosing in normal responders is beneficial. |
| 225/200 IU vs 150 IU | 236 per 1000 | 232 per 1000 | OR 0.98 | 1037 | ||
| 300 IU vs 225 IU | 441 per 1000 | 418 per 1000 | OR 0.91 | 135 | ||
| *The risk in the intervention group (and its 95% confidence interval) is based on the assumed risk in the comparison group and the relative effect of the intervention (and its 95% CI). | ||||||
| GRADE Working Group grades of evidence | ||||||
| aDowngraded one level for serious risk of bias associated mainly with performance bias due to lack of blinding and/or selective reporting and/or selection bias due to unclear methods of randomisation. | ||||||
| Anticipated high responders: higher compared to lower dose of FSH for women undergoing IVF/ICSI | ||||||
| Patient or population: women undergoing IVF/ICSI who are anticipated to have a hyper‐response to stimulation based on at least one ORT measure | ||||||
| Comparison | Anticipated absolute effects* (95% CI) | Relative effect | № of participants | Certainty of the evidence | Evidence summary | |
| Risk with lower dose | Risk with higher dose | |||||
| Outcome:live birth or ongoing pregnancy | ||||||
| 150 IU vs 100 IU | 255 per 1000 | 251 per 1000 | OR 0.98 | 521 (1 RCT) | ⊕⊕⊝⊝ | It was difficult to determine whether the dose differences impacted on rates of live birth or ongoing pregnancy, therefore there is no evidence to suggest increased dosing in hyper responders is beneficial |
| Outcome:ovarian hyperstimulation syndrome (OHSS) | ||||||
| 150 IU vs 100 IU | Severe 16 per 1000 | 11 per 1000 | OR 0.72 | 521 (1 RCT) | ⊕⊝⊝⊝ | It was not possible to definitively say whether dose differences impacted on rates of OHSS, but there could be a reduction with lower doses. |
| Moderate or severe 16 per 1000 | 36 per 1000 | OR 2.31 | 521 (1 RCT) | |||
| Outcome:clinical pregnancy | ||||||
| 150 IU vs 100 IU | 275 per 1000 | 301 per 1000 | OR 1.14 | 521 (1 RCT) | ⊕⊕⊝⊝ | It was difficult to determine whether the dose differences impacted on rates of clinical pregnancy, therefore there is no evidence to suggest increased dosing in hyper responders is beneficial. |
| *The risk in the intervention group (and its 95% confidence interval) is based on the assumed risk in the comparison group and the relative effect of the intervention (and its 95% CI). | ||||||
| GRADE Working Group grades of evidence | ||||||
| aDowngraded one level for serious risk of bias associated mainly with performance bias due to lack of blinding and/or selective reporting. | ||||||
| Outcome or subgroup title | No. of studies | No. of participants | Statistical method | Effect size |
| 1 Live birth or ongoing pregnancy Show forest plot | 4 | Odds Ratio (M‐H, Fixed, 95% CI) | Subtotals only | |
| 1.1 300/450 IU vs 150 IU | 2 | 286 | Odds Ratio (M‐H, Fixed, 95% CI) | 0.71 [0.32, 1.58] |
| 1.2 400/450 IU vs 300 IU | 1 | 62 | Odds Ratio (M‐H, Fixed, 95% CI) | 0.77 [0.19, 3.19] |
| 1.3 600 IU vs 450 IU | 1 | 356 | Odds Ratio (M‐H, Fixed, 95% CI) | 1.33 [0.71, 2.52] |
| 2 Severe OHSS Show forest plot | 4 | Peto Odds Ratio (Peto, Fixed, 95% CI) | Subtotals only | |
| 2.1 300/450 IU vs 150 IU | 2 | 286 | Peto Odds Ratio (Peto, Fixed, 95% CI) | 0.0 [0.0, 0.0] |
| 2.2 400/450 IU vs 300 IU | 1 | 62 | Peto Odds Ratio (Peto, Fixed, 95% CI) | 0.0 [0.0, 0.0] |
| 2.3 600 IU vs 450 IU | 1 | 356 | Peto Odds Ratio (Peto, Fixed, 95% CI) | 0.0 [0.0, 0.0] |
| 3 Clinical pregnancy Show forest plot | 5 | Odds Ratio (M‐H, Fixed, 95% CI) | Subtotals only | |
| 3.1 300/450 IU vs 150 IU | 2 | 286 | Odds Ratio (M‐H, Fixed, 95% CI) | 0.50 [0.25, 1.00] |
| 3.2 400/450 IU vs 300 IU | 2 | 110 | Odds Ratio (M‐H, Fixed, 95% CI) | 0.84 [0.26, 2.69] |
| 3.3 600 IU vs 450 IU | 1 | 356 | Odds Ratio (M‐H, Fixed, 95% CI) | 1.14 [0.66, 1.99] |
| 4 Time to clinical pregnancy | 0 | 0 | Mean Difference (IV, Fixed, 95% CI) | 0.0 [0.0, 0.0] |
| 5 Moderate or severe OHSS Show forest plot | 4 | Peto Odds Ratio (Peto, Fixed, 95% CI) | Subtotals only | |
| 5.1 300/450 IU vs 150 IU | 2 | 286 | Peto Odds Ratio (Peto, Fixed, 95% CI) | 0.0 [0.0, 0.0] |
| 5.2 450 IU vs 300 IU | 1 | 62 | Peto Odds Ratio (Peto, Fixed, 95% CI) | 0.0 [0.0, 0.0] |
| 5.3 600 IU vs 450 IU | 1 | 356 | Peto Odds Ratio (Peto, Fixed, 95% CI) | 7.23 [0.14, 364.29] |
| 6 Multiple pregnancy in randomised women Show forest plot | 4 | Peto Odds Ratio (Peto, Fixed, 95% CI) | Subtotals only | |
| 6.1 300/450 IU vs 150 IU | 2 | 286 | Peto Odds Ratio (Peto, Fixed, 95% CI) | 0.55 [0.06, 5.31] |
| 6.2 450 IU vs 300 IU | 1 | 62 | Peto Odds Ratio (Peto, Fixed, 95% CI) | 0.0 [0.0, 0.0] |
| 6.3 600 IU vs 450 IU | 1 | 356 | Peto Odds Ratio (Peto, Fixed, 95% CI) | 0.49 [0.16, 1.55] |
| 7 Log(N oocytes retrieved); data presented on the log scale ‐ cannot interpret pooled estimates as N of oocytes Show forest plot | 5 | Mean Difference (Fixed, 95% CI) | Subtotals only | |
| 7.1 300/450 IU vs 150 IU | 2 | Mean Difference (Fixed, 95% CI) | 0.69 [0.50, 0.88] | |
| 7.2 400/450 IU vs 300 IU | 2 | Mean Difference (Fixed, 95% CI) | ‐0.03 [‐0.30, 0.24] | |
| 7.3 600 IU vs 450 IU | 1 | Mean Difference (Fixed, 95% CI) | 0.08 [‐0.04, 0.20] | |
| 8 Poor response to stimulation Show forest plot | 2 | Odds Ratio (M‐H, Fixed, 95% CI) | Subtotals only | |
| 8.1 300/450 IU vs 150 IU | 2 | 286 | Odds Ratio (M‐H, Fixed, 95% CI) | 0.52 [0.32, 0.84] |
| 9 Normal response to stimulation Show forest plot | 1 | Odds Ratio (M‐H, Fixed, 95% CI) | Subtotals only | |
| 9.1 300/450 IU vs 150 IU | 1 | 234 | Odds Ratio (M‐H, Fixed, 95% CI) | 1.79 [1.05, 3.04] |
| 10 Hyper‐response to stimulation Show forest plot | 1 | Odds Ratio (M‐H, Fixed, 95% CI) | Subtotals only | |
| 10.1 300/450 IU vs 150 IU | 1 | 234 | Odds Ratio (M‐H, Fixed, 95% CI) | 4.53 [0.94, 21.82] |
| 11 Cycle cancellations for poor response Show forest plot | 5 | Odds Ratio (M‐H, Fixed, 95% CI) | Subtotals only | |
| 11.1 300/450 IU vs 150 IU | 2 | 286 | Odds Ratio (M‐H, Fixed, 95% CI) | 0.23 [0.11, 0.47] |
| 11.2 400/450 IU vs 300 IU | 2 | 110 | Odds Ratio (M‐H, Fixed, 95% CI) | 1.47 [0.62, 3.49] |
| 11.3 600 IU vs 450 IU | 1 | 356 | Odds Ratio (M‐H, Fixed, 95% CI) | 0.86 [0.50, 1.50] |
| 12 Cycle cancellations for hyper‐response Show forest plot | 5 | Peto Odds Ratio (Peto, Fixed, 95% CI) | Subtotals only | |
| 12.1 300/450 IU vs 150 IU | 2 | 286 | Peto Odds Ratio (Peto, Fixed, 95% CI) | 7.93 [0.16, 400.62] |
| 12.2 400/450 IU vs 300 IU | 2 | 110 | Peto Odds Ratio (Peto, Fixed, 95% CI) | 0.0 [0.0, 0.0] |
| 12.3 600 IU vs 450 IU | 1 | 356 | Peto Odds Ratio (Peto, Fixed, 95% CI) | 0.0 [0.0, 0.0] |
| 13 Cycle cancellations for poor or hyper‐response Show forest plot | 5 | Odds Ratio (M‐H, Fixed, 95% CI) | Subtotals only | |
| 13.1 300/450 IU vs 150 IU | 2 | 286 | Odds Ratio (M‐H, Fixed, 95% CI) | 0.25 [0.13, 0.50] |
| 13.2 400/450 IU vs 300 IU | 2 | 110 | Odds Ratio (M‐H, Fixed, 95% CI) | 1.47 [0.62, 3.49] |
| 13.3 600 IU vs 450 IU | 1 | 356 | Odds Ratio (M‐H, Fixed, 95% CI) | 0.86 [0.50, 1.50] |
| 14 Women with at least one transferable embryo Show forest plot | 5 | Odds Ratio (M‐H, Fixed, 95% CI) | Subtotals only | |
| 14.1 300/450 IU vs 150 IU | 2 | 286 | Odds Ratio (M‐H, Fixed, 95% CI) | 1.76 [1.07, 2.87] |
| 14.2 400/450 IU vs 300 IU | 2 | 110 | Odds Ratio (M‐H, Fixed, 95% CI) | 0.71 [0.31, 1.60] |
| 14.3 600 IU vs 450 IU | 1 | 356 | Odds Ratio (M‐H, Fixed, 95% CI) | 1.19 [0.78, 1.82] |
| 15 Total dose of FSH Show forest plot | 5 | Mean Difference (IV, Fixed, 95% CI) | Subtotals only | |
| 15.1 300/450 IU vs 150 IU | 2 | 286 | Mean Difference (IV, Fixed, 95% CI) | 2.78 [2.57, 3.00] |
| 15.2 400/450 IU vs 300 IU | 2 | 110 | Mean Difference (IV, Fixed, 95% CI) | 1.11 [0.91, 1.31] |
| 15.3 600 IU vs 450 IU | 1 | 356 | Mean Difference (IV, Fixed, 95% CI) | 1.20 [1.07, 1.33] |
| 16 Duration of FSH administration Show forest plot | 4 | Mean Difference (IV, Fixed, 95% CI) | Subtotals only | |
| 16.1 300/450 IU vs 150 IU | 1 | 234 | Mean Difference (IV, Fixed, 95% CI) | ‐0.70 [‐1.48, 0.08] |
| 16.2 400/450 IU vs 300 IU | 2 | 110 | Mean Difference (IV, Fixed, 95% CI) | ‐0.67 [‐1.39, 0.06] |
| 16.3 600 IU vs 450 IU | 1 | 356 | Mean Difference (IV, Fixed, 95% CI) | ‐1.0 [‐1.27, ‐0.73] |
| 17 Cost per woman randomised | 0 | 0 | Mean Difference (IV, Fixed, 95% CI) | 0.0 [0.0, 0.0] |
| 18 Cumulative live birth: 1 cycle (fresh + frozen) Show forest plot | 1 | Odds Ratio (M‐H, Fixed, 95% CI) | Subtotals only | |
| 18.1 300/450 IU vs 150 IU | 1 | 234 | Odds Ratio (M‐H, Fixed, 95% CI) | 0.78 [0.35, 1.73] |
| 19 Cumulative live birth: 18 months Show forest plot | 1 | Odds Ratio (M‐H, Fixed, 95% CI) | Subtotals only | |
| 19.1 300/450 IU vs 150 IU | 1 | 234 | Odds Ratio (M‐H, Fixed, 95% CI) | 0.78 [0.46, 1.32] |
| 20 Multiple pregnancy in women with clinical pregnancy Show forest plot | 4 | Peto Odds Ratio (Peto, Fixed, 95% CI) | Subtotals only | |
| 20.1 300/450 IU vs 150 IU | 2 | 41 | Peto Odds Ratio (Peto, Fixed, 95% CI) | 0.92 [0.08, 10.54] |
| 20.2 400/450 IU vs 300 IU | 1 | 9 | Peto Odds Ratio (Peto, Fixed, 95% CI) | 0.0 [0.0, 0.0] |
| 20.3 600 IU vs 450 IU | 1 | 60 | Peto Odds Ratio (Peto, Fixed, 95% CI) | 0.37 [0.11, 1.31] |
| Outcome or subgroup title | No. of studies | No. of participants | Statistical method | Effect size |
| 1 Live birth or ongoing pregnancy Show forest plot | 4 | Odds Ratio (M‐H, Fixed, 95% CI) | Subtotals only | |
| 1.1 200 IU vs 100 IU | 2 | 522 | Odds Ratio (M‐H, Fixed, 95% CI) | 0.88 [0.57, 1.36] |
| 1.2 225/200 IU vs 150 IU | 1 | 277 | Odds Ratio (M‐H, Fixed, 95% CI) | 1.03 [0.57, 1.86] |
| 1.3 300 IU vs 225 IU | 1 | 135 | Odds Ratio (M‐H, Fixed, 95% CI) | 0.65 [0.32, 1.32] |
| 2 Severe OHSS Show forest plot | 7 | Peto Odds Ratio (Peto, Fixed, 95% CI) | Subtotals only | |
| 2.1 200 IU vs 100 IU | 2 | 522 | Peto Odds Ratio (Peto, Fixed, 95% CI) | 0.14 [0.00, 6.96] |
| 2.2 225/200 IU vs 150 IU | 4 | 740 | Peto Odds Ratio (Peto, Fixed, 95% CI) | 1.00 [0.20, 5.02] |
| 2.3 300 IU vs 225 IU | 1 | 135 | Peto Odds Ratio (Peto, Fixed, 95% CI) | 0.14 [0.00, 6.92] |
| 3 Clinical pregnancy Show forest plot | 7 | Odds Ratio (M‐H, Fixed, 95% CI) | Subtotals only | |
| 3.1 200 IU vs 100 IU | 1 | 330 | Odds Ratio (M‐H, Fixed, 95% CI) | 0.86 [0.50, 1.49] |
| 3.2 225/200 IU vs 150 IU | 5 | 1037 | Odds Ratio (M‐H, Fixed, 95% CI) | 0.98 [0.73, 1.31] |
| 3.3 300 IU vs 225 IU | 1 | 135 | Odds Ratio (M‐H, Fixed, 95% CI) | 0.91 [0.46, 1.80] |
| 4 Time to clinical pregnancy | 0 | 0 | Mean Difference (IV, Fixed, 95% CI) | 0.0 [0.0, 0.0] |
| 5 Moderate or severe OHSS Show forest plot | 7 | Peto Odds Ratio (Peto, Fixed, 95% CI) | Subtotals only | |
| 5.1 200 IU vs 100 IU | 2 | 522 | Peto Odds Ratio (Peto, Fixed, 95% CI) | 0.62 [0.21, 1.87] |
| 5.2 225/200 IU vs 150 IU | 4 | 740 | Peto Odds Ratio (Peto, Fixed, 95% CI) | 1.21 [0.51, 2.85] |
| 5.3 300 IU vs 225 IU | 1 | 135 | Peto Odds Ratio (Peto, Fixed, 95% CI) | 0.67 [0.11, 3.99] |
| 6 Multiple pregnancy in randomised women Show forest plot | 4 | Peto Odds Ratio (Peto, Fixed, 95% CI) | Subtotals only | |
| 6.1 200 IU vs 100 IU | 1 | 330 | Peto Odds Ratio (Peto, Fixed, 95% CI) | 0.97 [0.38, 2.52] |
| 6.2 225/200 IU vs 150 IU | 2 | 400 | Peto Odds Ratio (Peto, Fixed, 95% CI) | 1.91 [0.38, 9.69] |
| 6.3 300 IU vs 225 IU | 1 | 135 | Peto Odds Ratio (Peto, Fixed, 95% CI) | 7.61 [0.47, 123.02] |
| 7 Log(N oocytes retrieved); data presented on the log scale ‐ cannot interpret pooled estimates as N of oocytes Show forest plot | 8 | Mean Difference (Fixed, 95% CI) | Subtotals only | |
| 7.1 200 IU vs 100 IU | 2 | Mean Difference (Fixed, 95% CI) | 0.46 [0.36, 0.57] | |
| 7.2 225/200 IU vs 150 IU | 5 | Mean Difference (Fixed, 95% CI) | 0.16 [0.08, 0.24] | |
| 7.3 300 IU vs 225 IU | 1 | Mean Difference (Fixed, 95% CI) | 0.03 [‐0.17, 0.23] | |
| 8 Poor response to stimulation Show forest plot | 1 | Odds Ratio (M‐H, Fixed, 95% CI) | Subtotals only | |
| 8.1 225/200 IU vs 150 IU | 1 | 277 | Odds Ratio (M‐H, Fixed, 95% CI) | 0.50 [0.30, 0.83] |
| 9 Normal response to stimulation Show forest plot | 1 | Odds Ratio (M‐H, Fixed, 95% CI) | Subtotals only | |
| 9.1 225/200 IU vs 150 IU | 1 | 277 | Odds Ratio (M‐H, Fixed, 95% CI) | 1.26 [0.78, 2.04] |
| 10 Hyper‐response to stimulation Show forest plot | 1 | Odds Ratio (M‐H, Fixed, 95% CI) | Subtotals only | |
| 10.1 225/200 IU vs 150 IU | 1 | 277 | Odds Ratio (M‐H, Fixed, 95% CI) | 4.08 [1.47, 11.34] |
| 11 Cycle cancellations for poor response Show forest plot | 8 | Odds Ratio (M‐H, Fixed, 95% CI) | Subtotals only | |
| 11.1 200 IU vs 100 IU | 2 | 522 | Odds Ratio (M‐H, Fixed, 95% CI) | 0.33 [0.16, 0.66] |
| 11.2 225/200 IU vs 150 IU | 5 | 1037 | Odds Ratio (M‐H, Fixed, 95% CI) | 0.56 [0.36, 0.88] |
| 11.3 300 IU vs 225 IU | 1 | 135 | Odds Ratio (M‐H, Fixed, 95% CI) | 0.11 [0.01, 2.01] |
| 12 Cycle cancellations for hyper‐response Show forest plot | 8 | Peto Odds Ratio (Peto, Fixed, 95% CI) | Subtotals only | |
| 12.1 200 IU vs 100 IU | 2 | 522 | Peto Odds Ratio (Peto, Fixed, 95% CI) | 1.93 [0.20, 18.62] |
| 12.2 225/200 IU vs 150 IU | 5 | 1037 | Peto Odds Ratio (Peto, Fixed, 95% CI) | 2.28 [0.99, 5.26] |
| 12.3 300 IU vs 225 IU | 1 | 135 | Peto Odds Ratio (Peto, Fixed, 95% CI) | 1.02 [0.06, 16.40] |
| 13 Cycle cancellations for poor or hyper‐response Show forest plot | 8 | Odds Ratio (M‐H, Fixed, 95% CI) | Subtotals only | |
| 13.1 200 IU vs 100 IU | 2 | 522 | Odds Ratio (M‐H, Fixed, 95% CI) | 0.37 [0.19, 0.72] |
| 13.2 225/200 IU vs 150 IU | 5 | 1037 | Odds Ratio (M‐H, Fixed, 95% CI) | 0.76 [0.51, 1.13] |
| 13.3 300 IU vs 225 IU | 1 | 135 | Odds Ratio (M‐H, Fixed, 95% CI) | 0.19 [0.02, 1.68] |
| 14 Women with at least one transferable embryo Show forest plot | 8 | Odds Ratio (M‐H, Fixed, 95% CI) | Subtotals only | |
| 14.1 200 IU vs 100 IU | 2 | 522 | Odds Ratio (M‐H, Fixed, 95% CI) | 1.58 [0.95, 2.64] |
| 14.2 225/200 IU vs 150 IU | 5 | 1037 | Odds Ratio (M‐H, Fixed, 95% CI) | 1.06 [0.76, 1.47] |
| 14.3 300 IU vs 225 IU | 1 | 135 | Odds Ratio (M‐H, Fixed, 95% CI) | 1.75 [0.60, 5.13] |
| 15 Total dose of FSH Show forest plot | 8 | Mean Difference (IV, Fixed, 95% CI) | Subtotals only | |
| 15.1 200 IU vs 100 IU | 2 | 522 | Mean Difference (IV, Fixed, 95% CI) | 795.79 [656.67, 934.91] |
| 15.2 225/200 IU vs 150 IU | 5 | 1037 | Mean Difference (IV, Fixed, 95% CI) | 503.12 [456.23, 550.00] |
| 15.3 300 IU vs 225 IU | 1 | 135 | Mean Difference (IV, Fixed, 95% CI) | 725.0 [597.44, 852.56] |
| 16 Duration of FSH administration Show forest plot | 6 | Mean Difference (IV, Fixed, 95% CI) | Subtotals only | |
| 16.1 200 IU vs 100 IU | 1 | 330 | Mean Difference (IV, Fixed, 95% CI) | ‐1.80 [‐2.21, ‐1.39] |
| 16.2 225/200 IU vs 150 IU | 4 | 961 | Mean Difference (IV, Fixed, 95% CI) | ‐0.25 [‐0.51, 0.01] |
| 16.3 300 IU vs 225 IU | 1 | 135 | Mean Difference (IV, Fixed, 95% CI) | ‐0.30 [‐0.79, 0.19] |
| 17 Cost per woman randomised | 0 | 0 | Mean Difference (IV, Fixed, 95% CI) | 0.0 [0.0, 0.0] |
| 18 Cumulative live birth: 1 cycle (fresh + frozen) Show forest plot | 1 | Odds Ratio (M‐H, Fixed, 95% CI) | Subtotals only | |
| 18.1 225/200 IU vs 150 IU | 1 | 277 | Odds Ratio (M‐H, Fixed, 95% CI) | 0.88 [0.51, 1.52] |
| 19 Cumulative live birth: 18 months Show forest plot | 1 | Odds Ratio (M‐H, Fixed, 95% CI) | Subtotals only | |
| 19.1 225/200 IU vs 150 IU | 1 | 277 | Odds Ratio (M‐H, Fixed, 95% CI) | 1.01 [0.63, 1.62] |
| 20 Multiple pregnancy in women with clinical pregnancy Show forest plot | 4 | Peto Odds Ratio (Peto, Fixed, 95% CI) | Subtotals only | |
| 20.1 200 IU vs 100 IU | 1 | 63 | Peto Odds Ratio (Peto, Fixed, 95% CI) | 1.14 [0.39, 3.38] |
| 20.2 225/200 IU vs 150 IU | 2 | 89 | Peto Odds Ratio (Peto, Fixed, 95% CI) | 1.67 [0.28, 9.76] |
| 20.3 300 IU vs 225 IU | 1 | 58 | Peto Odds Ratio (Peto, Fixed, 95% CI) | 8.24 [0.50, 135.17] |
| 21 Dose‐response: live birth or ongoing pregnancy Show forest plot | 1 | Odds Ratio (M‐H, Fixed, 95% CI) | Subtotals only | |
| 21.1 12.1μg vs 10.3μg | 1 | 41 | Odds Ratio (M‐H, Fixed, 95% CI) | 1.5 [0.39, 5.84] |
| 21.2 10.3μg vs 8.6μg | 1 | 39 | Odds Ratio (M‐H, Fixed, 95% CI) | 0.92 [0.25, 3.42] |
| 21.3 8.6μg vs 6.9μg | 1 | 40 | Odds Ratio (M‐H, Fixed, 95% CI) | 0.62 [0.16, 2.43] |
| 21.4 6.9μg vs 5.2μg | 1 | 38 | Odds Ratio (M‐H, Fixed, 95% CI) | 1.0 [0.25, 3.93] |
| 22 Dose‐response: cumulative live birth: 1 cycle (fresh + frozen) Show forest plot | 1 | Odds Ratio (M‐H, Fixed, 95% CI) | Subtotals only | |
| 22.1 12.1μg vs 10.3μg | 1 | 41 | Odds Ratio (M‐H, Fixed, 95% CI) | 1.14 [0.32, 4.08] |
| 22.2 10.3μg vs 8.6μg | 1 | 40 | Odds Ratio (M‐H, Fixed, 95% CI) | 0.81 [0.22, 2.91] |
| 22.3 8.6μg vs 6.9μg | 1 | 39 | Odds Ratio (M‐H, Fixed, 95% CI) | 0.73 [0.19, 2.79] |
| 22.4 6.9μg vs 5.2μg | 1 | 38 | Odds Ratio (M‐H, Fixed, 95% CI) | 1.58 [0.42, 5.95] |
| 23 Dose‐response: clinical pregnancy Show forest plot | 1 | Odds Ratio (M‐H, Fixed, 95% CI) | Subtotals only | |
| 23.1 12.1μg vs 10.3μg | 1 | 41 | Odds Ratio (M‐H, Fixed, 95% CI) | 1.2 [0.30, 4.80] |
| 23.2 10.3μg vs 8.6μg | 1 | 40 | Odds Ratio (M‐H, Fixed, 95% CI) | 0.78 [0.19, 3.13] |
| 23.3 8.6μg vs 6.9μg | 1 | 39 | Odds Ratio (M‐H, Fixed, 95% CI) | 0.92 [0.25, 3.42] |
| 23.4 6.9μg vs 5.2μg | 1 | 38 | Odds Ratio (M‐H, Fixed, 95% CI) | 1.0 [0.25, 3.93] |
| 24 Dose‐response: log(N oocytes retrieved); data presented on the log scale ‐ cannot interpret pooled estimates as N of oocytes Show forest plot | 1 | Mean Difference (Fixed, 95% CI) | Subtotals only | |
| 24.1 12.1μg vs 10.3μg | 1 | Mean Difference (Fixed, 95% CI) | 0.26 [‐0.05, 0.57] | |
| 24.2 10.3μg vs 8.6μg | 1 | Mean Difference (Fixed, 95% CI) | 0.01 [‐0.31, 0.32] | |
| 24.3 8.6μg vs 6.9μg | 1 | Mean Difference (Fixed, 95% CI) | 0.28 [‐0.13, 0.69] | |
| 24.4 6.9μg vs 5.2μg | 1 | Mean Difference (Fixed, 95% CI) | 0.29 [‐0.12, 0.70] | |
| 25 Dose‐response: poor response to stimulation Show forest plot | 1 | Odds Ratio (M‐H, Fixed, 95% CI) | Subtotals only | |
| 25.1 12.1μg vs 10.3μg | 1 | 41 | Odds Ratio (M‐H, Fixed, 95% CI) | 0.95 [0.12, 7.46] |
| 25.2 10.3μg vs 8.6μg | 1 | 40 | Odds Ratio (M‐H, Fixed, 95% CI) | 0.63 [0.09, 4.24] |
| 25.3 8.6μg vs 6.9μg | 1 | 39 | Odds Ratio (M‐H, Fixed, 95% CI) | 0.49 [0.10, 2.44] |
| 25.4 6.9μg vs 5.2μg | 1 | 38 | Odds Ratio (M‐H, Fixed, 95% CI) | 0.77 [0.19, 3.16] |
| 26 Dose‐response: normal response to stimulation Show forest plot | 1 | Odds Ratio (M‐H, Fixed, 95% CI) | Subtotals only | |
| 26.1 12.1μg vs 10.3μg | 1 | 41 | Odds Ratio (M‐H, Fixed, 95% CI) | 0.47 [0.08, 2.92] |
| 26.2 10.3μg vs 8.6μg | 1 | 40 | Odds Ratio (M‐H, Fixed, 95% CI) | 6.0 [1.08, 33.27] |
| 26.3 8.6μg vs 6.9μg | 1 | 39 | Odds Ratio (M‐H, Fixed, 95% CI) | 2.33 [0.55, 9.83] |
| 26.4 6.9μg vs 5.2μg | 1 | 38 | Odds Ratio (M‐H, Fixed, 95% CI) | 0.79 [0.21, 3.03] |
| 27 Dose‐response: hyper‐response to stimulation Show forest plot | 1 | Odds Ratio (M‐H, Fixed, 95% CI) | Subtotals only | |
| 27.1 12.1μg vs 10.3μg | 1 | 41 | Odds Ratio (M‐H, Fixed, 95% CI) | 5.26 [0.24, 116.57] |
| 27.2 10.3μg vs 8.6μg | 1 | 40 | Odds Ratio (M‐H, Fixed, 95% CI) | 0.32 [0.01, 8.26] |
| 27.3 8.6μg vs 6.9μg | 1 | 39 | Odds Ratio (M‐H, Fixed, 95% CI) | 0.45 [0.04, 5.39] |
| 27.4 6.9μg vs 5.2μg | 1 | 38 | Odds Ratio (M‐H, Fixed, 95% CI) | 5.57 [0.25, 124.19] |
| 28 Dose‐response: cycle cancellations for poor response Show forest plot | 1 | Odds Ratio (M‐H, Fixed, 95% CI) | Subtotals only | |
| 28.1 12.1μg vs 10.3μg | 1 | 41 | Odds Ratio (M‐H, Fixed, 95% CI) | 3.0 [0.12, 78.04] |
| 28.2 10.3μg vs 8.6μg | 1 | 40 | Odds Ratio (M‐H, Fixed, 95% CI) | 0.32 [0.01, 8.26] |
| 28.3 8.6μg vs 6.9μg | 1 | 39 | Odds Ratio (M‐H, Fixed, 95% CI) | 0.95 [0.06, 16.31] |
| 28.4 6.9μg vs 5.2μg | 1 | 38 | Odds Ratio (M‐H, Fixed, 95% CI) | 0.47 [0.04, 5.70] |
| 29 Dose‐response: women with at least one transferable embryo Show forest plot | 1 | Odds Ratio (M‐H, Fixed, 95% CI) | Subtotals only | |
| 29.1 12.1μg vs 10.3μg | 1 | 41 | Odds Ratio (M‐H, Fixed, 95% CI) | 1.68 [0.25, 11.27] |
| 29.2 10.3μg vs 8.6μg | 1 | 40 | Odds Ratio (M‐H, Fixed, 95% CI) | 0.63 [0.09, 4.24] |
| 29.3 8.6μg vs 6.9μg | 1 | 39 | Odds Ratio (M‐H, Fixed, 95% CI) | 1.69 [0.25, 11.42] |
| 29.4 6.9μg vs 5.2μg | 1 | 38 | Odds Ratio (M‐H, Fixed, 95% CI) | 0.63 [0.09, 4.26] |
| 30 Dose‐response: total dose of FSH Show forest plot | 1 | Mean Difference (IV, Fixed, 95% CI) | Subtotals only | |
| 30.1 12.1μg vs 10.3μg | 1 | 41 | Mean Difference (IV, Fixed, 95% CI) | 14.20 [0.28, 28.12] |
| 30.2 10.3μg vs 8.6μg | 1 | 40 | Mean Difference (IV, Fixed, 95% CI) | 8.20 [‐0.14, 16.54] |
| 30.3 8.6μg vs 6.9μg | 1 | 39 | Mean Difference (IV, Fixed, 95% CI) | 13.5 [5.83, 21.17] |
| 30.4 6.9μg vs 5.2μg | 1 | 38 | Mean Difference (IV, Fixed, 95% CI) | 11.30 [3.44, 19.16] |
| 31 Dose‐response: duration of FSH administration Show forest plot | 1 | Mean Difference (IV, Fixed, 95% CI) | Subtotals only | |
| 31.1 12.1μg vs 10.3μg | 1 | 41 | Mean Difference (IV, Fixed, 95% CI) | 0.0 [‐1.08, 1.08] |
| 31.2 10.3μg vs 8.6μg | 1 | 40 | Mean Difference (IV, Fixed, 95% CI) | ‐0.60 [‐1.50, 0.30] |
| 31.3 8.6μg vs 6.9μg | 1 | 39 | Mean Difference (IV, Fixed, 95% CI) | ‐0.10 [‐1.12, 0.92] |
| 31.4 6.9μg vs 5.2μg | 1 | 38 | Mean Difference (IV, Fixed, 95% CI) | ‐0.60 [‐1.91, 0.71] |
| Outcome or subgroup title | No. of studies | No. of participants | Statistical method | Effect size |
| 1 Live birth or ongoing pregnancy Show forest plot | 1 | Odds Ratio (M‐H, Fixed, 95% CI) | Subtotals only | |
| 1.1 150 IU vs 100 IU | 1 | 521 | Odds Ratio (M‐H, Fixed, 95% CI) | 0.98 [0.66, 1.46] |
| 2 Severe OHSS Show forest plot | 1 | Peto Odds Ratio (Peto, Fixed, 95% CI) | Subtotals only | |
| 2.1 150 IU vs 100 IU | 1 | 521 | Peto Odds Ratio (Peto, Fixed, 95% CI) | 0.72 [0.16, 3.19] |
| 3 Clinical pregnancy Show forest plot | 1 | Odds Ratio (M‐H, Fixed, 95% CI) | Subtotals only | |
| 3.1 150 IU vs 100 IU | 1 | 521 | Odds Ratio (M‐H, Fixed, 95% CI) | 1.14 [0.78, 1.66] |
| 4 Time to clinical pregnancy | 0 | Mean Difference (IV, Fixed, 95% CI) | Subtotals only | |
| 5 Moderate or severe OHSS Show forest plot | 1 | Peto Odds Ratio (Peto, Fixed, 95% CI) | Subtotals only | |
| 5.1 150 IU vs 100 IU | 1 | 521 | Peto Odds Ratio (Peto, Fixed, 95% CI) | 2.31 [0.80, 6.67] |
| 6 Multiple pregnancy in randomised women Show forest plot | 1 | Peto Odds Ratio (Peto, Fixed, 95% CI) | Subtotals only | |
| 6.1 150 IU vs 100 IU | 1 | 521 | Peto Odds Ratio (Peto, Fixed, 95% CI) | 1.87 [0.19, 18.09] |
| 7 Log(N oocytes retrieved); data presented on the log scale ‐ cannot interpret pooled estimates as N of oocytes Show forest plot | 1 | Mean Difference (Fixed, 95% CI) | Subtotals only | |
| 7.1 150 IU vs 100 IU | 1 | Mean Difference (Fixed, 95% CI) | 0.67 [0.55, 0.79] | |
| 8 Poor response to stimulation Show forest plot | 1 | Odds Ratio (M‐H, Fixed, 95% CI) | Subtotals only | |
| 8.1 150 IU vs 100 IU | 1 | 521 | Odds Ratio (M‐H, Fixed, 95% CI) | 0.15 [0.09, 0.25] |
| 9 Normal response to stimulation Show forest plot | 1 | Odds Ratio (M‐H, Fixed, 95% CI) | Subtotals only | |
| 9.1 150 IU vs 100 IU | 1 | 521 | Odds Ratio (M‐H, Fixed, 95% CI) | 1.07 [0.76, 1.50] |
| 10 Hyper‐response to stimulation Show forest plot | 1 | Odds Ratio (M‐H, Fixed, 95% CI) | Subtotals only | |
| 10.1 150 IU vs 100 IU | 1 | 521 | Odds Ratio (M‐H, Fixed, 95% CI) | 5.04 [3.17, 8.02] |
| 11 Cycle cancellations for poor response Show forest plot | 1 | Odds Ratio (M‐H, Fixed, 95% CI) | Subtotals only | |
| 11.1 150 IU vs 100 IU | 1 | 521 | Odds Ratio (M‐H, Fixed, 95% CI) | 0.13 [0.06, 0.28] |
| 12 Cycle cancellations for hyper‐response Show forest plot | 1 | Odds Ratio (M‐H, Fixed, 95% CI) | Subtotals only | |
| 12.1 150 IU vs 100 IU | 1 | 521 | Odds Ratio (M‐H, Fixed, 95% CI) | 5.28 [2.16, 12.90] |
| 13 Cycle cancellations for poor or hyper‐response Show forest plot | 1 | Odds Ratio (M‐H, Fixed, 95% CI) | Subtotals only | |
| 13.1 150 IU vs 100 IU | 1 | 521 | Odds Ratio (M‐H, Fixed, 95% CI) | 0.57 [0.36, 0.89] |
| 14 Women with at least one transferable embryo Show forest plot | 1 | Odds Ratio (M‐H, Fixed, 95% CI) | Subtotals only | |
| 14.1 150 IU vs 100 IU | 1 | 521 | Odds Ratio (M‐H, Fixed, 95% CI) | 2.33 [1.53, 3.55] |
| 15 Total dose of FSH Show forest plot | 1 | Mean Difference (IV, Fixed, 95% CI) | Subtotals only | |
| 15.1 150 IU vs 100 IU | 1 | 521 | Mean Difference (IV, Fixed, 95% CI) | 345.0 [280.34, 409.66] |
| 16 Duration of FSH administration Show forest plot | 1 | Mean Difference (IV, Fixed, 95% CI) | Subtotals only | |
| 16.1 150 IU vs 100 IU | 1 | 521 | Mean Difference (IV, Fixed, 95% CI) | ‐1.40 [‐1.91, ‐0.89] |
| 17 Cost per woman randomised Show forest plot | 1 | Mean Difference (Fixed, 95% CI) | Subtotals only | |
| 17.1 150 IU vs 100 IU | 1 | Mean Difference (Fixed, 95% CI) | ‐92.0 [‐325.24, 141.24] | |
| 18 Cumulative live birth: 1 cycle (fresh + frozen) Show forest plot | 1 | Odds Ratio (M‐H, Fixed, 95% CI) | Subtotals only | |
| 18.1 150 IU vs 100 IU | 1 | 521 | Odds Ratio (M‐H, Fixed, 95% CI) | 1.16 [0.81, 1.65] |
| 19 Cumulative live birth: 18 months Show forest plot | 1 | Odds Ratio (M‐H, Fixed, 95% CI) | Subtotals only | |
| 19.1 150 IU vs 100 IU | 1 | 521 | Odds Ratio (M‐H, Fixed, 95% CI) | 1.16 [0.80, 1.68] |
| 20 Multiple pregnancy in women with clinical pregnancy Show forest plot | 1 | Peto Odds Ratio (Peto, Fixed, 95% CI) | Subtotals only | |
| 20.1 150 IU vs 100 IU | 1 | 150 | Peto Odds Ratio (Peto, Fixed, 95% CI) | 1.72 [0.18, 16.89] |
| 21 Dose‐response: live birth or ongoing pregnancy Show forest plot | 1 | Odds Ratio (M‐H, Fixed, 95% CI) | Subtotals only | |
| 21.1 12.1μg vs 10.3μg | 1 | 50 | Odds Ratio (M‐H, Fixed, 95% CI) | 2.57 [0.77, 8.57] |
| 21.2 10.3μg vs 8.6μg | 1 | 48 | Odds Ratio (M‐H, Fixed, 95% CI) | 0.56 [0.16, 1.92] |
| 21.3 8.6μg vs 6.9μg | 1 | 50 | Odds Ratio (M‐H, Fixed, 95% CI) | 0.82 [0.26, 2.55] |
| 21.4 6.9μg vs 5.2μg | 1 | 49 | Odds Ratio (M‐H, Fixed, 95% CI) | 1.14 [0.36, 3.58] |
| 22 Dose‐response: clinical pregnancy Show forest plot | 1 | Odds Ratio (M‐H, Fixed, 95% CI) | Subtotals only | |
| 22.1 12.1μg vs 10.3μg | 1 | 50 | Odds Ratio (M‐H, Fixed, 95% CI) | 2.57 [0.77, 8.57] |
| 22.2 10.3μg vs 8.6μg | 1 | 48 | Odds Ratio (M‐H, Fixed, 95% CI) | 0.56 [0.16, 1.92] |
| 22.3 8.6μg vs 6.9μg | 1 | 50 | Odds Ratio (M‐H, Fixed, 95% CI) | 0.7 [0.23, 2.17] |
| 22.4 6.9μg vs 5.2μg | 1 | 49 | Odds Ratio (M‐H, Fixed, 95% CI) | 1.33 [0.43, 4.16] |
| 23 Dose‐response: cumulative live birth:1 cycle (fresh + frozen) Show forest plot | 1 | Odds Ratio (M‐H, Fixed, 95% CI) | Subtotals only | |
| 23.1 12.1μg vs 10.3μg | 1 | 50 | Odds Ratio (M‐H, Fixed, 95% CI) | 1.67 [0.54, 5.15] |
| 23.2 10.3μg vs 8.6μg | 1 | 48 | Odds Ratio (M‐H, Fixed, 95% CI) | 0.71 [0.22, 2.24] |
| 23.3 8.6μg vs 6.9μg | 1 | 50 | Odds Ratio (M‐H, Fixed, 95% CI) | 0.73 [0.24, 2.21] |
| 23.4 6.9μg vs 5.2μg | 1 | 49 | Odds Ratio (M‐H, Fixed, 95% CI) | 1.52 [0.49, 4.69] |
| 24 Dose‐response: severe OHSS Show forest plot | 1 | Peto Odds Ratio (Peto, Fixed, 95% CI) | Subtotals only | |
| 24.1 12.1μg vs 10.3μg | 1 | 50 | Peto Odds Ratio (Peto, Fixed, 95% CI) | 7.12 [0.43, 117.44] |
| 24.2 10.3μg vs 8.6μg | 1 | 48 | Peto Odds Ratio (Peto, Fixed, 95% CI) | 0.14 [0.00, 6.82] |
| 24.3 8.6μg vs 6.9μg | 1 | 50 | Peto Odds Ratio (Peto, Fixed, 95% CI) | 8.03 [0.16, 406.02] |
| 24.4 6.9μg vs 5.2μg | 1 | 49 | Peto Odds Ratio (Peto, Fixed, 95% CI) | 0.0 [0.0, 0.0] |
| 25 Dose‐response: moderate or severe OHSS Show forest plot | 1 | Peto Odds Ratio (Peto, Fixed, 95% CI) | Subtotals only | |
| 25.1 12.1μg vs 10.3μg | 1 | 50 | Peto Odds Ratio (Peto, Fixed, 95% CI) | 2.67 [0.35, 20.21] |
| 25.2 10.3μg vs 8.6μg | 1 | 48 | Peto Odds Ratio (Peto, Fixed, 95% CI) | 1.0 [0.06, 16.47] |
| 25.3 8.6μg vs 6.9μg | 1 | 50 | Peto Odds Ratio (Peto, Fixed, 95% CI) | 8.03 [0.16, 406.02] |
| 25.4 6.9μg vs 5.2μg | 1 | 49 | Peto Odds Ratio (Peto, Fixed, 95% CI) | 0.0 [0.0, 0.0] |
| 26 Dose‐response: log(N oocytes retrieved); data presented on the log scale ‐ cannot interpret pooled estimates as N of oocytes Show forest plot | 1 | Mean Difference (Fixed, 95% CI) | Subtotals only | |
| 26.1 12.1μg vs 10.3μg | 1 | Mean Difference (Fixed, 95% CI) | 0.12 [‐0.13, 0.37] | |
| 26.2 10.3μg vs 8.6μg | 1 | Mean Difference (Fixed, 95% CI) | 0.25 [‐0.02, 0.52] | |
| 26.3 8.6μg vs 6.9μg | 1 | Mean Difference (Fixed, 95% CI) | 0.21 [‐0.10, 0.52] | |
| 26.4 6.9μg vs 5.2μg | 1 | Mean Difference (Fixed, 95% CI) | 0.41 [0.06, 0.76] | |
| 27 Dose‐response: poor response to stimulation Show forest plot | 1 | Odds Ratio (M‐H, Fixed, 95% CI) | Subtotals only | |
| 27.1 12.1μg vs 10.3μg | 1 | 50 | Odds Ratio (M‐H, Fixed, 95% CI) | 0.17 [0.01, 3.72] |
| 27.2 10.3μg vs 8.6μg | 1 | 48 | Odds Ratio (M‐H, Fixed, 95% CI) | 2.09 [0.18, 24.73] |
| 27.3 8.6μg vs 6.9μg | 1 | 50 | Odds Ratio (M‐H, Fixed, 95% CI) | 0.24 [0.02, 2.31] |
| 27.4 6.9μg vs 5.2μg | 1 | 49 | Odds Ratio (M‐H, Fixed, 95% CI) | 0.28 [0.07, 1.10] |
| 28 Dose‐response: normal response to stimulation Show forest plot | 1 | Odds Ratio (M‐H, Fixed, 95% CI) | Subtotals only | |
| 28.1 12.1μg vs 10.3μg | 1 | 50 | Odds Ratio (M‐H, Fixed, 95% CI) | 1.0 [0.33, 3.03] |
| 28.2 10.3μg vs 8.6μg | 1 | 48 | Odds Ratio (M‐H, Fixed, 95% CI) | 0.33 [0.10, 1.13] |
| 28.3 8.6μg vs 6.9μg | 1 | 50 | Odds Ratio (M‐H, Fixed, 95% CI) | 1.59 [0.47, 5.42] |
| 28.4 6.9μg vs 5.2μg | 1 | 49 | Odds Ratio (M‐H, Fixed, 95% CI) | 1.73 [0.55, 5.47] |
| 29 Dose‐response: hyper‐response to stimulation Show forest plot | 1 | Odds Ratio (M‐H, Fixed, 95% CI) | Subtotals only | |
| 29.1 12.1μg vs 10.3μg | 1 | 50 | Odds Ratio (M‐H, Fixed, 95% CI) | 1.4 [0.46, 4.28] |
| 29.2 10.3μg vs 8.6μg | 1 | 48 | Odds Ratio (M‐H, Fixed, 95% CI) | 2.71 [0.76, 9.73] |
| 29.3 8.6μg vs 6.9μg | 1 | 50 | Odds Ratio (M‐H, Fixed, 95% CI) | 1.11 [0.28, 4.42] |
| 29.4 6.9μg vs 5.2μg | 1 | 49 | Odds Ratio (M‐H, Fixed, 95% CI) | 2.5 [0.44, 14.36] |
| 30 Dose‐response: cycle cancellations for poor response Show forest plot | 1 | Odds Ratio (M‐H, Fixed, 95% CI) | Subtotals only | |
| 30.1 12.1μg vs 10.3μg | 1 | 50 | Odds Ratio (M‐H, Fixed, 95% CI) | 0.0 [0.0, 0.0] |
| 30.2 10.3μg vs 8.6μg | 1 | 48 | Odds Ratio (M‐H, Fixed, 95% CI) | 0.32 [0.01, 8.25] |
| 30.3 8.6μg vs 6.9μg | 1 | 50 | Odds Ratio (M‐H, Fixed, 95% CI) | 3.38 [0.13, 87.11] |
| 30.4 6.9μg vs 5.2μg | 1 | 49 | Odds Ratio (M‐H, Fixed, 95% CI) | 0.0 [0.0, 0.0] |
| 31 Dose‐response: cycle cancellations for hyper‐response Show forest plot | 1 | Odds Ratio (M‐H, Fixed, 95% CI) | Subtotals only | |
| 31.1 12.1μg vs 10.3μg | 1 | 50 | Odds Ratio (M‐H, Fixed, 95% CI) | 0.30 [0.01, 7.61] |
| 31.2 10.3μg vs 8.6μg | 1 | 48 | Odds Ratio (M‐H, Fixed, 95% CI) | 3.13 [0.12, 80.68] |
| 31.3 8.6μg vs 6.9μg | 1 | 50 | Odds Ratio (M‐H, Fixed, 95% CI) | 0.35 [0.01, 8.93] |
| 31.4 6.9μg vs 5.2μg | 1 | 49 | Odds Ratio (M‐H, Fixed, 95% CI) | 2.76 [0.11, 71.25] |
| 32 Dose‐response: cycle cancellations for poor or hyper‐response Show forest plot | 1 | Odds Ratio (M‐H, Fixed, 95% CI) | Subtotals only | |
| 32.1 12.1μg vs 10.3μg | 1 | 50 | Odds Ratio (M‐H, Fixed, 95% CI) | 0.30 [0.01, 7.61] |
| 32.2 10.3μg vs 8.6μg | 1 | 48 | Odds Ratio (M‐H, Fixed, 95% CI) | 1.0 [0.06, 16.97] |
| 32.3 8.6μg vs 6.9μg | 1 | 50 | Odds Ratio (M‐H, Fixed, 95% CI) | 1.09 [0.06, 18.40] |
| 32.4 6.9μg vs 5.2μg | 1 | 49 | Odds Ratio (M‐H, Fixed, 95% CI) | 0.28 [0.01, 7.30] |
| 33 Dose‐response: women with at least one transferable embryo Show forest plot | 1 | Odds Ratio (M‐H, Fixed, 95% CI) | Subtotals only | |
| 33.1 12.1μg vs 10.3μg | 1 | 50 | Odds Ratio (M‐H, Fixed, 95% CI) | 6.58 [0.71, 61.08] |
| 33.2 10.3μg vs 8.6μg | 1 | 48 | Odds Ratio (M‐H, Fixed, 95% CI) | 0.35 [0.06, 1.99] |
| 33.3 8.6μg vs 6.9μg | 1 | 50 | Odds Ratio (M‐H, Fixed, 95% CI) | 1.43 [0.22, 9.42] |
| 33.4 6.9μg vs 5.2μg | 1 | 49 | Odds Ratio (M‐H, Fixed, 95% CI) | 0.73 [0.11, 4.81] |
| 34 Dose‐response: total dose of FSH Show forest plot | 1 | Mean Difference (IV, Fixed, 95% CI) | Subtotals only | |
| 34.1 12.1μg vs 10.3μg | 1 | 50 | Mean Difference (IV, Fixed, 95% CI) | 18.90 [11.03, 26.77] |
| 34.2 10.3μg vs 8.6μg | 1 | 48 | Mean Difference (IV, Fixed, 95% CI) | 9.80 [1.34, 18.26] |
| 34.3 8.6μg vs 6.9μg | 1 | 50 | Mean Difference (IV, Fixed, 95% CI) | 7.30 [‐1.17, 15.77] |
| 34.4 6.9μg vs 5.2μg | 1 | 49 | Mean Difference (IV, Fixed, 95% CI) | 12.20 [5.05, 19.35] |
| 35 Dose‐response: duration of FSH administration Show forest plot | 1 | Mean Difference (IV, Fixed, 95% CI) | Subtotals only | |
| 35.1 12.1μg vs 10.3μg | 1 | 50 | Mean Difference (IV, Fixed, 95% CI) | 0.40 [‐0.30, 1.10] |
| 35.2 10.3μg vs 8.6μg | 1 | 48 | Mean Difference (IV, Fixed, 95% CI) | ‐0.40 [‐1.32, 0.52] |
| 35.3 8.6μg vs 6.9μg | 1 | 50 | Mean Difference (IV, Fixed, 95% CI) | ‐1.0 [‐2.11, 0.11] |
| 35.4 6.9μg vs 5.2μg | 1 | 49 | Mean Difference (IV, Fixed, 95% CI) | ‐0.70 [‐1.91, 0.51] |
| Outcome or subgroup title | No. of studies | No. of participants | Statistical method | Effect size |
| 1 Live birth or ongoing pregnancy Show forest plot | 4 | Odds Ratio (M‐H, Fixed, 95% CI) | Subtotals only | |
| 1.1 Control group: standard dose 150 IU | 4 | 2823 | Odds Ratio (M‐H, Fixed, 95% CI) | 1.04 [0.88, 1.23] |
| 2 Severe OHSS Show forest plot | 4 | Peto Odds Ratio (Peto, Fixed, 95% CI) | Subtotals only | |
| 2.1 Control group: standard dose 150 IU | 3 | 1494 | Peto Odds Ratio (Peto, Fixed, 95% CI) | 0.54 [0.14, 1.99] |
| 2.2 Control group: non‐ORT algorithm | 1 | 194 | Peto Odds Ratio (Peto, Fixed, 95% CI) | 0.0 [0.0, 0.0] |
| 3 Clinical pregnancy Show forest plot | 5 | Odds Ratio (M‐H, Fixed, 95% CI) | Subtotals only | |
| 3.1 Control group: standard dose 150 IU | 4 | 2823 | Odds Ratio (M‐H, Fixed, 95% CI) | 0.96 [0.82, 1.13] |
| 3.2 Control group: non‐ORT algorithm | 1 | 194 | Odds Ratio (M‐H, Fixed, 95% CI) | 0.88 [0.48, 1.61] |
| 4 Time to clinical pregnancy | 0 | 0 | Mean Difference (IV, Fixed, 95% CI) | 0.0 [0.0, 0.0] |
| 5 Moderate or severe OHSS Show forest plot | 5 | Peto Odds Ratio (Peto, Fixed, 95% CI) | Subtotals only | |
| 5.1 Control group: standard dose 150 IU | 4 | 2823 | Peto Odds Ratio (Peto, Fixed, 95% CI) | 0.58 [0.34, 1.00] |
| 5.2 Control group: non‐ORT algorithm | 1 | 194 | Peto Odds Ratio (Peto, Fixed, 95% CI) | 0.0 [0.0, 0.0] |
| 6 Multiple pregnancy in randomised women Show forest plot | 4 | Peto Odds Ratio (Peto, Fixed, 95% CI) | Subtotals only | |
| 6.1 Control group: standard dose 150 IU | 4 | 2823 | Peto Odds Ratio (Peto, Fixed, 95% CI) | 0.77 [0.43, 1.36] |
| 6.2 Control group: non‐ORT algorithm | 0 | 0 | Peto Odds Ratio (Peto, Fixed, 95% CI) | 0.0 [0.0, 0.0] |
| 7 Log(N oocytes retrieved); data presented on the log scale ‐ cannot interpret pooled estimates as N of oocytes Show forest plot | 5 | Mean Difference (Fixed, 95% CI) | Subtotals only | |
| 7.1 Control group: standard dose 150 IU | 4 | Mean Difference (Fixed, 95% CI) | 0.16 [0.11, 0.20] | |
| 7.2 Control group: non‐ORT algorithm | 1 | Mean Difference (Fixed, 95% CI) | 0.12 [‐0.02, 0.26] | |
| 8 Poor response to stimulation Show forest plot | 3 | Odds Ratio (M‐H, Fixed, 95% CI) | Subtotals only | |
| 8.1 Control group: standard dose 150 IU | 2 | 1294 | Odds Ratio (M‐H, Fixed, 95% CI) | 1.16 [0.90, 1.50] |
| 8.2 Control group: non‐ORT algorithm | 1 | 194 | Odds Ratio (M‐H, Fixed, 95% CI) | 0.50 [0.27, 0.92] |
| 9 Normal response to stimulation Show forest plot | 4 | Odds Ratio (M‐H, Fixed, 95% CI) | Subtotals only | |
| 9.1 Control group: standard dose 150 IU | 3 | 2623 | Odds Ratio (M‐H, Fixed, 95% CI) | 1.22 [1.04, 1.43] |
| 9.2 Control group: non‐ORT algorithm | 1 | 194 | Odds Ratio (M‐H, Fixed, 95% CI) | 2.13 [1.20, 3.78] |
| 10 Hyper‐response to stimulation Show forest plot | 3 | Odds Ratio (M‐H, Fixed, 95% CI) | Subtotals only | |
| 10.1 Control group: standard dose 150 IU | 2 | 1294 | Odds Ratio (M‐H, Fixed, 95% CI) | 0.56 [0.42, 0.76] |
| 10.2 Control group: non‐ORT algorithm | 1 | 194 | Odds Ratio (M‐H, Fixed, 95% CI) | 0.57 [0.25, 1.31] |
| 11 Cycle cancellations for poor response Show forest plot | 5 | Odds Ratio (M‐H, Fixed, 95% CI) | Subtotals only | |
| 11.1 Control group: standard dose 150 IU | 4 | 2823 | Odds Ratio (M‐H, Fixed, 95% CI) | 1.19 [0.89, 1.60] |
| 11.2 Control group: non‐ORT algorithm | 1 | 194 | Odds Ratio (M‐H, Fixed, 95% CI) | 0.14 [0.01, 2.83] |
| 12 Cycle cancellations for hyper‐response Show forest plot | 5 | Odds Ratio (M‐H, Fixed, 95% CI) | Subtotals only | |
| 12.1 Control group: standard dose 150 IU | 4 | 2823 | Odds Ratio (M‐H, Fixed, 95% CI) | 0.37 [0.24, 0.57] |
| 12.2 Control group: non‐ORT algorithm | 1 | 194 | Odds Ratio (M‐H, Fixed, 95% CI) | 0.95 [0.40, 2.27] |
| 13 Cycle cancellations for poor or hyper‐response Show forest plot | 5 | Odds Ratio (M‐H, Fixed, 95% CI) | Subtotals only | |
| 13.1 Control group: standard dose 150 IU | 4 | 2823 | Odds Ratio (M‐H, Fixed, 95% CI) | 0.78 [0.61, 1.00] |
| 13.2 Control group: non‐ORT algorithm | 1 | 194 | Odds Ratio (M‐H, Fixed, 95% CI) | 0.73 [0.32, 1.69] |
| 14 Women with at least one transferable embryo Show forest plot | 5 | Odds Ratio (M‐H, Fixed, 95% CI) | Subtotals only | |
| 14.1 Control group: standard dose 150 IU | 4 | 2823 | Odds Ratio (M‐H, Fixed, 95% CI) | 0.90 [0.74, 1.10] |
| 14.2 Control group: non‐ORT algorithm | 1 | 194 | Odds Ratio (M‐H, Fixed, 95% CI) | 1.15 [0.57, 2.33] |
| 15 Total dose of FSH Show forest plot | 4 | Mean Difference (IV, Fixed, 95% CI) | Subtotals only | |
| 15.1 Control group: standard dose 150 IU | 3 | 1494 | Mean Difference (IV, Fixed, 95% CI) | ‐155.00 [‐215.54, ‐98.45] |
| 15.2 Control group: non‐ORT algorithm | 1 | 194 | Mean Difference (IV, Fixed, 95% CI) | ‐11.0 [‐210.30, 188.30] |
| 16 Duration of FSH administration Show forest plot | 5 | Mean Difference (IV, Fixed, 95% CI) | Subtotals only | |
| 16.1 Control group: standard dose 150 IU | 4 | 2823 | Mean Difference (IV, Fixed, 95% CI) | 0.23 [0.09, 0.37] |
| 16.2 Control group: non‐ORT algorithm | 1 | 194 | Mean Difference (IV, Fixed, 95% CI) | ‐0.40 [‐0.84, 0.04] |
| 17 Cost per woman randomised | 0 | 0 | Mean Difference (IV, Fixed, 95% CI) | 0.0 [0.0, 0.0] |
| 18 Cumulative live birth: 1 cycle (fresh + frozen) Show forest plot | 1 | Odds Ratio (M‐H, Fixed, 95% CI) | Subtotals only | |
| 18.1 Control group: standard dose 150 IU | 1 | 1032 | Odds Ratio (M‐H, Fixed, 95% CI) | 0.87 [0.66, 1.14] |
| 18.2 Control group: non‐ORT algorithm | 0 | 0 | Odds Ratio (M‐H, Fixed, 95% CI) | 0.0 [0.0, 0.0] |
| 19 Cumulative live birth: 18 months Show forest plot | 1 | Odds Ratio (M‐H, Fixed, 95% CI) | Subtotals only | |
| 19.1 Control group: standard dose 150 IU | 1 | 1032 | Odds Ratio (M‐H, Fixed, 95% CI) | 0.89 [0.70, 1.14] |
| 19.2 Control group: non‐ORT algorithm | 0 | 0 | Odds Ratio (M‐H, Fixed, 95% CI) | 0.0 [0.0, 0.0] |
| 20 Multiple pregnancy in women with clinical pregnancy Show forest plot | 4 | Peto Odds Ratio (Peto, Fixed, 95% CI) | Subtotals only | |
| 20.1 Control group: standard dose 150 IU | 4 | 898 | Peto Odds Ratio (Peto, Fixed, 95% CI) | 0.71 [0.39, 1.28] |
| 20.2 Control group: non‐ORT algorithm | 0 | 0 | Peto Odds Ratio (Peto, Fixed, 95% CI) | 0.0 [0.0, 0.0] |
| Outcome or subgroup title | No. of studies | No. of participants | Statistical method | Effect size |
| 1 Live birth or ongoing pregnancy | 0 | Odds Ratio (M‐H, Fixed, 95% CI) | Subtotals only | |
| 2 Severe OHSS Show forest plot | 1 | 348 | Peto Odds Ratio (Peto, Fixed, 95% CI) | 0.0 [0.0, 0.0] |
| 3 Clinical pregnancy Show forest plot | 1 | 348 | Odds Ratio (M‐H, Fixed, 95% CI) | 0.82 [0.53, 1.27] |
| 4 Time to clinical pregnancy | 0 | 0 | Mean Difference (IV, Fixed, 95% CI) | 0.0 [0.0, 0.0] |
| 5 Moderate or severe OHSS Show forest plot | 1 | 348 | Peto Odds Ratio (Peto, Fixed, 95% CI) | 4.28 [0.96, 19.07] |
| 6 Multiple pregnancy in randomised women Show forest plot | 1 | 348 | Peto Odds Ratio (Peto, Fixed, 95% CI) | 1.21 [0.66, 2.23] |
| 7 Log(N oocytes retrieved); data presented on the log scale ‐ cannot interpret pooled estimates as N of oocytes Show forest plot | 1 | Mean Difference (Fixed, 95% CI) | ‐0.25 [‐0.37, ‐0.13] | |
| 8 Poor response to stimulation Show forest plot | 1 | Odds Ratio (Fixed, 95% CI) | 2.25 [0.94, 5.35] | |
| 9 Normal response to stimulation Show forest plot | 1 | Odds Ratio (Fixed, 95% CI) | 1.38 [0.87, 2.17] | |
| 10 Hyper‐response to stimulation Show forest plot | 1 | Odds Ratio (Fixed, 95% CI) | 0.45 [0.23, 0.88] | |
| 11 Cycle cancellations for poor response Show forest plot | 1 | 348 | Odds Ratio (M‐H, Fixed, 95% CI) | 1.51 [0.25, 9.14] |
| 12 Cycle cancellations for hyper‐response Show forest plot | 1 | 348 | Odds Ratio (M‐H, Fixed, 95% CI) | 0.54 [0.23, 1.25] |
| 13 Cycle cancellations for poor or hyper‐response Show forest plot | 1 | 348 | Odds Ratio (M‐H, Fixed, 95% CI) | 0.64 [0.30, 1.38] |
| 14 Women with at least one transferable embryo Show forest plot | 1 | 348 | Odds Ratio (M‐H, Fixed, 95% CI) | 1.21 [0.36, 4.03] |
| 15 Total dose of FSH Show forest plot | 1 | 348 | Mean Difference (IV, Fixed, 95% CI) | ‐178.0 [‐413.88, 57.88] |
| 16 Duration of FSH administration Show forest plot | 1 | 348 | Mean Difference (IV, Fixed, 95% CI) | 0.20 [‐0.11, 0.51] |
| 17 Live birth or ongoing pregnancy (including FET for freeze‐all) | 0 | Odds Ratio (M‐H, Fixed, 95% CI) | Subtotals only | |
| 18 Cost per woman randomised | 0 | 0 | Mean Difference (IV, Fixed, 95% CI) | 0.0 [0.0, 0.0] |
| 19 Multiple pregnancy in women with clinical pregnancy Show forest plot | 1 | 128 | Peto Odds Ratio (Peto, Fixed, 95% CI) | 1.59 [0.78, 3.25] |
| Outcome or subgroup title | No. of studies | No. of participants | Statistical method | Effect size |
| 1 Live birth or ongoing pregnancy Show forest plot | 1 | 308 | Odds Ratio (M‐H, Fixed, 95% CI) | 1.18 [0.72, 1.93] |
| 2 Severe OHSS Show forest plot | 1 | 308 | Peto Odds Ratio (Peto, Fixed, 95% CI) | 0.68 [0.12, 4.00] |
| 3 Clinical pregnancy Show forest plot | 1 | 308 | Odds Ratio (M‐H, Fixed, 95% CI) | 1.37 [0.84, 2.23] |
| 4 Time to clinical pregnancy | 0 | 0 | Mean Difference (IV, Fixed, 95% CI) | 0.0 [0.0, 0.0] |
| 5 Moderate or severe OHSS Show forest plot | 1 | 308 | Peto Odds Ratio (Peto, Fixed, 95% CI) | 0.85 [0.26, 2.83] |
| 6 Multiple pregnancy in randomised women Show forest plot | 1 | 308 | Peto Odds Ratio (Peto, Fixed, 95% CI) | 0.0 [0.0, 0.0] |
| 7 Log(N oocytes retrieved); data presented on the log scale ‐ cannot interpret pooled estimates as N of oocytes Show forest plot | 1 | Mean Difference (Fixed, 95% CI) | ‐0.19 [‐0.31, ‐0.07] | |
| 8 Poor response to stimulation Show forest plot | 1 | Odds Ratio (Fixed, 95% CI) | 2.82 [1.52, 5.25] | |
| 9 Normal response to stimulation Show forest plot | 1 | Odds Ratio (Fixed, 95% CI) | 0.71 [0.45, 1.12] | |
| 10 Hyper‐response to stimulation Show forest plot | 1 | Odds Ratio (Fixed, 95% CI) | 0.72 [0.43, 1.23] | |
| 11 Cycle cancellations for poor response Show forest plot | 1 | 308 | Odds Ratio (M‐H, Fixed, 95% CI) | 1.83 [0.53, 6.40] |
| 12 Cycle cancellations for hyper‐response Show forest plot | 1 | 308 | Odds Ratio (M‐H, Fixed, 95% CI) | 0.50 [0.12, 2.05] |
| 13 Cycle cancellations for poor or hyper‐response Show forest plot | 1 | 308 | Odds Ratio (M‐H, Fixed, 95% CI) | 1.03 [0.42, 2.55] |
| 14 Women with at least one transferable embryo Show forest plot | 1 | 308 | Odds Ratio (M‐H, Fixed, 95% CI) | 1.04 [0.50, 2.19] |
| 15 Total dose of FSH Show forest plot | 1 | 308 | Mean Difference (IV, Fixed, 95% CI) | 81.0 [‐111.93, 273.93] |
| 16 Duration of FSH administration Show forest plot | 1 | 308 | Mean Difference (IV, Fixed, 95% CI) | 0.5 [0.10, 0.90] |
| 17 Cost per woman randomised | 0 | 0 | Mean Difference (IV, Fixed, 95% CI) | 0.0 [0.0, 0.0] |
| 18 Live birth or ongoing pregnancy (including FET for freeze‐all) Show forest plot | 1 | 308 | Odds Ratio (M‐H, Fixed, 95% CI) | 1.25 [0.77, 2.05] |
| 19 Multiple pregnancy in women with clinical pregnancy Show forest plot | 1 | 83 | Peto Odds Ratio (Peto, Fixed, 95% CI) | 0.0 [0.0, 0.0] |
| Outcome or subgroup title | No. of studies | No. of participants | Statistical method | Effect size |
| 1 Live birth or ongoing pregnancy Show forest plot | 1 | 215 | Odds Ratio (M‐H, Fixed, 95% CI) | 0.54 [0.28, 1.04] |
| 2 Severe OHSS | 0 | Peto Odds Ratio (Peto, Fixed, 95% CI) | Subtotals only | |
| 3 Clinical pregnancy Show forest plot | 1 | 215 | Odds Ratio (M‐H, Fixed, 95% CI) | 0.51 [0.28, 0.93] |
| 4 Time to clinical pregnancy | 0 | 0 | Mean Difference (IV, Fixed, 95% CI) | 0.0 [0.0, 0.0] |
| 5 Moderate or severe OHSS | 0 | Peto Odds Ratio (Peto, Fixed, 95% CI) | Subtotals only | |
| 6 Multiple pregnancy in randomised women | 0 | Peto Odds Ratio (Peto, Fixed, 95% CI) | Subtotals only | |
| 7 Log(N oocytes retrieved); data presented on the log scale ‐ cannot interpret pooled estimates as N of oocytes Show forest plot | 1 | Mean Difference (Fixed, 95% CI) | ‐0.20 [‐0.81, 0.41] | |
| 8 Poor response to stimulation Show forest plot | 1 | Odds Ratio (Fixed, 95% CI) | 1.46 [0.77, 2.79] | |
| 9 Normal response to stimulation Show forest plot | 1 | Odds Ratio (Fixed, 95% CI) | 0.75 [0.42, 1.35] | |
| 10 Hyper‐response to stimulation Show forest plot | 1 | Odds Ratio (Fixed, 95% CI) | 0.93 [0.45, 1.93] | |
| 11 Cycle cancellations for poor response | 0 | Odds Ratio (M‐H, Fixed, 95% CI) | Subtotals only | |
| 12 Cycle cancellations for hyper‐response | 0 | Odds Ratio (M‐H, Fixed, 95% CI) | Subtotals only | |
| 13 Cycle cancellations for poor or hyper‐response | 0 | Odds Ratio (M‐H, Fixed, 95% CI) | Subtotals only | |
| 14 Women with at least one transferable embryo | 0 | Odds Ratio (M‐H, Fixed, 95% CI) | Subtotals only | |
| 15 Total dose of FSH Show forest plot | 1 | 215 | Mean Difference (IV, Fixed, 95% CI) | ‐148.0 [‐433.61, 137.61] |
| 16 Duration of FSH administration Show forest plot | 1 | 215 | Mean Difference (IV, Fixed, 95% CI) | 0.0 [‐0.60, 0.60] |
| 17 Cost per woman randomised | 0 | 0 | Mean Difference (IV, Fixed, 95% CI) | 0.0 [0.0, 0.0] |
| 18 Live birth or ongoing pregnancy (including FET for freeze‐all) | 0 | Odds Ratio (M‐H, Fixed, 95% CI) | Subtotals only | |
| 19 Multiple pregnancy in women with clinical pregnancy | 0 | Peto Odds Ratio (Peto, Fixed, 95% CI) | Subtotals only | |