Intervenciones para la infertilidad inexplicada: una revisión sistemática y un metanálisis en red
Resumen
Antecedentes
El tratamiento clínico para la infertilidad inexplicada incluye el tratamiento expectante, así como los tratamientos activos como la estimulación ovárica (EO), la inseminación intrauterina (IIU), la EO/IIU y la fertilización in vitro (FIV) con o sin inyección intracitoplasmática de espermatozoides (ICSI).
Las revisiones sistemáticas existentes han realizado comparaciones directas de estas intervenciones mediante metanálisis pareados. Como este enfoque solo permite la comparación de dos intervenciones a la vez y depende de la disponibilidad de estudios evaluativos primarios apropiados, es difícil identificar la mejor intervención en cuanto a efectividad y seguridad. El metanálisis en red compara múltiples tratamientos simultáneamente mediante el uso de evidencia directa e indirecta y proporciona una jerarquía de estos tratamientos, lo que potencialmente puede informar mejor la toma de decisiones clínicas.
Objetivos
Evaluar la efectividad y la seguridad de diferentes enfoques de tratamiento clínico (tratamiento expectante, EO, IIU, EO/IIU y FIV/ICSI) en parejas con infertilidad inexplicada.
Métodos de búsqueda
Se realizó una revisión sistemática y un metanálisis en red de los ensayos controlados aleatorizados (ECA) pertinentes. Se realizaron búsquedas en las bases de datos electrónicas, incluido el Registro Especializado de Ensayos Controlados del Grupo Cochrane de Ginecología y Fertilidad (Cochrane Gynaecology and Fertility Group), el Registro Cochrane Central de Estudios en Línea (Cochrane Central Register of Studies Online), MEDLINE, Embase, PsycINFO y CINAHL, hasta el 6 de septiembre de 2018, así como en las listas de referencias, para identificar estudios elegibles. También se realizaron búsquedas de ensayos en curso en los registros de ensayos.
Criterios de selección
Se incluyeron ECA que compararon al menos dos de las siguientes opciones de tratamiento clínico en parejas con infertilidad inexplicada: tratamiento expectante, EO, IIU, EO/IIU y FIV (o combinada con ICSI).
Obtención y análisis de los datos
Dos autores de la revisión examinaron, de forma independiente, los títulos y resúmenes identificados mediante la estrategia de búsqueda. Se obtuvieron los textos completos de los estudios potencialmente elegibles para evaluar la elegibilidad y se extrajeron los datos mediante formularios estandarizados. La medida de resultado primaria de efectividad fue una combinación de nacidos vivos o embarazo en curso acumulativos, y la medida de resultado primaria de seguridad fue el embarazo múltiple. Se realizó un metanálisis en red dentro de un modelo de metanálisis de efectos aleatorios con múltiples variables. Los efectos del tratamiento se presentaron mediante los odds‐ratios (OR) y los intervalos de confianza (IC) del 95%. Para el metanálisis en red se utilizó Confidence in Network Meta‐analysis (CINeMA) para evaluar la certeza general de la evidencia.
Resultados principales
En esta revisión sistemática se incluyeron 27 ECA (4349 parejas), y se incluyeron 24 ECA (3983 parejas) en un metanálisis en red posterior. En general, la certeza de la evidencia fue baja a moderada; las principales limitaciones fueron la imprecisión o la heterogeneidad.
Diez ECA que incluyeron 2725 parejas informaron sobre los nacidos vivos. La evidencia de diferencias entre la EO, la IIU, la EO/IIU o la FIV/ICSI versus el tratamiento expectante fue insuficiente (OR 1,01; IC del 95%: 0,51 a 1,98; evidencia de certeza baja; OR 1,21; IC del 95%: 0,61 a 2,43; evidencia de certeza baja; OR 1,61; IC del 95%: 0,88 a 2,94; evidencia de certeza baja; OR 1,88; IC del 95%: 0,81 a 4,38; evidencia de certeza baja). Lo anterior indica que, si se asume que la probabilidad de un nacido vivo después del tratamiento expectante es del 17%, la probabilidad después de la EO, la IIU, la EO/IIU y la FIV sería del 9% al 28%, del 11% al 33%, del 15% al 37% y del 14% al 47%, respectivamente. Cuando solo se incluyeron parejas con un pronóstico deficiente para la concepción natural (tres ensayos, 725 parejas), se encontró que la EO/IIU y la FIV/ICSI aumentaron la tasa de nacidos vivos en comparación con el tratamiento expectante (OR 4,48; IC del 95%: 2,00 a 10,1; evidencia de certeza moderada; OR 4,99; 95 IC: 2,07 a 12,04; evidencia de certeza moderada), mientras que no hubo evidencia suficiente de una diferencia entre la FIV/ICSI y la EO/IIU (OR 1,11; IC del 95%: 0,78 a 1,60; evidencia de certeza baja).
Once ECA que incluyeron 2564 parejas informaron sobre el embarazo múltiple. En comparación con el tratamiento expectante/IIU, la EO (OR 3,07; IC del 95%: 1,00 a 9,41; evidencia de certeza baja) y la EO/IIU (OR 3,34; IC del 95%: 1,09 a 10,29; evidencia de certeza moderada) aumentaron las probabilidades de embarazo múltiple, y no hubo evidencia suficiente de una diferencia entre la FIV/ICSI y el tratamiento expectante de la IIU (OR 2,66; IC del 95%: 0,68 a 10,43; evidencia de certeza baja). Estos resultados indican que, si se asume que la probabilidad de embarazo múltiple después del tratamiento expectante o de la IIU es de 0,6%, la probabilidad después de la EO, la EO/IIU y la FIV/ICSI sería de 0,6% a 5,0%, 0,6% a 5,4% y 0,4% a 5,5%, respectivamente.
Los resultados de los ensayos no muestran evidencia suficiente de una diferencia entre la FIV/ICSI y la EO/IIU para el síndrome de hiperestimulación ovárica (SHEO) moderado/grave (OR 2,50; IC del 95%: 0,92 a 6,76; 5 estudios; 985 mujeres; evidencia de certeza moderada). Lo anterior indica que, si se asume que la probabilidad de un SHEO moderado/grave después de una EO/IIU es del 1,1%, la probabilidad después de una FIV/ICSI sería de entre el 1,0% y el 7,2%.
Conclusiones de los autores
No hay evidencia suficiente de diferencias en los nacidos vivos entre el tratamiento expectante y las otras cuatro intervenciones (EO, IIU, EO/IIU y FIV/ICSI). En comparación con el tratamiento expectante o la IIU, la EO puede aumentar las probabilidades de embarazo múltiple, y la EO/IIU podría aumentar las probabilidades de embarazo múltiple. La evidencia sobre las diferencias entre la FIV/ICSI y el tratamiento expectante para el embarazo múltiple es insuficiente, al igual que la evidencia de una diferencia para el SHEO moderado o grave entre la FIV/ICSI y la EO/IIU.
PICO
Resumen en términos sencillos
Intervenciones para la infertilidad inexplicada: una revisión sistemática y un metanálisis
Pregunta de la revisión
Los investigadores de Cochrane examinaron la evidencia sobre la efectividad y la seguridad de la estimulación ovárica (EO), la inseminación intrauterina (IIU), la EO/IIU y la fertilización in vitro (FIV) con o sin inyección intracitoplasmática de espermatozoides (ICSI) versus el tratamiento expectante en parejas con infertilidad inexplicada.
Antecedentes
Las opciones de tratamiento para la infertilidad inexplicada incluyen el tratamiento expectante, así como tratamientos activos como la estimulación ovárica (EO), la inseminación intrauterina (IIU), la EO/IIU y la fertilización in vitro (FIV) con o sin inyección intracitoplasmática de espermatozoides (ICSI). El metanálisis en red resume la evidencia de las comparaciones directas e indirectas de las intervenciones y permite a los investigadores evaluar simultáneamente la efectividad de más de dos intervenciones para la misma enfermedad, de manera que los médicos pueden utilizar la evidencia para ofrecer el mejor tratamiento. Por lo tanto, todas estas diferentes opciones de tratamiento se compararon mediante el metanálisis en red para informar mejor la toma de decisiones clínicas.
Características de los estudios
Se encontraron 27 ensayos controlados aleatorizados que compararon estos tratamientos entre sí, con un total de 4349 parejas con infertilidad inexplicada. La evidencia está actualizada hasta septiembre 2018.
Resultados clave
La evidencia de diferencias en los nacidos vivos entre el tratamiento expectante y los otros cuatro tratamientos (EO, IIU, EO/IIU y FIV/ICSI) fue insuficiente. Si se supone que la probabilidad de un nacido vivo después del tratamiento expectante es del 17%, la probabilidad después de la EO, la IIU, la EO/IIU y la FIV sería del 9% al 28%, del 11% al 33%, del 15% al 37% y del 14% al 47%, respectivamente. En comparación con el tratamiento expectante o la IIU, la EO puede aumentar las probabilidades de embarazo múltiple, y la EO/IIU probablemente aumenta las probabilidades de embarazo múltiple. La evidencia que muestra diferencias entre la FIV/ICSI y el tratamiento expectante para el embarazo múltiple fue insuficiente. Si se supone que la probabilidad de embarazo múltiple después del tratamiento expectante de la IIU es del 1%, la probabilidad después de la EO, la EO/IIU y la FIV/ICSI sería del 1% al 5%, del 1% al 5%, y del 0% al 6%, respectivamente.
Certeza de la evidencia
La certeza de la evidencia en general fue baja a moderada. Las principales limitaciones fueron la imprecisión (no se han estudiado suficientes parejas) y la heterogeneidad (las parejas en los estudios existentes tenían características clínicas diferentes).
Conclusiones de los autores
Summary of findings
| Estimates of effects, confidence intervals, and certainty of the evidence for live birth in couples with unexplained infertility | |||||
| Patient or population: couples with unexplained infertility Intervention: OS, IUI, OS‐IUI, or IVF/ICSI Comparator: expectant management, OS, IUI, or OS‐IUI Outcome: live birth Setting: outpatient | |||||
| All comparisons (10 RCTs, 2725 couples) | Illustrative comparative risks* (95% CI) | Relative effect | Quality of the evidence | ||
| Comparator | Intervention (number of RCTs and number of couples in direct comparison) | Assumed risk with comparator | Corresponding risk with intervention | ||
| Expectant management | OS (2 RCTs, 527 couples) | 166 per 1000 | 167 per 1000 | OR 1.01 | ⊕⊕⊝⊝ LOWa |
| IUI (1 RCT, 386 couples) | 166 per 1000 | 194 per 1000 | OR 1.45 | ⊕⊕⊝⊝ LOWa | |
| OS‐IUI (2 RCTs, 454 couples) | 166 per 1000 | 242 per 1000 | OR 1.61 | ⊕⊕⊝⊝ LOWb | |
| IVF/ICSI (no direct evidence available; only indirect evidence used here) | 166 per 1000 | 272 per 1000 | OR 1.88 | ⊕⊕⊝⊝ LOWa | |
| OS | IUI (1 RCT, 387 couples) | 174 per 1000 | 201 per 1000 | OR 1.20 | ⊕⊕⊝⊝ LOWa |
| OS‐IUI (1 RCT, 184 couples) | 174 per 1000 | 252 per 1000 | OR 1.60 | ⊕⊕⊝⊝ LOWa | |
| IVF/ICSI (no direct evidence available; only indirect evidence used here) | 174 per 1000 | 281 per 1000 | OR 2.63 | ⊕⊕⊝⊝ LOWa | |
| IUI | OS‐IUI (2 RCTs, 636 couples) | 166 per 1000 | 209 per 1000 | OR 1.33 | ⊕⊕⊝⊝ LOWa |
| IVF/ICSI (no direct evidence available; only indirect evidence used here) | 166 per 1000 | 235 per 1000 | OR 1.55 | ⊕⊕⊝⊝ LOWa | |
| OS‐IUI | IVF/ICSI (3 RCTs, 731 couples) | 319 per 1000 | 354 per 1000 | OR 1.17 | ⊕⊕⊝⊝ LOWa |
| CI: confidence interval; OR: odds ratio; RCT: randomised controlled trial. *The corresponding risk in the intervention group (and its 95% CI) is based on the mean risk in the comparator group and the relative effect of the intervention (and its 95% CI). **All ORs and 95% CIs are based on network estimates. | |||||
| GRADE Working Group grades of evidence. | |||||
| aDowngraded by two levels for very serious imprecision. bDowngraded by two levels for serious imprecision and serious heterogeneity. | |||||
| Estimates of effects, confidence intervals, and certainty of the evidence for multiple pregnancy in couples with unexplained infertility | |||||
| Patient or population: couples with unexplained infertility Intervention: OS, OS‐IUI, or IVF/ICSI Comparator: expectant management/IUI, OS, or OS‐IUI Outcome: multiple pregnancy Setting: outpatient | |||||
| All comparisons (11 RCTs, 2564 couples) | Illustrative comparative risks* (95% CI) | Relative effect | Quality of the evidence | ||
| Comparator | Intervention (number of RCTs and number of couples in direct comparison) | Assumed risk with comparator | Corresponding risk with intervention | ||
| Expectant management/IUI | OS (3 RCTs, 934 couples) | 6 per 1000 | 17 per 1000 | OR 3.07 | ⊕⊕⊝⊝ LOWa |
| OS‐IUI (3 RCTs, 625 couples) | 6 per 1000 | 18 per 1000 | OR 3.34 | ⊕⊕⊕⊝ MODERATEb | |
| IVF/ICSI (no direct evidence available; only indirect evidence used here) | 6 per 1000 | 15 per 1000 | OR 2.66 | ⊕⊕⊝⊝ LOWc | |
| OS | OS‐IUI (2 RCTs, 274 couples) | 23 per 1000 | 26 per 1000 | OR 1.09 | ⊕⊝⊝⊝ VERY LOWd |
| IVF/ICSI (no direct evidence available; only indirect evidence used here) | 23 per 1000 | 20 per 1000 | OR 0.87 | ⊕⊕⊝⊝ LOWc | |
| OS‐IUI | IVF/ICSI (3 RCTs, 731 couples) | 27 per 1000 | 22 per 1000 | OR 0.80 | ⊕⊕⊝⊝ LOWc |
| CI: confidence interval; OR: odds ratio; RCT: randomised controlled trial. *The corresponding risk in the intervention group (and its 95% CI) is based on the mean risk in the comparator group and the relative effect of the intervention (and its 95% CI). **All ORs and 95% CIs are based on network estimates. | |||||
| GRADE Working Group grades of evidence. | |||||
| aDowngraded by two levels for serious imprecision and serious heterogeneity. bDowngraded by one level for serious imprecision. cDowngraded by two levels for very serious imprecision. dDowngraded by three levels for serious study limitations and very serious imprecision. | |||||
| Estimates of effects, confidence intervals, and certainty of the evidence for clinical pregnancy in couples with unexplained infertility | |||||
| Patient or population: couples with unexplained infertility Intervention: OS, IUI, OS‐IUI, or IVF/ICSI Comparator: expectant management, OS, IUI, or OS‐IUI Outcome: clinical pregnancy Setting: outpatient | |||||
| All comparisons (23 RCTs, 3792 couples) | Illustrative comparative risks* (95% CI) | Relative effect | Quality of the evidence | ||
| Comparator | Intervention (number of RCTs and number of couples in direct comparison) | Assumed risk with comparator | Corresponding risk with intervention | ||
| Expectant management | OS (6 RCTs, 939 couples) | 157 per 1000 | 234 per 1000 | OR 1.64 | ⊕⊝⊝⊝ VERY LOWa |
| IUI (3 RCTs, 528 couples) | 157 per 1000 | 182 per 1000 | OR 1.20 | ⊕⊕⊝⊝ LOWb | |
| OS‐IUI (4 RCTs, 525 couples) | 157 per 1000 | 301 per 1000 | OR 2.32 | ⊕⊕⊝⊝ LOWc | |
| IVF/ICSI (no direct evidence available; only indirect evidence used here) | 157 per 1000 | 360 per 1000 | OR 3.03 | ⊕⊕⊝⊝ LOWc | |
| OS | IUI (2 RCTs, 407 couples) | 213 per 1000 | 165 per 1000 | OR 0.73 | ⊕⊝⊝⊝ VERY LOWd |
| OS‐IUI (8 RCTs, 763 couples) | 213 per 1000 | 276 per 1000 | OR 1.41 | ⊕⊝⊝⊝ VERY LOWe | |
| IVF/ICSI (no direct evidence available; only indirect evidence used here) | 213 per 1000 | 332 per 1000 | OR 1.84 | ⊕⊕⊝⊝ LOWf | |
| IUI | OS‐IUI (4 RCTs, 579 couples) | 174 per 1000 | 291 per 1000 | OR 1.94 | ⊕⊝⊝⊝ VERY LOWa |
| IVF/ICSI (no direct evidence available; only indirect evidence used here) | 174 per 1000 | 347 per 1000 | OR 2.52 | ⊕⊕⊝⊝ LOWf | |
| OS‐IUI | IVF/ICSI (3 RCTs, 731 couples) | 344 per 1000 | 437 per 1000 | OR 1.30 | ⊕⊕⊝⊝ LOWb |
| CI: confidence interval; OR: odds ratio; RCT: randomised controlled trial. *The corresponding risk in the intervention group (and its 95% CI) is based on the mean risk in the comparator group and the relative effect of the intervention (and its 95% CI). **All ORs and 95% CIs are based on network estimates. | |||||
| GRADE Working Group grades of evidence. | |||||
| aDowngraded by three levels for serious study limitations, imprecision, and heterogeneity. bDowngraded by two levels for very serious imprecision. cDowngraded by two levels for very serious heterogeneity. dDowngraded by three levels for very serious imprecision and serious incoherence. eDowngraded by three levels for very serious study limitations, serious imprecision, and serious heterogeneity. fDowngraded by two levels for serious imprecision and serious heterogeneity. | |||||
| IVF/ICSI compared with OS‐IUI for unexplained infertility | ||||||
| Patient or population: couples with unexplained infertility Settings: outpatient Intervention: IVF/ICSI Comparison: OS‐IUI | ||||||
| Outcomes | Illustrative comparative risks* (95% CI) | Relative effect | No. of participants | Quality of the evidence | Comments | |
| Assumed risk | Corresponding risk | |||||
| with OS‐IUI | with IVF/ICSI | |||||
| Moderate/severe OHSS | 11 per 1000 | 28 per 1000 | OR 2.50 (0.92 to 6.76) | 958 | ⊕⊕⊕⊝ | |
| *The basis for the assumed risk (e.g. the median control group risk across studies) is provided in footnotes. The corresponding risk (and its 95% confidence interval) is based on the assumed risk in the comparison group and the relative effect of the intervention (and its 95% CI). | ||||||
| GRADE Working Group grades of evidence. | ||||||
| aDowngraded by one level for serious imprecision. | ||||||
Antecedentes
Descripción de la afección
Hasta una de cada ocho parejas que tratan de lograr un embarazo no lo logran después de 12 meses de relaciones sexuales sin protección (Boivin 2007; Datta 2016; Gnoth 2003). Las investigaciones habituales de fertilidad que incluyen análisis de semen, evaluación de la ovulación y una prueba de permeabilidad tubárica no muestran anomalías en el 25% de las parejas, por lo que se dice que tienen infertilidad inexplicada (Brandes 2010; Hull 1985). En ausencia de una barrera obvia para la concepción, muchas de estas parejas tienen una buena oportunidad de lograr un embarazo sin tratamiento (Brandes 2011).
Descripción de la intervención
Las guías clínicas para el tratamiento de la infertilidad inexplicada recomiendan comenzar con las intervenciones menos invasivas antes de pasar a las más invasivas (ASRM 2006; NICE 2013; NVOG 2010). En la práctica clínica, esta recomendación ha dado lugar a una amplia gama de enfoques de tratamiento clínico que van desde el tratamiento expectante (es decir, relaciones sexuales) hasta las relaciones sexuales programadas, la estimulación ovárica (es decir, gonadotropinas, inhibidores de la aromatasa o antiestrógenos), la inseminación intrauterina (IIU) con o sin estimulación ovárica, la fertilización in vitro (FIV) y la inyección intracitoplasmática de espermatozoides (ICSI).
Tratamiento expectante o relaciones sexuales programadas
Las parejas tienen buenas posibilidades de lograr un embarazo sin tratamiento. Se ha informado una tasa acumulativa de embarazos en curso del 27% después de 12 meses de relaciones sexuales sin protección tras la finalización de las investigaciones de fertilidad (Hunault 2005; van Eekelen 2017).
Estimulación ovárica (EO)
Los antiestrógenos (p. ej. clomifeno), las gonadotropinas (p. ej. hormona foliculoestimulante recombinante o urinaria) y los inhibidores de la aromatasa (p.ej. letrozol) son los fármacos utilizados con mayor frecuencia para la EO. La EO se utiliza para estimular el crecimiento folicular a fin de aumentar el número de ovocitos maduros disponibles para la fertilización, bajo la suposición de que esto aumentaría la probabilidad de un nacido vivo.
IIU (con o sin EO)
La IIU es otra opción de tratamiento para la infertilidad inexplicada. Implica la colocación de espermatozoides preparados en la cavidad uterina en el momento de la ovulación (Kandavel 2018). La IIU se puede realizar en un ciclo natural o en combinación con la EO. Se han informado tasas de nacidos vivos de aproximadamente el 6% al 10% por ciclo para parejas con infertilidad inexplicada que se someten a una IIU con o sin estimulación ovárica (Huang 2018).
FIV e ICSI
La FIV convencional se refiere a la coincubación de ovocitos con espermatozoides in vitro con el objetivo de lograr la fecundación fuera del cuerpo (Zegers‐Hochschild 2017); esta técnica se utilizó por primera vez como una opción de tratamiento para la infertilidad tubárica (Steptoe 1978). La ICSI es un procedimiento en el que se inyecta un espermatozoide único en el citoplasma del ovocito (Zegers‐Hochschild 2017); este procedimiento se utilizó por primera vez en parejas con infertilidad grave por factor masculino (Palermo 1992). En las últimas tres décadas, la indicación de FIV e ICSI se ha ampliado para abarcar una gama más amplia de parejas con infertilidad, e incluye las que presentan infertilidad inexplicada (Kamphuis 2014).
De qué manera podría funcionar la intervención
En las parejas con infertilidad inexplicada no se ha detectado una causa biológica para su infertilidad involuntaria y, por lo tanto, la justificación de cada posible tratamiento se basa en suposiciones.
El concepto detrás de las relaciones sexuales programado es ayudar a las parejas a tener relaciones sexuales en el mejor momento para la fertilización mediante la monitorización del ciclo. La estimulación ovárica se utiliza para estimular el crecimiento folicular y aumentar el número de ovocitos maduros disponibles para la fertilización. La IIU acerca los espermatozoides al ovocito para su fertilización en el momento oportuno. La administración simultánea de EO e IIU combina estos efectos. La FIV evita el proceso de transporte de los espermatozoides. La ICSI ayuda a la fertilización al superar cualquier anomalía sutil de la interacción esperma‐ovocito.
Por qué es importante realizar esta revisión
Diversas revisiones han examinado intervenciones para parejas con infertilidad inexplicada (Athaullah 2002; Gunn 2016; Hughes 2010; Pandian 2015; Veltman‐Verhulst 2016). Estas revisiones han incluido comparaciones directas de dos intervenciones. Debido a que ningún ensayo controlado aleatorizado (ECA) grande ha comparado todos estos tratamientos disponibles, todavía no se conoce cuál es la opción más efectiva y segura. El metanálisis en red podría resumir e interpretar el panorama más amplio de la evidencia existente mediante la incorporación de evidencia directa e indirecta de diferentes intervenciones. Este enfoque también puede identificar los vacíos en los estudios de investigación que se deben abordar en el futuro.
Objetivos
Evaluar la efectividad y la seguridad de diferentes enfoques de tratamiento clínico (tratamiento expectante, EO, IIU, EO/IIU y FIV/ICSI) en parejas con infertilidad inexplicada.
Métodos
Criterios de inclusión de estudios para esta revisión
Tipos de estudios
Todos los ensayos controlados aleatorizados (ECA) que compararon la efectividad o la seguridad de una de las intervenciones versus la otra intervención. Se excluyeron los estudios cuasialeatorizados y no aleatorizados. Se incluyeron los ensayos cruzados (cross‐over), pero solo se utilizaron los datos de la primera fase.
Tipos de participantes
Fueron elegibles las parejas que habían intentado concebir durante al menos un año, las mujeres que tenían al menos una trompa de Falopio permeable y un ciclo ovulatorio y los hombres que tenían un recuento total de espermatozoides móviles antes del lavado > 3 * 10ˆ6. Entre las mujeres con diagnóstico de endometriosis, solo se incluyeron las que presentaban endometriosis leve (criterio I de la American Fertility Society [AFS]).
Tipos de intervenciones
Se consideraron todos los ensayos que compararon al menos dos de las siguientes opciones de tratamiento clínico.
-
Tratamiento expectante, incluidas las relaciones sexuales programadas.
-
EO mediante gonadotropinas, inhibidores de la aromatasa, antiestrógenos, o su combinación.
-
IIU sin estimulación ovárica.
-
OS‐IUI.
-
FIV con transferencia de un solo embrión, con doble transferencia embrionaria o combinada con ICSI.
El tratamiento expectante y las relaciones sexuales programadas se combinaron en el mismo grupo si no se utilizaron técnicas invasivas. Se excluyeron los estudios que compararon diferentes protocolos de EO, y los que compararon EO con diferentes protocolos se agruparon como un solo grupo de EO. Fue posible asignar al azar en conjunto las cinco intervenciones propuestas (es decir, una pareja con infertilidad inexplicada teóricamente puede ser asignada al azar a cualquiera de las cinco intervenciones). La ICSI no se consideró una intervención separada porque está indicada para parejas con infertilidad masculina grave o con fracaso de la fertilización en ciclos anteriores de FIV. Por lo tanto, no fue posible asignar al azar la ICSI con las otras intervenciones y la inclusión de la ICSI violará el supuesto de transitividad en este metanálisis en red. Además, los ensayos que incluyeron la FIV como intervención a menudo también aplicaron la ICSI a las parejas con bajo recuento de espermatozoides inesperado el día de la recuperación de los ovocitos, o con fracaso previo de la FIV en una intervención de varios ciclos; por lo tanto, la FIV con y sin ICSI se consideró como la misma intervención. Los estudios con una política de transferencia de embriones que permitía la transferencia de más de dos embriones en una población no seleccionada se incluyeron en la revisión sistemática, pero se excluyeron del metanálisis en red para que el supuesto de transitividad fuera válido. No se incluyeron la FIV en ciclo natural y la FIV en ciclo natural modificado, ya que no son comparables a otros protocolos de FIV.
Tipos de medida de resultado
Resultados primarios
-
La medida de resultado primaria de efectividad fue un compuesto de nacidos vivos o embarazo en curso acumulativos por mujer asignada al azar. El nacido vivo se definió como el nacimiento de un niño vivo después de 24 semanas de gestación. El embarazo en curso se definió como al menos un latido cardíaco embrionario registrado en la ecografía a las 12 semanas de gestación, y se utilizó en el análisis solo cuando no se informó sobre el resultado nacidos vivos. Acumulativo se refiere a los múltiples intentos de lograr un nacido vivo (es decir, múltiples ciclos de tratamiento). En la FIV, acumulativo se refiere a la transferencia de embriones frescos seguida de ciclos de transferencia de embriones congelados, cuando fue aplicable
-
La medida de resultado primaria de seguridad fue el embarazo múltiple por mujer asignada al azar (definido como al menos dos latidos cardíacos embrionarios registrados en la ecografía)
Resultados secundarios
-
Embarazo clínico por mujer asignada al azar (definido como al menos un latido cardíaco embrionario registrado en la ecografía)
-
Síndrome de hiperestimulación ovárica moderado/grave (SHEO) por mujer asignada al azar (definido como dolor abdominal moderado, náuseas ± vómitos, presencia de ascitis en la ecografía o ascitis clínica y tamaño ovárico de al menos 8 cm) (Mathur 2005)
Métodos de búsqueda para la identificación de los estudios
We searched for all published and unpublished RCTs, without language or date restrictions, in consultation with the Cochrane Gynaecology and Fertility Group (CGF) Information Specialist.
Búsquedas electrónicas
We searched the following electronic databases for relevant trials.
-
The Cochrane Gynaecology and Fertility Group (CGF) Specialised Register of Controlled Trials, searched 6 September 2018 (Procite platform) (Appendix 1).
-
The Cochrane Central Register of Studies Online, searched 6 Sptember 2018 (CRSO Web platform) (Appendix 2).
-
MEDLINE, searched from 1946 to 6 September 2018 (Ovid platform) (Appendix 3).
-
Embase, searched from 1980 to 6 September 2018 (Ovid platform) (Appendix 4).
-
PsycINFO, searched from 1806 to 6 September 2018 (Ovid platform) (Appendix 5).
-
Cumulative Index to Nursing and Allied Health Literature (CINAHL), searched from 1961 to 6 September 2018 (Ebsco platform) (Appendix 6).
The MEDLINE search was combined with the Cochrane highly sensitive search strategy for identifying randomised trials, which appeared in the Cochrane Handbook for Systematic Reviews of Interventions (Version 5.1.0, Chapter 6, 6.4.11). Embase, PsycINFO, and CINAHL searches were combined with trial filters developed by the Scottish Intercollegiate Guidelines Network (www.sign.ac.uk/methodology/filters.html#random).
Other electronic sources of trials will include the following.
-
Trial registers for ongoing and registered trials.
-
www.clinicaltrials.gov (a service of the US National Institutes of Health).
-
www.who.int/trialsearch/Default.aspx (the World Health Organization International Trials Registry Platform search portal).
-
-
Virtual Health Library Regional Portal (VHL) (bvsalud.org/portal/?lang=en), which includes Latin American Caribbean Health Sciences Literature (LILACS).
-
PubMed and Google Scholar (for recent trials not yet indexed in the major databases).
Búsqueda de otros recursos
We handsearched the reference lists of relevant trials and systematic reviews retrieved by the search and contacted experts in the field to obtain additional data. We also handsearched relevant journals and conference abstracts that were not covered in the CGFG Register, in liaison with the Information Specialist.
Obtención y análisis de los datos
Selección de los estudios
At least two review authors (from RW, RIT, NAD) independently assessed trial eligibility, according to the Criteria for considering studies for this review. We resolved disagreements through discussion with another review author (MvW). We drew a PRISMA flow diagram to show the results of the search and the numbers of included and excluded trials. Reasons for excluding from the (network) meta‐analysis any potentially eligible studies identified by the search were documented.
Extracción y manejo de los datos
For all included trials, two review authors (RW, NAD) independently extracted data using a data abstraction form and summarised trial characteristics in tables. From each included study, two review authors (RW, NAD) extracted baseline characteristics of couples, study settings, methods, types of interventions (used dose, type of preparation, regimen, co‐interventions), and outcomes. We intended to contact the study investigators for further data on methods and results, if required.
Evaluación del riesgo de sesgo de los estudios incluidos
Two review authors (RW, NAD) independently assessed risk of bias for each eligible study by using the Cochrane 'Risk of bias' assessment tool (Higgins 2011), which included six domains: selection (random sequence generation and allocation concealment); performance (blinding of participants and personnel); detection (blinding of outcome assessors); attrition (incomplete outcome data); reporting (selective reporting); and other bias. Disagreements were resolved by discussion with a third review author (MvW). We described all judgements fully and presented our conclusions in the 'Risk of bias' table, which we incorporated into the interpretations of review findings by performing sensitivity analyses.
Medidas del efecto del tratamiento
As all outcomes involved dichotomous data, we used the numbers of events in control and intervention groups of each study to calculate Mantel‐Haenszel odds ratios (ORs). We presented 95% confidence intervals (CIs) for all outcomes. Furthermore, we calculated the probability that an intervention was ranked first, second, and so on. We displayed this ranking graphically in cumulative rankograms for the primary and secondary outcomes using the surface under the cumulative ranking (SUCRA), where SUCRA values can range from zero (i.e. the intervention is certain to be the worst) to one (i.e. the intervention is certain to be the best) (Salanti 2011).
Cuestiones relativas a la unidad de análisis
The primary unit of analysis was cumulative rates for each outcome per woman randomised. Multiple births were counted as one live birth event. Only first‐phase data from cross‐over trials were included. Trials comparing the same number of cycles/months of expectant management, OS, IUI, and OS‐IUI were included. As one cycle of IVF takes longer than the other treatments, studies comparing the same cycles of IVF and other treatments were not included in the network meta‐analysis but were included in the systematic review. Trials comparing IVF and other treatments within the same period of time were included in the network meta‐analysis.
Manejo de los datos faltantes
We analysed the data on an intention‐to‐treat basis as far as possible (i.e. including all randomised participants in the analysis, in the groups to which they were randomised). We attempted to obtain missing data from existing Cochrane Reviews or from the original trialists. If data could not be obtained, we assumed the missing values as a non‐event outcome and undertook imputation of individual values only for the primary outcome. For other outcomes, we analysed only available data. Any imputation undertaken was subjected to sensitivity analysis.
Evaluación de la heterogeneidad
Clinical and methodological heterogeneity
To identify clinical and methodological heterogeneity, we compared descriptive statistics for trial and study population characteristics across all eligible trials comparing each pair of interventions. Additionally, we considered whether there was sufficient similarity in the studied interventions and the characteristics of couples across all included studies for inclusion in the network meta‐analysis (i.e. the assumption of transitivity in network meta‐analyses). We explored the distribution of potential effect modifiers across various interventions (i.e. female age, and duration of infertility). In this study, we expected the transitivity assumption to hold true assuming the following.
-
The nature of the common intervention used for indirect comparisons was consistent (e.g. IUI in an RCT comparing IUI with expectant management was the same as IUI in an RCT comparing IUI with IVF/ICSI).
-
All pairwise comparisons did not differ with respect to the distribution of effect modifiers (e.g. design and study characteristics of an RCT comparing IUI vs expectant management were similar to those of an RCT comparing IUI vs IVF/ICSI).
Statistical heterogeneity and inconsistency
Within each pairwise comparison, we assessed statistical heterogeneity by using the I² statistic. An I² value greater than 50% was taken as an indication of substantial heterogeneity (Higgins 2011).
In the network meta‐analysis, we assessed inconsistency in the network through two approaches: the design‐by‐treatment method for global approach (Higgins 2012), and the side‐splitting method for local approach (Dias 2010). The design‐by‐treatment interaction model allowed for global statistical testing for the presence of inconsistency in the whole network (Higgins 2012). The local approach identified disagreements between direct and indirect comparisons within each comparison within closed loops in the network (Dias 2010).
Evaluación de los sesgos de notificación
In view of the difficulty of detecting and correcting for publication bias and other reporting biases, we aimed to minimise their potential impact by ensuring a comprehensive search for eligible studies and by being alert for duplication of data. If we included ten or more studies in an analysis, we used a comparison‐adjusted funnel plot to explore the possibility of small study effects (a tendency for estimates of the intervention effect to be more beneficial in smaller studies) (Chaimani 2013).
Síntesis de los datos
We compared interventions using odds ratios (ORs) with their respective 95% confidence intervals (CIs). If more than two studies compared the same treatments, a random‐effects summary OR was calculated in a pairwise meta‐analysis.
We conducted a network meta‐analysis based on all investigated comparisons between treatments, in which the indirect analysis was performed by utilising all pathways within the network. An indirect estimate of A versus B can be calculated by comparing direct comparisons of A versus C with comparisons of B versus C. In this way, the OR for comparing A and B can be calculated using the following principle: ln(ORAvsB) = ln(ORAvsC) − ln(ORBvsC). We performed a frequentist network meta‐analysis within a random‐effects multi‐variate meta‐analysis model (White 2015). We assumed a common estimate for the heterogeneity variance across the different comparisons. We used Review Manager (version 5.3, The Cochrane Collaboration) for pairwise meta‐analyses and Stata software (version 15.1, Statacorp) for network meta‐analyses (Chaimani 2015; White 2015).
Análisis de subgrupos e investigación de la heterogeneidad
If data were available from at least two studies, we conducted subgroup analyses for the primary outcomes only to determine the separate evidence within the following subgroups.
-
Women aged ≦ 38 years versus women aged > 38 years.
-
Short duration of infertility (≦ 2 years) versus long duration of infertility (> 2 years).
-
IVF/ICSI with single embryo transfer policy and IVF/ICSI with non‐single embryo transfer policy.
Análisis de sensibilidad
We conducted sensitivity analyses for live birth/ongoing pregnancy to determine whether the conclusions were robust to arbitrary decisions made regarding eligibility and analysis. These analyses included consideration of whether the review conclusions would have differed if:
-
eligibility had been restricted to studies with no domains at high risk of bias;
-
alternative imputation strategies had been implemented;
-
eligibility had varied by publication type (abstract vs full text); or
-
only studies with the outcome live birth had been included.
Overall certainty of the body of evidence: 'Summary of findings' table
We presented overall certainty of the body of evidence for the main review outcomes for each comparison in 'Summary of findings' tables. We evaluated the overall certainty of the evidence based on the Grading of Recommendations Assessment, Development and Evaluation (GRADE) approach in line with a framework developed by Salanti and colleagues in an online tool ‐ Confidence in Network Meta‐analysis (CINeMA) (CINeMA 2017; Salanti 2014). Domains included study limitations (risk of bias), inconsistency, imprecision, indirectness, and publication bias. For study limitations, we incorporated the contribution of each direct estimate into the overall network estimate when making judgements of study limitations. As blinding was not possible due to the nature of the interventions, we did not downgrade overall certainty if performance bias was the only issue in study limitations. For inconsistency, we evaluated both between‐study heterogeneity and disagreements between direct and indirect evidence (i.e. incoherence). We evaluated heterogeneity by considering the agreement of conclusions based on confidence and prediction intervals in relation to the clinically important effect size, in which the major consideration was whether heterogeneity impacts clinical decisions. If heterogeneity (presented in a prediction interval) impacted decision‐making based on a confidence interval, we downgraded the certainty of evidence. We evaluated incoherence by assessing local and global inconsistency. For comparisons with local inconsistency, we downgraded the level of certainty in relevant comparisons. Judgements about evidence certainty (high, moderate, low, or very low) were justified, documented, and incorporated into the reporting of results for each outcome.
Results
Description of studies
Results of the search
The initial electronic database search yielded 2095 articles, with nine additional articles identified through handsearches or searches of trial registers. After removing duplicates, we screened 1171 studies. Screening of titles and abstracts led to the exclusion of 1111 irrelevant studies; 60 full‐text articles were further assessed for eligibility. Another 23 studies were further excluded, including five ongoing studies (NCT01992731; NCT02461173; NCT03455426; NTR5599; NCT02001870). Finally, 27 studies fulfilled the inclusion criteria as shown in Figure 1 (Agarwal 2004; Arcaini 1996; Arici 1994; Bensdorp 2015; Bhattacharya 2008; Crosignani 1991; Custers 2011; Deaton 1990; Elzeiny 2014; Farquhar 2017; Fisch 1989; George 2006; Glazener 1990; Goldman 2014; Goverde 2000; Guzick 1999; Harrison 1983; Ho 1998; Hughes 2004; Janko 1998; Karlstrom 1993; Kirby 1991; Leanza 2014; Martinez 1990; Melis 1995; Nandi 2017; Steures 2006). See Characteristics of included studies,Characteristics of excluded studies, and Characteristics of ongoing studies tables.

Study flow diagram.
Included studies
Study design and setting
Of the 27 RCTs reporting on 4349 couples included in this systematic review, 21 had a parallel design (Agarwal 2004; Arcaini 1996; Bensdorp 2015; Bhattacharya 2008; Custers 2011; Elzeiny 2014; Farquhar 2017; Fisch 1989; George 2006; Goldman 2014; Goverde 2000; Guzick 1999; Ho 1998; Hughes 2004; Janko 1998; Karlstrom 1993; Kirby 1991; Leanza 2014; Melis 1995; Nandi 2017; Steures 2006), and the other six were cross‐over studies (Arici 1994; Crosignani 1991; Deaton 1990; Glazener 1990; Harrison 1983; Martinez 1990). These studies were conducted in a variety of countries, including Netherlands (n = 5; Bensdorp 2015; Custers 2011; Goverde 2000; Martinez 1990; Steures 2006), USA (n = 4; Arici 1994; Deaton 1990; Goldman 2014; Guzick 1999), Italy (n = 3; Arici 1994; Leanza 2014; Melis 1995), UK (n = 3, Bhattacharya 2008; Glazener 1990; Nandi 2017), Australia (n = 2; Elzeiny 2014; Kirby 1991), Canada (n = 2; Fisch 1989; Hughes 2004), India (n = 2; Agarwal 2004; George 2006), China (n = 1; Ho 1998), New Zealand (n = 1; Farquhar 2017), Ireland (n = 1; Harrison 1983), Sweden (n = 1; Karlstrom 1993), and Slovakia (n = 1; Janko 1998). One study was conducted in a multi‐country setting in Europe (Crosignani 1991).
Participants
These studies included 4349 couples with unexplained infertility. The mean female age across included studies ranged from 32 to 37 years, with most studies reporting a mean age younger than 35 years. The median or mean duration of infertility across included studies ranged from 23 to 78 months.
Interventions
One four‐arm RCT compared expectant management, OS, IUI, and OS‐IUI (Martinez 1990). We identified three three‐arm RCTs: one compared expectant management, OS, and IUI (Bhattacharya 2008); another compared OS, OS‐IUI, and IVF/ICSI (Crosignani 1991); and the third compared IUI, OS‐IUI, and IVF/ICSI (Goverde 2000). The other 23 studies were two‐arm studies. These studies compared OS versus expectant management (Fisch 1989; George 2006; Glazener 1990; Harrison 1983), IUI versus expectant management (Kirby 1991), OS‐IUI versus expectant management (Deaton 1990; Farquhar 2017; Steures 2006), IVF/ICSI versus expectant management (Hughes 2004), OS‐IUI versus OS (Agarwal 2004; Arcaini 1996; Ho 1998; Janko 1998; Karlstrom 1993; Melis 1995), OS‐IUI versus IUI (Arici 1994; Leanza 2014; Guzick 1999), and IVF/ICSI versus OS‐IUI (Bensdorp 2015; Custers 2011; Elzeiny 2014; Goldman 2014; Nandi 2017).
For RCTs comparing OS‐IUI, IUI, and OS versus expectant management or each other, all compared the same number of cycles of different interventions ‐ one cycle in five RCTs (Arici 1994; Crosignani 1991; Karlstrom 1993; Kirby 1991; Martinez 1990), three cycles in seven RCTs (Farquhar 2017; George 2006; Glazener 1990; Ho 1998; Janko 1998; Leanza 2014; Melis 1995), four cycles in three RCTs (Deaton 1990; Fisch 1989; Guzick 1999), five cycles in one RCT (Arcaini 1996), and six cycles in five RCTs (Agarwal 2004; Bhattacharya 2008; Goverde 2000; Harrison 1983; Steures 2006).
For RCTs comparing IVF/ICSI with other interventions, Hughes 2004 compared one cycle of IVF/ICSI versus three cycles of expectant management within 90 days; Bensdorp 2015 compared three cycles of IVF/ICSI versus six cycles of OS‐IUI within 12 months; Custers 2011 compared one cycle of IVF/ICSI versus three cycles of OS‐IUI within four months; and Nandi 2017 compared one cycle of IVF/ICSI versus three cycles of OS‐IUI within six months. The other RCTs compared the same number of cycles of IVF versus other interventions without time limits: Crosignani 1991 compared one cycle of IVF/ICSI with one cycle of OS and OS‐IUI; Elzeiny 2014 compared one cycle of IVF/ICSI versus one cycle of OS‐IUI; Goldman 2014 compared two cycles of IVF/ICSI versus two cycles of OS‐IUI; and Goverde 2000 compared six cycles of IVF/ICSI, six cycles of OS‐IUI, and six cycles of IUI.
Elective or compulsive single embryo transfer policy was applied in three RCTs (Bensdorp 2015; Custers 2011; Nandi 2017). ICSI was used in three RCTs, only for couples with fertilisation failure in previous IVF or unexpected low sperm count on the day of oocyte retrieval (Bensdorp 2015; Goldman 2014; Nandi 2017).
Outcomes
Thirteen RCTs reported live birth (Bensdorp 2015; Bhattacharya 2008; Custers 2011; Elzeiny 2014; Farquhar 2017; George 2006; Goldman 2014; Goverde 2000; Guzick 1999; Hughes 2004; Melis 1995; Nandi 2017; Steures 2006), and 14 RCTs reported multiple pregnancy (Bensdorp 2015; Bhattacharya 2008; Custers 2011; Deaton 1990; Elzeiny 2014; Farquhar 2017; George 2006; Glazener 1990; Goldman 2014; Goverde 2000; Ho 1998; Melis 1995; Nandi 2017; Steures 2006). Twenty‐six studies reported clinical pregnancy (Agarwal 2004; Arcaini 1996; Arici 1994; Bensdorp 2015; Bhattacharya 2008; Crosignani 1991; Custers 2011; Deaton 1990; Elzeiny 2014; Farquhar 2017; Fisch 1989; George 2006; Glazener 1990; Goldman 2014; Guzick 1999; Harrison 1983; Ho 1998; Hughes 2004; Janko 1998; Karlstrom 1993; Kirby 1991; Leanza 2014; Martinez 1990; Melis 1995; Nandi 2017; Steures 2006). Eight studies reported moderate/severe OHSS as an outcome (Bensdorp 2015; Deaton 1990; Elzeiny 2014; Goldman 2014; Goverde 2000; Ho 1998; Melis 1995; Nandi 2017).
Excluded studies
We excluded 18 studies from the review for the following reasons (Figure 1): five were non‐RCTs (Fujii 1997; Nulsen 1993; Prentice 1995; Tjon Kon Fat 2014; Zayed 1997); nine did not include interventions of interest (Buvat 1993; Chung 1995; Goldman 2010; Leanza 2014a; Melis 1987; Murdoch 1991; Reindollar 2010; Shokeir 2006; Soliman 1993); three were cross‐over studies but the data before cross‐over were not available (Gregoriou 1995; Martinez 1991; Zikopoulos 1993); and one had an irrelevant population (i.e. included women with polycystic ovary syndrome) (Zolghadri 2012).
We identified five ongoing studies from Belgium (NCT01992731), China (NCT03455426), Egypt (NCT02461173), France (NCT02001870), and Netherlands (NTR5599), respectively.
Risk of bias in included studies
Allocation
Sequence generation
As shown in Figure 2 and Figure 3, 12 studies reported adequate methods for random sequence generation and therefore were rated as low risk of bias in sequence generation (Agarwal 2004; Arici 1994; Bensdorp 2015; Bhattacharya 2008; Custers 2011; Elzeiny 2014; Farquhar 2017; Fisch 1989; George 2006; Goverde 2000; Nandi 2017; Steures 2006). The other 16 studies did not describe the method used and were rated as unclear risk for this domain.

Risk of bias graph: review authors' judgements about each risk of bias item presented as percentages across all included studies.

Risk of bias summary: review authors' judgements about each risk of bias item for each included study.
Allocation concealment
Twelve studies described adequate methods for allocation concealment (Bensdorp 2015; Bhattacharya 2008; Elzeiny 2014; Farquhar 2017; Fisch 1989; George 2006; Goldman 2014; Goverde 2000; Hughes 2004; Melis 1995; Nandi 2017; Steures 2006), and the other 16 studies did not describe methods of allocation concealment and were scored as unclear risk of bias for this domain.
Blinding
Blinding of participants and personnel (performance bias)
Five studies were rated as low risk of performance bias as placebos were used (Fisch 1989; George 2006; Glazener 1990; Harrison 1983; Leanza 2014). The remaining studies were rated as high risk of performance bias as they were not blinded, although blinding was not possible due to the nature of the interventions.
Blinding of outcome assessors (detection bias)
Given that our outcomes of interest were objective outcomes, we considered that blinding was unlikely to impact these outcomes. Therefore, all studies were rated as low risk of detection bias.
Incomplete outcome data
Three studies had 19%, 20%, and 21% incomplete outcome data, respectively, and therefore were rated as high risk of attrition bias (Agarwal 2004; Arcaini 1996; Deaton 1990). Thirteen studies had low risk of attrition bias (Bensdorp 2015; Bhattacharya 2008; Custers 2011; Farquhar 2017; Glazener 1990; Goldman 2014; Guzick 1999; Harrison 1983; Hughes 2004; Martinez 1990; Melis 1995; Nandi 2017; Steures 2006), and the other 11 studies were scored as unclear risk.
Selective reporting
Two studies did not report the outcome data for each group separately and were rated as high risk of reporting bias (Agarwal 2004; Arcaini 1996). Twelve studies reported both live birth and multiple pregnancy and were rated as low risk of reporting bias (Bensdorp 2015; Bhattacharya 2008; Custers 2011; Elzeiny 2014; Farquhar 2017; George 2006; Goldman 2014; Goverde 2000; Hughes 2004; Melis 1995; Nandi 2017; Steures 2006). The other 14 studies were scored as unclear risk.
Other potential sources of bias
There was disagreement on the number of participants in the methods and results sections in one study and this was rated as high risk of bias (Glazener 1990). Thirteen studies were scored as low risk of other bias (Agarwal 2004; Arcaini 1996; Bensdorp 2015; Bhattacharya 2008; Custers 2011; Elzeiny 2014; Farquhar 2017; Goldman 2014; Goverde 2000; Guzick 1999; Hughes 2004; Nandi 2017; Steures 2006). The other 14 studies were scored as unclear risk.
Effects of interventions
See: Summary of findings for the main comparison Summary of findings ‐ live birth or ongoing pregnancy; Summary of findings 2 Summary of findings ‐ multiple pregnancy; Summary of findings 3 Summary of findings ‐ clinical pregnancy; Summary of findings 4 Summary of findings ‐ moderate/severe OHSS
Network meta‐analysis
Based on above‐mentioned Unit of analysis issues, two RCTs ‐ Elzeiny 2014; Goldman 2014 ‐ and IVF/ICSI arms in two other RCTs ‐ Crosignani 1991; Goverde 2000 ‐ were excluded from this network meta‐analysis, as these RCTs compared IVF/ICSI and other interventions in the same number of cycles. We further excluded Hughes 2004 from this network meta‐analysis, as this RCT allowed transfer of up to four embryos. The remaining RCTs comparing IVF/ICSI all used single embryo transfer policy. Detailed data analyses for these five RCTs that were excluded from the network meta‐analysis are presented in Analysis 3.1, Analysis 3.2, and Analysis 3.3. Finally, 24 RCTs reporting on 3983 couples with unexplained infertility were included in this network meta‐analysis.
We observed high heterogeneity in the pairwise meta‐analysis of OS‐IUI and expectant management (EM) (I² = 91% for live birth). This is likely due to clinical heterogeneity among participants in the two included RCTs ‐ Steures 2006 included couples with intermediate prognosis of natural conception, and Farquhar 2017 included couples with poor prognosis of natural conception. Both RCTs applied an existing prediction model to estimate the prognosis of natural conception (Hunault 2004). We included these RCTs in this network meta‐analysis to estimate the average treatment effect in this comparison, and we downgraded the certainty of evidence due to heterogeneity based on criteria described in the methods. To further assess robustness of the evidence, we performed two additional post‐hoc sensitivity analyses: excluding expectant management from the network; and limiting to RCTs including couples with poor prognosis of natural conception.
We assessed the transitivity assumption in this network meta‐analysis by evaluating two potential effect modifiers: age and duration of infertility. The distribution of mean age in different studies across different comparisons is presented in Figure 4. The median value of mean age across different comparisons is around 32 years. Duration of infertility is very unlikely to be normally distributed; therefore reporting the mean seems inappropriate and can lead to overestimation of the median value. However, 10 RCTs reported mean duration of infertility (Agarwal 2004; Arcaini 1996; Arici 1994; Deaton 1990; Fisch 1989; Goverde 2000; Guzick 1999; Harrison 1983; Martinez 1990; Melis 1995), and seven other RCTs did not report median or mean duration of infertility (Crosignani 1991; George 2006; Ho 1998; Janko 1998; Karlstrom 1993; Kirby 1991; Leanza 2014). Therefore, it is impossible for us to assess the distribution of duration of infertility across different comparisons. However, as these five interventions are jointly randomisable for any participant with unexplained infertility, we considered the transitivity assumption valid.

Box plot for the distribution of means of age in different studies across different comparisons.
Live birth
Ten studies reported live birth (Bensdorp 2015; Bhattacharya 2008; Custers 2011; Farquhar 2017; George 2006; Goverde 2000; Guzick 1999; Melis 1995; Nandi 2017; Steures 2006). These RCTs included 2725 couples with unexplained infertility. A network plot for live birth is presented in Figure 5. Three RCTs compared IVF/ICSI versus OS‐IUI (Bensdorp 2015; Custers 2011; Nandi 2017); two RCTs compared OS‐IUI versus IUI (Goverde 2000; Guzick 1999); two RCTs compared OS versus expectant management (Bhattacharya 2008; George 2006); two RCTs compared OS‐IUI versus expectant management (Farquhar 2017; Steures 2006); one RCT compared IUI versus expectant management (Bhattacharya 2008); and one RCT compared OS‐IUI versus OS (Melis 1995).

Network plot for live birth.
Each node represents an intervention, and the size of each node is proportional to the number of trials reporting such intervention. The widths of the lines are proportional to the numbers of trials comparing each pair of interventions.
The results of the network meta‐analysis are shown in Figure 6. They showed insufficient evidence of a difference between OS, IUI, OS‐IUI, or IVF/ICSI and expectant management (odds ratio (OR) 1.01, 95% confidence interval (CI) 0.51 to 1.98; low‐certainty evidence; OR 1.21, 95% CI 0.61 to 2.43; low‐certainty evidence; OR 1.61, 95% CI 0.88 to 2.94; low‐certainty evidence; OR 1.88, 95% CI 0.81 to 4.38; low‐certainty evidence). These data suggest that if the chance of live birth following expectant management is assumed to be 16.6%, the chance following OS, IUI, OS‐IUI, and IVF would be 9.2% to 28.2%, 10.8% to 32.5%, 14.9% to 36.9%, and 13.9% to 46.5%, respectively.

Network meta‐analysis for live birth.
Each diamond represents the estimate summary odds ratio of each comparison; each horizontal line represents the confidence interval of each comparison; blue vertical line represents line of no effect (odds ratio = 1). Odds ratio greater than 1 favours the first intervention; odds ratio less than 1 favours the second intervention.
Evidence of a difference between IUI and OS (OR 1.20, 95% CI 0.57 to 2.52; low‐certainty evidence), OS‐IUI and OS (OR 1.60, 95% CI 0.81 to 3.16; low‐certainty evidence), IVF/ICSI and OS (OR 1.86, 95% CI 0.75 to 4.61; low‐certainty evidence), OS‐IUI and IUI (OR 1.33, 95% CI 0.74 to 2.40; low‐certainty evidence), IVF/ICSI and IUI (OR 1.55, 95% CI 0.67 to 3.58; low‐certainty evidence), or IVF/ICSI and OS‐IUI (OR 1.17, 95% CI 0.64 to 2.12; low‐certainty evidence) was insufficient. Overall certainty of evidence in all comparisons was low due to concerns regarding imprecision and heterogeneity.
Results show no evidence of global inconsistency (P = 0.55) or local inconsistency in the network meta‐analysis on live birth. The comparison‐adjusted funnel plot seems symmetrical, implying the absence of small study effects in this network (Figure 7). Cumulative rankograms illustrate the probability per rank for each treatment in terms of live birth (Figure 8). The SUCRA values for expectant management, OS, IUI, OS‐IUI, and IVF/ICSI were 23.1%, 24.1%, 43.7%, 74.2%, and 85.0%, respectively. This suggests that among all interventions, IVF/ICSI is more likely to result in more live births than the other interventions, followed by OS‐IUI, IUI, OS, and expectant management.

Comparison‐adjusted funnel plot for live birth.
(A: expectant management; B: OS; C: IUI; D: OS‐IUI; E: IVF/ICSI.)

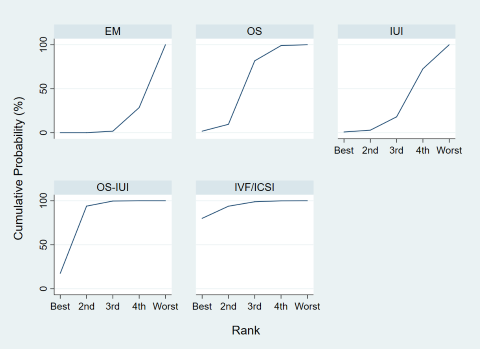
Cumulative rankograms of interventions for live birth.
Each cumulative rankogram illustrates the cumulative probability of each ranking (from the best to the worst rank) for each intervention in terms of live birth.
Results of pairwise meta‐analyses are presented in Analysis 1.1. Overall, results were consistent with those in network meta‐analysis. As most comparisons included a very limited number of studies, wide confidence intervals were observed in all comparisons, implying imprecision of the evidence.
Subgroup analyses
Women ≤ 38 years versus women > 38 years
One RCT did not report details of age in the inclusion criteria or results (George 2006), and the other RCTs all reported a mean age < 35 years. As the breakdown data for women in different age groups were not available, this subgroup analysis was not performed.
Short duration of infertility (≤ 2 years) versus long duration of infertility (> 2 years)
As the breakdown data for women in different age groups were not available, we used median duration of infertility in different RCTs for this subgroup analysis. Therefore this subgroup analysis should be interpreted with caution, given that it was not based on the breakdown data for different groups.
One study did not report details of the duration of infertility in the inclusion criteria or the results (George 2006); therefore we excluded this study from the subgroup analysis. Two studies included couples with a median or mean duration of infertility ≤ 2 years (Nandi 2017; Steures 2006). One compared IVF/ICSI versus OS‐IUI (Nandi 2017), and the other compared IVF/ICSI versus expectant management (Steures 2006). Network meta‐analysis is presented in Figure 9. Evidence of a difference in live birth between OS‐IUI or IVF/ICSI and expectant management was insufficient (OR 0.82, 95% CI 0.45 to 1.49; OR 1.05, 95% CI 0.46 to 2.43). Seven studies reported median duration of infertility > 2 years (Bensdorp 2015; Bhattacharya 2008; Custers 2011; Farquhar 2017; Goverde 2000; Guzick 1999; Melis 1995). Network meta‐analysis of these studies is presented in Figure 10. Effect sizes of IVF/ICSI and OS‐IUI versus expectant management were larger than those in the main analysis.

Subgroup analysis for live birth ‐ RCTs with a median duration of infertility ≤ 2 years.

Subgroup analysis for live birth ‐ RCTs with a median duration of infertility > 2 years.
IVF/ICSI with single embryo transfer policy and IVF/ICSI with non‐single embryo transfer policy
As all RCTs including an IVF/ICSI arm applied single embryo transfer policy, this subgroup analysis was not performed.
Sensitivity analyses
Restricting to RCTs with no domains at high risk of bias
Most RCTs were rated at high risk of performance bias; therefore this analysis was not possible.
Excluding participants with missing outcome data
After participants with missing outcome data were excluded, the results of network meta‐analysis were consistent with the main analysis in all comparisons (Figure 11).

Sensitivity analysis for live birth by exclusion of participants with missing outcome data.
Each diamond represents the estimate summary odds ratio for each comparison; each horizontal line represents the confidence interval for each comparison; blue vertical line represents line of no effect (odds ratio = 1). Odds ratio greater than 1 favours the first intervention; odds ratio less than 1 favours the second intervention.
Excluding abstract‐only publications
One abstract was excluded from this sensitivity analysis (George 2006). Results of this sensitivity analysis were consistent with those of the main analysis for all comparisons (Figure 12).

Sensitivity analysis for live birth by exclusion of abstract‐only publications.
Each diamond represents the estimate summary odds ratio for each comparison; each horizontal lines represents the confidence interval for each comparison; blue vertical line represents line of no effect (odds ratio = 1). Odds ratio greater than 1 favours the first intervention; odds ratio less than 1 favours the second intervention.
Including only RCTs with the outcome live birth
All 10 studies reported live birth; therefore this analysis was not performed.
Excluding expectant management from the network
Results of network meta‐analysis of the remaining four interventions were consistent with results of the main analysis (Figure 13).

Sensitivity analysis for live birth excluding RCTs involving expectant management from the network.
Each diamond represents the estimate summary odds ratio for each comparison; each horizontal lines represents the confidence interval for each comparison; blue vertical line represents line of no effect (odds ratio = 1). Odds ratio greater than 1 favours the first intervention; odds ratio less than 1 favours the second intervention.
Restricting to RCTs including couples with poor prognosis of natural conception
Three RCTs ‐ Bensdorp 2015; Custers 2011; Farquhar 2017 ‐ included couples with poor prognosis of natural conception based on an existing prediction model (Hunault 2004). Network meta‐analysis (Figure 14) showed that compared to expectant management, OS‐IUI (OR 4.48, 95% CI 2.00 to 10.1; moderate‐certainty evidence) or IVF/ICSI (OR 4.99, 95 CI 2.07 to 12.04; moderate‐certainty evidence) increased the odds of live birth, and there was insufficient evidence of a difference between IVF/ICSI and OS‐IUI (OR 1.11, 95% CI 0.78 to 1.60; low‐certainty evidence). This sensitivity analysis showed the clinically important differences of OS‐IUI and IVF/ICSI versus expectant management.

Sensitivity analysis for live birth by limiting to RCTs including couples with poor prognosis of natural conception.
Each diamond represents the estimate summary odds ratio for each comparison; each horizontal lines represents the confidence interval for each comparison; blue vertical line represents line of no effect (odds ratio = 1). Odds ratio greater than 1 favours the first intervention; odds ratio less than 1 favours the second intervention.
Multiple pregnancy
One study reported 0 events in both groups and was excluded from the analysis (Deaton 1990). Eleven RCTs reporting on 2564 couples were included in the network meta‐analysis of multiple pregnancy (Bensdorp 2015; Bhattacharya 2008; Custers 2011; Farquhar 2017; George 2006; Glazener 1990; Goverde 2000; Ho 1998; Melis 1995; Nandi 2017; Steures 2006). The network plot for multiple pregnancy is presented in Figure 15.

Network plot for multiple pregnancy.
Each node represents an intervention, and the size of each node is proportional to the number of trials reporting such interventions. The widths of lines are proportional to the numbers of trials comparing each pair of interventions.
Results of network meta‐analysis are shown in Figure 16. Compared to expectant management/IUI, OS (OR 3.07, 95% CI 1.00 to 9.41; low‐certainty evidence) or OS‐IUI (OR 3.34, 95% CI 1.09 to 10.29; moderate‐certainty evidence) increased the odds of multiple pregnancy, and there was insufficient evidence of a difference between IVF/ICSI and expectant management/IUI (OR 2.66, 95% CI 0.68 to 10.43; low‐certainty evidence). These findings suggest that if the chance of multiple pregnancy following expectant management or IUI is assumed to be 0.6%, the chance following OS, OS‐IUI, and IVF/ICSI would be 0.6% to 5.0%, 0.6% to 5.4%, and 0.4% to 5.5%, respectively.

Network meta‐analysis for multiple pregnancy.
Each diamond represents the estimate summary odds ratio for each comparison; each horizontal line represents the confidence interval for each comparison; blue vertical line represents line of no effect (odds ratio = 1). Odds ratio greater than 1 favours the second intervention; odds ratio less than 1 favours the first intervention.
These was insufficient evidence of a difference between OS‐IUI and OS (OR 1.09, 95% CI 0.38 to 3.15; very‐low‐certainty evidence), IVF/ICSI and OS (OR 0.87, 95% CI 0.23 to 3.24; low‐certainty evidence), or IVF/ICSI and OS‐IUI (OR 0.80, 95% CI 0.37 to 1.73; low‐certainty evidence).
There was no evidence of global inconsistency (P = 0.34) or local inconsistency in the network meta‐analysis on multiple pregnancy. Cumulative rankograms illustrate the probability per rank for each treatment in terms of multiple pregnancy (Figure 17). The comparison‐adjusted funnel plot seems symmetrical, implying the absence of small study effects in this network (Figure 18). The SUCRA values for expectant management/IUI, OS, OS‐IUI, and IVF/ICSI were 95.3%, 33.8%, 24.5%, and 46.4%, respectively. This suggests that expectant management/IUI was more likely to result in fewer multiple pregnancies than other interventions, followed by IVF/ICSI, OS, and OS‐IUI.

Cumulative rankograms of interventions for multiple pregnancy.
Each cumulative rankogram illustrates the cumulative probability of each ranking (from the best to the worst rank) for each intervention in terms of multiple pregnancy .

Comparison‐adjusted funnel plot for multiple pregnancy.
(A: expectant management or IUI; B: OS; C: OS‐IUI; D: IVF/ICSI.)
Results of pairwise meta‐analyses (Analysis 1.2) are consistent with those in the network meta‐analysis.
Clinical pregnancy
Twenty‐three RCTs reporting on 3792 couples were included in the network meta‐analysis of clinical pregnancy (Agarwal 2004; Arcaini 1996; Arici 1994; Bensdorp 2015; Bhattacharya 2008; Crosignani 1991; Custers 2011; Deaton 1990; Farquhar 2017; Fisch 1989; George 2006; Glazener 1990; Guzick 1999; Harrison 1983; Ho 1998; Janko 1998; Karlstrom 1993; Kirby 1991; Leanza 2014; Martinez 1990; Melis 1995; Nandi 2017; Steures 2006). The network plot for clinical pregnancy is presented in Figure 19. Results of the network meta‐analysis are shown in Figure 20.

Network plot for clinical pregnancy.
Each node represents an intervention, and the size of each node is proportional to the number of trials reporting such intervention. The widths of the lines are proportional to the numbers of trials comparing each pair of interventions.
Network meta‐analysis for clinical pregnancy.
Each diamond represents the estimate summary odds ratio for each comparison; each horizontal line represents the confidence interval for each comparison; blue vertical line represents line of no effect (odds ratio = 1). Odds ratio greater than 1 favours the first intervention; odds ratio less than 1 favours the second intervention.
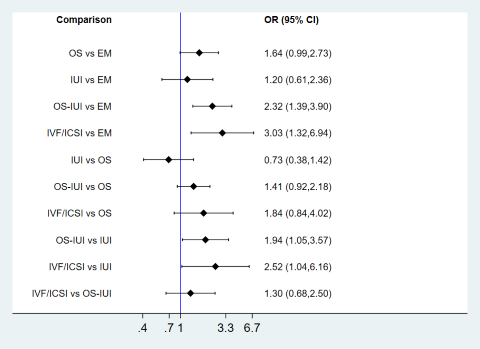
Compared to expectant management, OS‐IUI or IVF/ICSI increased the odds of live birth (OR 2.32, 95% CI 1.39 to 3.90; low‐certainty evidence; OR 3.03, 95% CI 1.32 to 6.94; low‐certainty evidence). There was insufficient evidence of a difference between OS and expectant management (OR 1.64, 95% CI 0.99 to 2.73; very‐low‐certainty evidence) or between IUI and expectant management (OR 1.20, 95% CI 0.61 to 2.36; low‐certainty evidence). These findings suggest that if the chance of clinical pregnancy following expectant management is assumed to be 16.4%, the chance following OS, IUI, OS‐IUI, and IVF/ICSI would be 15.5% to 33.7%, 10.2% to 30.5%, 20.5% to 42.0%, and 19.7% to 56.3%, respectively.
Compared to OS, IVF/ICSI increased the odds of clinical pregnancy (OR 1.84, 95% CI 1.40 to 4.02; low‐certainty evidence). There was insufficient evidence of a difference between IUI or OS‐IUI and expectant management (OR 0.73, 95% CI 0.38 to 1.42; very low‐certainty evidence; OR 1.41, 95% CI 0.92 to 2.18; very low‐certainty evidence). Compared to IUI, OS‐IUI or IVF/ICSI increased the odds of clinical pregnancy (OR 1.94, 95% CI 1.05 to 3.57; very low‐certainty evidence; OR 2.52, 95% CI 1.04 to 6.16; low‐certainty evidence). Evidence of a difference between IVF/ICSI and OS‐IUI for clinical pregnancy was insufficient (OR 1.30, 95% CI 0.68 to 2.50; low‐certainty evidence).
There was no evidence of global inconsistency (P = 0.23), but local inconsistency was detected in the comparison between IUI and OS (P = 0.039). Therefore, the certainty of evidence in this comparison was downgraded due to incoherence. Cumulative rankograms illustrate the cumulative probability per rank for each treatment in terms of clinical pregnancy (Figure 21). The comparison‐adjusted funnel plot seems symmetrical, implying the absence of small study effects in this network (Figure 22). The SUCRA values for expectant management, OS, IUI, OS‐IUI, and IVF/ICSI were 7.8%, 48.4%, 23.3%, 78.8%, and 91.7%, respectively. This suggests that IVF/ICSI was is more likely to result in more clinical pregnancies than the other interventions, followed by OS‐IUI, OS, IUI, and expectant management.
Cumulative rankograms of interventions for clinical pregnancy.
Each cumulative rankogram illustrates the cumulative probability of each ranking (from the best to the worst rank) for each intervention in terms of clinical pregnancy.

Comparison‐adjusted funnel plot for clinical pregnancy.(A: expectant management; B: OS; C: IUI; D: OS‐IUI; E: IVF/ICSI.)
Results of pairwise meta‐analyses were consistent with those in the network meta‐analysis (Analysis 1.3) .
OHSS
Eight studies reported moderate/severe OHSS. Four studies reported zero events in both groups (Deaton 1990; Elzeiny 2014; Ho 1998; Melis 1995). We did not perform network meta‐analysis given the extremely low event rates for some interventions.
Five studies compared IVF/ICSI versus OS‐IUI (Bensdorp 2015; Elzeiny 2014; Goldman 2014; Goverde 2000; Nandi 2017). Pooled analysis showed insufficient evidence of a difference between IVF/ICSI and OS‐IUI (OR 2.50, 95% CI 0.92 to 6.76; 5 studies; 985 women; moderate‐certainty evidence; Figure 23). This suggests that if the chance of moderate/severe OHSS following OS‐IUI is assumed to be 1.1%, the chance following IVF/ICSI would be between 1.0% and 7.2%.

Forest plot of comparison: 2 Pairwise meta‐analysis for OHSS, outcome: 2.5 IVF/ICSI vs OS‐IUI.
Discusión
Resumen de los resultados principales
Esta revisión sistemática y metanálisis en red comparó la efectividad y la seguridad de la fertilización in vitro (FIV)/inyección intracitoplasmática de espermatozoides (ICSI), la estimulación ovárica (EO)/inseminación intrauterina (IIU), la IIU, la EO y el tratamiento expectante entre sí en parejas con infertilidad inexplicada. No hubo evidencia suficiente de diferencias en cuanto a los nacidos vivos entre el tratamiento expectante y las otras cuatro intervenciones. En comparación con el tratamiento expectante o la IIU, la EO puede aumentar las probabilidades de embarazo múltiple, y la EO/IIU podría aumentar las probabilidades de embarazo múltiple. La evidencia de diferencias entre la FIV/ICSI y el tratamiento expectante para el embarazo múltiple fue insuficiente. Tampoco hubo evidencia suficiente de una diferencia en el síndrome de hiperestimulación ovárica moderado o grave (SHEO) entre la FIV/ICSI y la EO/IIU. La certeza general de la evidencia fue baja a moderada debido principalmente a la imprecisión o la heterogeneidad.
Compleción y aplicabilidad general de las pruebas
La población de interés consistió en parejas con infertilidad inexplicada. Se utilizó una definición relativamente amplia de infertilidad inexplicada, que incluyó parejas con endometriosis leve e infertilidad masculina leve (recuento total de espermatozoides móviles antes del lavado > 3 * 106) para aumentar la aplicabilidad de los resultados. Como las distribuciones de los posibles modificadores del efecto mostraron similitudes entre las diferentes comparaciones y es posible asignar al azar en conjunto las intervenciones de interés, la suposición general de transitividad en esta red fue válida. Para la FIV/ICSI, todos los ECA que incluyen este brazo aplicaron la política de transferencia de embriones únicos, lo que garantiza la homogeneidad clínica de la FIV/ICSI.
Las guías actuales NICE 2013 no recomiendan la IIU, ya sea con o sin estimulación ovárica, para parejas con infertilidad inexplicada. Sobre la base de esta revisión sistemática, se argumentaría que la EO/IIU aún tiene una función importante en el tratamiento de la infertilidad inexplicada, en especial para las parejas con un pronóstico deficiente para la concepción natural. La toma de decisiones compartida debe tener en cuenta no solo la efectividad y la seguridad, sino también las preferencias y los costes para los pacientes. Dos evaluaciones económicas encontraron que la EO/IIU dio lugar a un menor costo por nacido vivo que la FIV/ICSI en parejas con un pronóstico deficiente para la concepción natural y una mediana de duración de la infertilidad de menos de dos años, lo que implica que la EO/IIU es una alternativa importante a la FIV/ICSI en estas parejas con una definición limitada y con infertilidad inexplicada (Tjon‐Kon‐Fat 2015; van Rumste 2014).
Calidad de la evidencia
La certeza general de la evidencia fue muy baja a moderada (Resumen de los hallazgos, tabla 1; Resumen de los hallazgos, tabla 2; Resumen de los hallazgos, tabla 3; Resumen de los hallazgos, tabla 4). Lo anterior se debió principalmente a la falta de precisión o a la presencia de heterogeneidad. En todas las comparaciones se incluyeron relativamente pocos estudios con evidencia directa, lo que explicó la imprecisión de estas comparaciones. La heterogeneidad observada se debió muy probablemente a la naturaleza heterogénea de la infertilidad inexplicada, y a que algunos ECA incluidos se centraron en diferentes subpoblaciones con esta afección. Por ejemplo, Steures 2006 solo incluyó parejas con un pronóstico intermedio para la concepción natural según el modelo de predicción de Hunault (Hunault 2004), y Farquhar 2017 solo incluyó parejas con un pronóstico deficiente. El resultado del metanálisis en red en la comparación EO/IIU versus tratamiento expectante fue consistente con las cohortes existentes de infertilidad no seleccionada e inexplicada (van Eekelen 2019), pero el resultado agrupado no fue aplicable a las dos subpoblaciones con pronóstico deficiente o intermedio, respectivamente.
Las fortalezas de esta revisión sistemática incluyen la estrategia de búsqueda exhaustiva, el uso de evidencia indirecta, la realización de análisis de sensibilidad y la aplicación de Confidence in Network Meta‐analysis (CINeMA) para evaluar la certeza general de la evidencia en el metanálisis en red. La revisión sistemática actual y el metanálisis en red proporcionaron una visión general de la base de evidencia en el tratamiento clínico de la infertilidad inexplicada. Sin embargo, existen varias limitaciones. Las parejas con infertilidad inexplicada son una población heterogénea y se utilizaron varios criterios de inclusión. Por ejemplo, las participantes en los estudios incluidos pueden o no haber sido sometidas a una laparoscopia diagnóstica antes del diagnóstico de infertilidad inexplicada. Además, algunos estudios incluidos se centraron en un subgrupo de parejas sobre la base de factores pronósticos (p.ej. el modelo de predicción de Hunault, como se argumentó anteriormente). Los resultados agrupados produjeron heterogeneidad e imprecisión en la evidencia para estas comparaciones. Además, en aproximadamente la mitad de los ensayos incluidos no se informaron los resultados primarios de efectividad y seguridad nacidos vivos y embarazo múltiple. Este hecho explica en parte la imprecisión evidente en algunas comparaciones. Además, como no se disponía de los datos desglosados para los diferentes subgrupos, el análisis de subgrupos sobre la duración de la infertilidad se basó en diferentes valores de la media/la mediana; por lo tanto, estos resultados se deben interpretar con precaución. Un análisis de subgrupos planificado sobre las parejas sin tratamiento versus las parejas que habían recibido tratamiento previo no fue factible en el metanálisis en red, ya que también se permitió que las parejas con varios tratamientos previos se asignaran al azar a intervenciones menos invasivas, incluido el tratamiento expectante en los ECA pragmáticos. Por último, aproximadamente la mitad de los estudios incluidos se publicaron antes del año 2000. Aunque la FIV en los diferentes estudios de este metanálisis en red parece haber sido similar, los protocolos intensivos de EO y los criterios de cancelación relativamente flexibles utilizados en los ensayos antiguos de EO y EO/IIU no son los mismos que en los recientes, y este último factor dio lugar a que hubiera menos embarazos múltiples.
Sesgos potenciales en el proceso de revisión
Debido a la estrategia de búsqueda extensa, incluida la búsqueda en bases de datos electrónicas y la búsqueda manual de referencias pertinentes, la probabilidad de que no se hubieran identificado todos los estudios fue baja. No se identificaron efectos de estudios pequeños en las medidas de resultado principales. Por lo tanto, se concluyó que no hubo sesgo de publicación evidente. Además, como los nacidos vivos y los embarazos múltiples no se informaron en aproximadamente la mitad de los estudios incluidos, no fue posible descartar la posibilidad de sesgo de informe.
Como la evidencia indirecta no implica una nueva asignación al azar y, por lo tanto, la validez del metanálisis en red se basa en la suposición de transitividad, la suposición de la transitividad se evaluó de manera cuidadosa antes de realizar este metanálisis en red y no se encontró evidencia de intransitividad. Sin embargo, no fue posible descartar por completo la existencia de intransitividad debido al pequeño número de ECA incluidos en todas las comparaciones, así como a la falta de información inicial de los ECA antiguos. La inconsistencia se evaluó de manera adicional mediante enfoques globales y locales. Las pruebas estadísticas no mostraron evidencia de inconsistencia en las redes de las medidas de resultado principales, pero las pruebas para la inconsistencia podrían tener poco poder estadístico (Higgins 2012). Las limitaciones generales en cada comparación sobre los diferentes resultados se reflejan en las tablas de Resumen de los hallazgos.
Acuerdos y desacuerdos con otros estudios o revisiones
Una revisión Cochrane sobre la IIU para la infertilidad inexplicada no encontró evidencia concluyente de diferencias en los nacidos vivos o los embarazos múltiples para la comparación entre IIU o EO/IIU versus tratamiento expectante (Veltman‐Verhulst 2016). Este metanálisis en red mostró resultados consistentes en cuanto a los nacidos vivos, con superposición de los intervalos de confianza. La evidencia sobre el embarazo múltiple entre EO/IIU versus tratamiento expectante o IIU en este metanálisis en red fue de una certeza moderada, ya que el uso del metanálisis en red aumentó la precisión de la evidencia.
Otra revisión Cochrane sobre FIV/ICSI para la infertilidad inexplicada encontró que la FIV/ICSI se puede asociar con tasas de nacidos vivos más altas que el tratamiento expectante, pero la certeza general de la evidencia fue muy baja (Pandian 2015). Esta conclusión se basó en un ECA con un tamaño de muestra pequeño y una política de transferencia intensiva de embriones (hasta cuatro embriones en una población no seleccionada) (Hughes 2004). Este ECA no se incluyó en el metanálisis en red debido a las diferentes políticas de transferencia de embriones utilizadas en la práctica clínica actual. No hubo evidencia directa disponible para la comparación entre FIV/ICSI y tratamiento expectante. La evidencia indirecta derivada del metanálisis en red fue insuficiente para valorar la presencia de diferencias en cuanto a la efectividad y la seguridad.
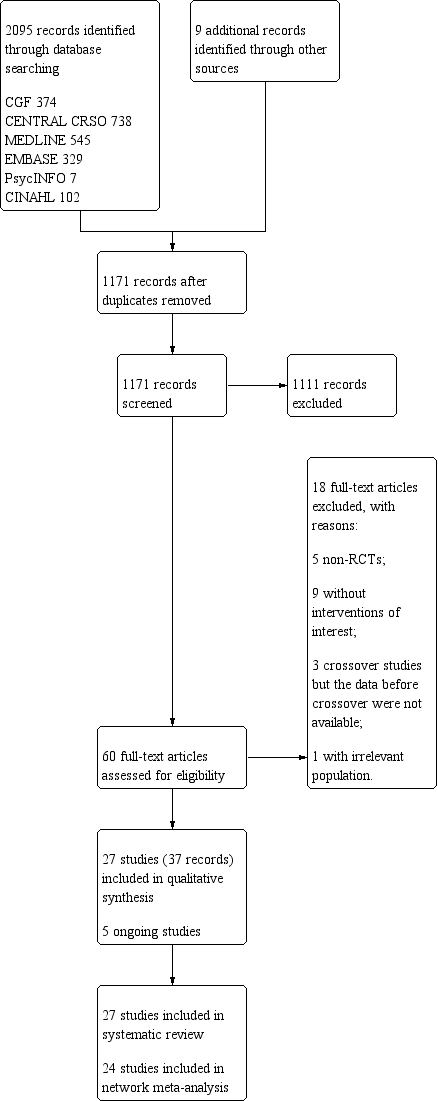
Study flow diagram.

Risk of bias graph: review authors' judgements about each risk of bias item presented as percentages across all included studies.

Risk of bias summary: review authors' judgements about each risk of bias item for each included study.

Box plot for the distribution of means of age in different studies across different comparisons.
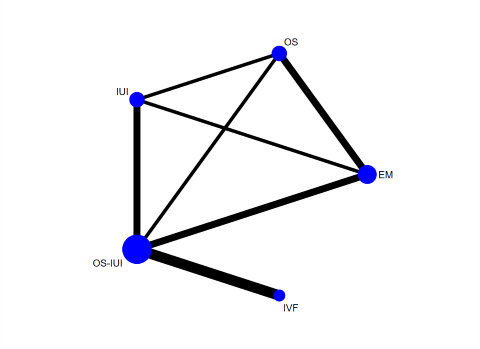
Network plot for live birth.
Each node represents an intervention, and the size of each node is proportional to the number of trials reporting such intervention. The widths of the lines are proportional to the numbers of trials comparing each pair of interventions.

Network meta‐analysis for live birth.
Each diamond represents the estimate summary odds ratio of each comparison; each horizontal line represents the confidence interval of each comparison; blue vertical line represents line of no effect (odds ratio = 1). Odds ratio greater than 1 favours the first intervention; odds ratio less than 1 favours the second intervention.
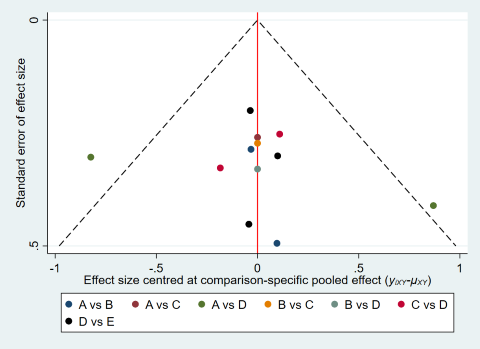
Comparison‐adjusted funnel plot for live birth.
(A: expectant management; B: OS; C: IUI; D: OS‐IUI; E: IVF/ICSI.)

Cumulative rankograms of interventions for live birth.
Each cumulative rankogram illustrates the cumulative probability of each ranking (from the best to the worst rank) for each intervention in terms of live birth.
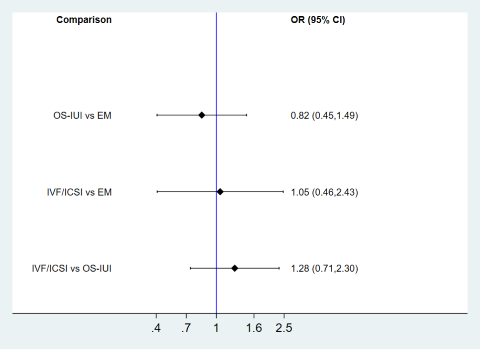
Subgroup analysis for live birth ‐ RCTs with a median duration of infertility ≤ 2 years.
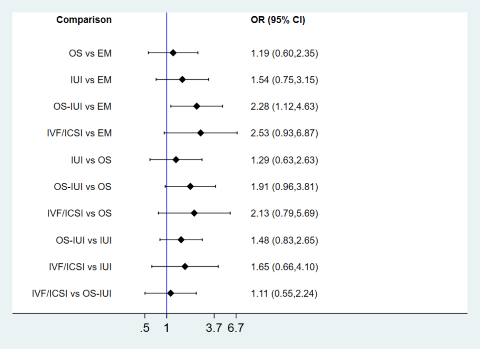
Subgroup analysis for live birth ‐ RCTs with a median duration of infertility > 2 years.

Sensitivity analysis for live birth by exclusion of participants with missing outcome data.
Each diamond represents the estimate summary odds ratio for each comparison; each horizontal line represents the confidence interval for each comparison; blue vertical line represents line of no effect (odds ratio = 1). Odds ratio greater than 1 favours the first intervention; odds ratio less than 1 favours the second intervention.
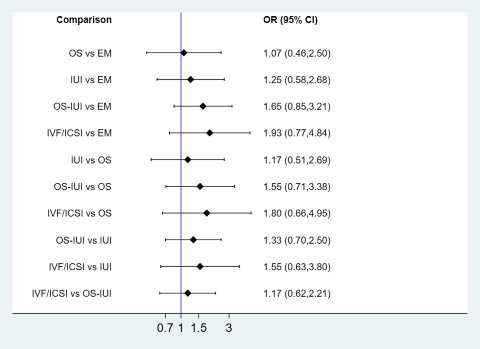
Sensitivity analysis for live birth by exclusion of abstract‐only publications.
Each diamond represents the estimate summary odds ratio for each comparison; each horizontal lines represents the confidence interval for each comparison; blue vertical line represents line of no effect (odds ratio = 1). Odds ratio greater than 1 favours the first intervention; odds ratio less than 1 favours the second intervention.
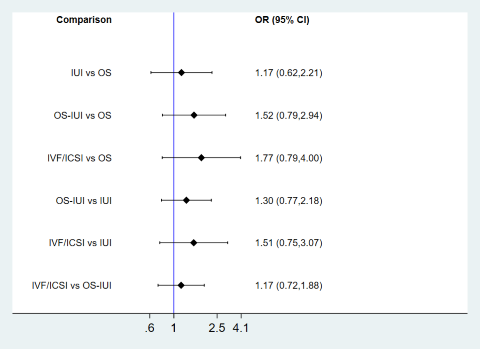
Sensitivity analysis for live birth excluding RCTs involving expectant management from the network.
Each diamond represents the estimate summary odds ratio for each comparison; each horizontal lines represents the confidence interval for each comparison; blue vertical line represents line of no effect (odds ratio = 1). Odds ratio greater than 1 favours the first intervention; odds ratio less than 1 favours the second intervention.

Sensitivity analysis for live birth by limiting to RCTs including couples with poor prognosis of natural conception.
Each diamond represents the estimate summary odds ratio for each comparison; each horizontal lines represents the confidence interval for each comparison; blue vertical line represents line of no effect (odds ratio = 1). Odds ratio greater than 1 favours the first intervention; odds ratio less than 1 favours the second intervention.
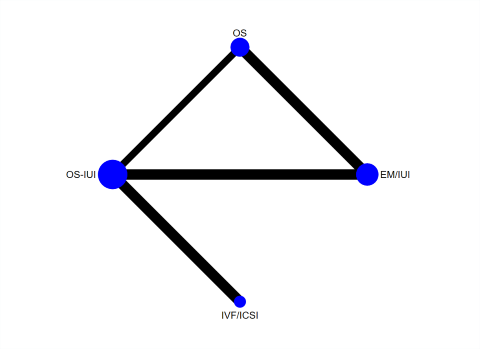
Network plot for multiple pregnancy.
Each node represents an intervention, and the size of each node is proportional to the number of trials reporting such interventions. The widths of lines are proportional to the numbers of trials comparing each pair of interventions.

Network meta‐analysis for multiple pregnancy.
Each diamond represents the estimate summary odds ratio for each comparison; each horizontal line represents the confidence interval for each comparison; blue vertical line represents line of no effect (odds ratio = 1). Odds ratio greater than 1 favours the second intervention; odds ratio less than 1 favours the first intervention.

Cumulative rankograms of interventions for multiple pregnancy.
Each cumulative rankogram illustrates the cumulative probability of each ranking (from the best to the worst rank) for each intervention in terms of multiple pregnancy .
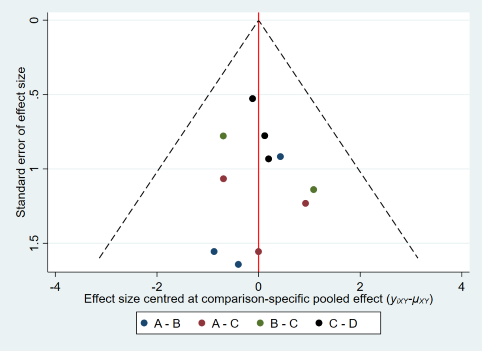
Comparison‐adjusted funnel plot for multiple pregnancy.
(A: expectant management or IUI; B: OS; C: OS‐IUI; D: IVF/ICSI.)
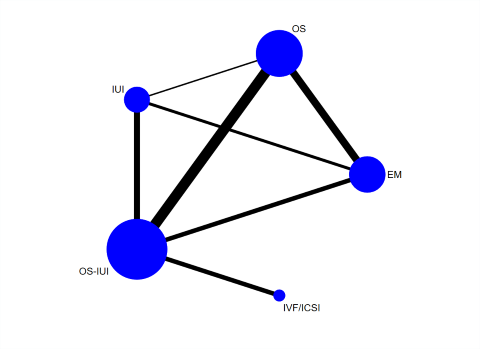
Network plot for clinical pregnancy.
Each node represents an intervention, and the size of each node is proportional to the number of trials reporting such intervention. The widths of the lines are proportional to the numbers of trials comparing each pair of interventions.

Network meta‐analysis for clinical pregnancy.
Each diamond represents the estimate summary odds ratio for each comparison; each horizontal line represents the confidence interval for each comparison; blue vertical line represents line of no effect (odds ratio = 1). Odds ratio greater than 1 favours the first intervention; odds ratio less than 1 favours the second intervention.

Cumulative rankograms of interventions for clinical pregnancy.
Each cumulative rankogram illustrates the cumulative probability of each ranking (from the best to the worst rank) for each intervention in terms of clinical pregnancy.

Comparison‐adjusted funnel plot for clinical pregnancy.(A: expectant management; B: OS; C: IUI; D: OS‐IUI; E: IVF/ICSI.)
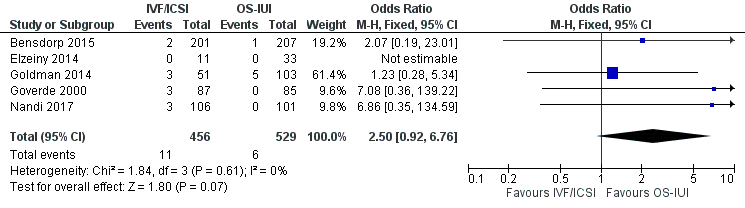
Forest plot of comparison: 2 Pairwise meta‐analysis for OHSS, outcome: 2.5 IVF/ICSI vs OS‐IUI.

Comparison 1 Pairwise meta‐analyses for live birth, multiple pregnancy, and clinical pregnancy, Outcome 1 Live birth.

Comparison 1 Pairwise meta‐analyses for live birth, multiple pregnancy, and clinical pregnancy, Outcome 2 Multiple pregnancy.
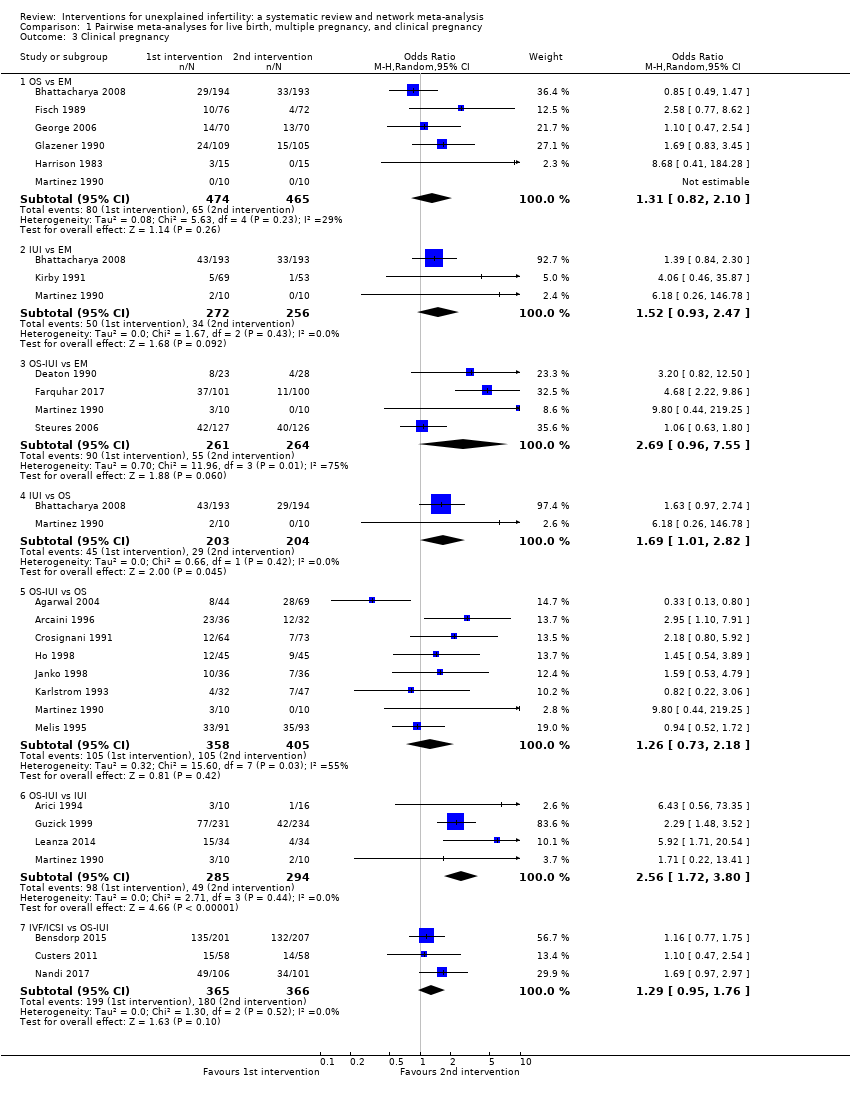
Comparison 1 Pairwise meta‐analyses for live birth, multiple pregnancy, and clinical pregnancy, Outcome 3 Clinical pregnancy.
Comparison 2 Pairwise meta‐analysis for OHSS, Outcome 1 OS‐IUI vs EM.

Comparison 2 Pairwise meta‐analysis for OHSS, Outcome 2 OS‐IUI vs OS.
Comparison 2 Pairwise meta‐analysis for OHSS, Outcome 3 OS‐IUI vs IUI.
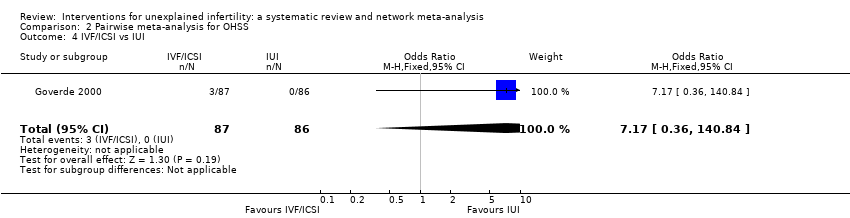
Comparison 2 Pairwise meta‐analysis for OHSS, Outcome 4 IVF/ICSI vs IUI.

Comparison 2 Pairwise meta‐analysis for OHSS, Outcome 5 IVF/ICSI vs OS‐IUI.

Comparison 3 Data analyses of RCTs that were not included in the network meta‐analysis, Outcome 1 Live birth.

Comparison 3 Data analyses of RCTs that were not included in the network meta‐analysis, Outcome 2 Multiple pregnancy.

Comparison 3 Data analyses of RCTs that were not included in the network meta‐analysis, Outcome 3 Clinical pregnancy.
| Estimates of effects, confidence intervals, and certainty of the evidence for live birth in couples with unexplained infertility | |||||
| Patient or population: couples with unexplained infertility Intervention: OS, IUI, OS‐IUI, or IVF/ICSI Comparator: expectant management, OS, IUI, or OS‐IUI Outcome: live birth Setting: outpatient | |||||
| All comparisons (10 RCTs, 2725 couples) | Illustrative comparative risks* (95% CI) | Relative effect | Quality of the evidence | ||
| Comparator | Intervention (number of RCTs and number of couples in direct comparison) | Assumed risk with comparator | Corresponding risk with intervention | ||
| Expectant management | OS (2 RCTs, 527 couples) | 166 per 1000 | 167 per 1000 | OR 1.01 | ⊕⊕⊝⊝ LOWa |
| IUI (1 RCT, 386 couples) | 166 per 1000 | 194 per 1000 | OR 1.45 | ⊕⊕⊝⊝ LOWa | |
| OS‐IUI (2 RCTs, 454 couples) | 166 per 1000 | 242 per 1000 | OR 1.61 | ⊕⊕⊝⊝ LOWb | |
| IVF/ICSI (no direct evidence available; only indirect evidence used here) | 166 per 1000 | 272 per 1000 | OR 1.88 | ⊕⊕⊝⊝ LOWa | |
| OS | IUI (1 RCT, 387 couples) | 174 per 1000 | 201 per 1000 | OR 1.20 | ⊕⊕⊝⊝ LOWa |
| OS‐IUI (1 RCT, 184 couples) | 174 per 1000 | 252 per 1000 | OR 1.60 | ⊕⊕⊝⊝ LOWa | |
| IVF/ICSI (no direct evidence available; only indirect evidence used here) | 174 per 1000 | 281 per 1000 | OR 2.63 | ⊕⊕⊝⊝ LOWa | |
| IUI | OS‐IUI (2 RCTs, 636 couples) | 166 per 1000 | 209 per 1000 | OR 1.33 | ⊕⊕⊝⊝ LOWa |
| IVF/ICSI (no direct evidence available; only indirect evidence used here) | 166 per 1000 | 235 per 1000 | OR 1.55 | ⊕⊕⊝⊝ LOWa | |
| OS‐IUI | IVF/ICSI (3 RCTs, 731 couples) | 319 per 1000 | 354 per 1000 | OR 1.17 | ⊕⊕⊝⊝ LOWa |
| CI: confidence interval; OR: odds ratio; RCT: randomised controlled trial. *The corresponding risk in the intervention group (and its 95% CI) is based on the mean risk in the comparator group and the relative effect of the intervention (and its 95% CI). **All ORs and 95% CIs are based on network estimates. | |||||
| GRADE Working Group grades of evidence. | |||||
| aDowngraded by two levels for very serious imprecision. bDowngraded by two levels for serious imprecision and serious heterogeneity. | |||||
| Estimates of effects, confidence intervals, and certainty of the evidence for multiple pregnancy in couples with unexplained infertility | |||||
| Patient or population: couples with unexplained infertility Intervention: OS, OS‐IUI, or IVF/ICSI Comparator: expectant management/IUI, OS, or OS‐IUI Outcome: multiple pregnancy Setting: outpatient | |||||
| All comparisons (11 RCTs, 2564 couples) | Illustrative comparative risks* (95% CI) | Relative effect | Quality of the evidence | ||
| Comparator | Intervention (number of RCTs and number of couples in direct comparison) | Assumed risk with comparator | Corresponding risk with intervention | ||
| Expectant management/IUI | OS (3 RCTs, 934 couples) | 6 per 1000 | 17 per 1000 | OR 3.07 | ⊕⊕⊝⊝ LOWa |
| OS‐IUI (3 RCTs, 625 couples) | 6 per 1000 | 18 per 1000 | OR 3.34 | ⊕⊕⊕⊝ MODERATEb | |
| IVF/ICSI (no direct evidence available; only indirect evidence used here) | 6 per 1000 | 15 per 1000 | OR 2.66 | ⊕⊕⊝⊝ LOWc | |
| OS | OS‐IUI (2 RCTs, 274 couples) | 23 per 1000 | 26 per 1000 | OR 1.09 | ⊕⊝⊝⊝ VERY LOWd |
| IVF/ICSI (no direct evidence available; only indirect evidence used here) | 23 per 1000 | 20 per 1000 | OR 0.87 | ⊕⊕⊝⊝ LOWc | |
| OS‐IUI | IVF/ICSI (3 RCTs, 731 couples) | 27 per 1000 | 22 per 1000 | OR 0.80 | ⊕⊕⊝⊝ LOWc |
| CI: confidence interval; OR: odds ratio; RCT: randomised controlled trial. *The corresponding risk in the intervention group (and its 95% CI) is based on the mean risk in the comparator group and the relative effect of the intervention (and its 95% CI). **All ORs and 95% CIs are based on network estimates. | |||||
| GRADE Working Group grades of evidence. | |||||
| aDowngraded by two levels for serious imprecision and serious heterogeneity. bDowngraded by one level for serious imprecision. cDowngraded by two levels for very serious imprecision. dDowngraded by three levels for serious study limitations and very serious imprecision. | |||||
| Estimates of effects, confidence intervals, and certainty of the evidence for clinical pregnancy in couples with unexplained infertility | |||||
| Patient or population: couples with unexplained infertility Intervention: OS, IUI, OS‐IUI, or IVF/ICSI Comparator: expectant management, OS, IUI, or OS‐IUI Outcome: clinical pregnancy Setting: outpatient | |||||
| All comparisons (23 RCTs, 3792 couples) | Illustrative comparative risks* (95% CI) | Relative effect | Quality of the evidence | ||
| Comparator | Intervention (number of RCTs and number of couples in direct comparison) | Assumed risk with comparator | Corresponding risk with intervention | ||
| Expectant management | OS (6 RCTs, 939 couples) | 157 per 1000 | 234 per 1000 | OR 1.64 | ⊕⊝⊝⊝ VERY LOWa |
| IUI (3 RCTs, 528 couples) | 157 per 1000 | 182 per 1000 | OR 1.20 | ⊕⊕⊝⊝ LOWb | |
| OS‐IUI (4 RCTs, 525 couples) | 157 per 1000 | 301 per 1000 | OR 2.32 | ⊕⊕⊝⊝ LOWc | |
| IVF/ICSI (no direct evidence available; only indirect evidence used here) | 157 per 1000 | 360 per 1000 | OR 3.03 | ⊕⊕⊝⊝ LOWc | |
| OS | IUI (2 RCTs, 407 couples) | 213 per 1000 | 165 per 1000 | OR 0.73 | ⊕⊝⊝⊝ VERY LOWd |
| OS‐IUI (8 RCTs, 763 couples) | 213 per 1000 | 276 per 1000 | OR 1.41 | ⊕⊝⊝⊝ VERY LOWe | |
| IVF/ICSI (no direct evidence available; only indirect evidence used here) | 213 per 1000 | 332 per 1000 | OR 1.84 | ⊕⊕⊝⊝ LOWf | |
| IUI | OS‐IUI (4 RCTs, 579 couples) | 174 per 1000 | 291 per 1000 | OR 1.94 | ⊕⊝⊝⊝ VERY LOWa |
| IVF/ICSI (no direct evidence available; only indirect evidence used here) | 174 per 1000 | 347 per 1000 | OR 2.52 | ⊕⊕⊝⊝ LOWf | |
| OS‐IUI | IVF/ICSI (3 RCTs, 731 couples) | 344 per 1000 | 437 per 1000 | OR 1.30 | ⊕⊕⊝⊝ LOWb |
| CI: confidence interval; OR: odds ratio; RCT: randomised controlled trial. *The corresponding risk in the intervention group (and its 95% CI) is based on the mean risk in the comparator group and the relative effect of the intervention (and its 95% CI). **All ORs and 95% CIs are based on network estimates. | |||||
| GRADE Working Group grades of evidence. | |||||
| aDowngraded by three levels for serious study limitations, imprecision, and heterogeneity. bDowngraded by two levels for very serious imprecision. cDowngraded by two levels for very serious heterogeneity. dDowngraded by three levels for very serious imprecision and serious incoherence. eDowngraded by three levels for very serious study limitations, serious imprecision, and serious heterogeneity. fDowngraded by two levels for serious imprecision and serious heterogeneity. | |||||
| IVF/ICSI compared with OS‐IUI for unexplained infertility | ||||||
| Patient or population: couples with unexplained infertility Settings: outpatient Intervention: IVF/ICSI Comparison: OS‐IUI | ||||||
| Outcomes | Illustrative comparative risks* (95% CI) | Relative effect | No. of participants | Quality of the evidence | Comments | |
| Assumed risk | Corresponding risk | |||||
| with OS‐IUI | with IVF/ICSI | |||||
| Moderate/severe OHSS | 11 per 1000 | 28 per 1000 | OR 2.50 (0.92 to 6.76) | 958 | ⊕⊕⊕⊝ | |
| *The basis for the assumed risk (e.g. the median control group risk across studies) is provided in footnotes. The corresponding risk (and its 95% confidence interval) is based on the assumed risk in the comparison group and the relative effect of the intervention (and its 95% CI). | ||||||
| GRADE Working Group grades of evidence. | ||||||
| aDowngraded by one level for serious imprecision. | ||||||
| Outcome or subgroup title | No. of studies | No. of participants | Statistical method | Effect size |
| 1 Live birth Show forest plot | 10 | Odds Ratio (M‐H, Random, 95% CI) | Subtotals only | |
| 1.1 OS vs EM | 2 | 527 | Odds Ratio (M‐H, Random, 95% CI) | 0.80 [0.49, 1.31] |
| 1.2 IUI vs EM | 1 | 386 | Odds Ratio (M‐H, Random, 95% CI) | 1.44 [0.87, 2.40] |
| 1.3 OS‐IUI vs EM | 2 | 454 | Odds Ratio (M‐H, Random, 95% CI) | 1.88 [0.36, 9.90] |
| 1.4 IUI vs OS | 1 | 387 | Odds Ratio (M‐H, Random, 95% CI) | 1.85 [1.09, 3.16] |
| 1.5 OS‐IUI vs OS | 1 | 184 | Odds Ratio (M‐H, Random, 95% CI) | 0.88 [0.46, 1.67] |
| 1.6 OS‐IUI vs IUI | 2 | 636 | Odds Ratio (M‐H, Random, 95% CI) | 1.68 [1.14, 2.49] |
| 1.7 IVF/ICSI vs OS‐IUI | 3 | 731 | Odds Ratio (M‐H, Random, 95% CI) | 1.16 [0.85, 1.57] |
| 2 Multiple pregnancy Show forest plot | 12 | Odds Ratio (M‐H, Random, 95% CI) | Subtotals only | |
| 2.1 OS vs EM/IUI | 3 | 934 | Odds Ratio (M‐H, Random, 95% CI) | 2.04 [0.51, 8.24] |
| 2.2 OS‐IUI vs EM/IUI | 4 | 676 | Odds Ratio (M‐H, Random, 95% CI) | 5.04 [1.24, 20.49] |
| 2.3 OS‐IUI vs OS | 2 | 274 | Odds Ratio (M‐H, Random, 95% CI) | 0.69 [0.12, 3.81] |
| 2.5 IVF/ICSI vs OS‐IUI | 3 | 731 | Odds Ratio (M‐H, Random, 95% CI) | 0.80 [0.37, 1.73] |
| 3 Clinical pregnancy Show forest plot | 23 | Odds Ratio (M‐H, Random, 95% CI) | Subtotals only | |
| 3.1 OS vs EM | 6 | 939 | Odds Ratio (M‐H, Random, 95% CI) | 1.31 [0.82, 2.10] |
| 3.2 IUI vs EM | 3 | 528 | Odds Ratio (M‐H, Random, 95% CI) | 1.52 [0.93, 2.47] |
| 3.3 OS‐IUI vs EM | 4 | 525 | Odds Ratio (M‐H, Random, 95% CI) | 2.69 [0.96, 7.55] |
| 3.4 IUI vs OS | 2 | 407 | Odds Ratio (M‐H, Random, 95% CI) | 1.69 [1.01, 2.82] |
| 3.5 OS‐IUI vs OS | 8 | 763 | Odds Ratio (M‐H, Random, 95% CI) | 1.26 [0.73, 2.18] |
| 3.6 OS‐IUI vs IUI | 4 | 579 | Odds Ratio (M‐H, Random, 95% CI) | 2.56 [1.72, 3.80] |
| 3.7 IVF/ICSI vs OS‐IUI | 3 | 731 | Odds Ratio (M‐H, Random, 95% CI) | 1.29 [0.95, 1.76] |
| Outcome or subgroup title | No. of studies | No. of participants | Statistical method | Effect size |
| 1 OS‐IUI vs EM Show forest plot | 1 | 51 | Odds Ratio (M‐H, Fixed, 95% CI) | 0.0 [0.0, 0.0] |
| 2 OS‐IUI vs OS Show forest plot | 2 | 274 | Odds Ratio (M‐H, Fixed, 95% CI) | 0.0 [0.0, 0.0] |
| 3 OS‐IUI vs IUI Show forest plot | 1 | 171 | Odds Ratio (M‐H, Fixed, 95% CI) | 0.0 [0.0, 0.0] |
| 4 IVF/ICSI vs IUI Show forest plot | 1 | 173 | Odds Ratio (M‐H, Fixed, 95% CI) | 7.17 [0.36, 140.84] |
| 5 IVF/ICSI vs OS‐IUI Show forest plot | 5 | 985 | Odds Ratio (M‐H, Fixed, 95% CI) | 2.50 [0.92, 6.76] |
| Outcome or subgroup title | No. of studies | No. of participants | Statistical method | Effect size |
| 1 Live birth Show forest plot | 4 | Odds Ratio (M‐H, Random, 95% CI) | Subtotals only | |
| 1.1 IVF/ICSI vs EM | 1 | 51 | Odds Ratio (M‐H, Random, 95% CI) | 22.00 [2.56, 189.37] |
| 1.2 IVF/ICSI vs IUI | 1 | 173 | Odds Ratio (M‐H, Random, 95% CI) | 1.49 [0.79, 2.82] |
| 1.3 IVF/ICSI vs OS‐IUI | 3 | 370 | Odds Ratio (M‐H, Random, 95% CI) | 2.23 [0.83, 5.98] |
| 2 Multiple pregnancy Show forest plot | 3 | Odds Ratio (M‐H, Random, 95% CI) | Subtotals only | |
| 2.1 IVF/ICSI vs IUI | 1 | 173 | Odds Ratio (M‐H, Random, 95% CI) | 7.44 [0.90, 61.80] |
| 2.2 IVF/ICSI vs OS‐IUI | 3 | 370 | Odds Ratio (M‐H, Random, 95% CI) | 0.81 [0.37, 1.74] |
| 3 Clinical pregnancy Show forest plot | 4 | Odds Ratio (M‐H, Random, 95% CI) | Subtotals only | |
| 3.1 IVF/ICSI vs EM | 1 | 51 | Odds Ratio (M‐H, Random, 95% CI) | 8.00 [1.89, 33.85] |
| 3.2 IVF/ICSI vs OS | 1 | 103 | Odds Ratio (M‐H, Random, 95% CI) | 2.36 [0.72, 7.72] |
| 3.3 IVF/ICSI vs OS‐IUI | 3 | 292 | Odds Ratio (M‐H, Random, 95% CI) | 2.61 [1.07, 6.37] |