Cirugía refractiva con láser excimer de frente de onda en adultos con errores de refracción
Resumen
Antecedentes
Los errores de refracción (afecciones en las que el ojo no logra enfocar los objetos con precisión en la retina debido a defectos en el sistema de refracción), son la causa más común del deterioro visual. La miopía, la hipermetropía y el astigmatismo son aberraciones de bajo orden, generalmente corregidas con gafas, lentes de contacto o cirugía refractiva convencional. Las aberraciones de alto orden (AAO) se pueden cuantificar con instrumentos de aberración de frente de onda y corregirse mediante cirugía láser guiada por frente de onda u optimizada por frente de onda. Las ablaciones guiadas por frente de onda se basan en mediciones preoperatorias de las AAO; las ablaciones optimizadas por frente de onda están diseñadas para minimizar la inducción de nuevas AAO, conservando al mismo tiempo las aberraciones que ocurren naturalmente. Se espera que dos procedimientos de frente de onda produzcan una mejor agudeza visual que los procedimientos convencionales.
Objetivos
El objetivo principal fue comparar la eficacia y la seguridad de los procedimientos de frente de onda, la queratomileusis in situ asistida por láser (LASIK) o la queratectomía fotorrefractiva (PRK) o la queratomileusis epitelial con láser (LASEK) versus los procedimientos convencionales correspondientes, para corregir los errores de refracción en los adultos por agudeza visual posoperatoria no corregida, los errores de refracción residuales y las AAO residuales. El objetivo secundario fue comparar dos procedimientos de frente de onda.
Métodos de búsqueda
Se realizaron búsquedas en el Registro Cochrane central de ensayos controlados (Cochrane Central Register of Controlled Trials) (CENTRAL, que contiene el Registro de ensayos del Grupo Cochrane de Salud ocular y de la visión [Cochrane Eyes and Vision Group]; 2019, número 8); Ovid MEDLINE; Ovid Embase; Latin American and Caribbean Health Sciences (LILACS); el registro ISRCTN; ClinicalTrials.gov y el ICTRP de la OMS. La fecha de la búsqueda fue el 6 de agosto de 2019. No se impusieron restricciones por idioma ni año de publicación. Se utilizó el Science Citation Index (septiembre de 2013) y se realizaron búsquedas en las listas de referencias de los ensayos incluidos para identificar otros ensayos relevantes.
Criterios de selección
Se incluyeron los ensayos controlados aleatorizados (ECA) que compararon la cirugía refractiva modificada de frente de onda con la cirugía refractiva convencional o la cirugía refractiva optimizada por frente de onda con la cirugía refractiva guiada por frente de onda en participantes ⪰ 18 años con errores refractivos.
Obtención y análisis de los datos
Se utilizó la metodología Cochrane estándar.
Resultados principales
Se identificaron 33 ECA realizados en Asia, Europa y los Estados Unidos, con un total de 1499 participantes (2797 ojos). Los participantes presentaban errores de refracción que iban desde una alta miopía a una baja hipermetropía. Los estudios informaron de al menos uno de los siguientes desenlaces específicos de la revisión sobre la base de las proporciones de ojos: con una agudeza visual no corregida (AVNC) de 20/20 o mejor, sin pérdida de una o más líneas de agudeza visual mejor corregida (AVMC) por las gafas, dentro de ± 0,50 dioptrías (D) de la refracción objetivo, con AAO y eventos adversos.
Características de los estudios y riesgo de sesgo
Los participantes en su mayoría eran mujeres, con una edad media de 29 y 53 años, y sin cirugía refractiva previa, patología ocular o comorbilidad sistémica. No fue posible evaluar los riesgos de sesgo para la mayoría de los dominios de la mayoría de los estudios. La mayoría de los estudios en los que se analizaron los dos ojos de un participante no tuvieron en cuenta las correlaciones entre los dos ojos en el análisis y el informe de los desenlaces.
Hallazgos
Para la comparación principal entre los procedimientos de frente de onda (PRK o LASIK o LASEK) y los procedimientos convencionales correspondientes, se dispuso de datos de desenlaces a los 12 meses de un solo estudio de PRK con 70 participantes. No hay evidencia de desenlaces más favorables de la PRK de frente de onda en la proporción de ojos: con una AVNC de 20/20 o mejor (razón de riesgos [RR] 1,03; intervalo de confianza [IC] del 95%: 0,86 a 1,24); sin pérdida de una o más líneas de AVMC con gafas (RR 0,94; IC del 95%: 0,81 a 1,09); dentro de un margen de ± 0,5 D de la refracción objetivo (RR 1,03; IC del 95%: 0,86 a 1,24); y un equivalente esférico medio (diferencia de medias [DM] 0,04; IC del 95%: ‐0,11 a 0,18). La evidencia de cada estimación del efecto fue de certeza baja. Ningún estudio informó AAO a los 12 meses.
A los seis meses, los hallazgos de dos a ocho estudios mostraron que las estimaciones del efecto general y las estimaciones por subgrupo de PRK o LASIK o LASEK fueron consistentes con las de PRK a los 12 meses, y no indican diferencias en todos los desenlaces. La certeza de la evidencia para cada desenlace fue baja.
En la comparación entre los procedimientos optimizados por frente de onda y los procedimientos guiados por frente de onda a los 12 meses, el efecto general se calculó para la proporción de ojos: con una AVNC de 20/20 o mejor (RR 1,00; IC del 95%: 0,99 a 1,02; cinco estudios, 618 participantes); sin pérdida de una o más líneas de AVMC con gafas (RR 0,99; IC del 95%: 0,96 a 1,02; I2 = 0%; cinco estudios, 622 participantes); dentro de ± 0,5 dioptrías de la refracción objetivo (RR 1,02; IC del 95%: 0,95 a 1,09; I2 = 33%; cuatro estudios, 480 participantes) y las AAO medias (DM 0,03; IC del 95%: ‐0,01 a 0,07; I2 = 41%; cinco estudios, 622 participantes) no mostraron evidencia de una diferencia entre los dos grupos. Debido a la heterogeneidad significativa, no se calculó una estimación del efecto global para el equivalente esférico medio a los 12 meses, pero las estimaciones puntuales no indicaron de forma consistente una diferencia entre la PRK optimizada por frente de onda versus la PRK guiada por frente de onda. Sin embargo, el LASIK optimizado por frente de onda comparado con el LASIK guiado por frente de onda puede mejorar el equivalente esférico medio (DM ‐0,14 D; IC del 95%: ‐0,19 a ‐0,09; cuatro estudios, 472 participantes). Todas las estimaciones de los efectos fueron de evidencia de certeza baja.
A los seis meses, los resultados fueron consistentes con los de los 12 meses sobre la base de dos a seis estudios. Los hallazgos no indican una diferencia entre dos procedimientos de frente de onda en los desenlaces evaluados, excepto en el subgrupo de LASIK optimizado por frente de onda que mostró una probable mejoría en el equivalente esférico medio (DM ‐0,12 D; IC del 95%: ‐0,19 a ‐0,05; I2 = 0%; tres estudios, 280 participantes; evidencia de certeza baja en relación con el LASIK guiado por frente de onda.
Se encontró un solo estudio que comparó el LASIK guiado por frente de onda con el PRK guiado por frente de onda a los seis y 12 meses. En ambos puntos temporales, las estimaciones de los efectos apoyaron de forma sistemática la ausencia de diferencias entre dos procedimientos. El grado de certeza de la evidencia fue muy bajo en todas las estimaciones.
Eventos adversos
La pérdida visual significativa o los efectos secundarios ópticos que se informaron fueron similares entre los grupos.
Conclusiones de los autores
Esta revisión indica que a los 12 meses y a los seis meses posoperatorios, no hubo diferencias importantes entre la cirugía refractiva de frente de onda versus la convencional ni entre la cirugía optimizada por frente de onda versus la cirugía guiada por frente de onda en los desenlaces clínicos analizados. La escasa certeza de la evidencia acumulativa informada hasta la fecha indica que las comparaciones asignadas al azar adicionales de estos enfoques quirúrgicos proporcionarían estimaciones más precisas de los efectos, pero es poco probable que modifiquen las conclusiones de esta revisión. Los ensayos futuros pueden optar por centrarse en los desenlaces notificados por los participantes como la satisfacción con la visión antes y después de la cirugía y los efectos de las anomalías visuales restantes, además de la sensibilidad al contraste y los desenlaces clínicos analizados en esta revisión.
PICO
Resumen en términos sencillos
¿Cuáles son los efectos beneficiosos y los riesgos de la cirugía refractiva con láser excimer de frente de onda para los trastornos oculares comunes?
¿Por qué es importante esta pregunta?
Los errores de refracción son la causa más común de la visión deficiente en todo el mundo. Las personas con errores de refracción tienen problemas para enfocar, debido a las irregularidades en la forma de sus ojos. Los errores de refracción causan:
‐ Visión corta (miopía), que hace que los objetos lejanos se vean borrosos;
‐ Hipermetropía, que hace que los objetos cercanos se vean borrosos; y
‐ Astigmatismo, que puede hacer que los objetos cercanos y lejanos se vean borrosos o distorsionados.
Los errores de refracción pueden ser corregidos con gafas o lentes de contacto, o tratados con cirugía. De forma convencional, para corregir las irregularidades los cirujanos utilizan un láser controlado por computadora que emite luz ultravioleta (cirugía refractiva con láser excimer). Los procedimientos quirúrgicos más recientes utilizan tecnología de imágenes tridimensionales para identificar irregularidades (técnicas modificadas de frente de onda); esto permite la corrección de irregularidades mucho más pequeñas que con el procedimiento convencional.
Se revisó la evidencia de los estudios de investigación para comparar los efectos beneficiosos y los riesgos de:
‐ la cirugía refractiva convencional con láser excimer versus las técnicas modificadas de frente de onda; y
‐ diferentes técnicas modificadas de frente de onda.
¿Cómo se identificó y evaluó la evidencia?
Se buscaron en la literatura médica los estudios controlados aleatorizados (estudios clínicos en los que las personas se colocan al azar en uno de dos o más grupos de tratamiento), ya que proporcionan la evidencia más sólida sobre los efectos de un tratamiento. Luego se compararon los resultados y se resumió la evidencia de todos los estudios. Finalmente, la confianza en la evidencia se calificó sobre la base de factores como los métodos y los tamaños de los estudios, así como la consistencia de los hallazgos entre los estudios.
¿Qué se encontró?
Se encontraron 33 estudios que involucraron a un total de 1499 personas de 18 años o más. Estos estudios se realizaron en Asia, Europa y los Estados Unidos, y se hizo un seguimiento de las personas durante un período de entre un mes y un año. La mayoría de las personas en los estudios eran mujeres, y la mayoría de las personas presentaban miopía.
Doce estudios informaron la fuente de financiación: dos estudios fueron financiados por el gobierno de los Estados Unidos, tres estudios fueron financiados por la industria y siete estudios no recibieron una financiación específica.
Pocos estudios proporcionaron información sobre los principales efectos de interés:
‐ la mejoría de la visión al año de la cirugía; y
‐ la aparición de efectos no deseados (adversos) como la pérdida significativa de la visión, los halos (ver círculos brillantes alrededor de las fuentes de luz) o el deslumbramiento (molestias causadas por la luz intensa).
Hay poca o muy poca confianza en la evidencia de los estudios que se encontraron, principalmente porque los estudios:
‐ produjeron resultados poco precisos e inconsistentes; y
‐ se diseñaron o realizaron de manera que fue posible que se introdujeran errores en sus resultados.
Cirugía refractiva con láser excimer convencional versus las técnicas modificadas de frente de onda
En los procedimientos en los que el cirujano retira la capa externa de la parte frontal del ojo para acceder a la zona de tratamiento (queratectomía fotorrefractiva, PRK), puede haber poca o ninguna diferencia entre las técnicas convencionales y las modificadas de frente de onda en la mejoría de la visión al año de la cirugía (un estudio).
Ningún estudio investigó la cirugía convencional versus las técnicas modificadas de frente de onda en procedimientos en los que el cirujano crea un pequeño colgajo en la parte delantera del ojo para acceder a la zona de tratamiento (queratomileusis in situ asistida por láser, LASIK).
Comparaciones entre diferentes técnicas modificadas de frente de onda
Es posible que haya poca o ninguna diferencia entre los procedimientos optimizados por frente de onda y los procedimientos guiados por frente de onda (dos tipos diferentes de técnicas modificadas de frente de onda) en la mejoría de la visión al año de la cirugía (seis estudios).
La confianza en la evidencia es demasiado baja para determinar si hay alguna diferencia en el efecto entre la PRK guiada por frente de onda y la LASIK guiada por frente de onda (un estudio).
Efectos adversos
El menor número de estudios que informaron sobre efectos no deseados indica que puede haber poca o ninguna diferencia entre los procedimientos que se compararon en cuanto a los efectos no deseados.
¿Qué significa esto?
Puede haber poca o ninguna diferencia en la mejoría de la visión entre:
‐ la cirugía refractiva convencional con láser excimer y las técnicas modificadas de frente de onda cuando se utiliza PRK;
‐ los procedimientos optimizados y guiados por frente de onda.
No se sabe qué procedimientos se asocian con menos efectos no deseados, debido a la escasez de evidencia.
Se necesitan más estudios, grandes y bien realizados, para mejorar la evidencia y proporcionar información sobre los efectos no deseados.
¿Cuál es el grado de actualización de esta revisión?
La evidencia de esta revisión Cochrane está actualizada hasta agosto de 2019.
Authors' conclusions
Summary of findings
| Wavefront procedures compared to conventional procedures for adults with refractive errors | ||||||
| Participant or population: Adults with refractive errors | ||||||
| Outcomes | Anticipated absolute effects* (95% CI) | Relative effect | № of participants | Certainty of the evidence | Comments | |
|---|---|---|---|---|---|---|
| Risk with conventional procedure | Risk with wavefront | |||||
| Proportion of eyes with uncorrected visual acuity (UCVA) of 20/20 or better post‐treatment:12 months ‐ Procedure: PRK | 86 per 100 | 88 per 100 | RR 1.03 | 70 | ⊕⊕⊝⊝ | ‐ |
| Proportion of eyes with uncorrected visual acuity (UCVA) of 20/20 or better post‐treatment:12 months ‐ Procedure: LASIK | see comment | ‐ | ‐ | ‐ | ‐ | There are no data on LASIK for this outcome at 12 months |
| Proportion of eyes that had lost 1 or more lines of best spectacle‐corrected visual acuity (BSCVA) posttreatment:12 months ‐ Procedure PRK | 6 per 100 | 5 per 100 | RR 0.94 | 70 | ⊕⊕⊝⊝ | ‐ |
| Proportion of eyes within ± 0.50 diopters (D) of target refraction: 12 months ‐ Procedure PRK | 86 per 100 | 88 per 100 | RR 1.03 | 70 | ⊕⊕⊝⊝ | ‐ |
| Proportion of eyes within ± 0.50 diopters (D) of target refraction: 12 months ‐ Procedure LASIK | see comment | ‐ | ‐ | ‐ | ‐ | There are no data on LASIK for this outcome at 12 months |
| Mean refractive error expressed as mean spherical equivalent post‐treatment:12 months ‐ Procedure PRK | The mean refractive error expressed as mean spherical equivalent post‐treatment:12 months ‐ Procedure PRK was ‐0.114 | MD 0.04 higher | ‐ | 70 | ⊕⊝⊝⊝ | ‐ |
| Proportion of eyes that had lost 1 or more lines of best spectacle‐corrected visual acuity (BSCVA) posttreatment‐procedure LASIK; Mean higher‐order aberrations (HOAs) post‐treatment, measured by machine with wavefront sensor; proportion of eyes with significant visual loss (loss of 2 or more lines from pretreatment BSCVA); proportion of eyes with optical side effects, such as glare and halo:12 months | see comment | ‐ | ‐ | ‐ | ‐ | There was no data on these outcomes at 12 months |
| *The risk in the intervention group (and its 95% confidence interval) is based on the assumed risk in the comparison group and the relative effect of the intervention (and its 95% CI). | ||||||
| GRADE Working Group grades of evidence | ||||||
| aDowngraded forImprecision. | ||||||
| Wavefront‐optimized procedures compared to wavefront‐guided procedures for adults with refractive errors | ||||||
| Participant or population: Adults with refractive errors | ||||||
| Outcomes | Anticipated absolute effects* (95% CI) | Relative effect | № of participants | Certainty of the evidence | Comments | |
|---|---|---|---|---|---|---|
| Risk with Any wavefront‐guided procedure | Risk with Any wavefront‐optimized | |||||
| Proportion of eyes with uncorrected visual acuity (UCVA) of 20/20 or better post‐treatment:12 months ‐ overall estimate | 97 per 100 | 97 per 100 | RR 1.00 | 618 | ⊕⊕⊝⊝ | ‐ |
| Proportion of eyes that had lost 1 or more lines of best spectacle‐corrected visual acuity (BSCVA) post‐treatment:12 months ‐ overall estimate | 5 per 100 | 5 per 100 | RR 0.99 | 622 | ⊕⊕⊝⊝ | ‐ |
| Proportion of eyes within ± 0.50 diopters (D) of target refraction post‐treatment:12 months ‐ overall estimate | 91 per 100 | 93 per 100 | RR 1.02 | 480 | ⊕⊕⊝⊝ | ‐ |
| Mean refractive error expressed as mean spherical equivalent post‐treatment:12 months ‐ Procedure PRK | The mean refractive error expressed as mean spherical equivalent post‐treatment:12 months ‐ Procedure PRK was −0.21 spherical equivalent | MD 0.07 spherical equivalent higher | ‐ | 334 | ⊕⊕⊝⊝ | ‐ |
| Mean refractive error expressed as mean spherical equivalent post‐treatment:12 months ‐ Procedure LASIK | The mean refractive error expressed as mean spherical equivalent post‐treatment:12 months ‐ Procedure LASIK ranged from 0.26 spherical equivalent | MD 0.14 spherical equivalent lower | ‐ | 472 | ⊕⊕⊝⊝ | ‐ |
| Mean higher‐order aberrations (HOAs) post‐treatment, measured by machine with wavefront sensor: 12 months ‐ overall estimate | The mean higher‐order aberrations (HOAs) post‐treatment, measured by machine with wavefront sensor: 12 months was 0.26 | MD 0.03 higher | ‐ | 622 | ⊕⊕⊝⊝ | ‐ |
| Proportion of eyes with significant visual loss (loss of 2 or more lines from pretreatment BSCVA): 12 months | see comment | ‐ | ‐ | ‐ | ‐ | One study that compared wavefront‐optimized LASIK versus wavefront‐guided LASIK reported on loss of 2 or more lines from pretreatment BSCVA that had not returned to baseline by 12 to 24 months after treatment (Manche 2013). Proportion of eyes with optical side effects, such as glare and halo |
| *The risk in the intervention group (and its 95% confidence interval) is based on the assumed risk in the comparison group and the relative effect of the intervention (and its 95% CI). | ||||||
| GRADE Working Group grades of evidence | ||||||
| aDowngraded for risk of bias. bDowngraded for imprecision. cDowngraded for inconsistency. | ||||||
| Wavefront‐guided LASIK compared to wavefront‐guided PRK for adults with refractive errors | ||||||
| Participant or population: Adults with refractive errors | ||||||
| Outcomes | Anticipated absolute effects* (95% CI) | Relative effect | № of participants | Certainty of the evidence | Comments | |
|---|---|---|---|---|---|---|
| Risk with wavefront‐guided PRK | Risk with wavefront‐guided LASIK | |||||
| Proportion of eyes with uncorrected visual acuity (UCVA) of 20/20 or better post‐treatment. ‐ 12 months | 94 per 100 | 97 per 100 | RR 1.03 | 66 | ⊕⊝⊝⊝ | ‐ |
| Proportion of eyes that had lost 1 or more lines of best spectacle‐corrected visual acuity (BSCVA) posttreatment. ‐ 12 months | 6 per 100 | 6 per 100 | RR 1.03 | 66 | ⊕⊝⊝⊝ | ‐ |
| Proportion of eyes within ± 0.50 diopters (D) of target refraction post‐treatment. ‐ 12 months | 909 per 1,000 | 882 per 1,000 | RR 0.97 | 66 | ⊕⊝⊝⊝ | ‐ |
| Mean refractive error expressed as mean spherical equivalent post‐treatment. ‐ 12 months | The mean refractive error expressed as mean spherical equivalent post‐treatment. ‐ 12 months was −0.17 | MD 0.01 higher | ‐ | 66 | ⊕⊝⊝⊝ | ‐ |
| Mean higher‐order aberrations (HOAs) post‐treatment, measured by machine with wavefront sensor ‐ 12 months | The mean HOAs post‐treatment, measured by machine with wavefront sensor ‐ 12 months was 0.38 | MD 0.01 lower | ‐ | 66 | ⊕⊝⊝⊝ | ‐ |
| Proportion of eyes with significant visual loss (loss of 2 or more lines from pretreatment BSCVA): 12 months | see comment | ‐ | ‐ | ‐ | ‐ | This outcome was not reported |
| Proportion of eyes with optical side effects, such as glare and halo: 12 months | see comment | ‐ | ‐ | ‐ | ‐ | This outcome was not reported |
| *The risk in the intervention group (and its 95% confidence interval) is based on the assumed risk in the comparison group and the relative effect of the intervention (and its 95% CI). | ||||||
| GRADE Working Group grades of evidence | ||||||
| aDowngraded for risk of bias. | ||||||
Background
Description of the condition
Refractive errors, including myopia, hyperopia and astigmatism of the eye, refer to conditions in which distant objects fail to focus accurately on the retina due to defects in the refractive system. Myopia and hyperopia occur when distant objects focus in front of and behind the retina, respectively. Astigmatism occurs when light rays from distant objects fail to propagate uniformly onto the retina, preventing sharp focus onto the retina and resulting in blurred vision. Myopia, hyperopia and astigmatism are considered lower‐order aberrations, defined as imperfections in image formation due to physical properties of the refractive system (e.g. the shape, curvature, or density of parts of the eye). Aberrations are quantified in terms of Zernike polynomials (e.g. first order, second order, etc.). Eyes with lower‐order aberrations may also have higher‐order aberrations (HOAs), such as spherical aberration, coma, and trefoil, which require special testing and management.
Refractive error is the most common cause of visual impairment and the second most frequent cause of treatable blindness worldwide (Resnikoff 2008). In the USA and Western Europe, refractive errors affect about one‐third of adults aged 40 years or older (Kempen 2004). In Australia, refractive errors affect one‐fifth of Australians in the same age group. In some East Asian areas, the prevalence of refractive error in adults aged 40 years or older has been estimated to be 32.9% to 57.4% (Liang 2009).
Refractive errors are diagnosed using the spherical equivalent (SE; spherical power +1/2 cylindrical power) of the eyes. Refractive error is diagnosed when the SE is outside the range of −0.50 to +0.50 diopter (D). Myopia and hyperopia are defined as SE less than −0.50 D and greater than +0.50 D, respectively. Astigmatism is measured by off‐axis cylindrical power and the axis that provides the 'circle of least confusion' is recorded. Refractive errors can be measured by using an autorefractor or manually by an optometrist or an ophthalmic technician (for a cooperative participant) using a series of lenses to identify the combination and power that provides the best possible vision (best correction). The best correction for distance viewing typically is recorded, but refraction may also be used to obtain the best correction for near and intermediate viewing, depending upon the participant's needs. HOAs cannot be measured using a traditional autorefractor; they are quantified by wavefront aberration measuring instruments such as an aberrometer with a wavefront sensor where smaller HOAs are better, i.e. represent better optical quality.
Description of the intervention
Spectacles are the simplest, safest, and most common method used to improve distance visual acuity in people with refractive errors. Contact lenses, including soft contact lenses, rigid gas permeable (RGP) lenses and orthokeratology (OK) lenses, are also commonly used for the correction of refractive errors. Soft contact and RGP lenses are worn during waking hours, whereas OK lenses are worn during sleeping hours and have been reported recently to be effective in controlling myopia progression in children (Cho 2012; Li 2015). However, when worn, spectacles and contact lenses serve to correct the effects of refractive errors, but do not treat the refractive errors permanently. Additionally, contact lenses may increase the risks of inflammation, conjunctival papillary reaction and even sight‐threatening corneal infection (Foulks 2006). A Cochrane Review in which different interventions for slowing myopia progression in children were compared documented that the most effective treatment option was atropine eyedrops (Walline 2020). Li 2014 further found that atropine eyedrops were more effective in Asian children than in white children. However, pharmaceutical interventions do not permanently treat refractive errors, and require repeated instillation during waking hours. They may be associated with undesirable side effects such as burning and stinging during administration, and blurring of vision (Walline 2020).
Excimer laser refractive surgery has been a popular and successful method for correcting refractive errors and improving distance visual acuity for about 30 years. Each year, over one million people worldwide undergo excimer laser refractive surgery (Sandoval 2016). Excimer laser refractive surgery is designed to correct refractive errors permanently by removing corneal tissues using laser ablation. Excimer laser refractive surgery is performed by creating an epithelial flap ('surface treatment') or corneal flap ('flap treatment') (Shortt 2013). The key difference between surface and flap treatments is the location of the flap, with flap treatments being deeper in the corneal layers than surface treatments. After lifting the flap created with alcohol, blade or laser, another type of laser is used to remove some of the corneal stroma. Surface treatments include photorefractive keratectomy (PRK), laser epithelial keratomileusis (LASEK) and laser‐assisted in‐situ keratomileusis (LASIK) . Flap treatments include LASIK and sub‐Bowmans keratomileusis (SBK). There is uncertainty as to which method of refractive surgery is most efficacious, accurate, and safe (Kuryan 2017; Li 2016; Settas 2012; Shortt 2013).
More recently, the small incision lenticule extraction (SMILE) procedure was invented. It is performed by extracting a refractive lenticule of intrastromal corneal tissue through a small corneal incision without creating a corneal flap (Sekundo 2011). There are also some procedures, such as intracorneal rings (synthetic devices inserted into the cornea to change its shape) and lenticular refractive procedures (clear lens extraction followed by intraocular lens insertion in the anterior or posterior chamber) that do not require ablation of corneal tissue (Barsam 2014).
How the intervention might work
The flap procedures described above are used in both conventional and wavefront refractive surgery. The difference between these two refractive surgeries lies in the procedure of removing corneal stroma. Conventional refractive surgery corrects only for lower‐order aberrations (myopia, hyperopia or astigmatism). In wavefront refractive surgery, three‐dimensional imaging technology is used to identify and correct HOAs. Thus, wavefront refractive surgery theoretically can produce better visual quality than conventional refractive surgery. However, neither type of surgery is without risk of adverse effects. Refractive surgery by excimer laser changes the corneal shape to a more oblate pattern and may introduce HOAs (Padmanabhan 2008). Nearly 30% of people who have had conventional excimer laser refractive surgery reported symptoms of visual disturbance, such as glare and halos, especially under dim light conditions (Karimian 2010). These procedures may also be associated with new visual symptoms, as seen in 43% of navy personnel (n = 262) and 46% of civilians (n = 312) of similar age (Eydelman 2017). After either conventional or wavefront refractive surgery, antibiotic eyedrops, corticosteroid eyedrops, and artifical tears are generally used for two to four weeks after surgery.
Wavefront refractive surgery, including wavefront‐guided or wavefront‐optimized ablations, is based on the analysis of wavefront aberrations (Krueger 2008; Mrochen 2000). It corrects spherical and astigmatic refractive errors (lower‐order aberrations), as well as pre‐existing or surgery‐induced HOAs. The wavefront technology analyzes aberrations and applies the information to the laser treatment (Nuijts 2002). During the procedure, the treatment area is marked on the visual axis to achieve geometric correspondence of the wavefront aberrations. The ablation of the wavefront aberrations is then performed using a laser with higher frequency and smaller spot diameter than conventional refractive surgery under continuous eye‐tracking control (Mastropasqua 2004). Wavefront‐guided ablations are based on preoperative measurements of HOAs in order to reduce existing HOAs, whereas wavefront‐optimized ablations are designed to minimize induction of new HOAs while preserving naturally‐occurring aberrations of the eye (He 2015).
Why it is important to do this review
Excimer laser refractive surgery is the most common type of surgery used to correct refractive errors (Shortt 2013). With the advancement of technology to facilitate the measurement and treatment of HOAs, custom laser profiles can be used in wavefront‐guided or wavefront‐optimized refractive surgery and have the potential to provide better control of aberrations. A systematic review comparing wavefront versus conventional excimer laser refractive surgery is important to determine whether one procedure results in better visual outcomes for participants.
Objectives
The primary objective was to compare the effectiveness and safety of wavefront procedure (wavefront‐optimized or wavefront‐guided (LASIK or PRK or LASEK)) versus corresponding conventional (LASIK or PRK or LASEK) excimer laser refractive surgery, for the correction of refractive errors in adults for postoperative uncorrected visual acuity, residual refractive error, and residual higher‐order aberrations. The secondary objective was to compare wavefront‐optimized versus wavefront‐guided refractive surgery (LASIK or PRK or LASEK).
Methods
Criteria for considering studies for this review
Types of studies
We included only randomized controlled trials (RCTs).
Types of participants
We included trials of participants aged 18 years or older who were randomly assigned to wavefront or conventional excimer laser refractive surgery (PRK or LASIK or LASEK) for any degree of refractive error. We included trials in which a subgroup of participants less than 18 years of age enrolled, when more than 75% of the study population were 18 years or older, or when data for participants 18 years or older were reported separately. We excluded trials that enrolled only participants who had significant coexisting ocular or systematic disease that could have affected refractive status or wound healing, or who had a history of ocular surgery, including refractive surgery.
Types of interventions
We included trials that compared the following interventions to manage refractive errors:
-
wavefront‐guided or ‐optimized refractive surgery versus conventional excimer laser refractive surgery (PRK or LASIK or LASEK); and
-
wavefront‐guided versus wavefront‐optimized refractive surgery (PRK or LASIK).
Types of outcome measures
Primary outcomes
-
Proportion of eyes with uncorrected visual acuity (UCVA) of 20/20 or better at 12 months post‐treatment
-
Proportion of eyes that had lost one or more lines of best spectacle‐corrected visual acuity (BSCVA) at 12 months post‐treatment compared to pre‐surgery measurements
We also analyzed these two outcomes at six months, as a secondary time point.
Secondary outcomes
-
Proportion of eyes within ± 0.50 diopters (D) of target refraction at six and 12 months post‐treatment
-
Mean refractive error expressed as mean spherical equivalent at six and 12 months post‐treatment
-
Mean higher‐order aberrations (HOAs) at 1, 3, 6 and 12 months post‐treatment, measured by machine with wavefront sensor
Adverse outcomes
-
Significant visual loss (loss of two or more lines from pretreatment BSCVA) that did not return within 12 to 24 months of treatment
-
Participant‐reported optical side effects such as glare and halo
Search methods for identification of studies
Electronic searches
The Cochrane Eyes and Vision Information Specialist searched the following databases for randomized controlled trials and controlled clinical trials. There were no restrictions by language or year of publication. The date of the search was 6 August 2019.
-
Cochrane Central Register of Controlled Trials (CENTRAL) (which contains the Cochrane Eyes and Vision Trials Register) in the Cochrane Library (issue 8, 2019) (Appendix 1)
-
MEDLINE Ovid (1946 to August 6, 2019) (Appendix 2)
-
Embase Ovid (1980 to August 6, 2019 ) (Appendix 3)
-
LILACS (Latin American and Caribbean Health Science Information Database (1982 to August 6, 2019) (Appendix 4)
-
US National Institutes of Health Ongoing Trials Register ClinicalTrials.gov (www.clinicaltrials.gov) (Appendix 5)
-
World Health Organization (WHO) International Clinical Trials Registry Platform (ICTRP) (www.who.int/ictrp) (Appendix 6)
Searching other resources
We searched the reference lists of included trials and related systematic reviews to identify further relevant trials. We did not contact manufacturers of laser systems or handsearch journals or conference abstracts for this review.
Data collection and analysis
Selection of studies
Two review authors (SML and SAA) independently screened the titles and abstracts of all records identified by the searches and assessed the relevance of each record using Covidence software. We resolved discrepancies by discussion or by a third review author (NLW). We obtained full‐text copies of reports of potentially relevant studies. Two review authors (SML and SAA) independently assessed the full‐text reports according to the definitions in Criteria for considering studies for this review and classified each study as 'include', 'exclude', or 'uncertain'. Whenever we deemed eligibility as uncertain because insufficient information was provided in the study reports, we contacted study authors for more information. The review authors were unmasked to the trial authors, institution and trial results during the assessment. We resolved any discrepancies by discussion or by consultation with a third review author (NLW). Excluded studies, along with the reasons for exclusion, are documented in the 'Characteristics of excluded studies' table.
Data extraction and management
Two review authors (SML and MTK) independently extracted data from each eligible study onto a web‐based, electronic data collection form in Covidence. Data items extracted included the following:
-
Study characteristics: country, setting, status of publication, publication year, title, authors, source, contact address, and funding sources;
-
Methods: study duration, randomization technique, method of allocation concealment before randomization, masking (participants, provider, outcome assessors), analysis methods for outcomes;
-
Participants: eligibility criteria, number in each intervention group, age, gender, similarity of intervention groups at baseline, withdrawals/losses to follow‐up (reason) and subgroups for whom outcomes were reported;
-
Interventions: types of refractive surgery (details of procedure), and medical or other adjunctive treatment (dose, route, duration);
-
Outcomes: outcomes specified above, any other outcomes reported, other events, times of assessment and length of follow‐up of individual participants. Definitions and methods for ascertaining outcomes have been checked for consistency among studies.
Whenever there were data items that we needed to clarify or expand, we contacted the authors of trial reports or organizations that sponsored the trial. We made three attempts (at two‐week intervals) to contact trial investigators by email. When we received no response after three attempts, we used data available in the trial reports. When data were shown only in figures (for example, mean and standard deviations) and could not be obtained from the authors, we used GetData Graph Digitizer 2.24 (getdata-graph-digitizer.com) to estimate data values from the figures. We resolved discrepancies by discussion, referring back to the original article or by consultation with a third review author (NLW). One review author entered data into Review Manager 5 (RevMan 5) (Review Manager 2019); a second review author verified the accuracy of data entry.
Assessment of risk of bias in included studies
Two review authors (SML and SAA) independently assessed each included trial for risks of bias according to Chapter 8 of the Cochrane Handbook for Systematic Reviews of Interventions (Higgins 2020). We judged risks of bias using domain‐based evaluations of selection bias (random sequence generation, allocation concealment before randomization), performance bias (masking of participants and study personnel), detection bias (masking of outcome assessors), attrition bias (amount and handling of missing data) and reporting bias (selective outcome reporting). We judged each trial for each 'Risk of bias' domain to be at 'low risk', 'high risk' or 'unclear risk' for the specific bias. We resolved all discrepancies between judgments of review authors by discussion or by seeking an opinion from a third review author (MTK). We contacted trial authors to clarify any bias domain graded as 'unclear risk' due to lack of information.
Measures of treatment effect
For dichotomous outcomes, we calculated risk ratios (RRs) with corresponding 95% confidence intervals (CIs). Dichotomous outcomes planned for this review include the proportion of eyes with UCVA of 20/20 or better, proportion of eyes that lost one or more lines of BSCVA, proportion of eyes within ± 0.50 D of target refraction, proportion of eyes with an adverse outcome (significant permanent visual loss or optical side effect). For continuous outcomes, we calculated mean differences (MDs) with corresponding 95% CIs. Continuous outcomes planned for this review include mean postoperative spherical equivalent and high‐order aberrations (HOAs).
Unit of analysis issues
The ideal unit of analysis is the individual (one study eye per participant). However, we acknowledge that some trials may have used a paired‐eye design, where one eye was randomized to one intervention and the contralateral eye was randomized to the other intervention. We included these trials, as well as trials in which both eyes of a participant were randomized to the same intervention. We documented when both eyes of a participant were included in a trial and assessed whether the data analysis appropriately accounted for the non‐independence of eyes. For trials with multiple treatment groups, we included only the treatment groups relevant to this review (i.e. groups treated with wavefront or conventional excimer laser refractive surgery).
Dealing with missing data
When data were missing from trial reports or were unclearly reported, we first contacted the trial authors to obtain supplemental information. When we were unable to obtain or confirm numerical data that were displayed only in figures from trial authors, we extracted the data using the software Get Data Graph Digitizer 2.24 (getdata-graph-digitizer.com). We did not impute data for the purposes of this review; however, we used trial results when available, when the trial investigators had performed and reported appropriate imputation. We had planned to perform sensitivity analysis to examine the potential impact of trials assessed at high risk of attrition bias, by excluding these trials from our analysis. We did not do this because most included studies were either at high or unclear risk of attrition bias.
Assessment of heterogeneity
We assessed clinical and methodological heterogeneity among trials to determine whether meta‐analysis was appropriate. When we found substantial clinical or methodological heterogeneity, we did not combine studies quantitatively, but rather presented a narrative summary of the trial results. When trials were clinically and methodologically similar (homogeneous), we combined data using meta‐analysis. We assessed statistical heterogeneity using a Chi2 test (with a 10% or smaller probability level suggesting heterogeneity), the I2 statistic (60% and more representing substantial statistical heterogeneity), and visual inspection of forest plots for consistency in the direction of estimates and overlap of CIs among studies.
Assessment of reporting biases
We had planned to assess potential publication bias using funnel plots when 10 or more trials were included in a meta‐analysis. An asymmetrical funnel plot may be the result of factors such as publication bias, heterogeneity of effects or differences in the methodological quality of studies. However, there were fewer than 10 studies for any given outcome in our meta‐analysis, so it was not possible to assess publication bias. We also evaluated selective outcome reporting as part of our assessment of risk of bias in included studies.
Data synthesis
When we found substantial statistical heterogeneity, we rechecked the data entered into RevMan 5 software. When the data had been confirmed to be correct and the direction of effects remained inconsistent, we considered whether combination of the data across studies was appropriate. We conducted subgroup analyses to explore heterogeneity according to predetermined characteristics defined in the section Subgroup analysis and investigation of heterogeneity. We used random‐effects model for all analysis.
Subgroup analysis and investigation of heterogeneity
We had planned to perform subgroup analysis according to the following ranges of myopia: low to moderate myopia (< −0.50 to −6.00 D) and moderate to high myopia (< −6.00 to −15.00 D). We did not conduct these analyses because of insufficient data. We also performed subgroup analysis for laser platform, ablation algorithm and method for creating corneal flap (PRK or LASIK) when comparing wavefront‐guided or wavefront‐optimized refractive surgery (wavefront) versus conventional excimer laser refractive surgery and when comparing wavefront‐guided versus wavefront‐optimized refractive surgery. We considered other factors such as age and race for subgroup analysis when there was sufficient information reported in the included trials. We documented and provided a rationale for any post hoc subgroup analysis.
Sensitivity analysis
We had planned to examine the impact of restricting the analysis to studies of high methodological quality as reflected in low overall risk of bias assessment across 'Risk of bias' domains assessed, as well as the impact of excluding unpublished data, on the effect estimates. However, we did not perform these analyses because we rated none of the included studies at overall low risk of bias and we obtained no unpublished data. We evaluated the effect of excluding from the analyses studies that provided extreme estimates of intervention effects compared to other studies (outliers) or studies conducted among participants with hyperopia as part of a sensitivity analysis to explore their impact on the effect estimates. We also assessed the impact of excluding industry‐funded studies on the effect estimates in a sensitivity analysis. Post hoc, we had planned to assess the impact of restricting our analysis to studies that analyzed data at the participant rather than at the eye level. We did not perform this analysis because of an insufficient number of studies with these characteristics.
Summary of findings and assessment of the certainty of the evidence
We summarized the main findings for each comparison of interest, including strengths and limitations of evidence for primary, secondary, and adverse outcomes, using the GRADE approach (GRADEpro GDT). We assessed the certainty of evidence for each outcome as 'high,' 'moderate,' 'low,' or 'very low' according to the following criteria as described in Chapter 14 of the Cochrane Handbook for Systematic Reviews of Interventions (Schünemann 2020).
-
High risk of bias among included studies.
-
Indirectness of evidence.
-
Unexplained heterogeneity or inconsistency of results.
-
Imprecision of results (i.e. wide confidence intervals).
-
High probability of publication bias.
We downgraded the certainty of evidence by one point for each of the above deficiencies. We present a 'Summary of findings' table (summary of findings Table 1; summary of findings Table 2; summary of findings Table 3) for each comparison of interest when data were available. The comparisons include:
-
wavefront‐optimized or ‐guided refractive surgery (wavefront) versus conventional excimer laser refractive surgery;
-
wavefront‐optimized versus wavefront‐guided refractive surgery; and
-
wavefront‐guided PRK versus wavefront‐guided LASIK.
We included the following seven outcomes at 12 months post‐treatment in the 'Summary of findings' tables.
-
Proportion of eyes with UCVA of 20/20 or better;
-
Proportion of eyes that had lost one or more lines of BSCVA;
-
Proportion of eyes within ± 0.50 D of target refraction;
-
Mean refractive error expressed as mean spherical equivalent;
-
Mean HOAs, measured by machine with wavefront sensor;
-
Proportion of eyes with significant visual loss (loss of two or more lines from pretreatment BSCVA);
-
Proportion of eyes with optical side effects, such as glare and halo.
Because of a paucity of data for outcomes at 12 months, we decided post hoc to include more 'Summary of finding' tables as Additional tables for outcomes at six months.
Results
Description of studies
Results of the search
Electronic databases searched on 6 August 2019 yielded 1161 records; we added five records after searching the reference lists of included studies (Figure 1). We excluded 1061 records for studies that did not meet the eligibility criteria based on a review of titles and abstracts. We retrieved 100 full‐text records and further assessed them for eligibility, of which we excluded 50 and recorded reasons for exclusion (Characteristics of excluded studies). We classified the records of two studies as awaiting classification and included 48 records of 33 studies in the review. There were 5, 5 and 8 records from Manche 2013, Manche 2015 and Bower 2015, respectively. There were no ongoing or unpublished studies identified from registers.

Study flow diagram.
Included studies
Types of studies
The 33 studies enrolled a total of 1499 adult participants (2797 eyes) with refractive errors that ranged from high myopia to low hyperopia. Studies were published from 2002 to 2019 and seven of the 33 were registered; participant follow‐up ranged from one month to 12 months. Two studies assessed interventions for hyperopia (Durrie 2010; Manche 2014) and the other 31 compared interventions for myopia. The studies were conducted mostly in the USA (15), but also in China (5), Iran (3), Korea (3), UK (2) Thailand (2) and one study each from Italy, Ireland and The Netherlands. In three of the 33 studies, one eye of each participant was randomized to each intervention group (Durrie 2010; Mastropasqua 2006; Qiu 2007), in eight studies both eyes of participants were in the same intervention group (Bower 2015; Bower 2018; Brint 2005; Chen 2010; Durrie 2004; Lee 2006; Yu 2007; Yu 2008a), two studies did not report on how eyes were assigned to intervention (Anderson 2004; Smith 2004), and the remaining 20 studies used paired‐eyes designs, where correlated eyes of the same participant were in different intervention groups.
Types of participant
The sample size of included trials ranged from nine (Smith 2004) to 108 (Bower 2015) participants per trial. Some of the studies did not report the age or gender of participants. Among 24 trials with information on age and gender, participants were predominantly women, with mean ages ranging between 29 and 53 years. Preoperative spherical equivalent refraction of participants ranged from −3.26 to −4.45 diopters (D) in the wavefront‐optimized PRK group and −3.34 to −4.66 D in the wavefront‐guided PRK group. In the wavefront‐optimized LASIK group, preoperative spherical equivalent refraction ranged from +1.93 to −4.61 D; +1.73 to −4.56 D in the wavefront‐guided LASIK group; −2.25 to −4.57 D in the wavefront‐guided PRK group, and −2.35 to −4.58 D in the conventional PRK group; −1.81 to −7.18 D in the conventional LASIK group and −2.01 to −7.09 D in the wavefront‐guided LASIK group; −2.99 D in the conventional PRK group and −2.60 in the wavefront‐optimized PRK group; +1.75 D in the conventional LASIK (hyperopia) and +1.52 D in the wavefront‐optimized LASIK (hyperopia) group; −7.25 ± 3.47 (−5.50 to −10.75) D in both conventional LASEK group and wavefront‐guided LASEK groups; −4.39 in the wavefront‐guided PRK and −4.46 in the wavefront‐guided LASIK.
Types of intervention
We categorized the comparisons into two main groups, as wavefront procedure (wavefront‐optimized or wavefront‐guided (LASIK or PRK or LASEK)) versus corresponding conventional procedure (LASIK or PRK or LASEK), and wavefront‐optimized (LASIK or PRK) versus wavefront‐guided (LASIK or PRK), and added a third comparison of wavefront‐guided LASIK versus wavefront‐guided PRK.
Twenty studies compared a wavefront procedure versus the corresponding conventional procedure. Of these, 15 assessed a wavefront LASIK procedure versus conventional LASIK procedure (Anderson 2004; D'Arcy 2012; Durrie 2004; Durrie 2010; Kim 2004; Lee 2005; Lee 2006; Merchea 2004; Nuijts 2002; Phusitphoykai 2003; Qiu 2007; Smith 2004; Vongthongsri 2002; Yu 2007; Yu 2008a); one study compared wavefront‐guided LASEK with conventional LASEK (Chen 2010), and four studies assessed a wavefront PRK procedure versus conventional PRK (Karimian 2010; Mastropasqua 2006; Mifflin 2012; Nassiri 2011). Among the 13 studies that assessed wavefront‐optimized (LASIK or PRK) versus wavefront‐guided (LASIK or PRK), eight studies assessed wavefront‐optimized LASIK versus wavefront‐guided LASIK procedure (Bower 2018; Brint 2005; Lee 2018; Manche 2014; Manche 2013; Miraftab 2011; Moshirfar 2011b; Roe 2019), four compared wavefront‐optimized PRK versus wavefront‐guided PRK procedure (Bower 2015; Manche 2015; Moshirfar 2011a; Zhao 2015) and one study assessed wavefront‐guided LASIK versus wavefront‐guided PRK (Manche 2011).
Types of outcome
Visual acuity outcomes
Seven studies reported data on the proportion of eyes with uncorrected visual acuity (UCVA) of 20/20 or better at 12 months post‐treatment (Bower 2015; Manche 2014; Manche 2013; Manche 2015; Mifflin 2012; Roe 2019; Manche 2011;) and 11 studies reported this outcome at six months (Durrie 2010; Lee 2006; Manche 2011; Manche 2014; Manche 2013; Manche 2015; Mastropasqua 2006; Mifflin 2012; Yu 2007; Yu 2008a; Zhao 2015). Five studies reported data on the proportion of eyes that had lost one or more lines of best spectacle‐corrected visual acuity (BSCVA) at 12 months post‐treatment (Bower 2015; Manche 2014; Manche 2013; Mifflin 2012; Roe 2019) and six studies reported the outcome at six months (Durrie 2010; Lee 2006; Manche 2014; Manche 2013; Mifflin 2012; Nuijts 2002). Six studies each reported data on loss of one or more lines of BSCVA at 12 months (Bower 2015; Manche 2011; Manche 2014; Manche 2013; Mifflin 2012; Roe 2019) and at six months (Durrie 2010; Lee 2006; Manche 2014; Manche 2013; Mifflin 2012; Nuijts 2002).
Refraction outcomes
Seven studies reported on the proportion of eyes with refractive error within ± 0.50 D of target at 12 months post‐treatment (Bower 2015; Manche 2011; Manche 2014; Manche 2013; Manche 2015; Mifflin 2012; Roe 2019) and at six months post‐treatment in nine studies (Durrie 2010; Karimian 2010; Manche 2011; Manche 2014; Manche 2013; Mastropasqua 2006; Mifflin 2012; Nuijts 2002; Zhao 2015). Seven studies reported mean refractive error expressed as mean spherical equivalent post‐treatment at 12 months (Bower 2015; Manche 2011; Manche 2014; Manche 2013; Manche 2015; Mifflin 2012; Roe 2019) and 15 studies at six months (Bower 2015; Durrie 2010; Karimian 2010; Lee 2006; Manche 2011; Manche 2014; Manche 2013; Manche 2015; Mastropasqua 2006; Mifflin 2012; Phusitphoykai 2003; Qiu 2007; Roe 2019; Yu 2007; Yu 2008a).
Higher‐order aberration outcomes
Mean higher‐order aberrations (HOAs) post‐treatment were reported in 10 studies at one month (Brint 2005; Chen 2010; Kim 2004; Manche 2011; Manche 2014; Manche 2013; Manche 2015; Qiu 2007; Roe 2019; Vongthongsri 2002); 19 studies at three months (Anderson 2004; Brint 2005; Chen 2010; D'Arcy 2012; Kim 2004; Lee 2005; Manche 2011; Manche 2014; Manche 2013; Manche 2015; Mastropasqua 2006; Mifflin 2012; Miraftab 2011; Moshirfar 2011a; Moshirfar 2011b; Nassiri 2011; Qiu 2007; Roe 2019; Smith 2004); 12 studies at six months (Karimian 2010; Manche 2011; Manche 2014; Manche 2013; Manche 2015; Mastropasqua 2006; Mifflin 2012; Miraftab 2011; Qiu 2007; Roe 2019; Yu 2008a; Zhao 2015) and seven studies at 12 months (Bower 2015; Manche 2011; Manche 2014; Manche 2013; Manche 2015; Mifflin 2012; Roe 2019).
Adverse outcomes
One study reported on the loss of two or more lines from pretreatment BSCVA that had not returned to baseline by 12 to 24 months after treatment (Manche 2013). Nine studies provided information on other optical side effects (Bower 2015; Lee 2006; Manche 2011; Manche 2014; Manche 2013; Manche 2015; Mifflin 2012; Moshirfar 2011b; Yu 2008a).
Funding sources and declarations of interest
Investigators from 12 studies reported their source of funding for their studies or reported receiving no funding. Two studies were US‐government funded (Bower 2015; Bower 2018), three studies were industry‐funded (Brint 2005; Lee 2018; Roe 2019), seven reported no funding (Kim 2004; Lee 2005; Lee 2006; Moshirfar 2011a; Moshirfar 2011b; Qiu 2007; Zhao 2015), and reports from 21 studies had no information on funding source. Eight of the 33 studies did not report any conflict of interest (Bower 2015; Chen 2010; D'Arcy 2012; Phusitphoykai 2003; Qiu 2007; Vongthongsri 2002; Yu 2007; Zhao 2015). Of the 25 studies for which investigators declared conflicts of interest, at least one author in 10 studies reported either having equity or consulting for industries that were also a manufacturer of at least one of the intervention devices evaluated (Brint 2005; Durrie 2004; Durrie 2010; Manche 2011; Manche 2014; Manche 2013; Manche 2015; Merchea 2004; Roe 2019; Smith 2004). Authors of the remaining 15 trials reported having no conflict of interest.
Excluded studies
We excluded 50 records after review of full‐text reports: 27 reports were not RCTs, 20 reports used interventions or comparison interventions that were not specific to the review and three focused on populations not of interest. Detailed reasons for exclusion of each trial are given in the table of Characteristics of excluded studies. We did not identify any ongoing studies.
Risk of bias in included studies
We show our judgements of the risks of bias in each domain for each study in Figure 2, and summarize the risk of bias for each domain among all included trials in Figure 3. In summary, we judged no study among the 33 included to be at overall low risk of bias. All trials were reported in insufficient detail to judge the potential for most sources of bias assessed. Of note, risk of bias for 10 trials: Anderson 2004; Brint 2005; Chen 2010; D'Arcy 2012; Durrie 2004; Durrie 2010; Lee 2005; Phusitphoykai 2003; Smith 2004 and Vongthongsri 2002 could not be judged for any domains assessed, due to insufficient information provided by these trials.

Risk of bias summary: review authors' judgements about each risk of bias item for each included study.

Risk of bias graph: review authors' judgements about each risk of bias item presented as percentages across all included studies.
Allocation
Random sequence generation
Eighteen of the 33 included trials (Bower 2015; Karimian 2010; Lee 2006; Lee 2018; Manche 2011; Manche 2013; Manche 2015; Mastropasqua 2006; Mifflin 2012; Miraftab 2011; Moshirfar 2011a; Moshirfar 2011b; Nassiri 2011; Qiu 2007; Roe 2019; Yu 2007; Yu 2008a; Zhao 2015) used an adequate method to generate the random sequence of assignments to intervention and we judged them as low risk of bias. The remaining 15 trials did not describe the method of randomization used, and were classified as having unclear risk of bias.
Allocation concealment
Four studies (Manche 2015; Nassiri 2011; Roe 2019; Yu 2007) used adequate methods to conceal the treatment allocation before the random assignment was revealed and were judged at low risk of bias. The remaining 29 studies were judged at unclear risk of bias because they did not report whether or how treatment allocation was concealed.
Blinding
Performance bias
Five studies (Karimian 2010; Kim 2004; Manche 2015; Roe 2019; Yu 2007) were judged to be at low risk of bias as participants and personnel were adequately masked to the treatment for each eye. Two studies (Bower 2015; Bower 2018) were open‐label and were judged to be at high risk for performance bias. The remaining 26 studies were judged to have unclear risk of bias due to unclear reporting.
Detection bias
One study was judged to be at low risk of detection bias, as the outcome assessor was adequately masked (Kim 2004). The remaining 32 studies were judged to be at unclear risk of detection bias due to unclear reporting.
Incomplete outcome data
Eleven studies (Bower 2015; Lee 2018; Manche 2011; Manche 2014; Manche 2015; Mifflin 2012; Miraftab 2011; Moshirfar 2011b; Nuijts 2002; Roe 2019; Yu 2008a) were judged to be at low risk of attrition bias as there were no losses to follow‐up and therefore incomplete outcome data were minimal. Three studies (Bower 2018; Lee 2006; Merchea 2004) were judged to be at high risk of attrition bias as there were high losses to follow‐up. We judged the remaining 19 studies to be at unclear risk of bias due to insufficient information about incomplete outcome data because of poor reporting.
Selective reporting
We judged six studies at low risk of bias for selective outcome reporting based on comparison with a published protocol, trial registration record, or comparison of the outcomes reported with those stated in study methods (Bower 2015; Bower 2018; Kim 2004; Manche 2011; Manche 2013; Manche 2015). We judged two trials (Lee 2018; Roe 2019) to be at high risk of bias for selective outcome reporting, since not all outcomes specified in registration records for those trials were reported. The remaining 25 studies were judged to be at unclear risk of bias for selective reporting because outcomes reported were either not stated in the study methods or we were unable to find a protocol or trial register record to ascertain consistency between prespecified outcomes and those reported from the study.
Effects of interventions
See: Summary of findings 1 Wavefront procedures compared to conventional procedures for adults with refractive errors; Summary of findings 2 Wavefront‐optimized procedures compared to wavefront‐guided procedures for adults with refractive errors; Summary of findings 3 Wavefront‐guided LASIK compared to wavefront‐guided PRK for adults with refractive errors
Outcomes from six of the 33 trials (D'Arcy 2012; Durrie 2004; Lee 2018; Merchea 2004; Smith 2004; Vongthongsri 2002) were not included in quantitative synthesis because they either did not report primary or secondary outcome data of interest or reported data in a format insufficient for analysis. We therefore include 27 trials in meta‐analyses.
Comparison 1. Wavefront versus corresponding conventional procedures
Nineteen studies compared either a wavefront‐optimized or wavefront‐guided LASIK or PRK with the corresponding conventional procedure: (Anderson 2004; D'Arcy 2012; Durrie 2004; Durrie 2010; Karimian 2010; Kim 2004; Lee 2005; Lee 2006; Mastropasqua 2006; Merchea 2004; Mifflin 2012; Nassiri 2011; Nuijts 2002; Phusitphoykai 2003; Qiu 2007; Smith 2004; Vongthongsri 2002; Yu 2007; Yu 2008a). However not all studies reported all outcomes of interest. One study compared wavefront‐guided LASEK with conventional LASEK (Chen 2010).
Proportion of eyes with UCVA of 20/20 or better
Proportion of eyes with UCVA of 20/20 or better when examined six months after refractive surgery was reported in six studies (Durrie 2010; Karimian 2010; Lee 2006; Mifflin 2012; Nuijts 2002; Yu 2007), but only Mifflin 2012 reported this outcome at 12 months. The estimated RR at six months, along with its 95% confidence interval (CI) was: overall: RR 1.00, 95% CI 0.96 to 1.03; I2 = 0%; 6 studies, 470 participants. When examined by subgroup, effect estimates from the two studies of PRK are: RR 0.95, 95% CI 0.81 to 1.12; I2 = 0%; 2 studies, 136 participants, and from the four studies of LASIK: RR 1.00, 95% CI 0.96 to 1.04; I2 = 0%; 4 studies, 334 participants. Thus, we combined data from all 470 participants in all six studies among subgroups of participants in studies of PRK or LASIK and found no statistically or clinically significant difference between wavefront and conventional refractive surgery for achieving UCVA of 20/20 or better six months after surgery (Figure 4; Analysis 1.1). We rated the certainty of evidence for the overall outcome at six months and for subgroup outcomes as low, owing to risk of bias and imprecision. Mifflin 2012 was the only study in which UCVA of 20/20 or better was reported at 12 months after surgery. The estimated RR of wavefront‐guided PRK compared with conventional PRK was 1.03 (95% CI 0.86 to 1.24; 70 participants; Analysis 1.2). The 12‐month effect estimate is consistent with the six‐month estimates, indicating no benefit of wavefront‐guided PRK relative to conventional PRK for this outcome. The certainty of evidence was low, downgraded for risk of bias and imprecision.

Forest plot of comparison: 1 Wavefront vs Conventional procedure, outcome: 1.1 Proportion of eyes with uncorrected visual acuity (UCVA) of 20/20 or better post‐treatment: 6 months.
Proportion of eyes without loss of BSCVA
Proportion of eyes without loss of one or more lines of BSCVA from presurgical levels when examined six or 12 months after surgery was reported by three studies at six months (Durrie 2010; Mifflin 2012; Phusitphoykai 2003), but only by Mifflin 2012 at 12 months. The six‐month and 12‐month effect estimates from Mifflin 2012, in which wavefront‐guided PRK was compared with conventional PRK were: RR 1.00, 95% CI 0.93 to 1.07; 80 participants at six months (Analysis 1.3), and: RR 0.94, 95% CI: 0.81 to 1.09; 70 participants at 12 months (Analysis 1.4). For this outcome among the 71 participants in the two studies in which LASIK procedures were compared, the estimated effect at six months was: RR 1.11, 95% CI 0.88 to 1.40; I2 = 59%. The overall effect estimate was: RR 1.04, 95% CI 0.93 to 1.17; I2 = 45%; 3 studies, 151 participants at six months. Neither at six nor at 12 months after surgery nor by type of refractive corneal procedure (PRK or LASIK) was there a clinically or statistically important difference between the wavefront and conventional interventions for this outcome. We graded the certainty of evidence for the overall outcome and outcomes by subgroups at six and 12 months as low, due to risk of bias and imprecision.
Proportion of eyes within ± 0.5 diopters of target refraction
Effect estimates of the proportions of eyes in which the refractive error was within ±0.5 D of the target refraction were based on findings reported for 212 participants in four studies at six months (Karimian 2010; Mastropasqua 2006; Mifflin 2012; Phusitphoykai 2003) and for 70 participants in one of the four studies at 12 months (Mifflin 2012). Due to inconsistency in the direction of effect estimates from individual studies, we considered it inappropriate to combine the data across studies of PRK and LASIK into an overall effect estimate at six months. Effect estimates for subgroups were: for the three studies of PRK: RR 0.89, 95% CI 0.78 to 1.01; I2 = 32%; 192 participants; and one study of LASIK: RR 1.11, 95% CI 0.85 to 1.44; 20 participants (Figure 5; Analysis 1.5). None of the effect estimates for the subgroups showed any evidence of a difference between the wavefront and the conventional procedure groups. The effect estimate at 12 months from one study also showed no evidence of a difference between the groups: RR 1.03, 95% CI 0.86 to 1.24; 70 participants; Analysis 1.6. The certainty of evidence for this outcome at both time points was very low, downgrading for risk of bias, imprecision and inconsistency.

Forest plot of comparison: 1 Wavefront vs Conventional procedure, outcome: 1.5 Proportion of eyes within ± 0.50 diopters (D) of target refraction: 6 months.
Mean refractive error, spherical equivalent
Data for this outcome at six months were available for eight trials (Durrie 2010; Karimian 2010; Lee 2006; Mastropasqua 2006; Mifflin 2012; Phusitphoykai 2003; Qiu 2007; Yu 2007), but at 12 months only for Mifflin 2012. At six months, no overall mean difference (MD) in refractive error was calculated, due to substantial heterogeneity. The effect estimate for studies of PRK was: MD 0.06 D, 95% CI −0.09 D to 0.21 D; 3 studies, 196 participants, and that for studies of LASIK was: MD 0.11 D, 95% CI −0.05 D to 0.28 D; I2=83%; 5 studies, 428 participants (Figure 6; Analysis 1.7). The effect estimates for the subgroups based on the type of refractive corneal procedure (PRK or LASIK) showed no evidence of a difference between the wavefront and the conventional procedures. Statistical heterogeneity for the estimates of the LASIK subgroup was high (I2=83%) . At 12 months, the estimated mean refractive error based on data for 70 participants in a single trial also showed no evidence of effect: MD 0.04 D, 95% CI −0.11 to 0.18. At neither six months, 12 months nor by type of refractive corneal procedure (PRK or LASIK) do the effect estimates suggest a consistent statistically or clinically important difference between wavefront procedures and conventional procedures. The certainty of evidence for this outcome at both time points as well as by type of procedure was very low, after downgrading for risk of bias, inconsistency and imprecision.

Forest plot of comparison: 1 Wavefront vs Conventional procedure, outcome: 1.7 Mean refractive error expressed as mean spherical equivalent post‐treatment: 6 months.
Higher‐order aberrations (HOAs) post‐treatment
No study reported mean HOAs at 12 months post‐treatment for this outcome. However, mean HOAs at one month post‐surgery were reported by three studies (Chen 2010; Kim 2004; Lee 2005), at three months by five studies (Anderson 2004; Chen 2010; Kim 2004; Lee 2005; Nassiri 2011), and at six months by five studies (Bower 2015; Manche 2014; Manche 2013; Roe 2019; Zhao 2015). We graded the certainty of evidence for HOAs at both one and three months as moderate, downgrading for risk of bias, and rated the certainty of evidence for this outcome at six months as very low, downgrading for risk of bias, inconsistency and imprecision.
Estimated mean HOAs from meta‐analysis of findings from these studies by post‐surgery times are provided below.
One month:
No overall effect estimate was calculated, because of substantial heterogeneity. No study of PRK reported mean HOAs at one month. Data from two studies of LASIK with 68 participants suggest a benefit in favor of the wavefront procedure at one month (MD −0.12, 95% CI −0.22 to −0.03; I2 = 0%). The evidence favored wavefront‐guided LASIK compared to conventional LASIK. The effect estimate for LASEK among 80 participants was: MD −0.31, 95% CI −0.38 to −0.23; I2 = 0%; 1 study ( Analysis 1.9).
Three months:
No overall estimates were calculated due to substantial heterogeneity among subgroups being evaluated (I2 = 96%). The effect estimates at three months were as follows: studies of PRK: MD −0.04, 95% CI −0.10 to 0.02; 1 study, 132 participants; studies of LASIK: MD −0.02, 95% CI −0.04 to 0.00; I2 = 0%; 3 studies, 92 participants; and one study of LASEK: MD −0.23, 95% CI −0.26 to −0.19; 1 study, 80 participants (Analysis 1.10). One study of LASIK that was reported only in an abstract estimated the difference to be MD −0.02, 95% CI −0.04 to 0.00; 1 study, 24 participants; however, the standard deviations (SDs) reported were very small for a study with so few participants, leading us to suspect that standard errors (SEs) had been calculated rather than SDs. If our suspicion is correct, it would explain the extreme weight given to the estimates from Anderson 2004. When we removed Anderson 2004, the effect estimate was: MD −0.04, 95% CI −0.15 to 0.06; I2 = 0%; 2 studies, 68 participants.
Six months:
Data were available for two studies of PRK. Due to substantial heterogeneity, we did not combine data in a meta‐analysis. While point estimates from Mastropasqua 2006 (MD −0.21, 95% CI −0.26 to −0.16) suggest a benefit for wavefront‐guided PRK relative to conventional PRK based on 56 eyes of 56 participants, the estimate from Karimian 2010 (MD 0.17, 95% CI 0.02 to 0.32) favors conventional PRK (56 eyes, 28 participants).
12 months:
No 12‐month data were available for this outcome. Heterogeneity was high in subsets of studies for this outcome, except for three‐month estimates from trials of LASIK and LASEK. The three‐month estimates of LASIK and LASEK tended to favor wavefront over conventional procedures.
Comparison 2. Wavefront‐optimized versus wavefront‐guided procedures
Proportion of eyes with UCVA of 20/20 or better
Six studies reported data on the proportion of eyes with UCVA of 20/20 or better at six or 12 months after refractive surgery (Bower 2015; Manche 2014; Manche 2013; Manche 2015; Roe 2019; Zhao 2015). At six months, overall estimates based on data from five studies suggest no evidence for a difference between wavefront‐optimized and wavefront‐guided procedures for eyes with UCVA of 20/20 or better: RR 1.00, 95% CI 0.98 to 1.02; I2 = 0%; 444 participants. Examining by subgroup, we found similar results in the PRK procedure: RR 0.94, 95% CI 0.87 to 1.02; 1 study, 104 participants; and for LASIK procedure: RR 1.00, 95% CI 0.98 to 1.02, I2 = 0%; 4 studies, 340 participants) (Analysis 2.1). At 12 months after refractive surgery, the results were no different, as overall estimates from five studies showed no evidence of effect in achieving UCVA of20/20 or better when comparing wavefront‐optimized procedure with wavefront‐guided procedure: RR 1.00, 95% CI 0.99 to 1.02; 5 studies, 618 participants. Results by subgroup also showed no evidence for a difference: studies of PRK: RR 1.02, 95% CI 0.98 to 1.06; I2 = 0%; 2 studies, 334 participants; and studies of LASIK: RR 1.00, 95% CI 0.98 to 1.02, I2 = 0%; 3 studies, 284 participants (Analysis 2.2). The certainty of evidence for this outcome at both six and 12 months and by subgroups was low. We downgraded for risk of bias and imprecision.
Proportion of eyes without loss of BSCVA
The same six studies above also examined the proportion of eyes without loss of BSCVA at six or 12 months after refractive surgery (Bower 2015; Manche 2014; Manche 2013; Manche 2015; Roe 2019; Zhao 2015). At six months, the effect estimates were as follows: overall: RR 0.99, 95% CI 0.94 to 1.04; I2 = 4%; 4 studies, 258 participants; for PRK procedure: RR 1.00, 95% CI 0.95 to 1.06; 1 study, 104 participants; and LASIK procedure: RR 0.96, 95% CI 0.85 to 1.08; I2 = 28%; 3 studies, 154 participants (Analysis 2.3). Data were also available for five studies at 12 months, with the following effect estimates: overall: RR 0.99, 95% CI 0.96 to 1.02; I2 = 0%; 5 studies, 622 participants; PRK procedure: RR 1.01, 95% CI 0.97 to 1.05; I2 = 0%; 2 studies, 334 participants; and LASIK procedure: RR 0.97, 95% CI 0.94 to 1.01; I2 = 0%; 3 studies, 288 participants (Analysis 2.4). Evidence at both six and 12 months after refractive surgery and for subgroups of participants in studies of PRK or LASIK suggest no difference between the wavefront‐optimized and corresponding wavefront‐guided procedures (PRK or LASIK) for eyes without loss of BSCVA. We graded the certainty of evidence for this outcome at both time points and by subgroup as low, after downgrading for risk of bias and imprecision.
Proportion of eyes within ± 0.5 diopters of target refraction
Data on the proportion of eyes within ± 0.5 diopters of target refraction six or 12 months after refractive surgery were available for four studies at six months (Bower 2015; Manche 2014; Manche 2013; Zhao 2015) and at 12 months (Bower 2015; Manche 2014; Manche 2013; Roe 2019). The effect estimates at six months were: overall: RR 0.93, 95% CI 0.87 to 1.00; I2 = 0%; 4 studies, 258 participants; PRK procedure: RR 0.94, 95% CI 0.86 to 1.03; 1 study, 104 participants; and LASIK procedure: RR 0.92, 95% CI 0.81 to 1.04; I2 = 8%; 3 studies, 154 participants (Analysis 2.5). For this outcome at 12 months, the overall effect estimate was: RR 1.02, 95% CI 0.95 to 1.09; I2 = 33%; 4 studies, 480 participants. Examining by subgroups, the estimates were: PRK procedure: RR 1.06, 95% CI 0.97 to 1.15; 1 study, 192 participants; and LASIK procedure: RR 0.97, 95% CI 0.86 to 1.11; I2 = 47%; 3 studies, 288 participants (Analysis 2.6). Therefore neither at six nor 12 at months after surgery was there any evidence for a difference betweenthewavefront‐optimized and wavefront‐guided procedures. The certainty of evidence was low. We downgraded for risk of bias and imprecision.
Mean refractive error, spherical equivalent
Data for this outcome at six months were available from four studies (Manche 2014; Manche 2013; Manche 2015; Roe 2019) and at 12 months from six studies (Bower 2015; Bower 2018; Manche 2014; Manche 2013; Manche 2015; Roe 2019). We did not calculate an overall effect estimate at six months, owing to statistical heterogeneity between subgroups (I2 = 69%). However, the estimated mean differences in refractive error by type of procedure were as follows: PRK: MD 0.09, 95% CI −0.02 to 0.20; 1 study, 138 participants; and for LASIK: MD −0.12, 95% CI −0.19 to −0.05; I2 = 0%; 3 studies, 280 participants ( Analysis 2.7). The certainty of evidence for this outcome was low for estimates from studies of PRK, after downgrading for risk of bias and imprecision, and moderate for LASIK procedures, downgrading for risk of bias.
Due to substantial statistical heterogeneity, we did not calculate an overall effect estimate at 12 months. While effect estimates from two studies suggest no evidence for a difference between wavefront‐optimized and wavefront‐guided PRK procedures at 12 months (MD 0.07, 95% CI −0.03 to 0.18; I2 = 50%; 334 participants; low certainty of evidence), data from four studies of LASIK suggest a probable benefit in favor of wavefront‐optimized LASIK: MD −0.14, 95% CI −0.19 to −0.09; I2 = 0%; 472 participants (Analysis 2.8). The certainty of evidence was moderate. We downgraded only for risk of bias.
Higher‐order aberrations (HOAs) post‐treatment
Mean HOAs post‐surgery were reported in five studies at one month (Brint 2005; Manche 2014; Manche 2015; Miraftab 2011; Roe 2019), in seven studies at three months (Brint 2005; Manche 2014; Manche 2015; Miraftab 2011; Moshirfar 2011a; Moshirfar 2011b; Roe 2019), in five studies at six months (Manche 2014; Manche 2013; Manche 2015; Roe 2019; Zhao 2015) and in five studies at 12 months (Bower 2015; Manche 2014; Manche 2013; Manche 2015; Roe 2019).
We estimated mean HOAs from meta‐analysis of findings from these studies by post‐surgery times.
One month:
We did not calculate overall effect estimates due to substantial statistical heterogeneity from four studies of LASIK (I2 = 92%).The effect estimate for PRK procedure was: MD 0.03, 95% CI −0.03 to 0.09; 1 study, 140 participants) (Analysis 2.9). For studies of LASIK (4 studies, 326 participants), point estimates from three of the four studies showed no difference between the two groups. The estimate in Brint 2005 differs in direction from those of the other three estimates and suggests a benefit for this outcome in favor of wavefront‐guided procedure. Brint 2005 enrolled both eyes of participants, but reported insufficient methodologic details to explain the discrepancy observed. Excluding Brint 2005 eliminated the substantial statistical heterogeneity among the studies of LASIK (I2 = 92%). Estimates from the remaining three studies of LASIK showed no evidence of benefit: MD 0.03, 95% CI −0.01 to 0.07; I2 = 0%; 3 studies, 296 participants (Analysis 2.9). The effect estimates by each type of procedure (PRK or LASIK) suggest no evidence for a difference in HOAs at one month. We graded the certainty of evidence as very low, downgrading for risk of bias, inconsistency and imprecision.
Three months:
We calculated no overall estimates due to substantial statistical heterogeneity among five studies of LASIK.
Estimates from studies of PRK (MD 0.06, 95% CI 0.01 to 0.11; I2 = 0%; 2 studies, 182 participants) (Analysis 2.10), support a small but clinically insignificant benefit for wavefront‐guided PRK, with low certainty of evidence. We downgraded for risk of bias and imprecision.
As with the estimates at one month, by excluding Brint 2005, which was responsible for the substantial statistical heterogeneity observed among the studies of LASIK (I2 = 93%), the estimates from the remaining four studies of LASIK showed no evidence of benefit: MD −0.01, 95% CI −0.06 to 0.04; I2 = 41%; 4 studies, 318 participants) (Analysis 2.10). We graded the certainty of evidence as very low, downgraded for risk of bias, inconsistency and imprecision.
Six months:
We calculated effect estimates of HOAs at six months as follows: overall: MD 0.03, 95% CI 0.00 to 0.06; I2 = 0%; 5 studies, 478 participants; for PRK: MD 0.06, 95% CI −0.01 to 0.13; 1 study, 138 participants; and for LASIK: MD 0.03, 95% CI −0.01 to 0.06; I2 = 0%; 4 studies, 340 participants) (Analysis 2.11).
12 months:
At 12 months, the effect estimates are: overall: MD 0.03, 95% CI −0.01 to 0.07; I2 = 41%; 5 studies, 622 participants; for PRK procedure: MD 0.02, 95% CI −0.08 to 0.13; I2 = 82%; 2 studies, 334 participants; and for LASIK: MD 0.03, 95% CI −0.01 to 0.06; I2 = 0%; 4 studies, 288 participants (Analysis 2.12).
We graded the certainty of evidence for this outcome at six and 12 months, overall and by subgroup, as low, downgrading for risk of bias and imprecision.
Comparison 3. Wavefront‐guided LASIK versus wavefront‐guided PRK
Only one study (Manche 2011) examined this comparison and reported 1‐, 3‐, 6‐ or 12‐month data for the outcomes of interest.
Proportion of eyes with UCVA of 20/20 or better
Point estimates at six months and 12 months were the same: RR 1.03, 95% CI 0.93 to 1.15; 66 participants) and provided no evidence for a difference between wavefront‐guided LASIK and wavefront‐guided PRK for eyes with UCVA of 20/20 or better (Analysis 3.1).
Proportion of eyes without loss of BSCVA
Manche 2011 did not report data for this outcome at six months. The effect estimate at 12 months after surgery suggested no any difference between wavefront‐guided LASIK and PRK for eyes without loss of BSCVA: RR 1.03, 95% CI 0.93 to 1.15; 66 participants, or preserving pre‐surgery BSCVA (Analysis 3.2).
Proportion of eyes within ± 0.5 diopters of target refraction
Point estimates for this outcome at six months (RR 1.00, 95% CI 0.92 to 1.09; 66 participants) and at 12 months (RR 0.97, 95% CI 0.82 to 1.14; 66 participants) indicate no evidence for a difference between the two wavefront‐guided procedures for achieving post‐operative refractive errors within ± 0.5 diopters of target refraction (Analysis 3.3).
Mean refractive error, spherical equivalent
Neither at six months (MD 0.00, 95% CI −0.13 to 0.13; 66 participants) nor at 12 months (MD 0.01, 95% CI −0.18 to 0.20; 66 participants) do the effect estimates suggest any evidence for a difference betweenwavefront‐guided LASIK and wavefront‐guided PRK in mean refractive error after surgery (Analysis 3.4).
Higher order aberrations (HOAs) post‐treatment
Point estimates for mean HOAs based on data for 66 participants consistently show no evidence for a difference between wavefront‐guided LASIK and wavefront‐guided PRK: one month post‐surgery: MD −0.06, 95% CI −0.15 to 0.03; at three months: MD 0.00, 95% CI −0.07 to 0.07; at six months: MD 0.02, 95% CI −0.05 to 0.09; and at 12 months: MD −0.01, 95% CI −0.09 to 0.07) after refractive surgery (Analysis 3.5).
The certainty of evidence for all the outcomes examined when wavefront‐guided LASIK was compared with wavefront‐guided PRK was very low, owing to risk of bias and serious imprecision.
Adverse events/effects
Only one study reported information on eyes that lost more than two lines of BSCVA in either group (Manche 2013). The investigators only reported that "the frequencies with which the groups maintained their preoperative corrected distance visual acuity (CDVA), lost 1 or 2 or more lines, or gained 1 or 2 or more lines after undergoing LASIK were not statistically different from each other (all P>0.05)"
In Bower 2015, dry eye was the most common complication after each type of treatment, with no difference in frequency between wavefront‐optimized and wavefront‐guided PRK at six (P = 0.58) or at 12 months (P = 0.17) after surgery. Investigators observed delayed epithelial healing and early corneal haze in both intervention groups. “Clinically significant haze (grade ≥2) was observed in 7 (6.5%) participants in the wavefront‐guided eyes and in 3 (2.9%) wavefront‐optimized eyes at 1 month and in 1 (1.1%) wavefront‐guided eye versus 3 (3.3%) wavefront‐optimized eyes at 3 months postoperatively”. All participants with clinically significant haze were treated with topical steroids and required no mechanical debridement or phototherapeutic keratectomy.
In Lee 2006, investigators reported that both wavefront‐guided and conventional LASIK had similar preoperative subjective visual symptom scores (P = 0.48), all graded as 0 or 1, with visual symptom scores higher for both groups postoperatively. The mean subjective symptom score was highest at one month postoperatively and decreased over six months. Glare score of > 3 was recorded in 12 (15.4%) conventional LASIK eyes compared to only seven (8.6%) wavefront‐guided LASIK eyes at six months postoperatively (P = 0.012). Participants reported that glare or halo interfered with their daily living.
Manche 2011 reported "no incidence of corneal haze in the wavefront‐guided PRK group compared to the wavefront‐guided LASIK. No eyes were re‐treated within the first 12 months." Manche 2014 reported "no difference between the wavefront‐optimized and wavefront‐guided LASIK groups for subjective parameters such as day and night clarity".
In Manche 2015, investigators reported that at 12 months "participants in the wavefront‐optimized PRK group had fewer problems with clarity during the day (P = .035) and at night (0.040) with fewer visual symptoms (P = .039)".
Mifflin 2012 reported no complications in either the wavefront‐guided or conventional PRK group; safety (gain or loss of corrected distance visual acuity) was similar between groups.
Moshirfar 2011b, reported that "one eye in the wavefront‐optimized LASIK group gained two lines, and one eye lost one line of corrected distance visual acuity in each group". “In the wavefront‐optimized LASIK group, the loss of vision was from residual astigmatism due to a central island. In the wavefront‐guided LASIK group, the loss was due to irregular corneal epithelium secondary to superficial punctate keratopathy. Investigators reported that no other eye in the study population lost any lines of corrected distance visual acuity".
Yu 2008a reported that most of the symptoms were often “mild,” and did not differ between the wavefront‐guided and conventional LASIK groups.
Subgroup analysis
We had planned to perform subgroup analysis according to ranges of myopia: low to moderate myopia (< −0.50 to −6.00 D) and moderate to high myopia (< −6.00 to −15.00 D). We did not undertake this analysis due to insufficient data. However, we performed subgroup analysis by further stratifying data according to the method for creating corneal flap (PRK or LASIK). The test for subgroup differences indicated no statistically significant subgroup effect (data not shown), suggesting that with neither PRK nor LASIK is a wavefront procedure superior to the corresponding conventional procedure, nor are wavefront‐optimized procedures superior to wavefront‐guided procedures for the outcomes assessed in this review.
Sensitivity analysis
We assessed the impact of excluding studies with inconsistent direct estimates of effects (Brint 2005) compared to other studies or studies conducted among participants with hyperopia (Durrie 2010; Manche 2014) on the effect estimates for which these studies contributed data. We found no impact of excluding the latter two studies on the effect estimates (data not shown).
Three studies (Brint 2005; Lee 2018; Roe 2019) were industry‐funded. We did not include Brint 2005 in the meta‐analysis because it appeared to be responsible for considerable heterogeneity. Lee 2018 did not contribute data to the effect estimates. Roe 2019 was the only industry‐funded study that contributed data for the comparison between wavefront‐optimized and wavefront‐guided procedures, and provided data for the following outcomes at six and at 12 months: UCVA of 20/20, eyes within ± 0.50 D of target refraction, mean refractive error expressed as mean spherical and BSCVA at 12 months. Roe 2019 also provided data for mean HOAs at 1, 3, 6 and at 12 months. Excluding Roe 2019 from the analysis produced no change in the effect for any of these outcomes (data not shown).
Post hoc, we had also planned to assess the impact of restricting the analysis to studies that analyzed data at the participant level. However, only three studies took this approach (Durrie 2010; Mastropasqua 2006; Qiu 2007). Of the remaining 30 studies, in which both eyes of each participant were randomized to the same intervention group or two eyes of participants are in different intervention groups, only one study reported having accounted for non‐independence in their analysis (Mifflin 2012). No sensitivity analysis based on design was therefore possible.
Discussion
Summary of main results
We identified 33 randomized controlled trials (RCTs) that had enrolled 1499 participants (2797 eyes) aged 18 years and older, with refractive errors ranging from high myopia to low hyperopia, who underwent wavefront modified or conventional excimer laser (PRK, LASIK or LASEK) refractive surgery. Our findings from analyses of the available evidence for outcomes examined at 12 months are shown in the summary of findings Table 1, summary of findings Table 2, and summary of findings Table 3 for the main comparisons. Evidence for six‐month outcomes are shown in additional Table 1, Table 2, and Table 3.
| Wavefront compared to conventional procedure for adults with refractive errors | ||||||
| Participant or population: Adults with refractive errors | ||||||
| Outcomes | Anticipated absolute effects* (95% CI) | Relative effect | № of participants | Certainty of the evidence | Comments | |
|---|---|---|---|---|---|---|
| Risk with Conventional procedure | Risk with Wavefront | |||||
| Proportion of eyes with uncorrected visual acuity (UCVA) of 20/20 or better post‐treatment: 6 months ‐ overall estimate | 831 per 1000 | 831 per 1000 | RR 1.00 | 470 | ⊕⊕⊝⊝ | ‐ |
| Proportion of eyes that had lost 1 or more lines of best spectacle‐corrected visual acuity (BSCVA) post‐treatment: 6 months ‐ overall estimate | 200 per 1000 | 216 per 1000 | RR 1.04 | 151 | ⊕⊕⊝⊝ | ‐ |
| Proportion of eyes within ± 0.50 diopters (D) of target refraction: 6 months ‐ Procedure PRK | 917 per 1000 | 816 per 1000 | RR 0.89 | 192 | ⊕⊝⊝⊝ | ‐ |
| Proportion of eyes within ± 0.50 diopters (D) of target refraction: 6 months ‐ Procedure LASIK | 900 per 1000 | 999 per 1000 | RR 1.11 | 20 | ⊕⊝⊝⊝ | ‐ |
| Mean refractive error expressed as mean spherical equivalent post‐treatment: 6 months ‐ Procedure PRK | The mean refractive error expressed as mean spherical equivalent post‐treatment: 6 months ‐ Procedure PRK was 0 | MD 0.06 higher | ‐ | 196 | ⊕⊝⊝⊝ | ‐ |
| Mean refractive error expressed as mean spherical equivalent post‐treatment: 6 months ‐ Procedure LASIK | The mean refractive error expressed as mean spherical equivalent post‐treatment: 6 months ‐ Procedure LASIK was 0 | MD 0.11 higher | ‐ | 428 | ⊕⊝⊝⊝ | ‐ |
| Mean higher‐order aberrations (HOAs) post‐treatment, measured by machine with wavefront sensor: PRK procedure: 6 months | see comment | see comment | ‐ | 116 | ⊕⊝⊝⊝ | Two studies reported data on PRK. Due to substantial heterogeneity, we did not combine data in a meta‐analysis. Point estimates from Mastropasqua 2006 (MD = −0.21, 95% CI −0.26 to −0.16) suggest benefit in favor of wavefront‐guided PRK relative to conventional PRK (56 eyes of 56 participants). Estimates from Karimian 2010 (MD 0.17, 95% CI 0.02 to 0.32) favors conventional PRK (56 eyes, 28 participants). There were no data on LASIK for this outcome at 6 months |
| *The risk in the intervention group (and its 95% confidence interval) is based on the assumed risk in the comparison group and the relative effect of the intervention (and its 95% CI). | ||||||
| GRADE Working Group grades of evidence | ||||||
aDowngraded for risk of bias.
bDowngraded for imprecision.
cDowngraded for inconsistency.
| Wavefront‐optimized compared to wavefront‐guided for adults with refractive errors | ||||||
| Participant or population: Adults with refractive errors | ||||||
| Outcomes | Anticipated absolute effects* (95% CI) | Relative effect | № of participants | Certainty of the evidence | Comments | |
|---|---|---|---|---|---|---|
| Risk with Wavefront‐guided | Risk with Wavefront‐optimized | |||||
| Proportion of eyes with uncorrected visual acuity (UCVA) of 20/20 or better post‐treatment: 6 months | 982 per 1000 | 982 per 1000 | RR 1.00 | 444 | ⊕⊕⊝⊝ | ‐ |
| Proportion of eyes that had lost 1 or more lines of best spectacle‐corrected visual acuity (BSCVA) post‐treatment: 6 months | 54 per 1000 | 54 per 1000 | RR 0.99 | 258 | ⊕⊕⊝⊝ | ‐ |
| Proportion of eyes within ± 0.50 diopters (D) of target refraction post‐treatment: 6 months | 938 per 1000 | 872 per 1000 | RR 0.93 | 258 | ⊕⊕⊝⊝ | ‐ |
| Mean refractive error expressed as mean spherical equivalent post‐treatment: 6 months. ‐ Procedure PRK | The mean refractive error expressed as mean spherical equivalent post‐treatment: 6 months. ‐ Procedure PRK was 0 | MD 0.09 higher | ‐ | 138 | ⊕⊕⊕⊝ | ‐ |
| Mean refractive error expressed as mean spherical equivalent post‐treatment: 6 months. ‐ Procedure LASIK | The mean refractive error expressed as mean spherical equivalent post‐treatment: 6 months. ‐ Procedure LASIK was 0 | MD 0.12 lower | ‐ | 280 | ⊕⊕⊕⊝ | ‐ |
| Mean higher‐order aberrations (HOAs) post‐treatment, measured by machine with wavefront sensor: 6 months | The mean HOAs post‐treatment, measured by machine with wavefront sensor: 6 months was 0 | MD 0.03 higher | ‐ | 478 | ⊕⊕⊝⊝ | ‐ |
| Proportion of eyes with significant visual loss (loss of 2 or more lines from pretreatment BSCVA) and proportion of eyes with optical side effects, such as glare and halo: 6 months | see comment | ‐ | ‐ | ‐ | ‐ | These two outcomes were not reported |
| *The risk in the intervention group (and its 95% confidence interval) is based on the assumed risk in the comparison group and the relative effect of the intervention (and its 95% CI). | ||||||
| GRADE Working Group grades of evidence | ||||||
aDowngraded for risk of bias.
bDowngraded for imprecision.
| Wavefront‐guided LASIK compared to wavefront‐guided PRK for adults with refractive errors | ||||||
| Participant or population: Adults with refractive errors | ||||||
| Outcomes | Anticipated absolute effects* (95% CI) | Relative effect | № of participants | Certainty of the evidence | Comments | |
|---|---|---|---|---|---|---|
| Risk with Wavefront‐guided PRK | Risk with Wavefront‐guided LASIK | |||||
| Proportion of eyes with uncorrected visual acuity (UCVA) of 20/20 or better post‐treatment. ‐ 6 months | 939 per 1000 | 968 per 1000 | RR 1.03 | 66 | ⊕⊝⊝⊝ | ‐ |
| Proportion of eyes within ± 0.50 diopters (D) of target refraction post‐treatment. ‐ 6 months | 970 per 1000 | 970 per 1000 | RR 1.00 | 66 | ⊕⊝⊝⊝ | ‐ |
| Mean refractive error expressed as mean spherical equivalent post‐treatment. ‐ 6 months | The mean refractive error expressed as mean spherical equivalent post‐treatment. ‐ 6 months was 0 | MD 0 | ‐ | 66 | ⊕⊝⊝⊝ | ‐ |
| Mean higher‐order aberrations (HOAs) post‐treatment, measured by machine with wavefront sensor ‐ 6 months | The mean higher‐order aberrations (HOAs) post‐treatment, measured by machine with wavefront sensor ‐ 6 months was 0 | MD 0.02 higher | ‐ | 66 | ⊕⊝⊝⊝ | ‐ |
| Proportion of eyes that had lost 1 or more lines of best spectacle‐corrected visual acuity (BSCVA) posttreatment. ‐ 6 months | see comment | ‐ | ‐ | ‐ | ‐ | This outcome was not reported |
| Proportion of eyes with significant visual loss (loss of 2 or more lines from pretreatment BSCVA): 6 months | see comment | ‐ | ‐ | ‐ | ‐ | This outcome was not reported |
| Proportion of eyes with optical side effects, such as glare and halo: 6 months | see comment | ‐ | ‐ | ‐ | ‐ | This outcome was not reported |
| *The risk in the intervention group (and its 95% confidence interval) is based on the assumed risk in the comparison group and the relative effect of the intervention (and its 95% CI). | ||||||
| GRADE Working Group grades of evidence | ||||||
aDowngraded for risk of bias.
bDowngraded for very serious imprecision (‐2).
There was no evidence of a difference in the primary visual acuity outcomes including proportion of eyes with uncorrected visual acuity (UCVA) of 20/20 or better or the proportion of eyes without loss of one or more lines of best spectacle‐corrected visual acuity (BSCVA) at six and 12 months post‐treatment when wavefront refractive surgery procedures were compared with the corresponding conventional procedure or when wavefront‐optimized was compared with wavefront‐guided procedures. We also found no evidence of a difference in the proportion of eyes within ± 0.50 D of target refraction or mean refractive error at six and 12 months post‐treatment.
However, the available evidence suggests that wavefront‐modified PRK, LASIK or LASEK, compared to their conventional counterparts, may lead to improvement in higher‐order aberrations (HOAs) at one and three months after refractive surgery but not at six or 12 months. In addition, evidence supports probable improvement in mean refractive error (spherical equivalent) in favor of wavefront‐optimized LASIK compared to wavefront‐guided LASIK at both six and 12 months after refractive surgery. There is no evidence that the comparison between wavefront‐optimized PRK or LASIK or the corresponding wavefront‐guided PRK or LASIK had any effect on higher‐order aberrations (HOAs) at any of the time points for which we found data.
Information on adverse effects were infrequently reported from individual studies. Only one study reported information on eyes that had lost more than two lines of BSCVA; the investigators concluded that there were no differences between groups. For studies that reported optical side effects such as glare and halo, investigators found no evidence for a difference between groups. The safety of these procedures therefore appears to be comparable. Overall, wavefront or conventional (PRK or LASIK) refractive surgery procedures showed comparable effectiveness for the treatment of refractive errors in adults. Some statistically significant differences, such as mean refractive error and HOAs, were small and clinically unimportant, and were inconsistent at different time points.
Overall completeness and applicability of evidence
We included only RCTs in this review. The studies varied in a number of characteristics. Although the studies had enrolled participants with refractive errors ranging from low hyperopia to high myopia, most of them were conducted among participants with low to moderate myopia. Only two studies included participants with low hyperopia and another two included participants with mean refractive errors at values consistent with high myopia. Findings from this review are therefore most applicable to people with low to moderate myopia, and should be applied with caution to people with high myopia or with moderate or high hyperopia. Primary studies were mostly conducted in the USA, Europe and Asia; most of the participants were women. Investigators typically had excluded candidates for refractive surgery who had other ocular pathologies or systemic comorbidities. Hence the evidence from this review may not be applicable to all men and to people of non‐European and non‐Asian ancestry.
Quality of the evidence
We elected to include outcome data only from RCTs. Potentially includable studies were reviewed by at least two review authors according to Cochrane's established methods. The quality of reporting on methods used in individual trials was almost uniformly poor, with most factors evaluated for potential risk of bias not mentioned in reports from most trials. Such incomplete reporting indicates a failure to comply with CONSORT guidelines (Altman 2012). No trial report included a CONSORT diagram, whether due to the preference of the authors of the trial reports or to editorial policy. Certainty of evidence for the outcomes assessed was mostly low to very low, owing to risks of bias, inconsistency and imprecision. For most studies, the method of random sequence generation or method of concealing treatment allocation was not reported. Risks of performance, detection, attrition bias and selective outcome reporting were unclear for most studies. Wide confidence intervals for effect estimates were a limitation on the quality of the evidence and warranted a further downgrade of the certainty of evidence for imprecision.
Potential biases in the review process
For this review, we followed standard Cochrane review methods. We performed a comprehensive search of electronic bibliographic databases for studies, without imposing publication date or language restrictions, and also searched references and citations for studies potentially not identified by our search strategies to minimize the potential for bias in study selection. We did not include non‐randomized studies due to high risk of bias. Among studies that used a paired‐eye design or that assigned the same intervention to both eyes, none of them reported having corrected the analysis for correlations of outcomes between the two eyes of the same participant. Failure to account for correlation between eyes may lead to incorrect estimation of an intervention effect with a false increase in precision (Murdoch 1998). The precision of the effect estimates as represented by the confidence intervals is therefore uncertain. We found a few controlled clinical trials (CCTs) in our searches. These had used alternation, record numbers, and other means of assigning intervention. Authors of updates may wish to include CCTs in separate or combined analyses. Most included studies were small; six of the 33 enrolled fewer than 20 eyes per study group. Sometimes even the larger trials had insufficient power to rule out clinically meaningful differences between groups for the outcomes compared. We sought information about financial support of studies as a potential source of bias. Investigators of most studies did not report any source of funding. Two studies were US government‐funded; three studies were funded by manufacturers of one of the devices under investigation, and some study investigators had financial relationships with industry sponsors that marketed study devices.
Agreements and disagreements with other studies or reviews
The findings of this review are consistent with previous reviews. Although wavefront‐optimized or ‐guided refractive surgery have had technological improvements compared with conventional refractive surgery, wavefront‐modified ablation profiles have not demonstrated superiority in terms of uncorrected visual acuity, visual loss and residual refractive errors (Fares 2011; Feng 2011; Kobashi 2014; Smadja 2012). Some authors have concluded that wavefront‐guided LASIK is superior for treating highly aberrant corneas relative to other modalities (Feng 2011; Manche 2018). We also found in this review that wavefront‐guided LASIK achieved smaller HOAs compared with conventional LASIK, although not consistently over time. Consistent with a previous review (Kim 2008), we also found that compared to conventional treatments, wavefront‐modified ablation achieved smaller HOAs after surgery
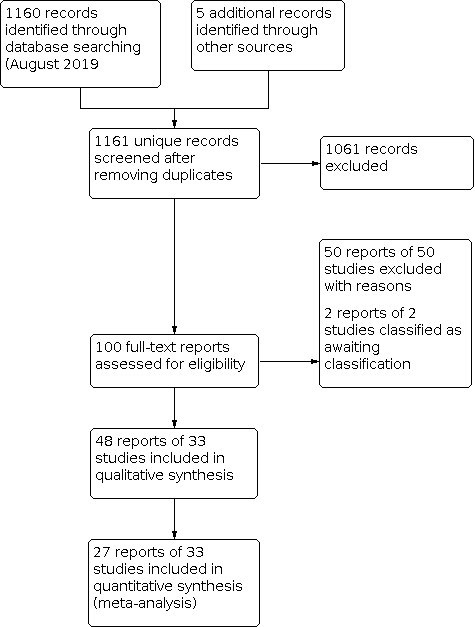
Study flow diagram.

Risk of bias summary: review authors' judgements about each risk of bias item for each included study.

Risk of bias graph: review authors' judgements about each risk of bias item presented as percentages across all included studies.

Forest plot of comparison: 1 Wavefront vs Conventional procedure, outcome: 1.1 Proportion of eyes with uncorrected visual acuity (UCVA) of 20/20 or better post‐treatment: 6 months.

Forest plot of comparison: 1 Wavefront vs Conventional procedure, outcome: 1.5 Proportion of eyes within ± 0.50 diopters (D) of target refraction: 6 months.

Forest plot of comparison: 1 Wavefront vs Conventional procedure, outcome: 1.7 Mean refractive error expressed as mean spherical equivalent post‐treatment: 6 months.

Comparison 1: Wavefront vs Conventional procedure, Outcome 1: Proportion of eyes with uncorrected visual acuity (UCVA) of 20/20 or better post‐treatment: 6 months

Comparison 1: Wavefront vs Conventional procedure, Outcome 2: Proportion of eyes with uncorrected visual acuity (UCVA) of 20/20 or better post‐treatment:12 months

Comparison 1: Wavefront vs Conventional procedure, Outcome 3: Proportion of eyes that had lost 1 or more lines of best spectacle‐corrected visual acuity (BSCVA) posttreatment: 6 months

Comparison 1: Wavefront vs Conventional procedure, Outcome 4: Proportion of eyes without loss of 1 or more lines of best spectacle‐corrected visual acuity (BSCVA) posttreatment:12 months

Comparison 1: Wavefront vs Conventional procedure, Outcome 5: Proportion of eyes within ± 0.50 diopters (D) of target refraction: 6 months

Comparison 1: Wavefront vs Conventional procedure, Outcome 6: Proportion of eyes within ± 0.50 diopters (D) of target refraction: 12 months

Comparison 1: Wavefront vs Conventional procedure, Outcome 7: Mean refractive error expressed as mean spherical equivalent post‐treatment: 6 months

Comparison 1: Wavefront vs Conventional procedure, Outcome 8: Mean refractive error expressed as mean spherical equivalent post‐treatment:12 months

Comparison 1: Wavefront vs Conventional procedure, Outcome 9: Mean higher‐order aberrations (HOAs) microns post‐treatment, measured by machine with wavefront sensor: 1 month

Comparison 1: Wavefront vs Conventional procedure, Outcome 10: Mean higher‐order aberrations (HOAs) microns post‐treatment, measured by machine with wavefront sensor: 3 months

Comparison 1: Wavefront vs Conventional procedure, Outcome 11: Mean higher‐order aberrations (HOAs) microns post‐treatment, measured by machine with wavefront sensor: 6 months

Comparison 2: Wavefront‐optimized vs Wavefront‐guided, Outcome 1: Proportion of eyes with uncorrected visual acuity (UCVA) of 20/20 or better post‐treatment: 6 months

Comparison 2: Wavefront‐optimized vs Wavefront‐guided, Outcome 2: Proportion of eyes with uncorrected visual acuity (UCVA) of 20/20 or better post‐treatment:12 months

Comparison 2: Wavefront‐optimized vs Wavefront‐guided, Outcome 3: Proportion of eyes without loss of 1 or more lines of best spectacle‐corrected visual acuity (BSCVA) posttreatment: 6 months

Comparison 2: Wavefront‐optimized vs Wavefront‐guided, Outcome 4: Proportion of eyes without loss of 1 or more lines of best spectacle‐corrected visual acuity (BSCVA) posttreatment:12 months.

Comparison 2: Wavefront‐optimized vs Wavefront‐guided, Outcome 5: Proportion of eyes within ± 0.50 diopters (D) of target refraction post‐treatment: 6 months

Comparison 2: Wavefront‐optimized vs Wavefront‐guided, Outcome 6: Proportion of eyes within ± 0.50 diopters (D) of target refraction post‐treatment:12 months

Comparison 2: Wavefront‐optimized vs Wavefront‐guided, Outcome 7: Mean refractive error expressed as mean spherical equivalent post‐treatment: 6 months.

Comparison 2: Wavefront‐optimized vs Wavefront‐guided, Outcome 8: Mean refractive error expressed as mean spherical equivalent post‐treatment:12 months

Comparison 2: Wavefront‐optimized vs Wavefront‐guided, Outcome 9: Mean higher‐order aberrations (HOAs) microns post‐treatment, measured by machine with wavefront sensor: 1 month

Comparison 2: Wavefront‐optimized vs Wavefront‐guided, Outcome 10: Mean higher‐order aberrations (HOAs) microns post‐treatment, measured by machine with wavefront sensor: 3 months

Comparison 2: Wavefront‐optimized vs Wavefront‐guided, Outcome 11: Mean higher‐order aberrations (HOAs) microns post‐treatment, measured by machine with wavefront sensor: 6 months

Comparison 2: Wavefront‐optimized vs Wavefront‐guided, Outcome 12: Mean higher‐order aberrations (HOAs) microns post‐treatment, measured by machine with wavefront sensor: 12 months

Comparison 3: Wavefront‐guided LASIK vs Wavefront‐guided PRK, Outcome 1: Proportion of eyes with uncorrected visual acuity (UCVA) of 20/20 or better post‐treatment.

Comparison 3: Wavefront‐guided LASIK vs Wavefront‐guided PRK, Outcome 2: Proportion of eyes without loss of 1 or more lines of best spectacle‐corrected visual acuity (BSCVA) posttreatment.

Comparison 3: Wavefront‐guided LASIK vs Wavefront‐guided PRK, Outcome 3: Proportion of eyes within ± 0.50 diopters (D) of target refraction post‐treatment.

Comparison 3: Wavefront‐guided LASIK vs Wavefront‐guided PRK, Outcome 4: Mean refractive error expressed as mean spherical equivalent post‐treatment.

Comparison 3: Wavefront‐guided LASIK vs Wavefront‐guided PRK, Outcome 5: Mean higher‐order aberrations (HOAs) microns post‐treatment, measured by machine with wavefront sensor
| Wavefront procedures compared to conventional procedures for adults with refractive errors | ||||||
| Participant or population: Adults with refractive errors | ||||||
| Outcomes | Anticipated absolute effects* (95% CI) | Relative effect | № of participants | Certainty of the evidence | Comments | |
|---|---|---|---|---|---|---|
| Risk with conventional procedure | Risk with wavefront | |||||
| Proportion of eyes with uncorrected visual acuity (UCVA) of 20/20 or better post‐treatment:12 months ‐ Procedure: PRK | 86 per 100 | 88 per 100 | RR 1.03 | 70 | ⊕⊕⊝⊝ | ‐ |
| Proportion of eyes with uncorrected visual acuity (UCVA) of 20/20 or better post‐treatment:12 months ‐ Procedure: LASIK | see comment | ‐ | ‐ | ‐ | ‐ | There are no data on LASIK for this outcome at 12 months |
| Proportion of eyes that had lost 1 or more lines of best spectacle‐corrected visual acuity (BSCVA) posttreatment:12 months ‐ Procedure PRK | 6 per 100 | 5 per 100 | RR 0.94 | 70 | ⊕⊕⊝⊝ | ‐ |
| Proportion of eyes within ± 0.50 diopters (D) of target refraction: 12 months ‐ Procedure PRK | 86 per 100 | 88 per 100 | RR 1.03 | 70 | ⊕⊕⊝⊝ | ‐ |
| Proportion of eyes within ± 0.50 diopters (D) of target refraction: 12 months ‐ Procedure LASIK | see comment | ‐ | ‐ | ‐ | ‐ | There are no data on LASIK for this outcome at 12 months |
| Mean refractive error expressed as mean spherical equivalent post‐treatment:12 months ‐ Procedure PRK | The mean refractive error expressed as mean spherical equivalent post‐treatment:12 months ‐ Procedure PRK was ‐0.114 | MD 0.04 higher | ‐ | 70 | ⊕⊝⊝⊝ | ‐ |
| Proportion of eyes that had lost 1 or more lines of best spectacle‐corrected visual acuity (BSCVA) posttreatment‐procedure LASIK; Mean higher‐order aberrations (HOAs) post‐treatment, measured by machine with wavefront sensor; proportion of eyes with significant visual loss (loss of 2 or more lines from pretreatment BSCVA); proportion of eyes with optical side effects, such as glare and halo:12 months | see comment | ‐ | ‐ | ‐ | ‐ | There was no data on these outcomes at 12 months |
| *The risk in the intervention group (and its 95% confidence interval) is based on the assumed risk in the comparison group and the relative effect of the intervention (and its 95% CI). | ||||||
| GRADE Working Group grades of evidence | ||||||
| aDowngraded forImprecision. | ||||||
| Wavefront‐optimized procedures compared to wavefront‐guided procedures for adults with refractive errors | ||||||
| Participant or population: Adults with refractive errors | ||||||
| Outcomes | Anticipated absolute effects* (95% CI) | Relative effect | № of participants | Certainty of the evidence | Comments | |
|---|---|---|---|---|---|---|
| Risk with Any wavefront‐guided procedure | Risk with Any wavefront‐optimized | |||||
| Proportion of eyes with uncorrected visual acuity (UCVA) of 20/20 or better post‐treatment:12 months ‐ overall estimate | 97 per 100 | 97 per 100 | RR 1.00 | 618 | ⊕⊕⊝⊝ | ‐ |
| Proportion of eyes that had lost 1 or more lines of best spectacle‐corrected visual acuity (BSCVA) post‐treatment:12 months ‐ overall estimate | 5 per 100 | 5 per 100 | RR 0.99 | 622 | ⊕⊕⊝⊝ | ‐ |
| Proportion of eyes within ± 0.50 diopters (D) of target refraction post‐treatment:12 months ‐ overall estimate | 91 per 100 | 93 per 100 | RR 1.02 | 480 | ⊕⊕⊝⊝ | ‐ |
| Mean refractive error expressed as mean spherical equivalent post‐treatment:12 months ‐ Procedure PRK | The mean refractive error expressed as mean spherical equivalent post‐treatment:12 months ‐ Procedure PRK was −0.21 spherical equivalent | MD 0.07 spherical equivalent higher | ‐ | 334 | ⊕⊕⊝⊝ | ‐ |
| Mean refractive error expressed as mean spherical equivalent post‐treatment:12 months ‐ Procedure LASIK | The mean refractive error expressed as mean spherical equivalent post‐treatment:12 months ‐ Procedure LASIK ranged from 0.26 spherical equivalent | MD 0.14 spherical equivalent lower | ‐ | 472 | ⊕⊕⊝⊝ | ‐ |
| Mean higher‐order aberrations (HOAs) post‐treatment, measured by machine with wavefront sensor: 12 months ‐ overall estimate | The mean higher‐order aberrations (HOAs) post‐treatment, measured by machine with wavefront sensor: 12 months was 0.26 | MD 0.03 higher | ‐ | 622 | ⊕⊕⊝⊝ | ‐ |
| Proportion of eyes with significant visual loss (loss of 2 or more lines from pretreatment BSCVA): 12 months | see comment | ‐ | ‐ | ‐ | ‐ | One study that compared wavefront‐optimized LASIK versus wavefront‐guided LASIK reported on loss of 2 or more lines from pretreatment BSCVA that had not returned to baseline by 12 to 24 months after treatment (Manche 2013). Proportion of eyes with optical side effects, such as glare and halo |
| *The risk in the intervention group (and its 95% confidence interval) is based on the assumed risk in the comparison group and the relative effect of the intervention (and its 95% CI). | ||||||
| GRADE Working Group grades of evidence | ||||||
| aDowngraded for risk of bias. bDowngraded for imprecision. cDowngraded for inconsistency. | ||||||
| Wavefront‐guided LASIK compared to wavefront‐guided PRK for adults with refractive errors | ||||||
| Participant or population: Adults with refractive errors | ||||||
| Outcomes | Anticipated absolute effects* (95% CI) | Relative effect | № of participants | Certainty of the evidence | Comments | |
|---|---|---|---|---|---|---|
| Risk with wavefront‐guided PRK | Risk with wavefront‐guided LASIK | |||||
| Proportion of eyes with uncorrected visual acuity (UCVA) of 20/20 or better post‐treatment. ‐ 12 months | 94 per 100 | 97 per 100 | RR 1.03 | 66 | ⊕⊝⊝⊝ | ‐ |
| Proportion of eyes that had lost 1 or more lines of best spectacle‐corrected visual acuity (BSCVA) posttreatment. ‐ 12 months | 6 per 100 | 6 per 100 | RR 1.03 | 66 | ⊕⊝⊝⊝ | ‐ |
| Proportion of eyes within ± 0.50 diopters (D) of target refraction post‐treatment. ‐ 12 months | 909 per 1,000 | 882 per 1,000 | RR 0.97 | 66 | ⊕⊝⊝⊝ | ‐ |
| Mean refractive error expressed as mean spherical equivalent post‐treatment. ‐ 12 months | The mean refractive error expressed as mean spherical equivalent post‐treatment. ‐ 12 months was −0.17 | MD 0.01 higher | ‐ | 66 | ⊕⊝⊝⊝ | ‐ |
| Mean higher‐order aberrations (HOAs) post‐treatment, measured by machine with wavefront sensor ‐ 12 months | The mean HOAs post‐treatment, measured by machine with wavefront sensor ‐ 12 months was 0.38 | MD 0.01 lower | ‐ | 66 | ⊕⊝⊝⊝ | ‐ |
| Proportion of eyes with significant visual loss (loss of 2 or more lines from pretreatment BSCVA): 12 months | see comment | ‐ | ‐ | ‐ | ‐ | This outcome was not reported |
| Proportion of eyes with optical side effects, such as glare and halo: 12 months | see comment | ‐ | ‐ | ‐ | ‐ | This outcome was not reported |
| *The risk in the intervention group (and its 95% confidence interval) is based on the assumed risk in the comparison group and the relative effect of the intervention (and its 95% CI). | ||||||
| GRADE Working Group grades of evidence | ||||||
| aDowngraded for risk of bias. | ||||||
| Wavefront compared to conventional procedure for adults with refractive errors | ||||||
| Participant or population: Adults with refractive errors | ||||||
| Outcomes | Anticipated absolute effects* (95% CI) | Relative effect | № of participants | Certainty of the evidence | Comments | |
|---|---|---|---|---|---|---|
| Risk with Conventional procedure | Risk with Wavefront | |||||
| Proportion of eyes with uncorrected visual acuity (UCVA) of 20/20 or better post‐treatment: 6 months ‐ overall estimate | 831 per 1000 | 831 per 1000 | RR 1.00 | 470 | ⊕⊕⊝⊝ | ‐ |
| Proportion of eyes that had lost 1 or more lines of best spectacle‐corrected visual acuity (BSCVA) post‐treatment: 6 months ‐ overall estimate | 200 per 1000 | 216 per 1000 | RR 1.04 | 151 | ⊕⊕⊝⊝ | ‐ |
| Proportion of eyes within ± 0.50 diopters (D) of target refraction: 6 months ‐ Procedure PRK | 917 per 1000 | 816 per 1000 | RR 0.89 | 192 | ⊕⊝⊝⊝ | ‐ |
| Proportion of eyes within ± 0.50 diopters (D) of target refraction: 6 months ‐ Procedure LASIK | 900 per 1000 | 999 per 1000 | RR 1.11 | 20 | ⊕⊝⊝⊝ | ‐ |
| Mean refractive error expressed as mean spherical equivalent post‐treatment: 6 months ‐ Procedure PRK | The mean refractive error expressed as mean spherical equivalent post‐treatment: 6 months ‐ Procedure PRK was 0 | MD 0.06 higher | ‐ | 196 | ⊕⊝⊝⊝ | ‐ |
| Mean refractive error expressed as mean spherical equivalent post‐treatment: 6 months ‐ Procedure LASIK | The mean refractive error expressed as mean spherical equivalent post‐treatment: 6 months ‐ Procedure LASIK was 0 | MD 0.11 higher | ‐ | 428 | ⊕⊝⊝⊝ | ‐ |
| Mean higher‐order aberrations (HOAs) post‐treatment, measured by machine with wavefront sensor: PRK procedure: 6 months | see comment | see comment | ‐ | 116 | ⊕⊝⊝⊝ | Two studies reported data on PRK. Due to substantial heterogeneity, we did not combine data in a meta‐analysis. Point estimates from Mastropasqua 2006 (MD = −0.21, 95% CI −0.26 to −0.16) suggest benefit in favor of wavefront‐guided PRK relative to conventional PRK (56 eyes of 56 participants). Estimates from Karimian 2010 (MD 0.17, 95% CI 0.02 to 0.32) favors conventional PRK (56 eyes, 28 participants). There were no data on LASIK for this outcome at 6 months |
| *The risk in the intervention group (and its 95% confidence interval) is based on the assumed risk in the comparison group and the relative effect of the intervention (and its 95% CI). | ||||||
| GRADE Working Group grades of evidence | ||||||
| aDowngraded for risk of bias. | ||||||
| Wavefront‐optimized compared to wavefront‐guided for adults with refractive errors | ||||||
| Participant or population: Adults with refractive errors | ||||||
| Outcomes | Anticipated absolute effects* (95% CI) | Relative effect | № of participants | Certainty of the evidence | Comments | |
|---|---|---|---|---|---|---|
| Risk with Wavefront‐guided | Risk with Wavefront‐optimized | |||||
| Proportion of eyes with uncorrected visual acuity (UCVA) of 20/20 or better post‐treatment: 6 months | 982 per 1000 | 982 per 1000 | RR 1.00 | 444 | ⊕⊕⊝⊝ | ‐ |
| Proportion of eyes that had lost 1 or more lines of best spectacle‐corrected visual acuity (BSCVA) post‐treatment: 6 months | 54 per 1000 | 54 per 1000 | RR 0.99 | 258 | ⊕⊕⊝⊝ | ‐ |
| Proportion of eyes within ± 0.50 diopters (D) of target refraction post‐treatment: 6 months | 938 per 1000 | 872 per 1000 | RR 0.93 | 258 | ⊕⊕⊝⊝ | ‐ |
| Mean refractive error expressed as mean spherical equivalent post‐treatment: 6 months. ‐ Procedure PRK | The mean refractive error expressed as mean spherical equivalent post‐treatment: 6 months. ‐ Procedure PRK was 0 | MD 0.09 higher | ‐ | 138 | ⊕⊕⊕⊝ | ‐ |
| Mean refractive error expressed as mean spherical equivalent post‐treatment: 6 months. ‐ Procedure LASIK | The mean refractive error expressed as mean spherical equivalent post‐treatment: 6 months. ‐ Procedure LASIK was 0 | MD 0.12 lower | ‐ | 280 | ⊕⊕⊕⊝ | ‐ |
| Mean higher‐order aberrations (HOAs) post‐treatment, measured by machine with wavefront sensor: 6 months | The mean HOAs post‐treatment, measured by machine with wavefront sensor: 6 months was 0 | MD 0.03 higher | ‐ | 478 | ⊕⊕⊝⊝ | ‐ |
| Proportion of eyes with significant visual loss (loss of 2 or more lines from pretreatment BSCVA) and proportion of eyes with optical side effects, such as glare and halo: 6 months | see comment | ‐ | ‐ | ‐ | ‐ | These two outcomes were not reported |
| *The risk in the intervention group (and its 95% confidence interval) is based on the assumed risk in the comparison group and the relative effect of the intervention (and its 95% CI). | ||||||
| GRADE Working Group grades of evidence | ||||||
| aDowngraded for risk of bias. | ||||||
| Wavefront‐guided LASIK compared to wavefront‐guided PRK for adults with refractive errors | ||||||
| Participant or population: Adults with refractive errors | ||||||
| Outcomes | Anticipated absolute effects* (95% CI) | Relative effect | № of participants | Certainty of the evidence | Comments | |
|---|---|---|---|---|---|---|
| Risk with Wavefront‐guided PRK | Risk with Wavefront‐guided LASIK | |||||
| Proportion of eyes with uncorrected visual acuity (UCVA) of 20/20 or better post‐treatment. ‐ 6 months | 939 per 1000 | 968 per 1000 | RR 1.03 | 66 | ⊕⊝⊝⊝ | ‐ |
| Proportion of eyes within ± 0.50 diopters (D) of target refraction post‐treatment. ‐ 6 months | 970 per 1000 | 970 per 1000 | RR 1.00 | 66 | ⊕⊝⊝⊝ | ‐ |
| Mean refractive error expressed as mean spherical equivalent post‐treatment. ‐ 6 months | The mean refractive error expressed as mean spherical equivalent post‐treatment. ‐ 6 months was 0 | MD 0 | ‐ | 66 | ⊕⊝⊝⊝ | ‐ |
| Mean higher‐order aberrations (HOAs) post‐treatment, measured by machine with wavefront sensor ‐ 6 months | The mean higher‐order aberrations (HOAs) post‐treatment, measured by machine with wavefront sensor ‐ 6 months was 0 | MD 0.02 higher | ‐ | 66 | ⊕⊝⊝⊝ | ‐ |
| Proportion of eyes that had lost 1 or more lines of best spectacle‐corrected visual acuity (BSCVA) posttreatment. ‐ 6 months | see comment | ‐ | ‐ | ‐ | ‐ | This outcome was not reported |
| Proportion of eyes with significant visual loss (loss of 2 or more lines from pretreatment BSCVA): 6 months | see comment | ‐ | ‐ | ‐ | ‐ | This outcome was not reported |
| Proportion of eyes with optical side effects, such as glare and halo: 6 months | see comment | ‐ | ‐ | ‐ | ‐ | This outcome was not reported |
| *The risk in the intervention group (and its 95% confidence interval) is based on the assumed risk in the comparison group and the relative effect of the intervention (and its 95% CI). | ||||||
| GRADE Working Group grades of evidence | ||||||
| aDowngraded for risk of bias. | ||||||
| Outcome or subgroup title | No. of studies | No. of participants | Statistical method | Effect size |
| 1.1 Proportion of eyes with uncorrected visual acuity (UCVA) of 20/20 or better post‐treatment: 6 months Show forest plot | 6 | 470 | Risk Ratio (IV, Random, 95% CI) | 1.00 [0.96, 1.03] |
| 1.1.1 Procedure PRK | 2 | 136 | Risk Ratio (IV, Random, 95% CI) | 0.95 [0.81, 1.12] |
| 1.1.2 Procedure LASIK | 4 | 334 | Risk Ratio (IV, Random, 95% CI) | 1.00 [0.96, 1.04] |
| 1.2 Proportion of eyes with uncorrected visual acuity (UCVA) of 20/20 or better post‐treatment:12 months Show forest plot | 1 | 70 | Risk Ratio (IV, Random, 95% CI) | 1.03 [0.86, 1.24] |
| 1.2.1 Procedure: PRK | 1 | 70 | Risk Ratio (IV, Random, 95% CI) | 1.03 [0.86, 1.24] |
| 1.3 Proportion of eyes that had lost 1 or more lines of best spectacle‐corrected visual acuity (BSCVA) posttreatment: 6 months Show forest plot | 3 | 151 | Risk Ratio (IV, Random, 95% CI) | 1.04 [0.93, 1.17] |
| 1.3.1 Procedure PRK | 1 | 80 | Risk Ratio (IV, Random, 95% CI) | 1.00 [0.93, 1.07] |
| 1.3.2 Procedure LASIK | 2 | 71 | Risk Ratio (IV, Random, 95% CI) | 1.11 [0.88, 1.40] |
| 1.4 Proportion of eyes without loss of 1 or more lines of best spectacle‐corrected visual acuity (BSCVA) posttreatment:12 months Show forest plot | 1 | 70 | Risk Ratio (IV, Random, 95% CI) | 0.94 [0.81, 1.09] |
| 1.4.1 Procedure PRK | 1 | 70 | Risk Ratio (IV, Random, 95% CI) | 0.94 [0.81, 1.09] |
| 1.5 Proportion of eyes within ± 0.50 diopters (D) of target refraction: 6 months Show forest plot | 4 | Risk Ratio (IV, Random, 95% CI) | Subtotals only | |
| 1.5.1 Procedure PRK | 3 | 192 | Risk Ratio (IV, Random, 95% CI) | 0.89 [0.78, 1.01] |
| 1.5.2 Procedure LASIK | 1 | 20 | Risk Ratio (IV, Random, 95% CI) | 1.11 [0.85, 1.44] |
| 1.6 Proportion of eyes within ± 0.50 diopters (D) of target refraction: 12 months Show forest plot | 1 | 70 | Risk Ratio (IV, Random, 95% CI) | 1.03 [0.86, 1.24] |
| 1.6.1 Procedure PRK | 1 | 70 | Risk Ratio (IV, Random, 95% CI) | 1.03 [0.86, 1.24] |
| 1.7 Mean refractive error expressed as mean spherical equivalent post‐treatment: 6 months Show forest plot | 8 | Mean Difference (IV, Random, 95% CI) | Subtotals only | |
| 1.7.1 Procedure PRK | 3 | 196 | Mean Difference (IV, Random, 95% CI) | 0.06 [‐0.09, 0.21] |
| 1.7.2 Procedure LASIK | 5 | 428 | Mean Difference (IV, Random, 95% CI) | 0.11 [‐0.05, 0.28] |
| 1.8 Mean refractive error expressed as mean spherical equivalent post‐treatment:12 months Show forest plot | 1 | 70 | Mean Difference (IV, Random, 95% CI) | 0.04 [‐0.11, 0.18] |
| 1.8.1 Procedure PRK | 1 | 70 | Mean Difference (IV, Random, 95% CI) | 0.04 [‐0.11, 0.18] |
| 1.9 Mean higher‐order aberrations (HOAs) microns post‐treatment, measured by machine with wavefront sensor: 1 month Show forest plot | 3 | Mean Difference (IV, Random, 95% CI) | Subtotals only | |
| 1.9.1 Procedure LASIK | 2 | 68 | Mean Difference (IV, Random, 95% CI) | ‐0.12 [‐0.22, ‐0.03] |
| 1.9.2 Procedure LASEK | 1 | 80 | Mean Difference (IV, Random, 95% CI) | ‐0.31 [‐0.38, ‐0.23] |
| 1.10 Mean higher‐order aberrations (HOAs) microns post‐treatment, measured by machine with wavefront sensor: 3 months Show forest plot | 5 | Mean Difference (IV, Random, 95% CI) | Subtotals only | |
| 1.10.1 Procedure PRK: 3 month | 1 | 132 | Mean Difference (IV, Random, 95% CI) | ‐0.04 [‐0.10, 0.02] |
| 1.10.2 Procedure LASIK: 3 month | 3 | 92 | Mean Difference (IV, Random, 95% CI) | ‐0.02 [‐0.04, 0.00] |
| 1.10.3 Procedure LASEK | 1 | 80 | Mean Difference (IV, Random, 95% CI) | ‐0.23 [‐0.26, ‐0.19] |
| 1.11 Mean higher‐order aberrations (HOAs) microns post‐treatment, measured by machine with wavefront sensor: 6 months Show forest plot | 2 | Mean Difference (IV, Random, 95% CI) | Totals not selected | |
| 1.11.1 Procedure PRK: 6 month | 2 | Mean Difference (IV, Random, 95% CI) | Totals not selected | |
| Outcome or subgroup title | No. of studies | No. of participants | Statistical method | Effect size |
| 2.1 Proportion of eyes with uncorrected visual acuity (UCVA) of 20/20 or better post‐treatment: 6 months Show forest plot | 5 | 444 | Risk Ratio (IV, Random, 95% CI) | 1.00 [0.98, 1.02] |
| 2.1.1 Procedure PRK | 1 | 104 | Risk Ratio (IV, Random, 95% CI) | 0.94 [0.87, 1.02] |
| 2.1.2 Procedure LASIK | 4 | 340 | Risk Ratio (IV, Random, 95% CI) | 1.00 [0.98, 1.02] |
| 2.2 Proportion of eyes with uncorrected visual acuity (UCVA) of 20/20 or better post‐treatment:12 months Show forest plot | 5 | 618 | Risk Ratio (IV, Random, 95% CI) | 1.00 [0.99, 1.02] |
| 2.2.1 Procedure PRK | 2 | 334 | Risk Ratio (IV, Random, 95% CI) | 1.02 [0.98, 1.06] |
| 2.2.2 Procedure LASIK | 3 | 284 | Risk Ratio (IV, Random, 95% CI) | 1.00 [0.98, 1.02] |
| 2.3 Proportion of eyes without loss of 1 or more lines of best spectacle‐corrected visual acuity (BSCVA) posttreatment: 6 months Show forest plot | 4 | 258 | Risk Ratio (IV, Random, 95% CI) | 0.99 [0.94, 1.04] |
| 2.3.1 Procedure PRK | 1 | 104 | Risk Ratio (IV, Random, 95% CI) | 1.00 [0.95, 1.06] |
| 2.3.2 Procedure LASIK | 3 | 154 | Risk Ratio (IV, Random, 95% CI) | 0.96 [0.85, 1.08] |
| 2.4 Proportion of eyes without loss of 1 or more lines of best spectacle‐corrected visual acuity (BSCVA) posttreatment:12 months. Show forest plot | 5 | 622 | Risk Ratio (IV, Random, 95% CI) | 0.99 [0.96, 1.02] |
| 2.4.1 Procedure PRK | 2 | 334 | Risk Ratio (IV, Random, 95% CI) | 1.01 [0.97, 1.05] |
| 2.4.2 Procedure LASIK | 3 | 288 | Risk Ratio (IV, Random, 95% CI) | 0.97 [0.94, 1.01] |
| 2.5 Proportion of eyes within ± 0.50 diopters (D) of target refraction post‐treatment: 6 months Show forest plot | 4 | 258 | Risk Ratio (IV, Random, 95% CI) | 0.93 [0.87, 1.00] |
| 2.5.1 Procedure PRK | 1 | 104 | Risk Ratio (IV, Random, 95% CI) | 0.94 [0.86, 1.03] |
| 2.5.2 Procedure LASIK | 3 | 154 | Risk Ratio (IV, Random, 95% CI) | 0.92 [0.81, 1.04] |
| 2.6 Proportion of eyes within ± 0.50 diopters (D) of target refraction post‐treatment:12 months Show forest plot | 4 | 480 | Risk Ratio (IV, Random, 95% CI) | 1.02 [0.95, 1.09] |
| 2.6.1 Procedure PRK | 1 | 192 | Risk Ratio (IV, Random, 95% CI) | 1.06 [0.97, 1.15] |
| 2.6.2 Procedure LASIK | 3 | 288 | Risk Ratio (IV, Random, 95% CI) | 0.97 [0.86, 1.11] |
| 2.7 Mean refractive error expressed as mean spherical equivalent post‐treatment: 6 months. Show forest plot | 4 | Mean Difference (IV, Random, 95% CI) | Subtotals only | |
| 2.7.1 Procedure PRK | 1 | 138 | Mean Difference (IV, Random, 95% CI) | 0.09 [‐0.02, 0.20] |
| 2.7.2 Procedure LASIK | 3 | 280 | Mean Difference (IV, Random, 95% CI) | ‐0.12 [‐0.19, ‐0.05] |
| 2.8 Mean refractive error expressed as mean spherical equivalent post‐treatment:12 months Show forest plot | 6 | Mean Difference (IV, Random, 95% CI) | Subtotals only | |
| 2.8.1 Procedure PRK | 2 | 334 | Mean Difference (IV, Random, 95% CI) | 0.07 [‐0.03, 0.18] |
| 2.8.2 Procedure LASIK | 4 | 472 | Mean Difference (IV, Random, 95% CI) | ‐0.14 [‐0.19, ‐0.09] |
| 2.9 Mean higher‐order aberrations (HOAs) microns post‐treatment, measured by machine with wavefront sensor: 1 month Show forest plot | 4 | Mean Difference (IV, Random, 95% CI) | Subtotals only | |
| 2.9.1 Procedure PRK | 1 | 140 | Mean Difference (IV, Random, 95% CI) | 0.03 [‐0.03, 0.09] |
| 2.9.2 Procedure LASIK | 3 | 296 | Mean Difference (IV, Random, 95% CI) | 0.03 [‐0.01, 0.07] |
| 2.10 Mean higher‐order aberrations (HOAs) microns post‐treatment, measured by machine with wavefront sensor: 3 months Show forest plot | 6 | Mean Difference (IV, Random, 95% CI) | Subtotals only | |
| 2.10.1 Procedure PRK | 2 | 182 | Mean Difference (IV, Random, 95% CI) | 0.06 [0.01, 0.11] |
| 2.10.2 Procedure LASIK | 4 | 318 | Mean Difference (IV, Random, 95% CI) | ‐0.01 [‐0.06, 0.04] |
| 2.11 Mean higher‐order aberrations (HOAs) microns post‐treatment, measured by machine with wavefront sensor: 6 months Show forest plot | 5 | 478 | Mean Difference (IV, Random, 95% CI) | 0.03 [0.00, 0.06] |
| 2.11.1 Procedure PRK | 1 | 138 | Mean Difference (IV, Random, 95% CI) | 0.06 [‐0.01, 0.13] |
| 2.11.2 Procedure LASIK | 4 | 340 | Mean Difference (IV, Random, 95% CI) | 0.03 [‐0.01, 0.06] |
| 2.12 Mean higher‐order aberrations (HOAs) microns post‐treatment, measured by machine with wavefront sensor: 12 months Show forest plot | 5 | 622 | Mean Difference (IV, Random, 95% CI) | 0.03 [‐0.01, 0.07] |
| 2.12.1 Procedure PRK | 2 | 334 | Mean Difference (IV, Random, 95% CI) | 0.02 [‐0.08, 0.13] |
| 2.12.2 Procedure LASIK | 3 | 288 | Mean Difference (IV, Random, 95% CI) | 0.03 [‐0.01, 0.06] |
| Outcome or subgroup title | No. of studies | No. of participants | Statistical method | Effect size |
| 3.1 Proportion of eyes with uncorrected visual acuity (UCVA) of 20/20 or better post‐treatment. Show forest plot | 1 | Risk Ratio (IV, Random, 95% CI) | Subtotals only | |
| 3.1.1 6 months | 1 | 66 | Risk Ratio (IV, Random, 95% CI) | 1.03 [0.93, 1.15] |
| 3.1.2 12 months | 1 | 66 | Risk Ratio (IV, Random, 95% CI) | 1.03 [0.93, 1.15] |
| 3.2 Proportion of eyes without loss of 1 or more lines of best spectacle‐corrected visual acuity (BSCVA) posttreatment. Show forest plot | 1 | Risk Ratio (IV, Random, 95% CI) | Subtotals only | |
| 3.2.1 12 months | 1 | 66 | Risk Ratio (IV, Random, 95% CI) | 1.03 [0.93, 1.15] |
| 3.3 Proportion of eyes within ± 0.50 diopters (D) of target refraction post‐treatment. Show forest plot | 1 | Risk Ratio (IV, Random, 95% CI) | Subtotals only | |
| 3.3.1 6 months | 1 | 66 | Risk Ratio (IV, Random, 95% CI) | 1.00 [0.92, 1.09] |
| 3.3.2 12 months | 1 | 66 | Risk Ratio (IV, Random, 95% CI) | 0.97 [0.82, 1.14] |
| 3.4 Mean refractive error expressed as mean spherical equivalent post‐treatment. Show forest plot | 1 | Mean Difference (IV, Random, 95% CI) | Subtotals only | |
| 3.4.1 6 months | 1 | 66 | Mean Difference (IV, Random, 95% CI) | 0.00 [‐0.13, 0.13] |
| 3.4.2 12 months | 1 | 66 | Mean Difference (IV, Random, 95% CI) | 0.01 [‐0.18, 0.20] |
| 3.5 Mean higher‐order aberrations (HOAs) microns post‐treatment, measured by machine with wavefront sensor Show forest plot | 1 | Mean Difference (IV, Random, 95% CI) | Subtotals only | |
| 3.5.1 1 month | 1 | 66 | Mean Difference (IV, Random, 95% CI) | ‐0.06 [‐0.15, 0.03] |
| 3.5.2 3 months | 1 | 66 | Mean Difference (IV, Random, 95% CI) | 0.00 [‐0.07, 0.07] |
| 3.5.3 6 months | 1 | 66 | Mean Difference (IV, Random, 95% CI) | 0.02 [‐0.05, 0.09] |
| 3.5.4 12 months | 1 | 66 | Mean Difference (IV, Random, 95% CI) | ‐0.01 [‐0.09, 0.07] |