Cirugía refractiva con láser excimer de frente de onda en adultos con errores de refracción
Appendices
Appendix 1. CENTRAL search strategy
#1 MeSH descriptor: [Corneal Surgery, Laser] explode all trees
#2 keratectom* or keratomileusis
#3 LASIK or Lasek or PRK
#4 laser* near/3 refractive near/3 surg$*
#5 laser* near/3 epithel* near/3 surg*
#6 MeSH descriptor: [Lasers, Excimer] this term only
#7 excimer near/3 laser*
#8 small incision lenticule extraction
#9 SMILE
#10 #1 or #2 or #3 or #4 or #5 or #6 or #7 or #8 or #9
#11 MeSH descriptor: [Corneal Wavefront Aberration] this term only
#12 wavefront*
#13 (high* or low*) near/3 aberration*
#14 HOA
#15 Customvue or Allegretto Wave
#16c custom or conventional
#17#11 or #12 or #13 or #15 or #16
#18#10 and #17
Appendix 2. MEDLINE Ovid search strategy
1. randomized controlled trial.pt.
2. (randomized or randomised).ab,ti.
3. placebo.ab,ti.
4. dt.fs.
5. randomly.ab,ti.
6. trial.ab,ti.
7. (group or groups).ab,ti.
8. or/1‐7
9. exp animals/
10. exp humans/
11. 9 not (9 and 10)
12. 8 not 11
13. exp corneal surgery, laser/
14. keratectom$.tw.
15. keratomileusis.tw.
16. LAS?K.tw.
17. PRK.tw.
18. (laser$ adj3 refractive adj3 surg$).tw.
19. (laser$ adj3 epithel$ adj3 surg$).tw.
20. Lasers, Excimer/
21. (excimer adj3 laser$).tw.
22. small incision lenticule extraction.tw.
23. SMILE.tw.
24. or/13‐23
25. Corneal Wavefront Aberration/
26. wavefront$.tw.
27. ((high$ or low$) adj3 aberration$).tw.
28. HOA.tw.
29. (Customvue or Allegretto Wave).tw.
30. (custom or conventional).tw.
31. or/25‐30
32. 24 and 31
33. 12 and 32
The search filter for trials at the beginning of the MEDLINE strategy is from the published paper by Glanville 2006.
Appendix 3. Embase Ovid search strategy
1. exp randomized controlled trial/
2. exp randomization/
3. exp double blind procedure/
4. exp single blind procedure/
5. random$.tw.
6. or/1‐5
7. (animal or animal experiment).sh.
8. human.sh.
9. 7 and 8
10. 7 not 9
11. 6 not 10
12. exp clinical trial/
13. (clin$ adj3 trial$).tw.
14. ((singl$ or doubl$ or trebl$ or tripl$) adj3 (blind$ or mask$)).tw.
15. exp placebo/
16. placebo$.tw.
17. random$.tw.
18. exp experimental design/
19. exp crossover procedure/
20. exp control group/
21. exp latin square design/
22. or/12‐21
23. 22 not 10
24. 23 not 11
25. exp comparative study/
26. exp evaluation/
27. exp prospective study/
28. (control$ or prospectiv$ or volunteer$).tw.
29. or/25‐28
30. 29 not 10
31. 30 not (11 or 23)
32. 11 or 24 or 31
33. keratectomy/
34. photorefractive keratectomy/
35. keratomileusis/
36. laser epithelial keratomileusis/
37. keratectom$.tw.
38. keratomileusis.tw.
39. LAS?K.tw.
40. PRK.tw.
41. (laser$ adj3 refractive adj3 surg$).tw.
42. (laser$ adj3 epithel$ adj3 surg$).tw.
43. excimer laser/
44. (excimer adj3 laser$).tw.
45. small incision lenticule extraction.tw.
46. SMILE.tw.
47. or/33‐46
48. corneal wavefront aberration/
49. wavefront$.tw.
50. ((high$ or low$) adj3 aberration$).tw.
51. HOA.tw.
52. (Customvue or Allegretto Wave).tw.
53. (custom or conventional).tw.
54. or/48‐52
55. 47 and 54
56. 32 and 55
Appendix 4. LILACS search strategy
keratectomy OR keratomileusis OR LASIK OR LASEK OR PRK OR excimer OR lenticule extraction OR SMILE and wavefront OR aberration OR custom OR conventional OR Customvue OR Allegretto Wave
Appendix 5. ClinicalTrials.gov search strategy
(keratectomy OR keratomileusis OR LASIK OR LASEK OR PRK OR excimer OR lenticule extraction OR SMILE) AND (wavefront OR aberration OR custom OR conventional OR Customvue OR Allegretto Wave)
Appendix 6. WHO ICTRP search strategy
wavefront OR aberration OR custom OR conventional OR Customvue OR Allegretto Wave = Title AND keratectomy OR keratomileusis OR LASIK OR LASEK OR PRK OR excimer OR lenticule extraction OR SMILE = Intervention
Appendix 7. ISRCTN search strategy
(keratectomy OR keratomileusis OR LASIK OR LASEK OR PRK OR excimer OR "lenticule extraction" OR SMILE) AND (wavefront OR aberration OR custom OR conventional OR Customvue OR "Allegretto Wave")
Appendix 8. Data on study characteristics
| Mandatory items | Optional items | |
|---|---|---|
| Methods | ||
| Study design | · Parallel group RCTi.e. people randomized to treatment · Within‐person RCTi.e. eyes randomized to treatment · Cluster RCTi.e. communities randomized to treatment · Cross‐over RCT · Other, specify | Exclusions after randomization Losses to follow up Number randomized/analyzed How were missing data handled? e.g. available case analysis, imputation methods Reported power calculation (Y/N), if yes, sample size and power Unusual study design/issues |
| Eyes or Unit of randomization/ unit of analysis | · One eye included in study, specify how eye selected · Two eyes included in study, both eyes received same treatment, briefly specify how analyzed (best/worst/average/both and adjusted for within person correlation/both and not adjusted for within person correlation) and specify if mixture one eye and two eye · Two eyes included in study, eyes received different treatments,specify if correct pair‐matched analysis done | |
| Participants | ||
| Country | Setting Ethnic group Equivalence of baseline characteristics (Y/N) | |
| Total number of participants | This information should be collected for total study population recruited into the study. If these data are only reported for the people who were followed up only, please indicate. | |
| Number (%) of men and women | ||
| Average age and age range | ||
| Inclusion criteria | ||
| Exclusion criteria | ||
| Interventions | ||
| Intervention (n= ) Comparator (n= ) See MECIR 65 and 70 | · Number of people randomized to this group · Drug (or intervention) name · Dose · Frequency · Route of administration | |
| Outcomes | ||
| Primary and secondary outcomes as defined in study reports See MECIR R70 | List outcomes Adverse events reported (Y/N) Length of follow up and intervals at which outcomes assessed | Planned/actual length of follow up |
| Trial information | Clinical trial registration number | |
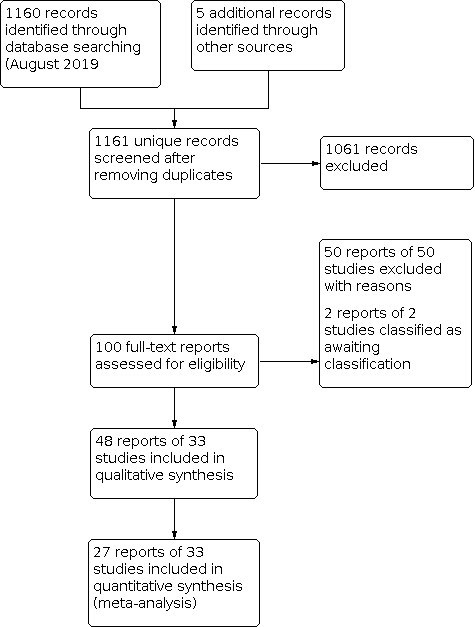
Study flow diagram.

Risk of bias summary: review authors' judgements about each risk of bias item for each included study.

Risk of bias graph: review authors' judgements about each risk of bias item presented as percentages across all included studies.

Forest plot of comparison: 1 Wavefront vs Conventional procedure, outcome: 1.1 Proportion of eyes with uncorrected visual acuity (UCVA) of 20/20 or better post‐treatment: 6 months.

Forest plot of comparison: 1 Wavefront vs Conventional procedure, outcome: 1.5 Proportion of eyes within ± 0.50 diopters (D) of target refraction: 6 months.

Forest plot of comparison: 1 Wavefront vs Conventional procedure, outcome: 1.7 Mean refractive error expressed as mean spherical equivalent post‐treatment: 6 months.

Comparison 1: Wavefront vs Conventional procedure, Outcome 1: Proportion of eyes with uncorrected visual acuity (UCVA) of 20/20 or better post‐treatment: 6 months

Comparison 1: Wavefront vs Conventional procedure, Outcome 2: Proportion of eyes with uncorrected visual acuity (UCVA) of 20/20 or better post‐treatment:12 months

Comparison 1: Wavefront vs Conventional procedure, Outcome 3: Proportion of eyes that had lost 1 or more lines of best spectacle‐corrected visual acuity (BSCVA) posttreatment: 6 months

Comparison 1: Wavefront vs Conventional procedure, Outcome 4: Proportion of eyes without loss of 1 or more lines of best spectacle‐corrected visual acuity (BSCVA) posttreatment:12 months

Comparison 1: Wavefront vs Conventional procedure, Outcome 5: Proportion of eyes within ± 0.50 diopters (D) of target refraction: 6 months

Comparison 1: Wavefront vs Conventional procedure, Outcome 6: Proportion of eyes within ± 0.50 diopters (D) of target refraction: 12 months

Comparison 1: Wavefront vs Conventional procedure, Outcome 7: Mean refractive error expressed as mean spherical equivalent post‐treatment: 6 months

Comparison 1: Wavefront vs Conventional procedure, Outcome 8: Mean refractive error expressed as mean spherical equivalent post‐treatment:12 months

Comparison 1: Wavefront vs Conventional procedure, Outcome 9: Mean higher‐order aberrations (HOAs) microns post‐treatment, measured by machine with wavefront sensor: 1 month

Comparison 1: Wavefront vs Conventional procedure, Outcome 10: Mean higher‐order aberrations (HOAs) microns post‐treatment, measured by machine with wavefront sensor: 3 months

Comparison 1: Wavefront vs Conventional procedure, Outcome 11: Mean higher‐order aberrations (HOAs) microns post‐treatment, measured by machine with wavefront sensor: 6 months

Comparison 2: Wavefront‐optimized vs Wavefront‐guided, Outcome 1: Proportion of eyes with uncorrected visual acuity (UCVA) of 20/20 or better post‐treatment: 6 months

Comparison 2: Wavefront‐optimized vs Wavefront‐guided, Outcome 2: Proportion of eyes with uncorrected visual acuity (UCVA) of 20/20 or better post‐treatment:12 months

Comparison 2: Wavefront‐optimized vs Wavefront‐guided, Outcome 3: Proportion of eyes without loss of 1 or more lines of best spectacle‐corrected visual acuity (BSCVA) posttreatment: 6 months

Comparison 2: Wavefront‐optimized vs Wavefront‐guided, Outcome 4: Proportion of eyes without loss of 1 or more lines of best spectacle‐corrected visual acuity (BSCVA) posttreatment:12 months.

Comparison 2: Wavefront‐optimized vs Wavefront‐guided, Outcome 5: Proportion of eyes within ± 0.50 diopters (D) of target refraction post‐treatment: 6 months

Comparison 2: Wavefront‐optimized vs Wavefront‐guided, Outcome 6: Proportion of eyes within ± 0.50 diopters (D) of target refraction post‐treatment:12 months

Comparison 2: Wavefront‐optimized vs Wavefront‐guided, Outcome 7: Mean refractive error expressed as mean spherical equivalent post‐treatment: 6 months.

Comparison 2: Wavefront‐optimized vs Wavefront‐guided, Outcome 8: Mean refractive error expressed as mean spherical equivalent post‐treatment:12 months

Comparison 2: Wavefront‐optimized vs Wavefront‐guided, Outcome 9: Mean higher‐order aberrations (HOAs) microns post‐treatment, measured by machine with wavefront sensor: 1 month

Comparison 2: Wavefront‐optimized vs Wavefront‐guided, Outcome 10: Mean higher‐order aberrations (HOAs) microns post‐treatment, measured by machine with wavefront sensor: 3 months

Comparison 2: Wavefront‐optimized vs Wavefront‐guided, Outcome 11: Mean higher‐order aberrations (HOAs) microns post‐treatment, measured by machine with wavefront sensor: 6 months

Comparison 2: Wavefront‐optimized vs Wavefront‐guided, Outcome 12: Mean higher‐order aberrations (HOAs) microns post‐treatment, measured by machine with wavefront sensor: 12 months

Comparison 3: Wavefront‐guided LASIK vs Wavefront‐guided PRK, Outcome 1: Proportion of eyes with uncorrected visual acuity (UCVA) of 20/20 or better post‐treatment.

Comparison 3: Wavefront‐guided LASIK vs Wavefront‐guided PRK, Outcome 2: Proportion of eyes without loss of 1 or more lines of best spectacle‐corrected visual acuity (BSCVA) posttreatment.

Comparison 3: Wavefront‐guided LASIK vs Wavefront‐guided PRK, Outcome 3: Proportion of eyes within ± 0.50 diopters (D) of target refraction post‐treatment.

Comparison 3: Wavefront‐guided LASIK vs Wavefront‐guided PRK, Outcome 4: Mean refractive error expressed as mean spherical equivalent post‐treatment.

Comparison 3: Wavefront‐guided LASIK vs Wavefront‐guided PRK, Outcome 5: Mean higher‐order aberrations (HOAs) microns post‐treatment, measured by machine with wavefront sensor
| Wavefront procedures compared to conventional procedures for adults with refractive errors | ||||||
| Participant or population: Adults with refractive errors | ||||||
| Outcomes | Anticipated absolute effects* (95% CI) | Relative effect | № of participants | Certainty of the evidence | Comments | |
|---|---|---|---|---|---|---|
| Risk with conventional procedure | Risk with wavefront | |||||
| Proportion of eyes with uncorrected visual acuity (UCVA) of 20/20 or better post‐treatment:12 months ‐ Procedure: PRK | 86 per 100 | 88 per 100 | RR 1.03 | 70 | ⊕⊕⊝⊝ | ‐ |
| Proportion of eyes with uncorrected visual acuity (UCVA) of 20/20 or better post‐treatment:12 months ‐ Procedure: LASIK | see comment | ‐ | ‐ | ‐ | ‐ | There are no data on LASIK for this outcome at 12 months |
| Proportion of eyes that had lost 1 or more lines of best spectacle‐corrected visual acuity (BSCVA) posttreatment:12 months ‐ Procedure PRK | 6 per 100 | 5 per 100 | RR 0.94 | 70 | ⊕⊕⊝⊝ | ‐ |
| Proportion of eyes within ± 0.50 diopters (D) of target refraction: 12 months ‐ Procedure PRK | 86 per 100 | 88 per 100 | RR 1.03 | 70 | ⊕⊕⊝⊝ | ‐ |
| Proportion of eyes within ± 0.50 diopters (D) of target refraction: 12 months ‐ Procedure LASIK | see comment | ‐ | ‐ | ‐ | ‐ | There are no data on LASIK for this outcome at 12 months |
| Mean refractive error expressed as mean spherical equivalent post‐treatment:12 months ‐ Procedure PRK | The mean refractive error expressed as mean spherical equivalent post‐treatment:12 months ‐ Procedure PRK was ‐0.114 | MD 0.04 higher | ‐ | 70 | ⊕⊝⊝⊝ | ‐ |
| Proportion of eyes that had lost 1 or more lines of best spectacle‐corrected visual acuity (BSCVA) posttreatment‐procedure LASIK; Mean higher‐order aberrations (HOAs) post‐treatment, measured by machine with wavefront sensor; proportion of eyes with significant visual loss (loss of 2 or more lines from pretreatment BSCVA); proportion of eyes with optical side effects, such as glare and halo:12 months | see comment | ‐ | ‐ | ‐ | ‐ | There was no data on these outcomes at 12 months |
| *The risk in the intervention group (and its 95% confidence interval) is based on the assumed risk in the comparison group and the relative effect of the intervention (and its 95% CI). | ||||||
| GRADE Working Group grades of evidence | ||||||
| aDowngraded forImprecision. | ||||||
| Wavefront‐optimized procedures compared to wavefront‐guided procedures for adults with refractive errors | ||||||
| Participant or population: Adults with refractive errors | ||||||
| Outcomes | Anticipated absolute effects* (95% CI) | Relative effect | № of participants | Certainty of the evidence | Comments | |
|---|---|---|---|---|---|---|
| Risk with Any wavefront‐guided procedure | Risk with Any wavefront‐optimized | |||||
| Proportion of eyes with uncorrected visual acuity (UCVA) of 20/20 or better post‐treatment:12 months ‐ overall estimate | 97 per 100 | 97 per 100 | RR 1.00 | 618 | ⊕⊕⊝⊝ | ‐ |
| Proportion of eyes that had lost 1 or more lines of best spectacle‐corrected visual acuity (BSCVA) post‐treatment:12 months ‐ overall estimate | 5 per 100 | 5 per 100 | RR 0.99 | 622 | ⊕⊕⊝⊝ | ‐ |
| Proportion of eyes within ± 0.50 diopters (D) of target refraction post‐treatment:12 months ‐ overall estimate | 91 per 100 | 93 per 100 | RR 1.02 | 480 | ⊕⊕⊝⊝ | ‐ |
| Mean refractive error expressed as mean spherical equivalent post‐treatment:12 months ‐ Procedure PRK | The mean refractive error expressed as mean spherical equivalent post‐treatment:12 months ‐ Procedure PRK was −0.21 spherical equivalent | MD 0.07 spherical equivalent higher | ‐ | 334 | ⊕⊕⊝⊝ | ‐ |
| Mean refractive error expressed as mean spherical equivalent post‐treatment:12 months ‐ Procedure LASIK | The mean refractive error expressed as mean spherical equivalent post‐treatment:12 months ‐ Procedure LASIK ranged from 0.26 spherical equivalent | MD 0.14 spherical equivalent lower | ‐ | 472 | ⊕⊕⊝⊝ | ‐ |
| Mean higher‐order aberrations (HOAs) post‐treatment, measured by machine with wavefront sensor: 12 months ‐ overall estimate | The mean higher‐order aberrations (HOAs) post‐treatment, measured by machine with wavefront sensor: 12 months was 0.26 | MD 0.03 higher | ‐ | 622 | ⊕⊕⊝⊝ | ‐ |
| Proportion of eyes with significant visual loss (loss of 2 or more lines from pretreatment BSCVA): 12 months | see comment | ‐ | ‐ | ‐ | ‐ | One study that compared wavefront‐optimized LASIK versus wavefront‐guided LASIK reported on loss of 2 or more lines from pretreatment BSCVA that had not returned to baseline by 12 to 24 months after treatment (Manche 2013). Proportion of eyes with optical side effects, such as glare and halo |
| *The risk in the intervention group (and its 95% confidence interval) is based on the assumed risk in the comparison group and the relative effect of the intervention (and its 95% CI). | ||||||
| GRADE Working Group grades of evidence | ||||||
| aDowngraded for risk of bias. bDowngraded for imprecision. cDowngraded for inconsistency. | ||||||
| Wavefront‐guided LASIK compared to wavefront‐guided PRK for adults with refractive errors | ||||||
| Participant or population: Adults with refractive errors | ||||||
| Outcomes | Anticipated absolute effects* (95% CI) | Relative effect | № of participants | Certainty of the evidence | Comments | |
|---|---|---|---|---|---|---|
| Risk with wavefront‐guided PRK | Risk with wavefront‐guided LASIK | |||||
| Proportion of eyes with uncorrected visual acuity (UCVA) of 20/20 or better post‐treatment. ‐ 12 months | 94 per 100 | 97 per 100 | RR 1.03 | 66 | ⊕⊝⊝⊝ | ‐ |
| Proportion of eyes that had lost 1 or more lines of best spectacle‐corrected visual acuity (BSCVA) posttreatment. ‐ 12 months | 6 per 100 | 6 per 100 | RR 1.03 | 66 | ⊕⊝⊝⊝ | ‐ |
| Proportion of eyes within ± 0.50 diopters (D) of target refraction post‐treatment. ‐ 12 months | 909 per 1,000 | 882 per 1,000 | RR 0.97 | 66 | ⊕⊝⊝⊝ | ‐ |
| Mean refractive error expressed as mean spherical equivalent post‐treatment. ‐ 12 months | The mean refractive error expressed as mean spherical equivalent post‐treatment. ‐ 12 months was −0.17 | MD 0.01 higher | ‐ | 66 | ⊕⊝⊝⊝ | ‐ |
| Mean higher‐order aberrations (HOAs) post‐treatment, measured by machine with wavefront sensor ‐ 12 months | The mean HOAs post‐treatment, measured by machine with wavefront sensor ‐ 12 months was 0.38 | MD 0.01 lower | ‐ | 66 | ⊕⊝⊝⊝ | ‐ |
| Proportion of eyes with significant visual loss (loss of 2 or more lines from pretreatment BSCVA): 12 months | see comment | ‐ | ‐ | ‐ | ‐ | This outcome was not reported |
| Proportion of eyes with optical side effects, such as glare and halo: 12 months | see comment | ‐ | ‐ | ‐ | ‐ | This outcome was not reported |
| *The risk in the intervention group (and its 95% confidence interval) is based on the assumed risk in the comparison group and the relative effect of the intervention (and its 95% CI). | ||||||
| GRADE Working Group grades of evidence | ||||||
| aDowngraded for risk of bias. | ||||||
| Wavefront compared to conventional procedure for adults with refractive errors | ||||||
| Participant or population: Adults with refractive errors | ||||||
| Outcomes | Anticipated absolute effects* (95% CI) | Relative effect | № of participants | Certainty of the evidence | Comments | |
|---|---|---|---|---|---|---|
| Risk with Conventional procedure | Risk with Wavefront | |||||
| Proportion of eyes with uncorrected visual acuity (UCVA) of 20/20 or better post‐treatment: 6 months ‐ overall estimate | 831 per 1000 | 831 per 1000 | RR 1.00 | 470 | ⊕⊕⊝⊝ | ‐ |
| Proportion of eyes that had lost 1 or more lines of best spectacle‐corrected visual acuity (BSCVA) post‐treatment: 6 months ‐ overall estimate | 200 per 1000 | 216 per 1000 | RR 1.04 | 151 | ⊕⊕⊝⊝ | ‐ |
| Proportion of eyes within ± 0.50 diopters (D) of target refraction: 6 months ‐ Procedure PRK | 917 per 1000 | 816 per 1000 | RR 0.89 | 192 | ⊕⊝⊝⊝ | ‐ |
| Proportion of eyes within ± 0.50 diopters (D) of target refraction: 6 months ‐ Procedure LASIK | 900 per 1000 | 999 per 1000 | RR 1.11 | 20 | ⊕⊝⊝⊝ | ‐ |
| Mean refractive error expressed as mean spherical equivalent post‐treatment: 6 months ‐ Procedure PRK | The mean refractive error expressed as mean spherical equivalent post‐treatment: 6 months ‐ Procedure PRK was 0 | MD 0.06 higher | ‐ | 196 | ⊕⊝⊝⊝ | ‐ |
| Mean refractive error expressed as mean spherical equivalent post‐treatment: 6 months ‐ Procedure LASIK | The mean refractive error expressed as mean spherical equivalent post‐treatment: 6 months ‐ Procedure LASIK was 0 | MD 0.11 higher | ‐ | 428 | ⊕⊝⊝⊝ | ‐ |
| Mean higher‐order aberrations (HOAs) post‐treatment, measured by machine with wavefront sensor: PRK procedure: 6 months | see comment | see comment | ‐ | 116 | ⊕⊝⊝⊝ | Two studies reported data on PRK. Due to substantial heterogeneity, we did not combine data in a meta‐analysis. Point estimates from Mastropasqua 2006 (MD = −0.21, 95% CI −0.26 to −0.16) suggest benefit in favor of wavefront‐guided PRK relative to conventional PRK (56 eyes of 56 participants). Estimates from Karimian 2010 (MD 0.17, 95% CI 0.02 to 0.32) favors conventional PRK (56 eyes, 28 participants). There were no data on LASIK for this outcome at 6 months |
| *The risk in the intervention group (and its 95% confidence interval) is based on the assumed risk in the comparison group and the relative effect of the intervention (and its 95% CI). | ||||||
| GRADE Working Group grades of evidence | ||||||
| aDowngraded for risk of bias. | ||||||
| Wavefront‐optimized compared to wavefront‐guided for adults with refractive errors | ||||||
| Participant or population: Adults with refractive errors | ||||||
| Outcomes | Anticipated absolute effects* (95% CI) | Relative effect | № of participants | Certainty of the evidence | Comments | |
|---|---|---|---|---|---|---|
| Risk with Wavefront‐guided | Risk with Wavefront‐optimized | |||||
| Proportion of eyes with uncorrected visual acuity (UCVA) of 20/20 or better post‐treatment: 6 months | 982 per 1000 | 982 per 1000 | RR 1.00 | 444 | ⊕⊕⊝⊝ | ‐ |
| Proportion of eyes that had lost 1 or more lines of best spectacle‐corrected visual acuity (BSCVA) post‐treatment: 6 months | 54 per 1000 | 54 per 1000 | RR 0.99 | 258 | ⊕⊕⊝⊝ | ‐ |
| Proportion of eyes within ± 0.50 diopters (D) of target refraction post‐treatment: 6 months | 938 per 1000 | 872 per 1000 | RR 0.93 | 258 | ⊕⊕⊝⊝ | ‐ |
| Mean refractive error expressed as mean spherical equivalent post‐treatment: 6 months. ‐ Procedure PRK | The mean refractive error expressed as mean spherical equivalent post‐treatment: 6 months. ‐ Procedure PRK was 0 | MD 0.09 higher | ‐ | 138 | ⊕⊕⊕⊝ | ‐ |
| Mean refractive error expressed as mean spherical equivalent post‐treatment: 6 months. ‐ Procedure LASIK | The mean refractive error expressed as mean spherical equivalent post‐treatment: 6 months. ‐ Procedure LASIK was 0 | MD 0.12 lower | ‐ | 280 | ⊕⊕⊕⊝ | ‐ |
| Mean higher‐order aberrations (HOAs) post‐treatment, measured by machine with wavefront sensor: 6 months | The mean HOAs post‐treatment, measured by machine with wavefront sensor: 6 months was 0 | MD 0.03 higher | ‐ | 478 | ⊕⊕⊝⊝ | ‐ |
| Proportion of eyes with significant visual loss (loss of 2 or more lines from pretreatment BSCVA) and proportion of eyes with optical side effects, such as glare and halo: 6 months | see comment | ‐ | ‐ | ‐ | ‐ | These two outcomes were not reported |
| *The risk in the intervention group (and its 95% confidence interval) is based on the assumed risk in the comparison group and the relative effect of the intervention (and its 95% CI). | ||||||
| GRADE Working Group grades of evidence | ||||||
| aDowngraded for risk of bias. | ||||||
| Wavefront‐guided LASIK compared to wavefront‐guided PRK for adults with refractive errors | ||||||
| Participant or population: Adults with refractive errors | ||||||
| Outcomes | Anticipated absolute effects* (95% CI) | Relative effect | № of participants | Certainty of the evidence | Comments | |
|---|---|---|---|---|---|---|
| Risk with Wavefront‐guided PRK | Risk with Wavefront‐guided LASIK | |||||
| Proportion of eyes with uncorrected visual acuity (UCVA) of 20/20 or better post‐treatment. ‐ 6 months | 939 per 1000 | 968 per 1000 | RR 1.03 | 66 | ⊕⊝⊝⊝ | ‐ |
| Proportion of eyes within ± 0.50 diopters (D) of target refraction post‐treatment. ‐ 6 months | 970 per 1000 | 970 per 1000 | RR 1.00 | 66 | ⊕⊝⊝⊝ | ‐ |
| Mean refractive error expressed as mean spherical equivalent post‐treatment. ‐ 6 months | The mean refractive error expressed as mean spherical equivalent post‐treatment. ‐ 6 months was 0 | MD 0 | ‐ | 66 | ⊕⊝⊝⊝ | ‐ |
| Mean higher‐order aberrations (HOAs) post‐treatment, measured by machine with wavefront sensor ‐ 6 months | The mean higher‐order aberrations (HOAs) post‐treatment, measured by machine with wavefront sensor ‐ 6 months was 0 | MD 0.02 higher | ‐ | 66 | ⊕⊝⊝⊝ | ‐ |
| Proportion of eyes that had lost 1 or more lines of best spectacle‐corrected visual acuity (BSCVA) posttreatment. ‐ 6 months | see comment | ‐ | ‐ | ‐ | ‐ | This outcome was not reported |
| Proportion of eyes with significant visual loss (loss of 2 or more lines from pretreatment BSCVA): 6 months | see comment | ‐ | ‐ | ‐ | ‐ | This outcome was not reported |
| Proportion of eyes with optical side effects, such as glare and halo: 6 months | see comment | ‐ | ‐ | ‐ | ‐ | This outcome was not reported |
| *The risk in the intervention group (and its 95% confidence interval) is based on the assumed risk in the comparison group and the relative effect of the intervention (and its 95% CI). | ||||||
| GRADE Working Group grades of evidence | ||||||
| aDowngraded for risk of bias. | ||||||
| Outcome or subgroup title | No. of studies | No. of participants | Statistical method | Effect size |
| 1.1 Proportion of eyes with uncorrected visual acuity (UCVA) of 20/20 or better post‐treatment: 6 months Show forest plot | 6 | 470 | Risk Ratio (IV, Random, 95% CI) | 1.00 [0.96, 1.03] |
| 1.1.1 Procedure PRK | 2 | 136 | Risk Ratio (IV, Random, 95% CI) | 0.95 [0.81, 1.12] |
| 1.1.2 Procedure LASIK | 4 | 334 | Risk Ratio (IV, Random, 95% CI) | 1.00 [0.96, 1.04] |
| 1.2 Proportion of eyes with uncorrected visual acuity (UCVA) of 20/20 or better post‐treatment:12 months Show forest plot | 1 | 70 | Risk Ratio (IV, Random, 95% CI) | 1.03 [0.86, 1.24] |
| 1.2.1 Procedure: PRK | 1 | 70 | Risk Ratio (IV, Random, 95% CI) | 1.03 [0.86, 1.24] |
| 1.3 Proportion of eyes that had lost 1 or more lines of best spectacle‐corrected visual acuity (BSCVA) posttreatment: 6 months Show forest plot | 3 | 151 | Risk Ratio (IV, Random, 95% CI) | 1.04 [0.93, 1.17] |
| 1.3.1 Procedure PRK | 1 | 80 | Risk Ratio (IV, Random, 95% CI) | 1.00 [0.93, 1.07] |
| 1.3.2 Procedure LASIK | 2 | 71 | Risk Ratio (IV, Random, 95% CI) | 1.11 [0.88, 1.40] |
| 1.4 Proportion of eyes without loss of 1 or more lines of best spectacle‐corrected visual acuity (BSCVA) posttreatment:12 months Show forest plot | 1 | 70 | Risk Ratio (IV, Random, 95% CI) | 0.94 [0.81, 1.09] |
| 1.4.1 Procedure PRK | 1 | 70 | Risk Ratio (IV, Random, 95% CI) | 0.94 [0.81, 1.09] |
| 1.5 Proportion of eyes within ± 0.50 diopters (D) of target refraction: 6 months Show forest plot | 4 | Risk Ratio (IV, Random, 95% CI) | Subtotals only | |
| 1.5.1 Procedure PRK | 3 | 192 | Risk Ratio (IV, Random, 95% CI) | 0.89 [0.78, 1.01] |
| 1.5.2 Procedure LASIK | 1 | 20 | Risk Ratio (IV, Random, 95% CI) | 1.11 [0.85, 1.44] |
| 1.6 Proportion of eyes within ± 0.50 diopters (D) of target refraction: 12 months Show forest plot | 1 | 70 | Risk Ratio (IV, Random, 95% CI) | 1.03 [0.86, 1.24] |
| 1.6.1 Procedure PRK | 1 | 70 | Risk Ratio (IV, Random, 95% CI) | 1.03 [0.86, 1.24] |
| 1.7 Mean refractive error expressed as mean spherical equivalent post‐treatment: 6 months Show forest plot | 8 | Mean Difference (IV, Random, 95% CI) | Subtotals only | |
| 1.7.1 Procedure PRK | 3 | 196 | Mean Difference (IV, Random, 95% CI) | 0.06 [‐0.09, 0.21] |
| 1.7.2 Procedure LASIK | 5 | 428 | Mean Difference (IV, Random, 95% CI) | 0.11 [‐0.05, 0.28] |
| 1.8 Mean refractive error expressed as mean spherical equivalent post‐treatment:12 months Show forest plot | 1 | 70 | Mean Difference (IV, Random, 95% CI) | 0.04 [‐0.11, 0.18] |
| 1.8.1 Procedure PRK | 1 | 70 | Mean Difference (IV, Random, 95% CI) | 0.04 [‐0.11, 0.18] |
| 1.9 Mean higher‐order aberrations (HOAs) microns post‐treatment, measured by machine with wavefront sensor: 1 month Show forest plot | 3 | Mean Difference (IV, Random, 95% CI) | Subtotals only | |
| 1.9.1 Procedure LASIK | 2 | 68 | Mean Difference (IV, Random, 95% CI) | ‐0.12 [‐0.22, ‐0.03] |
| 1.9.2 Procedure LASEK | 1 | 80 | Mean Difference (IV, Random, 95% CI) | ‐0.31 [‐0.38, ‐0.23] |
| 1.10 Mean higher‐order aberrations (HOAs) microns post‐treatment, measured by machine with wavefront sensor: 3 months Show forest plot | 5 | Mean Difference (IV, Random, 95% CI) | Subtotals only | |
| 1.10.1 Procedure PRK: 3 month | 1 | 132 | Mean Difference (IV, Random, 95% CI) | ‐0.04 [‐0.10, 0.02] |
| 1.10.2 Procedure LASIK: 3 month | 3 | 92 | Mean Difference (IV, Random, 95% CI) | ‐0.02 [‐0.04, 0.00] |
| 1.10.3 Procedure LASEK | 1 | 80 | Mean Difference (IV, Random, 95% CI) | ‐0.23 [‐0.26, ‐0.19] |
| 1.11 Mean higher‐order aberrations (HOAs) microns post‐treatment, measured by machine with wavefront sensor: 6 months Show forest plot | 2 | Mean Difference (IV, Random, 95% CI) | Totals not selected | |
| 1.11.1 Procedure PRK: 6 month | 2 | Mean Difference (IV, Random, 95% CI) | Totals not selected | |
| Outcome or subgroup title | No. of studies | No. of participants | Statistical method | Effect size |
| 2.1 Proportion of eyes with uncorrected visual acuity (UCVA) of 20/20 or better post‐treatment: 6 months Show forest plot | 5 | 444 | Risk Ratio (IV, Random, 95% CI) | 1.00 [0.98, 1.02] |
| 2.1.1 Procedure PRK | 1 | 104 | Risk Ratio (IV, Random, 95% CI) | 0.94 [0.87, 1.02] |
| 2.1.2 Procedure LASIK | 4 | 340 | Risk Ratio (IV, Random, 95% CI) | 1.00 [0.98, 1.02] |
| 2.2 Proportion of eyes with uncorrected visual acuity (UCVA) of 20/20 or better post‐treatment:12 months Show forest plot | 5 | 618 | Risk Ratio (IV, Random, 95% CI) | 1.00 [0.99, 1.02] |
| 2.2.1 Procedure PRK | 2 | 334 | Risk Ratio (IV, Random, 95% CI) | 1.02 [0.98, 1.06] |
| 2.2.2 Procedure LASIK | 3 | 284 | Risk Ratio (IV, Random, 95% CI) | 1.00 [0.98, 1.02] |
| 2.3 Proportion of eyes without loss of 1 or more lines of best spectacle‐corrected visual acuity (BSCVA) posttreatment: 6 months Show forest plot | 4 | 258 | Risk Ratio (IV, Random, 95% CI) | 0.99 [0.94, 1.04] |
| 2.3.1 Procedure PRK | 1 | 104 | Risk Ratio (IV, Random, 95% CI) | 1.00 [0.95, 1.06] |
| 2.3.2 Procedure LASIK | 3 | 154 | Risk Ratio (IV, Random, 95% CI) | 0.96 [0.85, 1.08] |
| 2.4 Proportion of eyes without loss of 1 or more lines of best spectacle‐corrected visual acuity (BSCVA) posttreatment:12 months. Show forest plot | 5 | 622 | Risk Ratio (IV, Random, 95% CI) | 0.99 [0.96, 1.02] |
| 2.4.1 Procedure PRK | 2 | 334 | Risk Ratio (IV, Random, 95% CI) | 1.01 [0.97, 1.05] |
| 2.4.2 Procedure LASIK | 3 | 288 | Risk Ratio (IV, Random, 95% CI) | 0.97 [0.94, 1.01] |
| 2.5 Proportion of eyes within ± 0.50 diopters (D) of target refraction post‐treatment: 6 months Show forest plot | 4 | 258 | Risk Ratio (IV, Random, 95% CI) | 0.93 [0.87, 1.00] |
| 2.5.1 Procedure PRK | 1 | 104 | Risk Ratio (IV, Random, 95% CI) | 0.94 [0.86, 1.03] |
| 2.5.2 Procedure LASIK | 3 | 154 | Risk Ratio (IV, Random, 95% CI) | 0.92 [0.81, 1.04] |
| 2.6 Proportion of eyes within ± 0.50 diopters (D) of target refraction post‐treatment:12 months Show forest plot | 4 | 480 | Risk Ratio (IV, Random, 95% CI) | 1.02 [0.95, 1.09] |
| 2.6.1 Procedure PRK | 1 | 192 | Risk Ratio (IV, Random, 95% CI) | 1.06 [0.97, 1.15] |
| 2.6.2 Procedure LASIK | 3 | 288 | Risk Ratio (IV, Random, 95% CI) | 0.97 [0.86, 1.11] |
| 2.7 Mean refractive error expressed as mean spherical equivalent post‐treatment: 6 months. Show forest plot | 4 | Mean Difference (IV, Random, 95% CI) | Subtotals only | |
| 2.7.1 Procedure PRK | 1 | 138 | Mean Difference (IV, Random, 95% CI) | 0.09 [‐0.02, 0.20] |
| 2.7.2 Procedure LASIK | 3 | 280 | Mean Difference (IV, Random, 95% CI) | ‐0.12 [‐0.19, ‐0.05] |
| 2.8 Mean refractive error expressed as mean spherical equivalent post‐treatment:12 months Show forest plot | 6 | Mean Difference (IV, Random, 95% CI) | Subtotals only | |
| 2.8.1 Procedure PRK | 2 | 334 | Mean Difference (IV, Random, 95% CI) | 0.07 [‐0.03, 0.18] |
| 2.8.2 Procedure LASIK | 4 | 472 | Mean Difference (IV, Random, 95% CI) | ‐0.14 [‐0.19, ‐0.09] |
| 2.9 Mean higher‐order aberrations (HOAs) microns post‐treatment, measured by machine with wavefront sensor: 1 month Show forest plot | 4 | Mean Difference (IV, Random, 95% CI) | Subtotals only | |
| 2.9.1 Procedure PRK | 1 | 140 | Mean Difference (IV, Random, 95% CI) | 0.03 [‐0.03, 0.09] |
| 2.9.2 Procedure LASIK | 3 | 296 | Mean Difference (IV, Random, 95% CI) | 0.03 [‐0.01, 0.07] |
| 2.10 Mean higher‐order aberrations (HOAs) microns post‐treatment, measured by machine with wavefront sensor: 3 months Show forest plot | 6 | Mean Difference (IV, Random, 95% CI) | Subtotals only | |
| 2.10.1 Procedure PRK | 2 | 182 | Mean Difference (IV, Random, 95% CI) | 0.06 [0.01, 0.11] |
| 2.10.2 Procedure LASIK | 4 | 318 | Mean Difference (IV, Random, 95% CI) | ‐0.01 [‐0.06, 0.04] |
| 2.11 Mean higher‐order aberrations (HOAs) microns post‐treatment, measured by machine with wavefront sensor: 6 months Show forest plot | 5 | 478 | Mean Difference (IV, Random, 95% CI) | 0.03 [0.00, 0.06] |
| 2.11.1 Procedure PRK | 1 | 138 | Mean Difference (IV, Random, 95% CI) | 0.06 [‐0.01, 0.13] |
| 2.11.2 Procedure LASIK | 4 | 340 | Mean Difference (IV, Random, 95% CI) | 0.03 [‐0.01, 0.06] |
| 2.12 Mean higher‐order aberrations (HOAs) microns post‐treatment, measured by machine with wavefront sensor: 12 months Show forest plot | 5 | 622 | Mean Difference (IV, Random, 95% CI) | 0.03 [‐0.01, 0.07] |
| 2.12.1 Procedure PRK | 2 | 334 | Mean Difference (IV, Random, 95% CI) | 0.02 [‐0.08, 0.13] |
| 2.12.2 Procedure LASIK | 3 | 288 | Mean Difference (IV, Random, 95% CI) | 0.03 [‐0.01, 0.06] |
| Outcome or subgroup title | No. of studies | No. of participants | Statistical method | Effect size |
| 3.1 Proportion of eyes with uncorrected visual acuity (UCVA) of 20/20 or better post‐treatment. Show forest plot | 1 | Risk Ratio (IV, Random, 95% CI) | Subtotals only | |
| 3.1.1 6 months | 1 | 66 | Risk Ratio (IV, Random, 95% CI) | 1.03 [0.93, 1.15] |
| 3.1.2 12 months | 1 | 66 | Risk Ratio (IV, Random, 95% CI) | 1.03 [0.93, 1.15] |
| 3.2 Proportion of eyes without loss of 1 or more lines of best spectacle‐corrected visual acuity (BSCVA) posttreatment. Show forest plot | 1 | Risk Ratio (IV, Random, 95% CI) | Subtotals only | |
| 3.2.1 12 months | 1 | 66 | Risk Ratio (IV, Random, 95% CI) | 1.03 [0.93, 1.15] |
| 3.3 Proportion of eyes within ± 0.50 diopters (D) of target refraction post‐treatment. Show forest plot | 1 | Risk Ratio (IV, Random, 95% CI) | Subtotals only | |
| 3.3.1 6 months | 1 | 66 | Risk Ratio (IV, Random, 95% CI) | 1.00 [0.92, 1.09] |
| 3.3.2 12 months | 1 | 66 | Risk Ratio (IV, Random, 95% CI) | 0.97 [0.82, 1.14] |
| 3.4 Mean refractive error expressed as mean spherical equivalent post‐treatment. Show forest plot | 1 | Mean Difference (IV, Random, 95% CI) | Subtotals only | |
| 3.4.1 6 months | 1 | 66 | Mean Difference (IV, Random, 95% CI) | 0.00 [‐0.13, 0.13] |
| 3.4.2 12 months | 1 | 66 | Mean Difference (IV, Random, 95% CI) | 0.01 [‐0.18, 0.20] |
| 3.5 Mean higher‐order aberrations (HOAs) microns post‐treatment, measured by machine with wavefront sensor Show forest plot | 1 | Mean Difference (IV, Random, 95% CI) | Subtotals only | |
| 3.5.1 1 month | 1 | 66 | Mean Difference (IV, Random, 95% CI) | ‐0.06 [‐0.15, 0.03] |
| 3.5.2 3 months | 1 | 66 | Mean Difference (IV, Random, 95% CI) | 0.00 [‐0.07, 0.07] |
| 3.5.3 6 months | 1 | 66 | Mean Difference (IV, Random, 95% CI) | 0.02 [‐0.05, 0.09] |
| 3.5.4 12 months | 1 | 66 | Mean Difference (IV, Random, 95% CI) | ‐0.01 [‐0.09, 0.07] |