Tratamiento adyuvante con antidepresivos para la enfermedad intestinal inflamatoria
Información
- DOI:
- https://doi.org/10.1002/14651858.CD012680.pub2Copiar DOI

- Base de datos:
-
- Cochrane Database of Systematic Reviews
- Versión publicada:
-
- 12 abril 2019see what's new
- Tipo:
-
- Intervention
- Etapa:
-
- Review
- Grupo Editorial Cochrane:
-
Grupo Cochrane de Salud digestiva
- Copyright:
-
- Copyright © 2019 The Cochrane Collaboration. Published by John Wiley & Sons, Ltd.
Cifras del artículo
Altmetric:
Citado por:
Autores
Contributions of authors
Antonina Mikocka‐Walus: content expert (psychology), conceived the project, developed the protocol, coordinated authors, entered the protocol details into RevMan, and will be responsible for the full review and updates.
Stephanie L. Prady: methodological expert, contributed to the review conduct.
Justyna Pollok: methodological expert, contributed to the review conduct.
Adrian Esterman: methodological expert, contributed to the review conduct.
Andrea Gordon: content expert (pharmacology), contributed to the review conduct.
Simon R. Knowles: content expert (psychology), contributed to the review conduct.
Jane M. Andrews: content expert (gastroenterology), contributed to the review conduct.
Sources of support
Internal sources
-
Authors' salaries are funded by their institutions, Other.
Salaries
External sources
-
No sources of support supplied
Declarations of interest
Antonina Mikocka‐Walus: None known.
Stephanie L. Prady: None known
Justyna Pollok: None known.
Adrian Esterman: None known.
Andrea Gordon: None known.
Simon R. Knowles: He has served as a consultant for AbbVie and Shire ‐ these activities are outside the submitted work.
Jane M. Andrews: She has served as a consultant for AbbVie, Abbott, Allergan, Bayer, Celgene, Ferring, Janssen, Pfizer, Takeda, MSD, Shire ‐ these activities are outside the submitted work.
Antonina Mikocka‐Walus, Andrea Gordon, Adrian Esterman and Jane Andrews are co‐authors of a trial that was included in this systematic review (Mikocka‐Walus 2016c). Data extraction and risk of bias assessment for this study were carried out by Justyna Pollok, Stephanie Prady and Simon Knowles.
Acknowledgements
Funding for the Cochrane IBD Group (May 1, 2017 ‐ April 30, 2022) has been provided by Crohn's and Colitis Canada (CCC).
We would like to thank the authors of Chojnacki 2011 for providing additional information about their study.
Version history
| Published | Title | Stage | Authors | Version |
| 2019 Apr 12 | Adjuvant therapy with antidepressants for the management of inflammatory bowel disease | Review | Antonina Mikocka‐Walus, Stephanie L Prady, Justyna Pollok, Adrian J Esterman, Andrea L Gordon, Simon Knowles, Jane M Andrews | |
| 2017 Jul 06 | Adjuvant therapy with antidepressants for the management of inflammatory bowel disease | Protocol | Antonina Mikocka‐Walus, Andrea Fielder, Stephanie L Prady, Adrian J Esterman, Simon Knowles, Jane M Andrews | |
Differences between protocol and review
The Primary and Tertiary outcomes were previously specified as "Changes in [a scale]...", but after consideration, we decided to include studies that report outcomes not only as changes, but also between group differences. The "Changes in [a scale]..." phrasing was omitted to just listing the type of outcome and the type of scale, e.g. "Anxiety and depression as measured by any well‐established anxiety or depression scale". Further, to this we reworded 'validated' to 'well‐established'. While well‐established scales are usually validated, some scales, such as the CDAI, are actually not appropriately validated while they are widely used and performs well in studies.
Further, following feedback from the editors and peer‐reviewers, and to simplify data reporting, we reordered our outcome measures. Efficacy, in terms of symptoms of anxiety and depression, was considered the primary outcome measure in the review. Safety ‐ adverse events and serious adverse events, study withdrawals due to adverse events, and other efficacy measures such as QoL, clinical remission, relapse, pain, hospital admissions, surgery, need for steroid treatment were considered secondary outcome measures. Tertiary outcome measures were moved under secondary outcome measures. Clinical remission and relapse were simplified ‐ we have now removed the comments regarding 'at completion' and 'at follow‐up'. We also reordered our objectives, with the assessment of anxiety and depression being the primary objective, and the remaining objectives being secondary. We changed the word 'managing' to 'treating' for objective 1 and for 'improving' for objective 2.
We decided to not run the search of The UK National Research Register as at the moment of the search it was considered an archived site which was no longer updated. Instead we searched the EU clinical trials register.
Keywords
MeSH
Medical Subject Headings (MeSH) Keywords
Medical Subject Headings Check Words
Humans;
PICO

Study flow diagram.

Risk of bias summary: review authors' judgements about each risk of bias item for each included study.
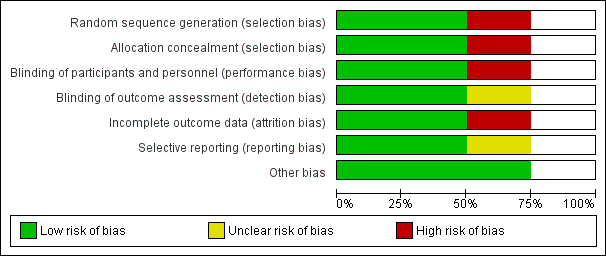
Risk of bias graph: review authors' judgements about each risk of bias item presented as percentages across all included studies.

Comparison 1 Antidepressants versus placebo, Outcome 1 Anxiety at 12 weeks.

Comparison 1 Antidepressants versus placebo, Outcome 2 Anxiety at 12 months.

Comparison 1 Antidepressants versus placebo, Outcome 3 Depression at 12 weeks.

Comparison 1 Antidepressants versus placebo, Outcome 4 Depression at 12 months.

Comparison 1 Antidepressants versus placebo, Outcome 5 Adverse events at 12 months.
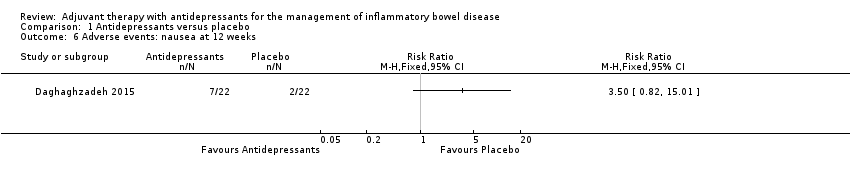
Comparison 1 Antidepressants versus placebo, Outcome 6 Adverse events: nausea at 12 weeks.

Comparison 1 Antidepressants versus placebo, Outcome 7 Adverse events: nausea at 12 months.

Comparison 1 Antidepressants versus placebo, Outcome 8 Study withdrawal due to adverse events at 12 weeks.
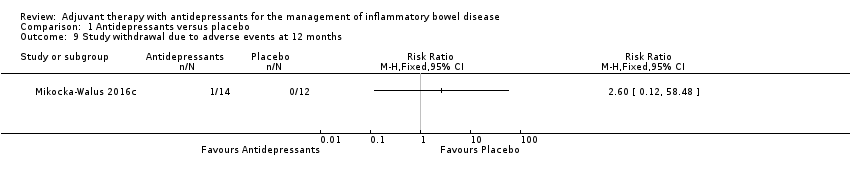
Comparison 1 Antidepressants versus placebo, Outcome 9 Study withdrawal due to adverse events at 12 months.

Comparison 1 Antidepressants versus placebo, Outcome 10 Physical QoL at 12 weeks.
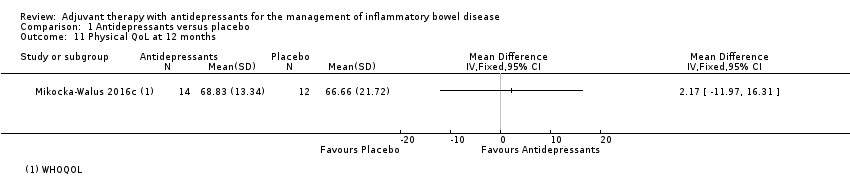
Comparison 1 Antidepressants versus placebo, Outcome 11 Physical QoL at 12 months.

Comparison 1 Antidepressants versus placebo, Outcome 12 Psychological QoL at 12 weeks.

Comparison 1 Antidepressants versus placebo, Outcome 13 Psychological QoL at 12 months.

Comparison 1 Antidepressants versus placebo, Outcome 14 Social QoL at 12 weeks.
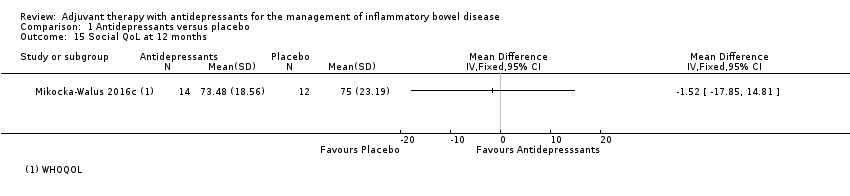
Comparison 1 Antidepressants versus placebo, Outcome 15 Social QoL at 12 months.

Comparison 1 Antidepressants versus placebo, Outcome 16 Environmental QoL at 12 weeks.
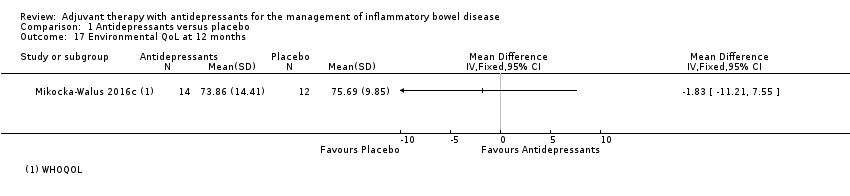
Comparison 1 Antidepressants versus placebo, Outcome 17 Environmental QoL at 12 months.
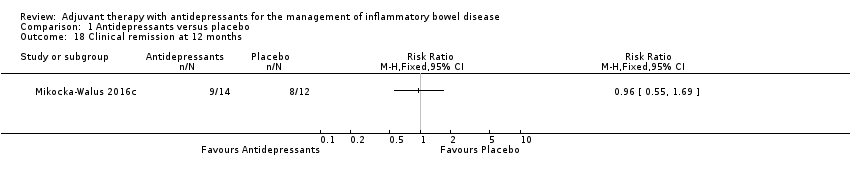
Comparison 1 Antidepressants versus placebo, Outcome 18 Clinical remission at 12 months.
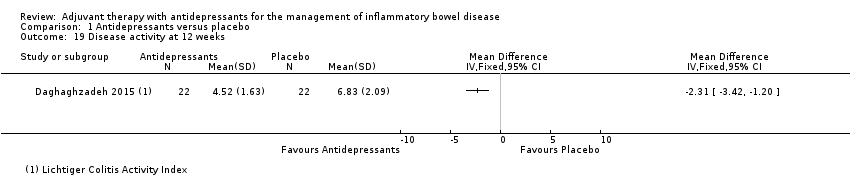
Comparison 1 Antidepressants versus placebo, Outcome 19 Disease activity at 12 weeks.
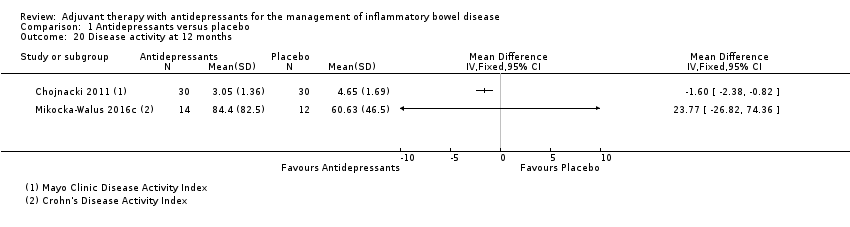
Comparison 1 Antidepressants versus placebo, Outcome 20 Disease activity at 12 months.
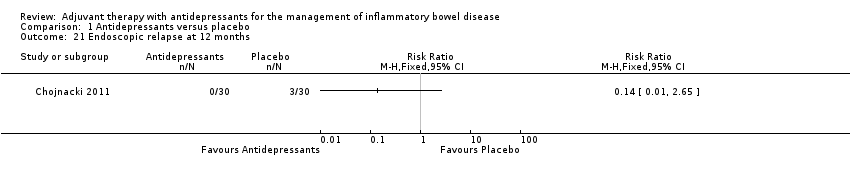
Comparison 1 Antidepressants versus placebo, Outcome 21 Endoscopic relapse at 12 months.

Comparison 1 Antidepressants versus placebo, Outcome 22 Relapse using faecal calprotectin at 12 months.

Comparison 1 Antidepressants versus placebo, Outcome 23 CRP at 12 months.

Comparison 1 Antidepressants versus placebo, Outcome 24 Cytokines TH Effector Memory RA at 6 months.
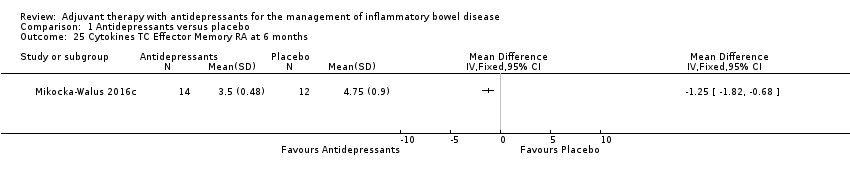
Comparison 1 Antidepressants versus placebo, Outcome 25 Cytokines TC Effector Memory RA at 6 months.
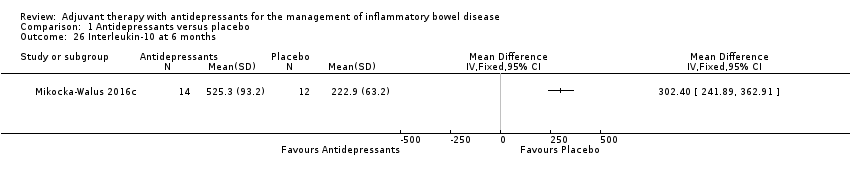
Comparison 1 Antidepressants versus placebo, Outcome 26 Interleukin‐10 at 6 months.
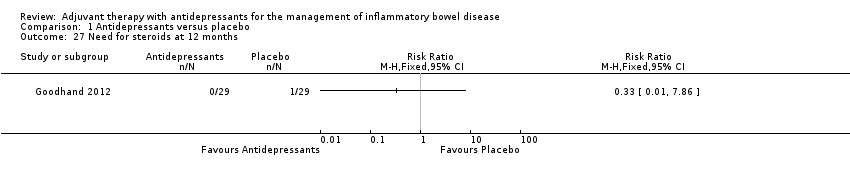
Comparison 1 Antidepressants versus placebo, Outcome 27 Need for steroids at 12 months.
| Antidepressants compared to placebo for inflammatory bowel disease | ||||||
| Patient or population: participants with active and inactive inflammatory bowel disease | ||||||
| Outcomes | Anticipated absolute effects* (95% CI) | Relative effect | № of participants | Certainty of the evidence | Comments | |
| Risk with Placebo | Risk with Antidepressants | |||||
| Anxiety at 12 weeks | The mean anxiety was 8.5 (SD = 3.45) | The mean anxiety was 6.11 (SD = 3) MD 2.39 lower | ‐ | 44 | ⊕⊕⊝⊝ | Anxiety was assessed using the HADS |
| Anxiety at 12 months | The mean anxiety was 4.2 (SD = 4.9) | The mean anxiety was 3.8 (SD = 2.5) MD ‐0.40 lower | ‐ | 26 | ⊕⊕⊝⊝ | Anxiety was assessed using the HADS A second non‐randomised study using the HARS reported a mean score of 12.65 + 3.76 in the antidepressant group (n = 30) compared to 17.85 + 3.33 in the placebo group (n = 30) (MD ‐5.20, 95% CI ‐7 to ‐3.40; very low certainty evidence) |
| Depression at 12 weeks | The mean depression was 10.5 (SD = 3.57) | The mean depression was 7.47 (SD = 2.42) MD ‐3.03 lower | ‐ | 44 | ⊕⊕⊝⊝ | Depression was assessed using the HADS |
| Depression at 12 months | The mean depression was 3.1 (SD = 3.4) | The mean depression was 2.9 (SD = 2.8) MD ‐0.20 lower | ‐ | 26 | ⊕⊕⊝⊝ | Depression was assessed using the HADS A second non‐randomised study using the Beck Depression Inventory reported a mean score of 9.6 + 2.76 in the antidepressant group (n = 30) compared to 16.35 + 5.41 in the placebo group (n = 30) (MD ‐6.75, 95% CI ‐8.92 to ‐4.58; very low certainty evidence) |
| Adverse events at 12 months | 250 per 1,000 | 573 per 1,000 | RR 2.29 | 26 | ⊕⊕⊝⊝ | Commonly reported adverse events include nausea, headache, dizziness, drowsiness, sexual problems, insomnia, fatigue, low mood/anxiety, dry mouth muscle spasms and hot flushes None of the included studies reported any serious adverse events |
| Quality of life | ‐ | ‐ | See comment | 70 | ⊕⊕⊝⊝ | Quality of life was assessed using the WHO‐QOL‐BREF We were unable to pool data as the outcome was reported at 12 weeks in 1 trial (44 participants) and 12 months in 1 trial (26 participants). Physical, Psychological, Social and Environmental QoL were improved only at 12 weeks with no group difference at 12 months |
| Pain | Not reported | No studies reported this outcome | ||||
| Maintenance of remission at 12 months | 667 per 1,000 | 640 per 1,000 | RR 0.96 | 26 | ⊕⊕⊝⊝ | Maintenance of remission was measured by the CDAI (< 150) and fecal calprotectin levels |
| Endoscopic relapse at 12 months | 0 per 1,000 | 0 per 1,000 | RR 0.14 | 60 | ⊕⊝⊝⊝ | Non‐randomised study. We were unable to calculate absolute effects. Endoscopic relapse occurred in 0% (0/30) of participants in the antidepressants group compared to 10% (3/30) in the placebo group |
| *The risk in the intervention group (and its 95% confidence interval) is based on the assumed risk in the comparison group and the relative effect of the intervention (and its 95% CI). | ||||||
| GRADE Working Group grades of evidence | ||||||
| 1 Downgraded one level due to serious imprecision (44 participants) 2 Downgraded one level due to high risk of bias (incomplete outcome data) 3 Downgraded two levels due very serious imprecision (26 participants) 4 Downgraded two levels due very serious imprecision (11 events) 5 Downgraded two levels due very serious imprecision (17 events). 6 Downgraded one level due to very serious imprecision (3 events) and a large CI around the point estimate | ||||||
| Case Control Study | Is the case definition adequate? (/1) | Representativeness of the cases (/1) | Selection of controls (/1) | Definition of controls (/1) | Comparability of cases and controls on the basis of the design or analysis (/2) | Assessment of exposure (/1) | Same method of ascertainment for cases and controls (/1) | Non‐Response Rate (/1) | |
| Goodhand (2012) | 1 | ‐ | 1 | ‐ | 2 | 1 | 1 | 1 | 7 |
| Outcome or subgroup title | No. of studies | No. of participants | Statistical method | Effect size |
| 1 Anxiety at 12 weeks Show forest plot | 1 | Mean Difference (IV, Fixed, 95% CI) | Totals not selected | |
| 2 Anxiety at 12 months Show forest plot | 2 | Mean Difference (IV, Fixed, 95% CI) | Totals not selected | |
| 3 Depression at 12 weeks Show forest plot | 1 | Mean Difference (IV, Fixed, 95% CI) | Totals not selected | |
| 4 Depression at 12 months Show forest plot | 2 | Mean Difference (IV, Fixed, 95% CI) | Totals not selected | |
| 5 Adverse events at 12 months Show forest plot | 1 | Risk Ratio (M‐H, Fixed, 95% CI) | Totals not selected | |
| 6 Adverse events: nausea at 12 weeks Show forest plot | 1 | Risk Ratio (M‐H, Fixed, 95% CI) | Totals not selected | |
| 7 Adverse events: nausea at 12 months Show forest plot | 2 | 86 | Risk Ratio (M‐H, Fixed, 95% CI) | 4.02 [0.74, 22.03] |
| 8 Study withdrawal due to adverse events at 12 weeks Show forest plot | 1 | Risk Ratio (M‐H, Fixed, 95% CI) | Totals not selected | |
| 9 Study withdrawal due to adverse events at 12 months Show forest plot | 1 | Risk Ratio (M‐H, Fixed, 95% CI) | Totals not selected | |
| 10 Physical QoL at 12 weeks Show forest plot | 1 | Mean Difference (IV, Fixed, 95% CI) | Totals not selected | |
| 11 Physical QoL at 12 months Show forest plot | 1 | Mean Difference (IV, Fixed, 95% CI) | Totals not selected | |
| 12 Psychological QoL at 12 weeks Show forest plot | 1 | Mean Difference (IV, Fixed, 95% CI) | Totals not selected | |
| 13 Psychological QoL at 12 months Show forest plot | 1 | Mean Difference (IV, Fixed, 95% CI) | Totals not selected | |
| 14 Social QoL at 12 weeks Show forest plot | 1 | Mean Difference (IV, Fixed, 95% CI) | Totals not selected | |
| 15 Social QoL at 12 months Show forest plot | 1 | Mean Difference (IV, Fixed, 95% CI) | Totals not selected | |
| 16 Environmental QoL at 12 weeks Show forest plot | 1 | Mean Difference (IV, Fixed, 95% CI) | Totals not selected | |
| 17 Environmental QoL at 12 months Show forest plot | 1 | Mean Difference (IV, Fixed, 95% CI) | Totals not selected | |
| 18 Clinical remission at 12 months Show forest plot | 1 | Risk Ratio (M‐H, Fixed, 95% CI) | Totals not selected | |
| 19 Disease activity at 12 weeks Show forest plot | 1 | Mean Difference (IV, Fixed, 95% CI) | Totals not selected | |
| 20 Disease activity at 12 months Show forest plot | 2 | Mean Difference (IV, Fixed, 95% CI) | Totals not selected | |
| 21 Endoscopic relapse at 12 months Show forest plot | 1 | Risk Ratio (M‐H, Fixed, 95% CI) | Totals not selected | |
| 22 Relapse using faecal calprotectin at 12 months Show forest plot | 1 | Risk Ratio (M‐H, Fixed, 95% CI) | Totals not selected | |
| 23 CRP at 12 months Show forest plot | 1 | Mean Difference (IV, Fixed, 95% CI) | Totals not selected | |
| 24 Cytokines TH Effector Memory RA at 6 months Show forest plot | 1 | Mean Difference (IV, Fixed, 95% CI) | Totals not selected | |
| 25 Cytokines TC Effector Memory RA at 6 months Show forest plot | 1 | Mean Difference (IV, Fixed, 95% CI) | Totals not selected | |
| 26 Interleukin‐10 at 6 months Show forest plot | 1 | Mean Difference (IV, Fixed, 95% CI) | Totals not selected | |
| 27 Need for steroids at 12 months Show forest plot | 1 | Risk Ratio (M‐H, Fixed, 95% CI) | Totals not selected | |