Ejercicio físico para los pacientes con cirrosis
Resumen
Antecedentes
La pérdida de masa muscular y la debilidad muscular son complicaciones comunes de la cirrosis y se asocian con mayor morbimortalidad. Por lo tanto, el ejercicio físico puede beneficiar a los pacientes con cirrosis.
Objetivos
Evaluar los efectos beneficiosos y perjudiciales del ejercicio físico versus ejercicio simulado o ningún ejercicio en los pacientes con cirrosis.
Métodos de búsqueda
Se realizaron búsquedas en el registro Cochrane de ensayos controlados del Grupo Cochrane Hepatobiliar (Cochrane Hepato‐Biliary Group Controlled Trials Register), Registro Cochrane Central de Ensayos Controlados (Cochrane Central Register of Controlled Trials, CENTRAL), MEDLINE Ovid, Embase Ovid y en otras tres bases de datos, que incluyen búsquedas manuales en listas de referencias, resúmenes y presentaciones en conferencias y congresos, Google Scholar y en registros de ensayos en línea en febrero de 2018.
Criterios de selección
Se incluyeron ensayos clínicos con asignación aleatoria, independientemente del estado de la publicación o del idioma. El criterio de inclusión fue la cirrosis, independientemente de la etiología o el estadio. Las intervenciones fueron el ejercicio físico en comparación con el ejercicio simulado o ninguna intervención.
Obtención y análisis de los datos
Tres autores de la revisión extrajeron los datos de forma independiente. Se realizaron metanálisis y los resultados se presentaron mediante cocientes de riesgos (CR) para los resultados dicotómicos y diferencias de medias (DM) para los resultados continuos, ambos con intervalos de confianza (IC) del 95% y valores de I2 como marcadores de la imprecisión y la heterogeneidad. El control de sesgo se evaluó con los dominios del Grupo Cochrane Hepatobiliar, y la credibilidad de la evidencia se determinó mediante los criterios GRADE.
Resultados principales
Se incluyeron seis ensayos clínicos aleatorios con 173 participantes. Todos los participantes presentaban cirrosis en estadio A o B de la escala de Child‐Pugh. Los grupos de intervención participaron en ocho a 14 semanas de ejercicio físico (aeróbico: tres ensayos; resistencia: un ensayo; o aeróbico más entrenamiento con resistencia: dos ensayos). Los grupos control realizaron ejercicio simulado (relajación supervisada: un ensayo) o ninguna intervención (cinco ensayos). No se registraron muertes entre los 89 participantes asignados al ejercicio versus dos de 84 participantes del grupo control (CR 0,19; IC del 95%: 0,01 a 3,73; evidencia de calidad moderada). La causa de muerte fue un episodio agudo de la enfermedad hepática crónica en ambos participantes. Nueve participantes del grupo de ejercicio y 13 del grupo control presentaron eventos adversos graves (CR 0,61; IC del 95%: 0,19 a 1,94; evidencia de baja calidad).
El ejercicio físico no mostró efectos beneficiosos ni perjudiciales sobre la calidad de vida relacionada con la salud, evaluada con el Chronic Liver Disease Questionnaire (DM 0,11; IC del 95%: ‐0,44 a 0,67; evidencia de baja calidad). Asimismo, el ejercicio físico no tuvo efectos claros sobre el estado físico medido por la captación máxima de oxígeno durante el ejercicio (DM 0,3 ml/kg/min; IC del 95%: ‐2,74 a 3,35; evidencia de baja calidad) y la prueba de caminata de seis minutos (DM 56,06 min; IC del 95%: ‐9,14 a 121,26; evidencia de muy baja calidad). El ejercicio físico no mostró efectos claros sobre la circunferencia en la zona media del muslo (DM 1,76 cm; IC del 95%: ‐0,26 a 3,77; evidencia de calidad baja), pero mostró un aumento en la circunferencia de la región media del brazo (DM 2,61 cm; IC del 95%: 0,36 a 4,85; evidencia de baja calidad).
Conclusiones de los autores
No se encontraron efectos beneficiosos ni perjudiciales claros del ejercicio físico sobre la mortalidad, la morbilidad o la calidad de vida relacionada con la salud. Se necesita evidencia adicional para evaluar los efectos beneficiosos y perjudiciales del ejercicio físico sobre los resultados clínicos.
PICO
Resumen en términos sencillos
¿El ejercicio físico tiene efectos beneficiosos o perjudiciales en la cirrosis?
Antecedentes
El daño prolongado del hígado puede llevar a la formación de tejido cicatrizal, que reemplaza el tejido hepático sano y resulta en daño crónico (cirrosis). Los pacientes con cirrosis a menudo presentan pérdida de masa y fuerza muscular. Por lo tanto, en estos pacientes puede ser beneficioso el ejercicio físico.
Pregunta de la revisión
Se investigaron los efectos beneficiosos y perjudiciales del ejercicio físico en comparación con el ejercicio simulado (por ejemplo, sesiones de relajación supervisadas) o ningún ejercicio en pacientes con cirrosis.
Fecha de la búsqueda
Febrero de 2018.
Fuentes de financiación de los estudios
Ninguno de los ensayos incluidos recibió financiamiento o apoyo de la industria farmacéutica ni de fabricación de aparatos.
Características de los estudios
Se incluyeron seis ensayos clínicos aleatorios (en que los individuos son asignados al azar a uno de dos grupos) con 173 participantes. Todos los participantes presentaban cirrosis. Las intervenciones consistieron en diferentes tipos de ejercicios, como montar en bicicleta, caminata en cinta rodante y levantamiento de pesas. Los programas fueron domiciliarios o supervisados y duraron entre ocho y 14 semanas.
Resultados clave
El ejercicio físico no pareció afectar la mortalidad (muerte), los efectos secundarios o la calidad de vida.
Calidad de la evidencia
En general, la evidencia del efecto del ejercicio físico fue de calidad baja o muy baja. La calidad de la evidencia se disminuyó debido a la falta de ensayos con bajo riesgo de sesgo y de resultados similares entre los ensayos y al reducido tamaño de los ensayos.
Authors' conclusions
Summary of findings
| Exercise compared to no exercise for people with cirrhosis | ||||||
| Patient or population: people with Child‐Pugh stage A or B cirrhosis | ||||||
| Outcomes | Anticipated absolute effects* (95% CI) | Relative effect | № of participants | Qualityof the evidence | Comments | |
| Risk with no exercise | Risk with exercise | |||||
| All‐cause mortality | Study population | RR 0.19 | 173 | ⊕⊕⊕⊝ | ||
| 24 per 1000 | 5 per 1000 | |||||
| Serious adverse events | Study population | RR 0.61 | 173 | ⊕⊕⊝⊝ | — | |
| 155 per 1000 | 94 per 1000 | |||||
| Health‐related quality of life ‐ CLDQ (total score 1–7, high score corresponds to a better HRQoL) | The mean quality of life ‐ CLDQ (total score) ranged from 5.03 to 5.39 | MD 0.11 higher | — | 81 | ⊕⊕⊝⊝ | — |
| Anthropometric measurements: mid‐arm circumference (cm) | The mean mid‐arm circumference (cm) ranged from 27.1 to 31.5 | MD 2.61 higher | — | 72 | ⊕⊕⊝⊝ | — |
| Anthropometric measurements: mid‐thigh circumference (cm) | The mean mid‐thigh circumference (cm) ranged from 51.8 to 54.6 | MD 1.76 higher | — | 128 | ⊕⊕⊝⊝ | — |
| Physical fitness: peak exercise oxygen uptake (mL/kg/minute) | The mean peak exercise oxygen uptake (mL/kg/minute) ranged from 21.2 to 26.1 | MD 0.3 higher | — | 100 | ⊕⊕⊝⊝ | — |
| Physical fitness: 6‐Minute Walk Test (min in total) | The mean 6‐Minute Walk Test (min in total) ranged from 309 to 546 | MD 56.06 higher | — | 105 | ⊕⊝⊝⊝ | — |
| *The risk in the intervention group (and its 95% confidence interval) is based on the assumed risk in the comparison group and the relative effect of the intervention (and its 95% CI). CI: confidence interval; CLDQ: Chronic Liver Disease Questionnaire; HRQoL: health‐related quality of life; MD: mean difference; RCT: randomised clinical trial; RR: risk ratio | ||||||
| GRADE Working Group grades of evidence | ||||||
| aDowngraded one level due to serious imprecision (insufficient statistical power). | ||||||
Background
Description of the condition
Cirrhosis is responsible for 2% of all deaths globally and is associated with decreased health‐related quality of life (Marchesini 2001; Zatoński 2010; Mokdad 2014; Scaglione 2015). Malnutrition and consequently sarcopenia are common complications of cirrhosis; both are associated with increased mortality and morbidity (Saunders 1981; D'Amico 1986; de Jongh 1992; D'Amico 2006; Dasarathy 2012; Montano‐Loza 2012; Periyalwar 2012; Hayashi 2013; Meza‐Junco 2013; Thiele 2013; Córdoba 2014; Montano‐Loza 2014). Important contributing factors include poor dietary intake, hypermetabolism, increased protein loss to the intestines, and decreased protein synthesis in the liver which leads to loss of skeletal muscle mass and muscle strength. Even after liver transplantation, pretransplant exercise capacity predicts post‐transplant survival (Jones 2012; Lemyze 2013). Decreased exercise capacity predicts mortality, irrespective of the aetiology of the underlying liver disease (Biagini 2006; Hollingsworth 2008; Cerri 2010; Hollingsworth 2010; Galant 2012). Reduced exercise capacity is associated with the severity of the underlying liver disease, but even people with compensated cirrhosis are affected compared to healthy people (Hayashi 2012; Galant 2013).
Physical fitness predicts morbidity and mortality in several populations (Puhan 2013; Bernal 2014; Hellberg 2014). Muscle wasting is difficult to diagnose in the clinical setting, where symptoms such as weakness and fatigue are diffuse and likely to be present in people with chronic disease. The available methods have limitations primarily due to a lack of objectivity, reproducibility, and prognosis discrimination (Periyalwar 2012; Montano‐Loza 2014). Trials that include people without cirrhosis include body mass index (BMI) to indicate muscle mass and malnutrition (Woo 2015). However, in people with cirrhosis, ascites and peripheral oedema can affect the assessment of BMI. Other physical measurements, which include assessment of the grip‐strength, appendicular lean mass, knee flexion, and knee extension, are objective but have low reproducibility (McLean 2014). Clinical studies have used computed tomography scan, magnetic resonance imaging and dual energy x‐ray absorptiometry to quantify muscle mass (Dasarathy 2012; Montano‐Loza 2013; Román 2014), and the peak and maximum oxygen consumption to quantify exercise capacity/physical fitness (Bandi 1998; Degoricija 2003; Faustini‐Pereira 2015).
Description of the intervention
The management of people with cirrhosis is aimed at controlling and alleviating cirrhosis‐related complications. Liver transplantation may be curative, but this option is both costly and often unavailable due to donor shortage. Insertion of a transjugular intrahepatic portosystemic shunt, which reduces portal pressure, may reverse sarcopenia (Tsien 2013). However, the complications include hepatic encephalopathy and heart failure. Previous studies show that sarcopenia is the primary nutritional consequence of malnutrition but factors such as metabolic changes, chronic inflammation, and haemodynamic changes are also important (Periyalwar 2012; Montano‐Loza 2013). Improved nutrition may not in itself be enough to reverse sarcopenia. Physical exercise enhances or maintains physical muscle strength (Nelson 2007), but it also beneficially affects muscle mass, weight, and the cardiovascular system (Román 2014; Zenith 2014). The main types of physical exercise include aerobic exercise, resistance training (anaerobic exercise), flexibility, and balance. Aerobic exercise increases the uptake of oxygen in the larger muscle groups and has a beneficial effect on cardiovascular homeostasis. Resistance training mainly affects muscle strength and mass whereas flexibility and balance exercise improve the range of motion necessary for daily activity and diminish the risk of falls (NIH 2006; Nelson 2007).
How the intervention might work
The expected effects of physical exercise in people with cirrhosis are complex. Exercise improves glucose metabolism in both men and women, and aerobic as well as anaerobic exercise improve insulin sensitivity (Mikines 1989). This effect is important considering the known association between cirrhosis and insulin resistance (Campillo 1990a; Goswami 2014). Cirrhosis is also associated with a disrupted balance in protein synthesis and degradation (Morrison 1990). Repeated performance of resistance training for longer periods causes hypertrophy of skeletal muscle, as it increases muscle protein turnover. Following resistance training, protein synthesis is elevated for up to 48 hours and the synthesis of protein is regulated primarily at the level of translation and involves changes in signal transduction (Bolster 2004). The mammalian target of rapamycin (mTOR) is the important regulator of muscle protein synthesis.
In liver failure, ammonia removal in the liver is reduced and muscle can act as an alternative route of ammonia detoxification (Dam 2011). Physical exercise causes skeletal muscle hypertrophy, and hence may enhance the removal of ammonia. This decreases the risk of developing hepatic encephalopathy (Córdoba 2008). Increased ammonia concentration leads to autophagy (Polletta 2015), which also contributes to sarcopenia. Physical exercise may lower ammonia concentrations and ameliorate the sarcopenia. Finally, cirrhosis is a proinflammatory state that contributes to the development of sarcopenia and decreased protein synthesis. Studies showed that exercise limits systemic inflammation (Lavie 2011); thus, it might decrease protein degradation and support muscle protein synthesis.
Why it is important to do this review
There is a large body of evidence that shows the negative clinical consequences of the reduced exercise capacity in cirrhosis. People with cirrhosis are less physically active than healthy people and supervised exercise is generally recommended (Hayashi 2012). However, the optimum exercise programme is not known (Toshikuni 2014). Several randomised clinical trials (RCTs) have evaluated the effect of exercise versus no intervention for people with cirrhosis (Román 2014; Zenith 2014; Román 2016). One RCT including 19 participants with cirrhosis evaluated eight weeks of aerobic exercise versus no intervention (Zenith 2014). The trial found that exercise increased peak oxygen consumption and muscle mass and reduced fatigue. Another RCT with 17 participants evaluated exercise capacity, muscle mass, and health‐related quality of life after a 12‐week supervised exercise programme versus no intervention (Román 2014). The trial found a beneficial effect of exercise on all three outcomes. The increased muscle mass may theoretically also reduce blood ammonia levels, and, therefore, be associated with a beneficial effect on hepatic encephalopathy (Córdoba 2008). One RCT found a beneficial effect of exercise versus no intervention on ammonia (Román 2014), but others found that blood ammonia increased (Sinniah 1970). The difference may reflect the severity of the underlying liver disease, as well as the intensity level of the exercise. At present, there are no studies that show a beneficial effect on manifestations of hepatic encephalopathy. However, current evidence remains inconclusive, and a potential damaging effect remains possible in certain groups. Furthermore, physical exercise may have a detrimental effect on portal pressure and blood flow to the muscles and brain in people with cirrhosis (Bandi 1998; García‐Pagàn 1998; Premaratna 2002; Bay Nielsen 2005). One study that included 39 participants found that cirrhosis was associated with reduced oxygen consumption, myocardial thickening, and ventricular stiffness leading to decreased diastolic function as well as inotropic and chronotropic incompetence under conditions of stress (Wong 2001). Accordingly, cirrhotic cardiomyopathy may worsen the reduced exercise capacity but also negatively affect the beneficial effect of aerobic exercise. Likewise, one RCT that included 25 participants with cirrhosis found that moderate physical exercise combined with propranolol versus placebo increased the hepatic venous pressure gradient (HVPG) and decreased hepatic blood flow (Bandi 1998). Exercise also has a potential detrimental effect on pulmonary gas exchange (Lemyze 2011; Lemyze 2013) and on electrocardiogram changes such as ST segment depression in the absence of coronary artery stenosis (Mori 2007). Theoretically, redistribution of blood from splanchnic organs to the central circulation could limit blood supply to skeletal muscles and the brain during exercise. However, one study that evaluated incremental cycling to exhaustion found that blood redistribution from splanchnic organs did not limit blood flow to the muscles or the brain (Bay Nielsen 2005). Therefore, the body of evidence is complex. We have not identified any systematic reviews that evaluate the effects of physical exercise on people with cirrhosis.
Objectives
To assess the beneficial and harmful effects of physical exercise versus sham exercise or no exercise for people with cirrhosis.
Methods
Criteria for considering studies for this review
Types of studies
We included RCTs regardless of publication status or language. During the selection of trials, we watched out for observational studies (i.e. quasi‐randomised studies, cohort studies, or patient reports) that reported adverse events caused by or associated with the interventions in our review. However, we did not specifically search for such observational studies for inclusion in this review, which is a known limitation of our systematic review.
Types of participants
We included participants with cirrhosis of any age or sex, irrespective of the severity or aetiology.
Types of interventions
Any form of exercise, irrespective of the type, intensity, or duration of the intervention versus sham exercise or no exercise.
We allowed cointerventions such as diets, non‐absorbable disaccharides, or antibiotics if administered equally to the intervention and control group.
Types of outcome measures
We evaluated all outcomes at the maximum follow‐up.
Primary outcomes
-
All‐cause mortality.
-
Serious adverse events. We defined serious adverse events as any untoward medical occurrence that resulted in death, was life‐threatening, required hospitalisation or prolongation of existing hospitalisation, or resulted in persistent or significant disability or incapacity or required intervention to prevent it (ICH‐GCP 1997).
-
Health‐related quality of life.
Secondary outcomes
-
Non‐serious adverse events.
-
Anthropometric measurements: lean body mass (measured using dual energy x‐ray absorptiometry scans, magnetic resonance imaging, computerised tomography, or ultrasound), mid‐arm circumference, thigh circumference, and BMI.
-
Physical fitness: maximum/peak oxygen uptake, Six‐Minute Walk Test, two‐minute step test, hand grip strength, one‐repetition maximum kicking strength.
Exploratory outcomes
-
Insulin resistance (homeostasis model assessment of insulin resistance, glucose infusion rate during insulin clamp).
-
Glycaemic control (glycated haemoglobin A1c, fasting blood glucose, response to oral glucose tolerance test).
-
Serum albumin concentration.
-
Serum creatinine concentration.
-
Nitrogen balance.
-
Portal venous pressure.
Search methods for identification of studies
Electronic searches
We performed electronic searches of The Cochrane Hepato‐Biliary Group Controlled Trials Register (Cochrane Hepato‐Biliary Group Module), the Cochrane Central Register of Controlled Trials (CENTRAL) in the Cochrane Library, MEDLINE Ovid, Embase Ovid, LILACS (Bireme), Science Citation Index Expanded (Web of Science), and Conference Proceedings Citation Index – Science (Web of Science) (Royle 2003). Appendix 1 provides the search strategies with the time spans of the searches.
With assistance from the Information Specialist of The Cochrane Hepato‐Biliary Group, we planned to search Russian, Chinese, and Japanese databases for publications of interest. However, these searches were unavailable.
Searching other resources
We scanned the reference lists of relevant articles and proceedings from meetings of the British Society for Gastroenterology (BSG), the British Association for the Study of the Liver (BASL), the European Association for the Study of the Liver (EASL), the United European Gastroenterology Week (UEGW), the American Gastroenterological Association (AGA), the American Association for the Study of Liver Diseases (AASLD), and the International Society for Hepatic Encephalopathy and Nitrogen Metabolism (ISHEN) and wrote to the principal investigators of trials for additional information about completed trials and for information about any ongoing trials.
We searched Google Scholar using the key words: cirrhosis, exercise, and trial.
Finally, we searched online trial registries such as ClinicalTrial.gov (www.clinicaltrials.com), the European Medicines Agency (EMA) (www.ema.europa.eu/ema/), the World Health Organization International Clinical Trial Registry Platform (www.who.int/ictrp), the Food and Drug Administration (FDA) (www.fda.gov), and pharmaceutical company sources for ongoing or unpublished trials.
Data collection and analysis
We followed the guidelines provided in the Cochrane Handbook for Systematic Reviews of Interventions (Higgins 2011) and the Cochrane Hepato‐Biliary Group Module.
Two review authors (GD and LA) extracted data from the published trial reports in an independent manner. A third review author (LG) acted as ombudsman in case of disagreements. We wrote to authors of included trials for additional information.
For trials that were described in more than one reference, we used the reference with the most complete information (the largest number of participants and the longest duration of follow‐up) but grouped all references for each trial.
Selection of studies
Two review authors (GD and LA) selected trials identified through the electronic and manual searches using the criteria described above. We listed studies excluded after full‐text assessment, along with the reasons for exclusion, in the Characteristics of excluded studies table. We illustrated the trial selection process in a PRISMA diagram. Any disagreements were discussed among the authors until settlement. All review authors participated in the final selection of trials for inclusion.
Data extraction and management
We extracted the following data.
-
Participants: inclusion criteria, mean age, proportion of men, and type of underlying liver disease.
-
Interventions: type, intensity, frequency, and duration of interventions and cointerventions.
-
Trial: design (parallel or cross‐over) setting (hospital or outpatient), number of clinical sites, country of origin, and inclusion period.
We also gathered information about bias control and all outcomes.
Assessment of risk of bias in included studies
We assessed bias control using the domains described in the Cochrane Hepato‐Biliary Group Module and classified risk of bias for separate domains as high, unclear, or low. We also included an overall assessment of bias control as described below.
Allocation sequence generation
-
Low risk of bias: sequence generation achieved using computer random number generation or a random number table. Drawing lots, tossing a coin, shuffling cards, or throwing dice were adequate if performed by an independent person not otherwise involved in the trial.
-
Unclear risk of bias: sequence generation method not described.
-
High risk of bias: sequence generation method was not random.
Allocation concealment
-
Low risk of bias: used a central and independent randomisation unit or similar adequate method (e.g. serially numbered opaque sealed envelopes) to ensure that the allocation sequence was unknown to the investigators.
-
Unclear risk of bias: allocation not described.
-
High risk of bias: allocation sequence was likely to be known to the investigators who assigned the participants.
Blinding of participants and personnel
-
Low risk of bias: blinding of participants and personnel using sham exercise. We defined lack of blinding as not likely to affect the evaluation of mortality (Hróbjartsson 2001; Savović 2012).
-
Unclear risk of bias: insufficient information to assess blinding.
-
High risk of bias: no blinding or incomplete blinding.
Blinding of outcome assessors
-
Low risk of bias: blinding of outcome assessors using sham exercise. We defined lack of blinding as not likely to affect the evaluation of mortality (Hróbjartsson 2001; Savović 2012).
-
Unclear risk of bias: insufficient information to assess blinding.
-
High risk of bias: no blinding or incomplete blinding.
Incomplete outcome data
-
Low risk of bias: missing data were unlikely to make treatment effects depart from plausible values. The investigators used sufficient methods, such as intention‐to‐treat analyses with multiple imputations or carry‐forward analyses to handle missing data.
-
Unclear risk of bias: there was insufficient information to assess missing data.
-
High risk of bias: the results were likely to be biased due to missing data.
For‐profit bias
-
Low risk of bias: the trial appeared free of industry sponsorship or other type of for‐profit support.
-
Unclear risk of bias: no information on clinical trial support or sponsorship.
-
High risk of bias: the trial was sponsored by industry or received other support (such as provision of study drugs).
Other bias
-
Low risk of bias: the trial appeared free of other biases including: medicinal dosing problems or follow‐up (as defined below).
-
Unclear risk of bias: the trial may or may not have been free of other domains that could put it at risk of bias.
-
High risk of bias: there were other factors in the trial that could put it at risk of bias such as the administration of inappropriate treatments being given to the controls (e.g. an inappropriate dose) or follow‐up (e.g. the trial included different follow‐up schedules for participants in the allocation groups).
Overall bias assessment
-
Low risk of bias: all domains were low risk of bias using the definitions described above.
-
High risk of bias: one or more of the bias domains were of unclear or high risk of bias.
Measures of treatment effect
We used the risk ratio (RR) for dichotomous outcomes and mean differences (MD) for continuous outcomes, both with 95% confidence intervals (CI).
Unit of analysis issues
As expected, we did not identify any cross‐over trials. If cross‐over trials are identified in future updates, we plan to use data from the first treatment period.
Dealing with missing data
We extracted data from all participants according to allocation. We planned to evaluate the influence of missing outcome data in dichotomous data (Higgins 2008) based on:
-
worst‐case scenario analysis: all participants with missing data counted as failures;
-
extreme worst‐case/best‐case scenario analysis: participants with missing outcome data in the exercise arm counted as failures and in the control arm as successes and vice versa (Cochrane Hepato‐Biliary Group Module).
However, we did not detect any missing data in our analyses of dichotomous data. Accordingly, we did not undertake worst‐case, best‐case, or extreme worst‐case analyses. None of the trials reported data that allowed us to evaluate the potential influence of missing data in the analyses of continuous outcomes.
Assessment of heterogeneity
We expressed heterogeneity as I2 statistic values using the thresholds: 0% to 40% (unimportant), 40% to 60% (moderate), 60% to 80% (substantial), and greater than 80% (considerable).
Assessment of reporting biases
If this meta‐analysis had involved more than 10 included RCTs, we would have assessed reporting and other dissemination biases on visual inspection of funnel plots and regression analyses (Egger 1997; Harbord 2006). Due to the small number of trials, we did not undertake these analyses.
Data synthesis
We performed our analyses in Review Manager 5 (Review Manager 2014) and Stata (Stata 14).
Meta‐analysis
We conducted random‐effects and fixed‐effect meta‐analyses. In all analyses, the estimates of the models were similar. Therefore, we assumed that any small‐study effects had little effect on the intervention effect estimate. For random‐effect models, precision decreased with increasing heterogeneity and CIs widened correspondingly. We reported the results of our analyses based on the random‐effects meta‐analyses to obtain the most conservative result.
Trial Sequential Analysis
We planned to perform Trial Sequential Analysis for the primary outcomes with alpha set to 2.5%, beta to 10% (power to 90%), and model‐based heterogeneity (Thorlund 2011; TSA 2011; Wetterslev 2017). We defined the required information size as the number of participants needed to detect or reject an intervention effect estimated based on the assumed control risk, the relative risk reduction (RRR), and the model‐based diversity. We planned to construct the trial sequential monitoring boundaries based on the required information size (also known as the heterogeneity‐adjusted required information size) and define firm evidence as being established if the Z‐curve (the result of the cumulative meta‐analysis) crossed the monitoring boundary for benefit or harm before reaching the required information size. We planned to undertake the analyses with the RRR set to the upper limit of the 95% CI and the observed control group event rate. However, based on the limited number of events and participants, we did not undertake the analyses.
Subgroup analysis and investigation of heterogeneity
We planned to undertake the following subgroup analyses.
-
Sex (men compared to women).
-
Severity of liver disease (compensated compared to decompensated and Child‐Pugh's Class A or B/C).
-
Type of exercise (aerobic compared to non‐aerobic).
-
Type of control group (no intervention compared to diets).
-
Cointerventions.
-
Bias control (RCTs assessed as low compared to high risk of bias).
-
Publication status (trials published as full paper articles compared to abstracts/unpublished trials).
Based on the small number of trials, we did not undertake any of the planned subgroup analyses.
Sensitivity analysis
To evaluate the robustness of the overall results, we planned to undertake sensitivity analyses to evaluate the influence of missing outcomes as described above.
'Summary of findings' tables
We created a 'Summary of findings' table including primary and secondary review outcomes using GRADEpro software (GRADEpro). The GRADE approach appraises the quality of a body of evidence based on the extent to which one can be confident that an estimate of effect or association reflects the item being assessed. The quality of a body of evidence considered within‐study risk of bias, indirectness of the evidence (population, intervention, control, outcomes), unexplained heterogeneity or inconsistency of results (including problems with subgroup analyses), imprecision of effect estimates, and risk of publication bias (GRADEpro; Guyatt 2008).
We reported the conclusions using the EPICOT (evidence, population, intervention, comparison, outcome, time stamp; see Implications for research for details) format (Brown 2006).
Results
Description of studies
We included six RCTs (Macías‐Rodríguez 2016; Román 2014; Zenith 2014; Román 2016; Aamann 2018; Krüger 2018), and excluded eight studies (Ritland 1983; Campillo 1990b; Degoricija 2003; Konishi 2011; Pattullo 2013; Debette‐Gratien 2014; Berzigotti 2016a; Nishida 2016). For additional information, see Characteristics of included studies and Characteristics of excluded studies tables.
Results of the search
Searching the electronic databases revealed 963 potentially relevant records (Figure 1). The manual searches identified an additional 15 records. We removed duplicates, and screened the titles and abstracts and excluded 652 references. Ultimately, 23 references were retrieved for further assessment. We excluded nine references concerning one RCT and eight observational studies (Ritland 1983; Campillo 1990b; Degoricija 2003; Konishi 2011; Pattullo 2013; Debette‐Gratien 2014; Berzigotti 2016a; Nishida 2016; Hiraoka 2017). The remaining 14 references referred to six RCTs which fulfilled the inclusion criteria (Macías‐Rodríguez 2016; Román 2014; Zenith 2014; Román 2016; Aamann 2018; Krüger 2018). All six trials used a parallel‐arm design and were available as full‐text articles.
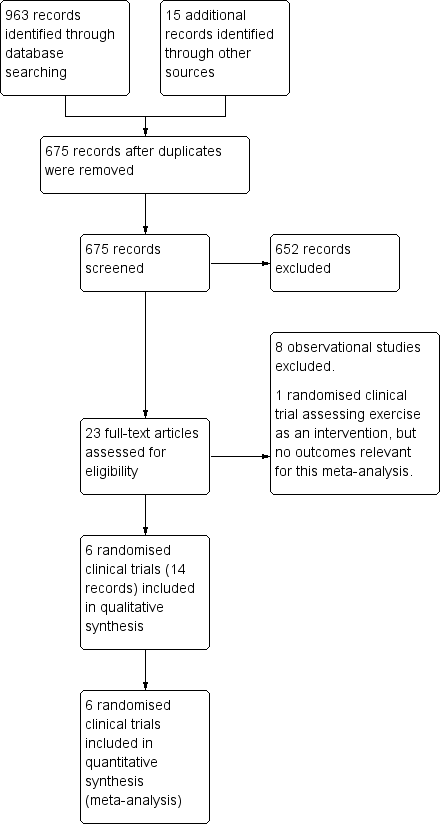
Study flow diagram
Included studies
Participants
We included 173 outpatients with cirrhosis (Child‐Pugh A or B). The proportion of men ranged from 50.0% to 78.9% in the intervention group and 64.0% to 83.3% in the control group. The proportion of participants with alcoholic liver disease varied from 7.7% to 86% in the intervention group and 16.7% to 86.7% in the control group (see Characteristics of included studies table).
Interventions
The intervention physical exercise varied in type, intensity, and duration. The different types of exercise performed were aerobic exercise; anaerobic exercise; kinesiotherapy; and flexibility including ergometer cycling, rhythmic activities, treadmill walking, balance, co‐ordination, resistance training, and stretching; either solely or as combinations. The sessions were either home‐based or supervised at an institution by specialists (e.g. nurses, physiotherapists, cardiologists, sport scientists). The intensity was moderate to high and the duration was 30 minutes to 70 minutes per session three times per week.
Three trials included nutritional therapy in the intervention and control groups (Román 2014; Macías‐Rodríguez 2016; Aamann 2018).
Comparators
One trial included a sham exercise group consisting of supervised relaxation sessions of one hour three times per week (Román 2016). The remaining trials allocated control groups to no intervention (Macías‐Rodríguez 2016; Román 2014; Zenith 2014; Aamann 2018; Krüger 2018).
Outcomes
We gathered outcome data from all trials. The duration of the interventions ranged from eight to 14 weeks in total. Investigators assessed outcomes when terminating each trial intervention. The primary outcomes in the trials included peak voluntary muscle strength, peak exercise oxygen uptake, quality of life, change in muscle mass, and HVPG.
Excluded studies
We excluded one RCT (Degoricija 2003), and eight observational studies (Ritland 1983; Campillo 1990b; Konishi 2011; Pattullo 2013; Debette‐Gratien 2014; Berzigotti 2016a; Nishida 2016; Hiraoka 2017; see Characteristics of excluded studies table).
The RCT evaluated the humoral response of paracentesis, diuretics, and plasma expanders with or without bedrest in participants with cirrhosis and ascites (Degoricija 2003).
The largest observational study included 60 participants with cirrhosis, portal hypertension, and a BMI greater than 26 kg/m2 (Berzigotti 2016a). All participants underwent a 16‐week lifestyle intervention programme consisting of moderate exercise and diet. The lifestyle intervention decreased bodyweight and the HVPG. Adverse events included arthritis (one participant) and worsening of known asthma requiring an increase in bronchodilators dosage (one participant).
The second observational study evaluated a 12‐week individualised programme of adapted physical activity in 13 participants awaiting liver transplantation (Debette‐Gratien 2014). One participant experienced worsening of the underlying liver disease. There were no other adverse events.
The third observational study included nine participants with compensated cirrhosis (Nishida 2016). All participants did bench step exercises at home and supplemented with oral branched chain amino acids for one year. One participant dropped out due to lower back pain and one developed hepatocellular carcinoma (Nishida 2016).
The fourth observational study tested a home‐based exercise programme of optional choice; skiing, running, jogging, swimming, or bicycling for 30 minutes three times per week. The study included nine participants with chronic active hepatitis, a subgroup of five were diagnosed with cirrhosis. Peak oxygen uptake was evaluated at four to six weeks and 10 to 12 weeks. No one experienced worsening in clinical condition (Ritland 1983).
The fifth study examined the aerobic capacity in a subgroup of four of 24 participants with cirrhosis allocating participants to a four‐ to five‐week exercise programme of either 45 minutes or 60 minutes on a bicycle or treadmill (Campillo 1990b).
The sixth observational study only included three participants with cirrhosis out of 17 obese participants with chronic hepatis C. They were followed for eight months with nutritional advice, six months including walking as the intervention (8000 steps per day measured by a pedometer). Two participants dropped out because of knee pain and depression (Konishi 2011).
Using a pedometer, the seventh observational study registered steps walked per day in 33 participants with cirrhosis. Branched chain amino acid (BCAA) supplementations were given as a late night snack and additional 2000 steps per day were prescribed (Hiraoka 2017).
The last observational study to be excluded also involved obese participants with chronic hepatitis C. Only six of 16 participants had cirrhosis. The intervention was a 24‐week lifestyle change with nutritional guidance and daily walking (more than 10,000 steps per day). All 16 completed the intervention (Pattullo 2013).
Risk of bias in included studies
The assessment of bias included information retrieved from the published articles (Figure 2; Figure 3).

Risk of bias graph: review authors' judgements about each risk of bias item presented as percentages across all included trials
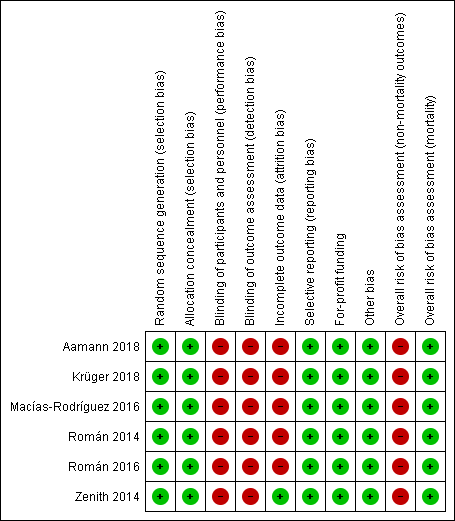
Risk of bias summary: review authors' judgements about each risk of bias item for each included study
Allocation
All six trials allocated participants using computer‐generated random numbers and serially numbered opaque sealed envelopes (Macías‐Rodríguez 2016; Román 2014; Zenith 2014; Román 2016; Aamann 2018; Krüger 2018).
Blinding
As expected, all of the included trials were open without blinding of participants. Blinding of investigators varied (Macías‐Rodríguez 2016; Román 2014; Zenith 2014; Román 2016; Aamann 2018; Krüger 2018).
Incomplete outcome data
All trials lost participants to follow‐up and clarified the reasons for losses in detail. No trials reported intention‐to‐treat analyses and, therefore, we classified them as high risk of attrition bias.
Selective reporting
All trials assessed and reported clinically relevant outcomes (Macías‐Rodríguez 2016; Román 2014; Zenith 2014; Román 2016; Aamann 2018; Krüger 2018).
For‐profit bias
None of the included trials received industry sponsorships or other types of for‐profit support (Macías‐Rodríguez 2016; Román 2014; Zenith 2014; Román 2016; Aamann 2018; Krüger 2018).
Other potential sources of bias
We did not identify other sources of bias in the included trials (Macías‐Rodríguez 2016; Román 2014; Zenith 2014; Román 2016; Aamann 2018; Krüger 2018).
Overall bias assessment
All trials were low risk of bias in the assessment of mortality and high risk of bias in assessment of the remaining outcomes (Macías‐Rodríguez 2016; Román 2014; Zenith 2014; Román 2016; Aamann 2018; Krüger 2018).
Effects of interventions
See: summary of findings Table for the main comparison for the main results from primary outcomes and a selection of secondary outcomes.
Primary outcomes
All‐cause mortality
In total, 0/89 participants allocated to the exercise group versus 2/84 participants allocated to the control group died (RR 0.19, 95% CI 0.01 to 3.73; 173 participants, 6 trials; I2 = 0%; Analysis 1.1). The cause of death was acute‐on‐chronic‐liver‐disease for both participants.
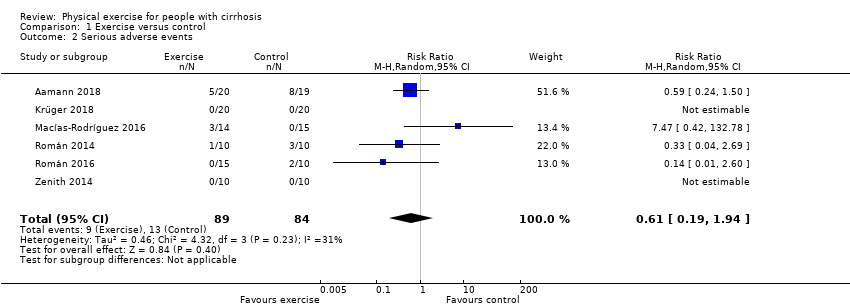
Serious adverse events
Eight participants in the exercise group versus 13 in the control group reported serious adverse events (RR 0.61, 95% CI 0.19 to 1.94; 173 participants, 6 trials; I2 = 31%; Analysis 1.2; Table 1). The serious adverse events included variceal bleeding, infections, and cancer (Table 1).
| Trial | Number of participants | Intervention group | Control group |
| 37 | 5 participants:
| 8 participants:
| |
| 37 | None | None | |
| 26 | 3 participants:
| None | |
| 20 | 1 participant:
| 3 participants:
| |
| 25 | None | 2 participants:
| |
| 19 | None | None |
NSAID: non‐steroidal anti‐inflammatory drug
Health‐related quality of life
Five trials assessed health‐related quality of life using the Chronic Liver Disease Questionnaire (CLDQ; Zenith 2014; Macías‐Rodríguez 2016; Krüger 2018), EuroQol‐Visual Analogue Scale (EQ‐VAS) (Zenith 2014; Krüger 2018), or the 36‐item Short Form (SF‐36) questionnaire (Román 2014; Aamann 2018).
Physical exercise had no beneficial or detrimental effects on health‐related quality of life assessed by the CLDQ (MD 0.11, 95% CI –0.44 to 0.67; 81 participants, 3 trials; I2 = 33%), the EQ‐VAS total score (MD 3.11, 95% CI –24.03 to 30.24; 56 participants, 2 trials; I2 = 88%), or the SF‐36 questionnaire (MD 2.26, 95% CI –3.84 to 8.37; 51 participants, 2 trials; I2 = 0%) (Analysis 1.3).
Secondary outcomes
Non‐serious adverse events
Physical exercise did not affect the risk of non‐serious adverse events (RR 1.97, 95% CI 0.53 to 7.33; 173 participants, 6 trials; I2 = 0%; Analysis 1.4). Events in the exercise group included mild upper respiratory tract infection and transient bradycardia (Román 2014), exacerbation of asthma (Román 2016), iron‐deficiency anaemia, knee injury (accident unrelated to the intervention), and worsening of morbus Scheuermann (Aamann 2018). In the control group, the non‐serious adverse events included stomatitis and minimal hepatic encephalopathy responsive to treatment with lactulose (Aamann 2018).
Anthropometric measurements
We found no difference between the intervention and control groups regarding lean body mass assessed using dual‐energy x‐ray absorptiometry (MD 0.46, 95% CI –2.92 to 3.84; 22 participants, 1 trial); compression index by ultrasound of the quadriceps muscle (MD 0.07, 95% CI –0.03 to 0.17; 56 participants, 2 trials; I2 = 0%); or bioimpedance (MD 2.30, 95% CI –0.73 to 5.33; 34 participants, 1 trial) (Analysis 1.5).
Physical exercise increased the mid‐arm circumference (MD 2.61, 95% CI 0.36 to 4.85; 72 participants, 3 trials; I2 = 0%; Analysis 1.6), but there was no equivalent difference in mid‐thigh circumference (MD 1.76, 95% CI –0.26 to 3.77; 128 participants, 5 trials; I2 = 0%; Analysis 1.7) or in BMI (MD 0.97, 95% CI –0.48 to 2.42; 154 participants, 6 trials; I2 = 0%) (Analysis 1.8).
Physical fitness
We gathered data on physical fitness/exercise capacity assessed by measuring peak oxygen uptake (Analysis 1.9) and the Six‐Minute Walk Test (Analysis 1.10). The analyses showed no effects of physical exercise versus control in peak oxygen uptake (MD 0.30 mL/kg/minute, 95% CI –2.74 to 3.35; 100 participants, 4 trials; I2 = 27%) and Six‐Minute Walk Test (MD 56.06 min, 95% CI –9.14 to 121.26; 105 participants, 4 trials; I2 = 64%).
Exploratory outcomes
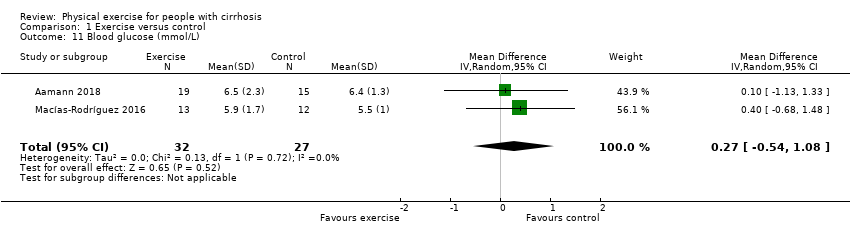
Physical exercise was not associated with beneficial or harmful effects on serum creatinine (MD –1.54 μmol/L, 95% CI –8.03 to 4.95; 99 participants, 4 trials; I2 = 0%; Analysis 1.13), serum albumin (MD 0.05 g/L, 95% CI –1.48 to 1.59; 155 participants, 6 trials; I2 = 9%; Analysis 1.12), serum ammonia (MD 8.39 μmol/L, 95% CI –4.20 to 20.97; 73 participants, 3 trials; I2 = 0%; Analysis 1.14), or blood glucose (MD 0.27 mmol/L, 95% CI –0.54 to 1.08; 59 participants, 2 trials; I2 = 0%; Analysis 1.11).
'Summary of findings' table
As shown in the summary of findings Table for the main comparison, we downgraded the quality of the evidence to low or very low because of 1. within trial risk of bias (lack of trials at low risk of bias, one level); 2. inconsistency (between trial heterogeneity identified although only four trials are included, one level); 3. serious imprecision (insufficient statistical power, one level).
Discussion
Summary of main results
This review only included six RCTs with 173 participants diagnosed with Child‐Pugh stage A or B cirrhosis. None of the included trials were low risk of bias in the overall assessment of bias control. Physical exercise for eight to 14 weeks did not appear to affect mortality or health‐related quality of life compared with sham exercise or no exercise. Furthermore, physical exercise did not increase the risk of serious or non‐serious adverse events. In addition, we found no effect of physical exercise on exercise capacity and the only beneficial effect on anthropometric assessments was detected when analysing mid‐arm circumference.
Overall completeness and applicability of evidence
This review was based on a sample size of 173 participants with cirrhosis. The stage of cirrhosis was limited to Child‐Pugh A and B. We found no trials involving decompensated participants with stage C and it reduced some of the variations in the participants. However, the participants varied in gender, aetiology, duration of illness, age, comorbidity, etc. causing a biological diversity likely to affect responsiveness to treatment. We were unable to gather enough data to evaluate any effects caused by sex, aetiology, etc. We did not have sufficient data to assess potential differences in outcomes according to exercise regimen (type, duration, etc). Despite some heterogeneity in the participants and the interventions, we still considered the data applicable for our outcomes, especially important primary outcomes such as mortality and adverse events.
Quality of the evidence
We included RCTs, but no cross‐sectional studies. This review identified several methodological concerns. Apart from an expected lack of blinding due to the nature of the intervention, the investigators were unblinded in some of the studies. Adding attribution bias and imprecision of outcomes due to small sample sizes, few events, and overlapping CIs (clinical heterogeneity), we downgraded the evidence for each of the primary, secondary, and exploratory analyses. For details, see summary of findings Table for the main comparison.
We did not detect any missing data for mortality, serious adverse events, and non‐serious events. All treatments of the participants were known to the investigators during the intervention. But for continuous follow‐up data (e.g. quality of life, secondary, and exploratory outcomes) attribution bias may have occurred. Continuous data collection required physical attendance of the participants. The trials reported results from 'available‐case data' and there were no statements of imputing the missing data with replacement values. We planned to evaluate the importance of missing data in a worst‐case scenario analysis for dichotomous data. But we only found missing data for continuous data. We did not have access to all raw participant data set from the original investigators. Instead, we graded trials involved with a high risk of bias in the risk of bias tables (see 'Risk of bias' tables in the Characteristics of included studies table) and performed a sensitivity analysis for significant analyses.
In total, 18/173 (10%) participants were lost to follow‐up. Losses were equal among groups; eight participants from intervention groups and 10 from control groups (including the death of two participants). Several trials stated that these losses did not impact the baseline values, assuming that the participants lost to follow‐up were equal in baseline values compared to the participants who completed the trials. This may minimise the potential confounding impact of the missing data, but we cannot state this for certain.
Potential biases in the review process
We attempted to minimise selection bias using the search strategy described in the Search methods for identification of studies section. We are confident, that we have not missed published trials, but we cannot exclude the possibility that we have missed unpublished trials or that small trials with negative results may not have been published as abstracts or full papers. Two of the review authors (LA and GD) conducted one of the included trials; however, another two review author (AR and LG) collected data from this trial (Aamann 2018).
Agreements and disagreements with other studies or reviews
One meta‐analysis included 81 participants from four RCTs and found no evidence of effect of exercise in participants with cirrhosis (Brustia 2018). Several reviews without meta‐analyses have been published (Toshikuni 2014; Shephard 2015; Berzigotti 2016b; Duarte‐Rojo 2017). One review stated that regular moderate physical activity enhanced liver health, looking at all stages of liver disease, but there was a lack of RCTs that included participants with cirrhosis (Shephard 2015). Another review concluded that establishments for optimal exercise regimens for people with cirrhosis were required (Toshikuni 2014) and one review stated that in compensated cirrhosis exercise acutely elevates portal pressure, but is proven safe in the longer term and is probably beneficial (Berzigotti 2016b). One review from 2017 concluded that exercise combined with an nutritional intervention improved functional status and sarcopenia in end‐stage liver disease in people awaiting a liver transplant and, based on available evidence, moderate‐intensity exercise is safe for this population. They stated that it is not expected for people on a liver transplant list to have cardiovascular contraindications towards exercise (Duarte‐Rojo 2017). All four reviews expected exercise to have a beneficial effect on factors included in this meta‐analysis, but the data at the moment are too sparse to confirm this.
This review found no evidence to confirm or reject that exercise is unsafe for people with cirrhosis. Exercise has been considered a potentially life‐threatening intervention for people with cirrhosis due to an acute effect on portal pressure that increases the risk of variceal bleeding (Bandi 1998; García‐Pagàn 1998). One trial included in this review measured the HVPG (Macías‐Rodríguez 2016). Both groups received beta‐blockers, but the HVPG significantly decreased in the intervention group after 14 weeks of moderate‐intensive exercise comprising both aerobic and anaerobic training. Lifestyle intervention decreased the HVPG in 60 obese participants allocated to a home‐exercising programme and diet (Berzigotti 2016a). This indicates that long‐term exercise may not adversely affect HVPG, but this review cannot draw conclusions on the effect of exercise on HVPG.
There was no clear effect of exercise on the risk of serious adverse events. Serious adverse events related to portal hypertension also involve ascites. One trial reported paracentesis in two exercising participants as a serious adverse event (Aamann 2018). Additionally, we reported other complications related to portal hypertension such as variceal bleeding, infections and hepatocellular carcinoma (Table 1). We do not consider the total amount of serious adverse events as abnormally elevated in these chronically ill participants. But the actual amount of evidence is not sufficient to draw a conclusion for people with cirrhosis Child‐Pugh A or B.
Exercise did not have any effect on exercise capacity/physical fitness (peak oxygen uptake or Six‐Minute Walk Test) or anthropometric measurements. This may be explained by the great diversity in the interventions. The exercise programmes differed considerably in intensity, method, duration, etc. As of 2018, there is no consensus regarding the most effective exercise programme for chronically ill elderly people. The American College of Sports Medicines and American Heart Association's guideline for healthy older adults recommend moderate‐intensity aerobic physical activity for a minimum of 30 minutes five days each week or vigorous intensity for a minimum of 20 minutes three days each week to promote and maintain health. To maintain or increase muscular strength and endurance, resistance training should be repeated twice each week (Nelson 2007). Whether these recommendations also correspond well to cirrhosis are yet unknown. One might speculate that the increased catabolic state in people with cirrhosis may require a more specialised exercise programme including nutritional guidance to reverse the loss of, for example, muscle size and strength compared to healthy elderly people. In contrast, other chronically ill and cachectic patient groups have already proven it possible to enhance endurance and muscle strength (Clark 2000).
Body weight and BMI tended to be high in both groups. We could not extract general information on ascites etc., making it impossible to state whether overweight was due to overhydration, gain in muscle mass or, for example, fat. A high BMI may demonstrate that people with cirrhosis are not always undernourished, but frequently also develop obesity. Even so, sarcopenia still tends to be an underlying issue (Berzigotti 2016a).
Results from mid‐arm circumference measurements showed that exercise may induce a larger circumference (low‐quality evidence). Mid‐arm circumference is a measurement for nutritional status, but does not predict the distribution of fat and muscle. Future review data on anthropometric measurements could benefit from including, for example, triceps skinfold and also calculations on mid‐arm muscle circumference or area. This is illustrated by a trial reporting a significant decrease in mid‐arm circumference when comparing the baseline and follow‐up values in the intervention group, but an increase in mid‐arm muscle circumference (Román 2016).
Surprisingly, there was no effect on quality of life. Quality of life is improved by physical exercise in other chronic diseases (e.g. chronic obstructive pulmonary disease; McCarthy 2015). The included trials individually reported effects of health status/quality of life (Román 2014; Zenith 2014; Aamann 2018), but mainly in subcategories and not total scores. The trials used different questionnaires, either disease‐specific or generic. Due to this diversity, we chose not to compare overall results, but analyse results separately including fewer participants per analysis and weakening the power. Including more trials in the future may change the outcome.
In people with chronic obstructive pulmonary disease an improvement of 30 min in the Six‐Minute Walk Test is considered sufficient to evaluate an efficacy in therapeutic interventions (Holland 2014). We found no beneficial effect of exercise using the Six‐Minute Walk Test, but the MD between groups was 56 min (95% CI –9.14 to 121.26; P = 0.09). One trial had lower values of follow‐up walking distance data when comparing the intervention group and control group (Krüger 2018), but looking at changes from baseline to follow‐up, the intervention group improved their walking distance and the distance deteriorated in the control group. Inclusion of more studies is expected to improve the outcome.
In accordance, there was no certain effect on peak oxygen uptake. Aerobic capacity is impaired in people with compensated cirrhosis which affects mortality (Jones 2012; Bernal 2014). In individual trials, aerobic exercise improved peak oxygen uptake in people with cirrhosis (Campillo 1990b; Zenith 2014; Krüger 2018). People with coronary artery disease attending cardiac rehabilitation improved survival by improving cardiorespiratory fitness (Martin 2013).

Study flow diagram

Risk of bias graph: review authors' judgements about each risk of bias item presented as percentages across all included trials

Risk of bias summary: review authors' judgements about each risk of bias item for each included study

Comparison 1 Exercise versus control, Outcome 1 All‐cause mortality.
Comparison 1 Exercise versus control, Outcome 2 Serious adverse events.

Comparison 1 Exercise versus control, Outcome 3 Health‐related quality of life.

Comparison 1 Exercise versus control, Outcome 4 Non‐serious adverse events.

Comparison 1 Exercise versus control, Outcome 5 Anthropometric measurements: lean body mass (kg).

Comparison 1 Exercise versus control, Outcome 6 Anthropometric measurements: mid‐arm circumference (cm).

Comparison 1 Exercise versus control, Outcome 7 Anthropometric measurements: thigh circumference (cm).

Comparison 1 Exercise versus control, Outcome 8 Anthropometric measurements: body mass index (kg/m2).

Comparison 1 Exercise versus control, Outcome 9 Physical fitness: peak oxygen uptake (mL/kg/minute).

Comparison 1 Exercise versus control, Outcome 10 Physical fitness: 6‐Minute Walk Test (m in total).
Comparison 1 Exercise versus control, Outcome 11 Blood glucose (mmol/L).

Comparison 1 Exercise versus control, Outcome 12 Serum albumin (g/L).

Comparison 1 Exercise versus control, Outcome 13 Serum creatinine (µmol/L).
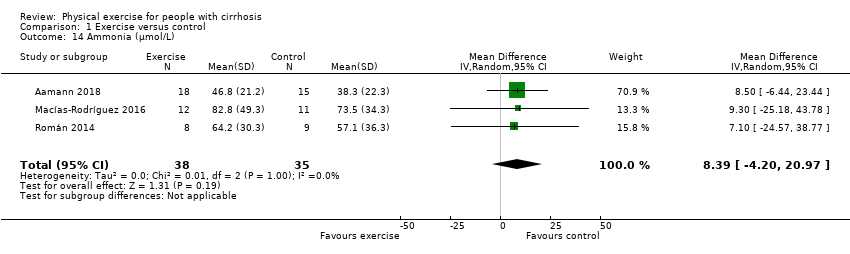
Comparison 1 Exercise versus control, Outcome 14 Ammonia (µmol/L).
| Exercise compared to no exercise for people with cirrhosis | ||||||
| Patient or population: people with Child‐Pugh stage A or B cirrhosis | ||||||
| Outcomes | Anticipated absolute effects* (95% CI) | Relative effect | № of participants | Qualityof the evidence | Comments | |
| Risk with no exercise | Risk with exercise | |||||
| All‐cause mortality | Study population | RR 0.19 | 173 | ⊕⊕⊕⊝ | ||
| 24 per 1000 | 5 per 1000 | |||||
| Serious adverse events | Study population | RR 0.61 | 173 | ⊕⊕⊝⊝ | — | |
| 155 per 1000 | 94 per 1000 | |||||
| Health‐related quality of life ‐ CLDQ (total score 1–7, high score corresponds to a better HRQoL) | The mean quality of life ‐ CLDQ (total score) ranged from 5.03 to 5.39 | MD 0.11 higher | — | 81 | ⊕⊕⊝⊝ | — |
| Anthropometric measurements: mid‐arm circumference (cm) | The mean mid‐arm circumference (cm) ranged from 27.1 to 31.5 | MD 2.61 higher | — | 72 | ⊕⊕⊝⊝ | — |
| Anthropometric measurements: mid‐thigh circumference (cm) | The mean mid‐thigh circumference (cm) ranged from 51.8 to 54.6 | MD 1.76 higher | — | 128 | ⊕⊕⊝⊝ | — |
| Physical fitness: peak exercise oxygen uptake (mL/kg/minute) | The mean peak exercise oxygen uptake (mL/kg/minute) ranged from 21.2 to 26.1 | MD 0.3 higher | — | 100 | ⊕⊕⊝⊝ | — |
| Physical fitness: 6‐Minute Walk Test (min in total) | The mean 6‐Minute Walk Test (min in total) ranged from 309 to 546 | MD 56.06 higher | — | 105 | ⊕⊝⊝⊝ | — |
| *The risk in the intervention group (and its 95% confidence interval) is based on the assumed risk in the comparison group and the relative effect of the intervention (and its 95% CI). CI: confidence interval; CLDQ: Chronic Liver Disease Questionnaire; HRQoL: health‐related quality of life; MD: mean difference; RCT: randomised clinical trial; RR: risk ratio | ||||||
| GRADE Working Group grades of evidence | ||||||
| aDowngraded one level due to serious imprecision (insufficient statistical power). | ||||||
| Trial | Number of participants | Intervention group | Control group |
| 37 | 5 participants:
| 8 participants:
| |
| 37 | None | None | |
| 26 | 3 participants:
| None | |
| 20 | 1 participant:
| 3 participants:
| |
| 25 | None | 2 participants:
| |
| 19 | None | None | |
| NSAID: non‐steroidal anti‐inflammatory drug | |||
| Outcome or subgroup title | No. of studies | No. of participants | Statistical method | Effect size |
| 1 All‐cause mortality Show forest plot | 6 | 173 | Risk Ratio (M‐H, Random, 95% CI) | 0.19 [0.01, 3.73] |
| 2 Serious adverse events Show forest plot | 6 | 173 | Risk Ratio (M‐H, Random, 95% CI) | 0.61 [0.19, 1.94] |
| 3 Health‐related quality of life Show forest plot | 5 | Mean Difference (IV, Random, 95% CI) | Subtotals only | |
| 3.1 Chronic Liver Disease Questionnaire (total score) | 3 | 81 | Mean Difference (IV, Random, 95% CI) | 0.11 [‐0.44, 0.67] |
| 3.2 EuroQol‐Visual Analogue Scale (total score) | 2 | 56 | Mean Difference (IV, Random, 95% CI) | 3.11 [‐24.03, 30.24] |
| 3.3 36‐item Short Form (Mental Component Summary) | 2 | 51 | Mean Difference (IV, Random, 95% CI) | 2.26 [‐3.84, 8.37] |
| 4 Non‐serious adverse events Show forest plot | 6 | 173 | Risk Ratio (M‐H, Random, 95% CI) | 1.97 [0.53, 7.33] |
| 5 Anthropometric measurements: lean body mass (kg) Show forest plot | 4 | Mean Difference (IV, Random, 95% CI) | Subtotals only | |
| 5.1 Dual‐energy x‐ray absorptiometry (DXA) – lean leg mass (kg) | 1 | 22 | Mean Difference (IV, Random, 95% CI) | 0.46 [‐2.92, 3.84] |
| 5.2 Ultrasound – mean compression index (cm/m2) | 2 | 56 | Mean Difference (IV, Random, 95% CI) | 0.07 [‐0.03, 0.17] |
| 5.3 Bioimpedance – dry lean (kg) | 1 | 34 | Mean Difference (IV, Random, 95% CI) | 2.30 [‐0.73, 5.33] |
| 6 Anthropometric measurements: mid‐arm circumference (cm) Show forest plot | 3 | 72 | Mean Difference (IV, Random, 95% CI) | 2.61 [0.36, 4.85] |
| 7 Anthropometric measurements: thigh circumference (cm) Show forest plot | 5 | 128 | Mean Difference (IV, Random, 95% CI) | 1.76 [‐0.26, 3.77] |
| 8 Anthropometric measurements: body mass index (kg/m2) Show forest plot | 6 | 154 | Mean Difference (IV, Random, 95% CI) | 0.97 [‐0.48, 2.42] |
| 9 Physical fitness: peak oxygen uptake (mL/kg/minute) Show forest plot | 4 | 100 | Mean Difference (IV, Random, 95% CI) | 0.30 [‐2.74, 3.35] |
| 10 Physical fitness: 6‐Minute Walk Test (m in total) Show forest plot | 4 | 105 | Mean Difference (IV, Random, 95% CI) | 56.06 [‐9.14, 121.26] |
| 11 Blood glucose (mmol/L) Show forest plot | 2 | 59 | Mean Difference (IV, Random, 95% CI) | 0.27 [‐0.54, 1.08] |
| 12 Serum albumin (g/L) Show forest plot | 6 | 155 | Mean Difference (IV, Random, 95% CI) | 0.05 [‐1.48, 1.59] |
| 13 Serum creatinine (µmol/L) Show forest plot | 4 | 99 | Mean Difference (IV, Random, 95% CI) | ‐1.54 [‐8.03, 4.95] |
| 14 Ammonia (µmol/L) Show forest plot | 3 | 73 | Mean Difference (IV, Random, 95% CI) | 8.39 [‐4.20, 20.97] |