Ejercicio físico para los pacientes con cirrosis
Appendices
Appendix 1. Search strategies
| Database | Time span | Search strategy |
| Cochrane Hepato‐Biliary Group Controlled Trials Register | February 2018 | (exercise* or physical activit* or training or (oxygen and (uptake or consumption))) AND cirrho* |
| Cochrane Central Register of Controlled Trials (CENTRAL) in the Cochrane Library | 2018, Issue 1 | #1 MeSH descriptor: [Exercise] explode all trees #2 exercise* or physical activit* or training or (oxygen and (uptake or consumption)) #3 #1 or #2 #4 MeSH descriptor: [Liver Cirrhosis] explode all trees #5 cirrho* #6 #4 or #5 #7 #3 and #6 |
| MEDLINE Ovid | 1946 to February 2018 | 1. exp Exercise/ 2. (exercise* or physical activit* or training or (oxygen and (uptake or consumption))).mp. [mp=title, abstract, original title, name of substance word, subject heading word, keyword heading word, protocol supplementary concept word, rare disease supplementary concept word, unique identifier] 3. 1 or 2 4. exp Liver Cirrhosis/ 5. cirrho*.mp. [mp=title, abstract, original title, name of substance word, subject heading word, keyword heading word, protocol supplementary concept word, rare disease supplementary concept word, unique identifier] 6. 4 or 5 7. 3 and 6 8. (random* or blind* or placebo* or meta‐analys*).mp. [mp=title, abstract, original title, name of substance word, subject heading word, keyword heading word, protocol supplementary concept word, rare disease supplementary concept word, unique identifier] 9. 7 and 8 |
| Embase Ovid | 1974 to February 2018 | 1. exp exercise/ 2. (exercise* or physical activit* or training or (oxygen and (uptake or consumption))).mp. [mp=title, abstract, subject headings, heading word, drug trade name, original title, device manufacturer, drug manufacturer, device trade name, keyword] 3. 1 or 2 4. exp liver cirrhosis/ 5. cirrho*.mp. [mp=title, abstract, subject headings, heading word, drug trade name, original title, device manufacturer, drug manufacturer, device trade name, keyword] 6. 4 or 5 7. 3 and 6 8. (random* or blind* or placebo* or meta‐analys*).mp. [mp=title, abstract, subject headings, heading word, drug trade name, original title, device manufacturer, drug manufacturer, device trade name, keyword] 9. 7 and 8 |
| LILACS (Bireme) | 1982 to February 2018 | (exercise$ or physical activit$ or training or (oxygen and (uptake or consumption))) [Words] and cirrho$ [Words] |
| Science Citation Index Expanded (Web of Science) | 1900 to February 2018 | #5 #4 AND #3 #4 TS=(random* or blind* or placebo* or meta‐analys*) #3 #2 AND #1 #2 TS=(cirrho*) #1 TS=(exercise* or physical activit* or training or (oxygen and (uptake or consumption))) |
| Conference Proceedings Citation Index – Science (Web of Science) | 1990 to February 2018 | #5 #4 AND #3 #4 TS=(random* or blind* or placebo* or meta‐analys*) #3 #2 AND #1 #2 TS=(cirrho*) #1 TS=(exercise* or physical activit* or training or (oxygen and (uptake or consumption))) |

Study flow diagram

Risk of bias graph: review authors' judgements about each risk of bias item presented as percentages across all included trials

Risk of bias summary: review authors' judgements about each risk of bias item for each included study

Comparison 1 Exercise versus control, Outcome 1 All‐cause mortality.
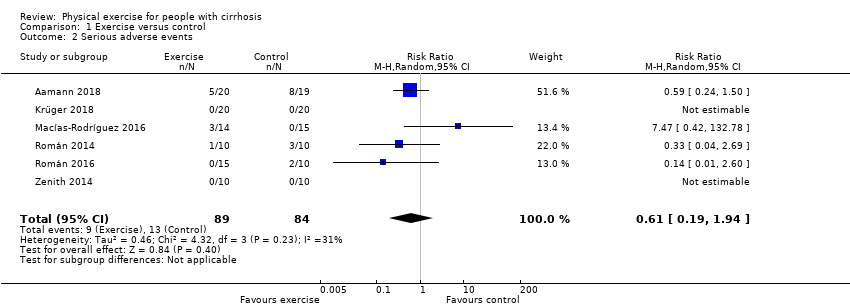
Comparison 1 Exercise versus control, Outcome 2 Serious adverse events.

Comparison 1 Exercise versus control, Outcome 3 Health‐related quality of life.

Comparison 1 Exercise versus control, Outcome 4 Non‐serious adverse events.

Comparison 1 Exercise versus control, Outcome 5 Anthropometric measurements: lean body mass (kg).

Comparison 1 Exercise versus control, Outcome 6 Anthropometric measurements: mid‐arm circumference (cm).

Comparison 1 Exercise versus control, Outcome 7 Anthropometric measurements: thigh circumference (cm).

Comparison 1 Exercise versus control, Outcome 8 Anthropometric measurements: body mass index (kg/m2).

Comparison 1 Exercise versus control, Outcome 9 Physical fitness: peak oxygen uptake (mL/kg/minute).

Comparison 1 Exercise versus control, Outcome 10 Physical fitness: 6‐Minute Walk Test (m in total).
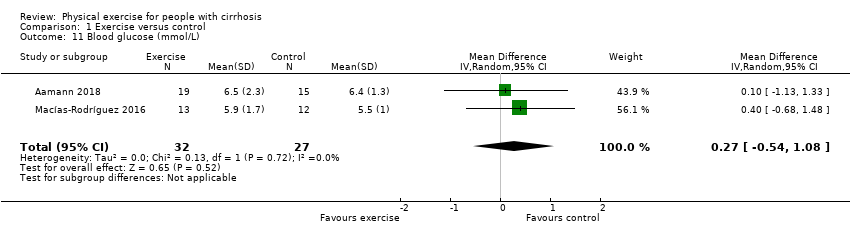
Comparison 1 Exercise versus control, Outcome 11 Blood glucose (mmol/L).

Comparison 1 Exercise versus control, Outcome 12 Serum albumin (g/L).

Comparison 1 Exercise versus control, Outcome 13 Serum creatinine (µmol/L).
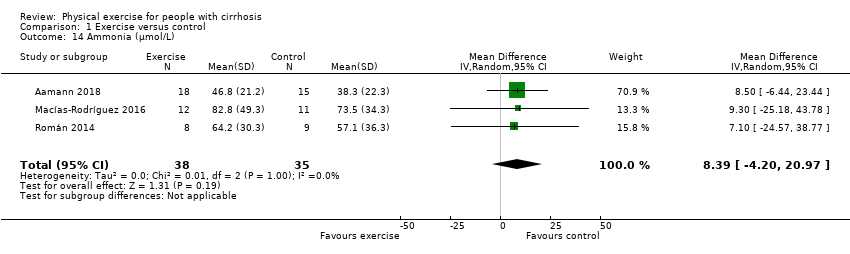
Comparison 1 Exercise versus control, Outcome 14 Ammonia (µmol/L).
| Exercise compared to no exercise for people with cirrhosis | ||||||
| Patient or population: people with Child‐Pugh stage A or B cirrhosis | ||||||
| Outcomes | Anticipated absolute effects* (95% CI) | Relative effect | № of participants | Qualityof the evidence | Comments | |
| Risk with no exercise | Risk with exercise | |||||
| All‐cause mortality | Study population | RR 0.19 | 173 | ⊕⊕⊕⊝ | ||
| 24 per 1000 | 5 per 1000 | |||||
| Serious adverse events | Study population | RR 0.61 | 173 | ⊕⊕⊝⊝ | — | |
| 155 per 1000 | 94 per 1000 | |||||
| Health‐related quality of life ‐ CLDQ (total score 1–7, high score corresponds to a better HRQoL) | The mean quality of life ‐ CLDQ (total score) ranged from 5.03 to 5.39 | MD 0.11 higher | — | 81 | ⊕⊕⊝⊝ | — |
| Anthropometric measurements: mid‐arm circumference (cm) | The mean mid‐arm circumference (cm) ranged from 27.1 to 31.5 | MD 2.61 higher | — | 72 | ⊕⊕⊝⊝ | — |
| Anthropometric measurements: mid‐thigh circumference (cm) | The mean mid‐thigh circumference (cm) ranged from 51.8 to 54.6 | MD 1.76 higher | — | 128 | ⊕⊕⊝⊝ | — |
| Physical fitness: peak exercise oxygen uptake (mL/kg/minute) | The mean peak exercise oxygen uptake (mL/kg/minute) ranged from 21.2 to 26.1 | MD 0.3 higher | — | 100 | ⊕⊕⊝⊝ | — |
| Physical fitness: 6‐Minute Walk Test (min in total) | The mean 6‐Minute Walk Test (min in total) ranged from 309 to 546 | MD 56.06 higher | — | 105 | ⊕⊝⊝⊝ | — |
| *The risk in the intervention group (and its 95% confidence interval) is based on the assumed risk in the comparison group and the relative effect of the intervention (and its 95% CI). CI: confidence interval; CLDQ: Chronic Liver Disease Questionnaire; HRQoL: health‐related quality of life; MD: mean difference; RCT: randomised clinical trial; RR: risk ratio | ||||||
| GRADE Working Group grades of evidence | ||||||
| aDowngraded one level due to serious imprecision (insufficient statistical power). | ||||||
| Trial | Number of participants | Intervention group | Control group |
| 37 | 5 participants:
| 8 participants:
| |
| 37 | None | None | |
| 26 | 3 participants:
| None | |
| 20 | 1 participant:
| 3 participants:
| |
| 25 | None | 2 participants:
| |
| 19 | None | None | |
| NSAID: non‐steroidal anti‐inflammatory drug | |||
| Outcome or subgroup title | No. of studies | No. of participants | Statistical method | Effect size |
| 1 All‐cause mortality Show forest plot | 6 | 173 | Risk Ratio (M‐H, Random, 95% CI) | 0.19 [0.01, 3.73] |
| 2 Serious adverse events Show forest plot | 6 | 173 | Risk Ratio (M‐H, Random, 95% CI) | 0.61 [0.19, 1.94] |
| 3 Health‐related quality of life Show forest plot | 5 | Mean Difference (IV, Random, 95% CI) | Subtotals only | |
| 3.1 Chronic Liver Disease Questionnaire (total score) | 3 | 81 | Mean Difference (IV, Random, 95% CI) | 0.11 [‐0.44, 0.67] |
| 3.2 EuroQol‐Visual Analogue Scale (total score) | 2 | 56 | Mean Difference (IV, Random, 95% CI) | 3.11 [‐24.03, 30.24] |
| 3.3 36‐item Short Form (Mental Component Summary) | 2 | 51 | Mean Difference (IV, Random, 95% CI) | 2.26 [‐3.84, 8.37] |
| 4 Non‐serious adverse events Show forest plot | 6 | 173 | Risk Ratio (M‐H, Random, 95% CI) | 1.97 [0.53, 7.33] |
| 5 Anthropometric measurements: lean body mass (kg) Show forest plot | 4 | Mean Difference (IV, Random, 95% CI) | Subtotals only | |
| 5.1 Dual‐energy x‐ray absorptiometry (DXA) – lean leg mass (kg) | 1 | 22 | Mean Difference (IV, Random, 95% CI) | 0.46 [‐2.92, 3.84] |
| 5.2 Ultrasound – mean compression index (cm/m2) | 2 | 56 | Mean Difference (IV, Random, 95% CI) | 0.07 [‐0.03, 0.17] |
| 5.3 Bioimpedance – dry lean (kg) | 1 | 34 | Mean Difference (IV, Random, 95% CI) | 2.30 [‐0.73, 5.33] |
| 6 Anthropometric measurements: mid‐arm circumference (cm) Show forest plot | 3 | 72 | Mean Difference (IV, Random, 95% CI) | 2.61 [0.36, 4.85] |
| 7 Anthropometric measurements: thigh circumference (cm) Show forest plot | 5 | 128 | Mean Difference (IV, Random, 95% CI) | 1.76 [‐0.26, 3.77] |
| 8 Anthropometric measurements: body mass index (kg/m2) Show forest plot | 6 | 154 | Mean Difference (IV, Random, 95% CI) | 0.97 [‐0.48, 2.42] |
| 9 Physical fitness: peak oxygen uptake (mL/kg/minute) Show forest plot | 4 | 100 | Mean Difference (IV, Random, 95% CI) | 0.30 [‐2.74, 3.35] |
| 10 Physical fitness: 6‐Minute Walk Test (m in total) Show forest plot | 4 | 105 | Mean Difference (IV, Random, 95% CI) | 56.06 [‐9.14, 121.26] |
| 11 Blood glucose (mmol/L) Show forest plot | 2 | 59 | Mean Difference (IV, Random, 95% CI) | 0.27 [‐0.54, 1.08] |
| 12 Serum albumin (g/L) Show forest plot | 6 | 155 | Mean Difference (IV, Random, 95% CI) | 0.05 [‐1.48, 1.59] |
| 13 Serum creatinine (µmol/L) Show forest plot | 4 | 99 | Mean Difference (IV, Random, 95% CI) | ‐1.54 [‐8.03, 4.95] |
| 14 Ammonia (µmol/L) Show forest plot | 3 | 73 | Mean Difference (IV, Random, 95% CI) | 8.39 [‐4.20, 20.97] |