Ligadura con banda versus ninguna intervención para la prevención primaria de la hemorragia digestiva alta en pacientes adultos con cirrosis y várices esofágicas
Appendices
Appendix 1. Search strategies
| Database | Time span | Search terms | |
| The Cochrane Hepato‐Biliary Group Controlled Trials Register | February 2019 | (ligation* or banding*) AND ((oesophageal or esophageal) and varic*) | |
| Cochrane Central Register of Controlled Trials (CENTRAL) in the Cochrane Library | 2019, Issue 2 | #1 MeSH descriptor: [Ligation] explode all trees #2 ligation* or banding* #3 #1 or #2 #4 MeSH descriptor: [Esophageal and Gastric Varices] explode all trees #5 ((oesophageal or esophageal) and varic*) #6 #4 or #5 #7 #3 and #6 | |
| MEDLINE Ovid | 1946 to February 2019 | 1. exp Ligation/ 2. (ligation* or banding*).mp. [mp=title, abstract, original title, name of substance word, subject heading word, keyword heading word, protocol supplementary concept word, rare disease supplementary concept word, unique identifier, synonyms] 3. 1 or 2 4. exp "Esophageal and Gastric Varices"/ 5. ((oesophageal or esophageal) and varic*).mp. [mp=title, abstract, original title, name of substance word, subject heading word, keyword heading word, protocol supplementary concept word, rare disease supplementary concept word, unique identifier, synonyms] 6. 4 or 5 7. 3 and 6 8. (random* or blind* or placebo* or meta‐analys*).mp. [mp=title, abstract, original title, name of substance word, subject heading word, keyword heading word, protocol supplementary concept word, rare disease supplementary concept word, unique identifier, synonyms] 9. 7 and 8 | |
| Embase Ovid | 1974 to February 2019 | 1. exp ligation/ 2. (ligation* or banding*).mp. [mp=title, abstract, heading word, drug trade name, original title, device manufacturer, drug manufacturer, device trade name, keyword, floating subheading word] 3. 1 or 2 4. exp esophagus varices/ 5. ((oesophageal or esophageal) and varic*).mp. [mp=title, abstract, heading word, drug trade name, original title, device manufacturer, drug manufacturer, device trade name, keyword, floating subheading word] 6. 4 or 5 7. 3 and 6 8. (random* or blind* or placebo* or meta‐analys*).mp. [mp=title, abstract, heading word, drug trade name, original title, device manufacturer, drug manufacturer, device trade name, keyword, floating subheading word] 9. 7 and 8 | |
| LILACS (Bireme) | 1982 to February 2019 | (ligation$ or banding$) [Words] and ((oesophageal or esophageal) and varic$) [Words] | |
| Science Citation Index EXPANDED (Web of Science) | 1900 to February 2019 | #5 #4 AND #3 #4 TS=(random* or blind* or placebo* or meta‐analys*) #3 #2 AND #1 #2 TS=((oesophageal or esophageal) and varic*) #1 TS=(ligation* or banding*) | |
| Conference Proceedings Citation Index – Science (Web of Science) | 1990 to February 2019 | #5 #4 AND #3 #4 TS=(random* or blind* or placebo* or meta‐analys*) #3 #2 AND #1 #2 TS=((oesophageal or esophageal) and varic*) #1 TS=(ligation* or banding*) |

Study flow diagram.

Risk of bias graph: review authors' judgements about each risk of bias item presented as percentages across all included studies.

Risk of bias summary: review authors' judgements about each risk of bias item for each included study.
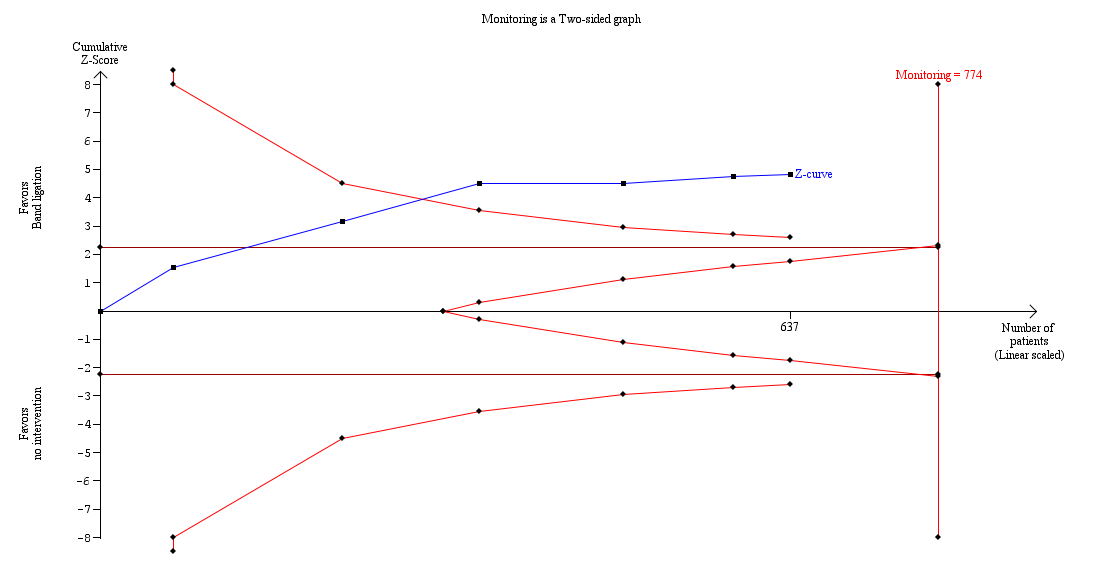
Trial Sequential Analysis of meta‐analysis including six randomised clinical trials evaluating the effect of band ligation versus no intervention on mortality (RR 0.55, 95% CI 0.43 to 0.70; 637 participants; I2 = 0%).
The analysis found that the blue Z‐curve crossed the trial monitoring boundary.

Trial Sequential Analysis including six randomised clinical trials evaluating the effect of band ligation versus no intervention on upper gastrointestinal bleeding (RR 0.44, 95% CI 0.28 to 0.72; participants = 637; I2 = 61%).
The analysis showed that the Z‐curve crossed the trial monitoring boundary.

Trial Sequential Analysis including six randomised clinical trials evaluating the effect of band ligation versus no intervention on serious adverse events (RR 0.55, 95% CI 0.43 to 0.70; 637 participants; I2 = 44%).
The analysis showed that the Z‐curve crossed the trial monitoring boundary.
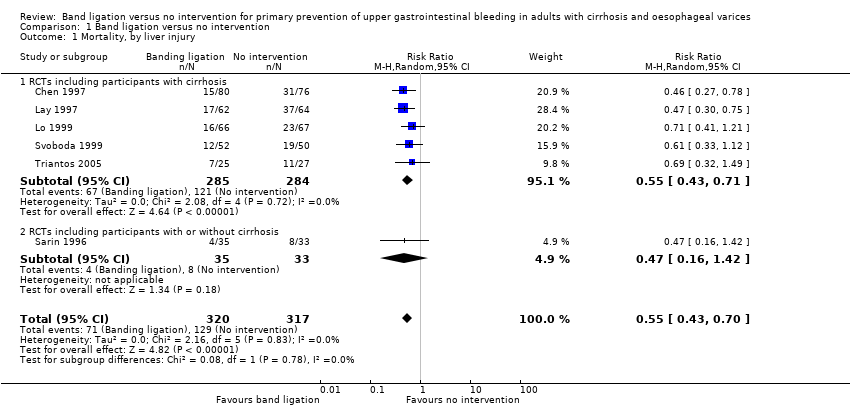
Comparison 1 Band ligation versus no intervention, Outcome 1 Mortality, by liver injury.

Comparison 1 Band ligation versus no intervention, Outcome 2 Mortality, by size of varices.
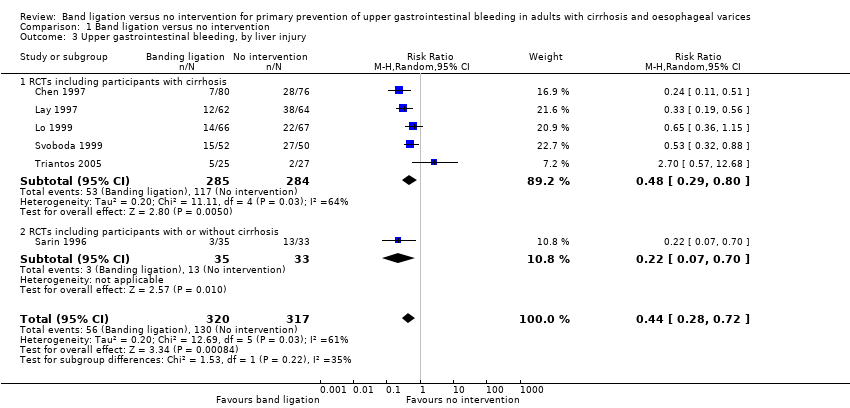
Comparison 1 Band ligation versus no intervention, Outcome 3 Upper gastrointestinal bleeding, by liver injury.

Comparison 1 Band ligation versus no intervention, Outcome 4 Upper gastrointestinal bleeding, by size of varices.

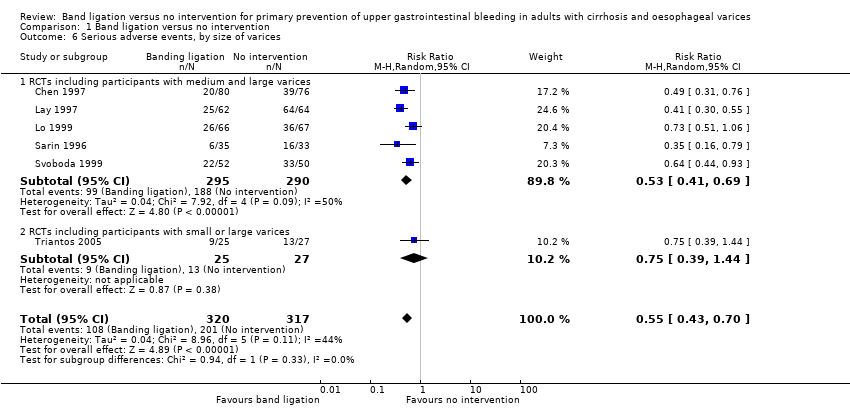
Comparison 1 Band ligation versus no intervention, Outcome 5 Serious adverse events, by liver injury.
Comparison 1 Band ligation versus no intervention, Outcome 6 Serious adverse events, by size of varices.
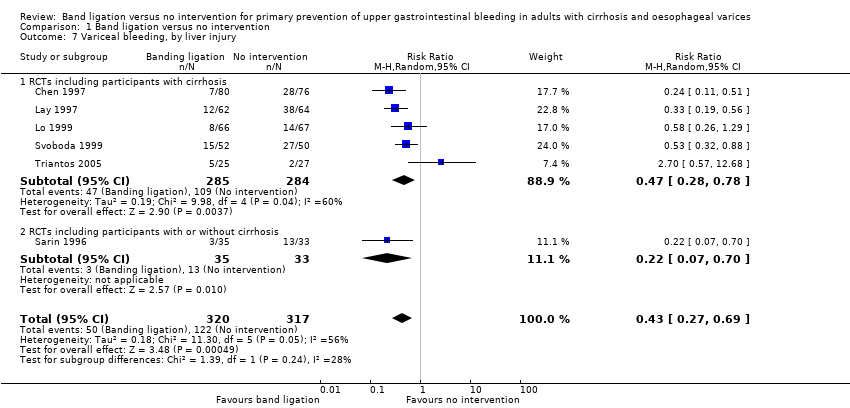
Comparison 1 Band ligation versus no intervention, Outcome 7 Variceal bleeding, by liver injury.

Comparison 1 Band ligation versus no intervention, Outcome 8 Variceal bleeding, by size of varices.

Comparison 2 Band ligation versus no intervention: worst‐case, extreme worst‐case, and extreme best‐case scenario analyses, Outcome 1 Mortality.
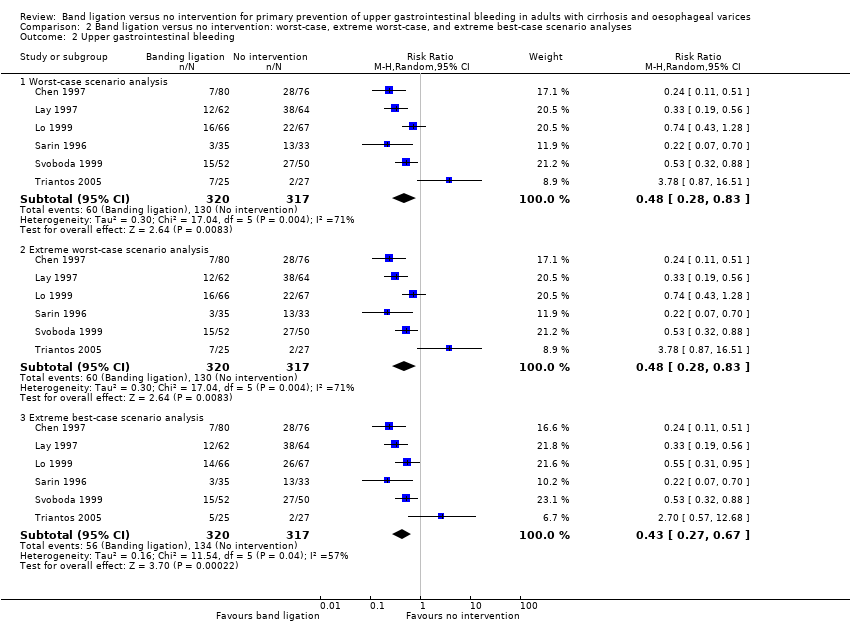
Comparison 2 Band ligation versus no intervention: worst‐case, extreme worst‐case, and extreme best‐case scenario analyses, Outcome 2 Upper gastrointestinal bleeding.
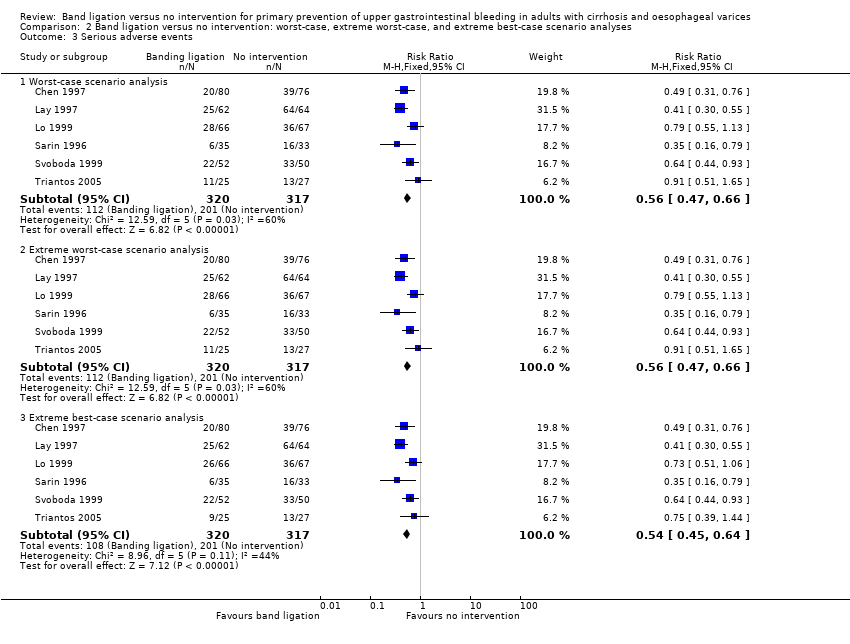
Comparison 2 Band ligation versus no intervention: worst‐case, extreme worst‐case, and extreme best‐case scenario analyses, Outcome 3 Serious adverse events.

Comparison 2 Band ligation versus no intervention: worst‐case, extreme worst‐case, and extreme best‐case scenario analyses, Outcome 4 Variceal bleeding.
| Band ligation compared to no intervention for primary prevention of upper gastrointestinal bleeding in adults with oesophageal varices | ||||||
| Patient or population: adults with oesophageal varices | ||||||
| Outcomes* | Anticipated absolute effects** (95% CI) | Relative effect (95% CI) | Number of participants (Studies (n)) | Certainty of the evidence | Comments | |
| Risk with no intervention | Risk with band ligation | |||||
| Mortality | Study population | RR 0.55 (0.43 to 0.70) | 637 | ⊕⊕⊕⊝ | Only one trial was at low risk of bias in the overall assessment. | |
| 407 per 1000 | 224 per 1000 | |||||
| Upper gastrointestinal bleeding | Study population | RR 0.44 (0.28 to 0.72) | 637 | ⊕⊕⊕⊝ | All trials were at high risk of bias in the overall assessment. | |
| 410 per 1000 | 180 per 1000 | |||||
| Serious adverse events | Study population | RR 0.55 (0.43 to 0.70) | 637 | ⊕⊕⊕⊝ | All trials were at high risk of bias in the overall assessment. | |
| 634 per 1000 | 349 per 1000 | |||||
| Variceal bleeding | Study population | RR 0.43 (0.27 to 0.69) | 637 | ⊕⊕⊕⊝ | All trials were at high risk of bias in the overall assessment. | |
| 385 per 1000 | 166 per 1000 | |||||
| Non‐serious adverse events | We could not perform meta‐analysis. However, the non‐serious adverse events reported in association with band ligation included oesophageal ulceration, dysphagia, odynophagia, retrosternal and throat pain, heartburn, and fever, and in the one trial involving participants with either small or large varices, the incidence of non‐serious side effects in the banding group was much higher in those with small varices with respect to ulcers: small versus large varices 30.5% versus 8.7%; heartburn 39.2% versus 17.4%. | |||||
| Health‐related quality of life | ‐ | ‐ | ‐ | ‐ | ‐ | None of the six included trials described health‐related quality of life. |
| * All outcomes were assessed at the maximum duration of follow‐up **The risk in the intervention group (and its 95% confidence interval) is based on the assumed risk in the comparison group and the relative effect of the intervention (and its 95% CI). | ||||||
| GRADE Working Group grades of evidence | ||||||
| aWe downgraded the certainty of the evidence by one level due to the lack of trials with a low risk of bias. | ||||||
| Trial | Inclusion criteria | Assessment of varices | Randomisation by variceal characteristics | Gastric varices or portal hypertensive gastropathy |
| Not reported | Not stipulated | Not reported | Not reported | |
| Participants were assessed for risk of bleeding (Beppu 1981), using criteria defined by the Japanese Research Society for Portal Hypertension (Inokuchi 1980). The included participants had blue varices of at least F2 or F3 size with at least one of the following: cherry‐red spots (++, +++), red wale markings (++, +++), haematocystic spots (+) | Not stipulated | Not described | Participants with gastric or ectopic varices at recruitment were excluded. During follow‐up, 4 (6%) participants in the banding group and 3 (5%) in the control group developed gastric varices. | |
| F2 or F3, associated with a moderate degree of red colour signs (red wale markings, cherry‐red spots or haematocystic spots (Beppu 1981)) | Not stipulated | F2 Banding: 27/64 (42%) No intervention: 30/63 (48%) F3 Banding: 37/64 (58%) No intervention: 33/63 (52%) Red colour signs moderate Banding: 33/64 (52%) No intervention: 36/63 (57%) Red colour signs severe Banding: 31/64 (48%) No intervention: 27/63 (43%) | Participants with gastric varices at recruitment were excluded. During follow‐up, 8 (12%) participants in the banding group and 3 (5%) in the no intervention group developed gastric varices. During follow‐up, 1 (1.6%) patient in the banding group and 2 (3.2%) in the no intervention group developed gastropathy. | |
| Participants with large varices > 5 mm were assessed for risk of bleeding (Beppu 1981), using criteria defined by the Japanese Research Society for Portal Hypertension (Inokuchi 1980). The included participants had blue varices of at least F2 or F3 size with one or more red colour signs; (cherry‐red spots, red wale markings or haematocystic spots) | Variceal size and grade assessed by two independent observers | Not reported | The presence/absence of gastric varices was recorded at initial assessment; no further mention and so absence is assumed. Portal hypertensive gastropathy present in 3 (8.6%) participants at inclusion and developed in a further two postbanding. | |
| Grade III or IV, or grade II with signs of high risk, classified using the Paquet’s system (Paquet 1978) | Not stipulated | Grade II Banding: 2/52 (4%) Control: 1/50 (2%) Grade III Banding: 36/52 (69%) No intervention: 38/50 (76%) Grade IV Banding: 14/52 (27%) No intervention: 11/50 (22%) | Not described | |
| Varices of any size: Small varices: < 5 mm diameter Large varices: diameter of largest varix > 5 mm Measured with open forceps and not disappearing on oesophageal insufflation | Assessed endoscopically by two independent observers | Small varices Banding: 14/25 (56%) No intervention: 17/27 (63%) Large varices Banding: 11/25 (44%) No intervention: 10/27 (37%) Red spots Banding: 9/25 (36%) No intervention: 8/27 (30%) | Gastric varices present at inclusion Banding: 2/25 (8%) No intervention: 1/27 (4%) No further participants in the banding group developed gastric varices during follow‐up; two participants in whom the varices were obliterated appear to have developed portal hypertensive gastropathy from which they bled. | |
| Japanese Research Society for Portal Hypertension classification (Inokuchi 1980) (Form: F1‐ straight varices; F2‐ enlarged tortuous varices; F3‐ largest sized varices; fundamental colour: Cw ‐ white varices; Cb ‐ blue varices: red colour signs: RC(‐) ‐ red colour signs negative; RC(+) ‐ red colour signs positive; red wale marks: RWM ‐ (+), (++), (+++); cherry‐red spots: CRS ‐ (+), (++), (+++); haematocystic spot: HCS: diffuse redness: DR; Group A: both red wale markings and cherry‐red spots were negative or mild (+); Group B: both red wale markings and cherry‐red spots were moderate (++) or severe (+++). Location: li ‐ locus inferior; Lm ‐ locus medialis; Ls ‐ locus superior Paquet classification: 0 ‐ no varices; I ‐ varices that disappear with insufflation; II ‐ larger, usually straight, visible varices that disappear with insufflation; III ‐ more prominent coil‐shaped varices, occupying part of the lumen; IV ‐ tortuous varices occupying the lumen (Paquet 1978). | ||||
| Banding | ||||||
| Equipment | Not described | Endoscopic ligating device (Bard Interventional Products, Billerica, MA, USA) with a 25 cm overtube (Olympus XQ 20, Tokyo, Japan) | Endoscopic ligating device (Bard Interventional Products, Billerica, MA, USA) with a 25 cm overtube (Olympus XQ 20, Tokyo, Japan) | Endoscopic ligating device and a 25 cm overtube (Bard Inteventional Products, Tewksbury MA, USA) | Endoscopic ligation device (Suction oesophageal varices | Multiband Ligator 6 shooter (Wilson‐Cook, Limerick, Ireland) |
| Operator experience | Not described | Ligation was performed by two | Ligation was performed by two | Not described | Ligation was performed by two experienced endoscopists; each of whom had performed | Ligation was performed by four experienced endoscopists each of whom had performed 100 ligation |
| Technique | ‐Variceal ligation performed at 2‐ to 3‐ week intervals | ‐ Ligation was performed at 1 cm to 5 cm above the gastroesophageal junction; each varix was ligated with 1 to 3 rubber bands to a maximum of 10 bands/session ‐ Procedure repeated weekly for the first 3 weeks, if possible and then every 2 weeks ‐ Follow‐up endoscopy repeated every 3 months after eradication | ‐ Ligation was performed at 1 cm to 5 cm above the gastroesophageal junction; each varix was ligated with 1 to 2 rubber bands ‐ Procedure repeated at intervals of 3 weeks ‐ Follow‐up endoscopy repeated every 3 months after eradication | ‐ Varices ligated 1 cm to 2 cm above the gastroesophageal junction; 1 to 2 bands applied to each variceal column between the lower 4 cm to 5 cm of the oesophagus; every variceal column was ligated at each session ‐ Procedure repeated at 7‐ to 10‐day intervals ‐ Follow‐up endoscopy repeated every 3 months after eradication | ‐ The largest number possible (up to ‐ The first three therapeutic sessions were performed at 2‐week intervals then monthly ‐ Follow‐up endoscopy repeated every 3 months after eradication ‐ Participants in the no treatment group were endoscoped every 3 months | ‐ Bands were placed starting at the gastroesophageal junction and then proximally in a helical fashion for approximately 5 cm, putting at least one band on each varix ‐ Subsequent sessions scheduled at 14‐day intervals ‐ Participants in the no intervention group were endoscoped yearly |
| Endpoint | Variceal eradication | Variceal eradication | Varices obliterated or too small to be ligated | Variceal obliteration or decreasing the size to grade 1 (not possible to suck in varix for band ligation) | Varices too small to treat | Eradication or varices too small to ligate (no effect of suction) |
| Achievement of endpoint | 71/80 (88.7%) | 62/62 (100%) | 55/64 (86%) | Banding successful in all participants, except for those who died before complete eradication (numbers not specified) | 42/52 (81%) (includes 8 eradicated, 34 too small to band) | 20/25 (80%) |
| Reasons for failure | Not reported | Not applicable | Reluctance (3) Asthenia (2) Aspiration pneumonia (1) Encephalopathy (1) Hepatic failure (2) | Death due to hepatic coma or bleeding (numbers not specified) | Not reported | Bleeding (3) |
| Mean (± 1 SD) number of sessions to achieve obliteration | 2.9 ± 0.7 | 3.6 ± 1.7 Mean examinations 5.1 ± 2.8 | 2.9 ± 0.5 (range 2 to 5) | 3.2 ± 1.2 | 4.8 ± 1.8 | Median 2 (1 to 4) Small varices, median 1 (1 to 4) Large varices, median 2 (1 to 3) |
| Mean (± 1 SD) time to achieve obliteration | Not reported | 75.6 ± 28.4 days | 40 ± 4 days | 4.9 ± 2.2 weeks | Not reported | Median 28 (14 to 101) days |
| Number of bands each session | Not reported | Maximum did not exceed 10 bands per treatment session | 1 to 2 per varix (mean not specified) | Each variceal column ligated with one to two bands (mean not specified) | Up to 6 | Median: 4 (2 to 7) per session |
| Recurrent varices | Not reported | 26/62 (42%) (of which 4 had a second recurrence) | 12 (21.8%) | 10 (28.6%) | 16 (31.0%) | 7 (35%) 3/11 with small varices and 4/8 with large |
| Japanese Research Society for Portal Hypertension classification (Inokuchi 1980) (Form: F1‐ straight varices; F2‐ enlarged tortuous varices; F3‐ largest sized varices; fundamental colour: Cw ‐ white varices; Cb ‐ blue varices: red colour signs: RC(‐) ‐ red colour signs negative; RC(+) ‐ red colour signs positive; red wale marks: RWM ‐ (+), (++), (+++); cherry‐red spots: CRS ‐ (+), (++), (+++); haematocystic spot: HCS: diffuse redness: DR; Group A: both red wale markings and cherry‐red spots were negative or mild (+); Group B: both red wale markings and cherry‐red spots were moderate (++) or severe (+++). Location: li ‐ locus inferior; Lm ‐ locus medialis; Ls ‐ locus superior Paquet classification: 0 ‐ no varices; I ‐ varices that disappear with insufflation; II ‐ larger, usually straight, visible varices that disappear with insufflation; III ‐ more prominent coil‐shaped varices, occupying part of the lumen; IV ‐ tortuous varices occupying the lumen (Paquet 1978). | ||||||
| Trial | Participants allocated to band ligation (n) | Participants allocated to no intervention (n) | Non‐serious adverse event in participants allocated to band ligation |
| 80 | 76 | Not reported | |
| 62 | 64 | Not reported | |
| 66* | 67* | Banding: oesophageal ulceration without bleeding (n = 16 (24%)), transient dysphagia (n = 7 (11%)), retrosternal pain (n = 5 (8%)), pleural effusion (n = 2 (3%)), fever > 38oC (n = 2 (3%)) No intervention: not reported | |
| 35 | 33 | Banding: oesophageal ulceration without bleeding (n = 24 (69%)), throat pain (n = 12 (34%)); retrosternal pain (n = 8 (23%)), dysphagia (n = 6 (17%)), fever (n = 4 (11%)) No intervention: not reported | |
| 52 | 50 | Banding: ulcer (n = 2 (4%)), dysphagia (n = 3 (6%)), odynophagia (n = 1 (2%)), others (n = 4 (8%)) No intervention: ulcer (n = 0), dysphagia (n = 4 (8%)), odynophagia (n = 2 (4%)), others (n = 1 (2%)) | |
| 25** | 27 | Banding: small varices: ulcers (n = 7 (30.5%)), dysphagia (n = 5 (21.7%)), heartburn (n = 9 (39.2%)), chest pain (n = 3 (13.0%)) large varices: ulcers (n = 2 (8.7%)), dysphagia (n = 5 (21.7%)), heartburn (n = 4 (17.4%)), chest pain (n = 2 (8.7%)), fever (n = 1 (8.7%)) No intervention: not reported | |
| * Three participants in the banding and three participants in the no intervention groups were lost to follow‐up. The authors omitted these 6 participants providing data on only 63 in the banding and 64 in the no intervention groups in their main analyses; we have included the number randomised in our analyses and recalculated the percentages of people with non‐serious adverse effects using the full data set. ** Two participants allocated to band ligation refused the procedure; the authors provide data on the complications which arose in the 23 participants who did undergo the procedure. | |||
| Outcome or subgroup title | No. of studies | No. of participants | Statistical method | Effect size |
| 1 Mortality, by liver injury Show forest plot | 6 | 637 | Risk Ratio (M‐H, Random, 95% CI) | 0.55 [0.43, 0.70] |
| 1.1 RCTs including participants with cirrhosis | 5 | 569 | Risk Ratio (M‐H, Random, 95% CI) | 0.55 [0.43, 0.71] |
| 1.2 RCTs including participants with or without cirrhosis | 1 | 68 | Risk Ratio (M‐H, Random, 95% CI) | 0.47 [0.16, 1.42] |
| 2 Mortality, by size of varices Show forest plot | 6 | 637 | Risk Ratio (M‐H, Random, 95% CI) | 0.55 [0.43, 0.70] |
| 2.1 RCTs including participants with medium and large varices | 5 | 585 | Risk Ratio (M‐H, Random, 95% CI) | 0.54 [0.42, 0.69] |
| 2.2 RCTs including participants with small or large varices | 1 | 52 | Risk Ratio (M‐H, Random, 95% CI) | 0.69 [0.32, 1.49] |
| 3 Upper gastrointestinal bleeding, by liver injury Show forest plot | 6 | 637 | Risk Ratio (M‐H, Random, 95% CI) | 0.44 [0.28, 0.72] |
| 3.1 RCTs including participants with cirrhosis | 5 | 569 | Risk Ratio (M‐H, Random, 95% CI) | 0.48 [0.29, 0.80] |
| 3.2 RCTs including participants with or without cirrhosis | 1 | 68 | Risk Ratio (M‐H, Random, 95% CI) | 0.22 [0.07, 0.70] |
| 4 Upper gastrointestinal bleeding, by size of varices Show forest plot | 6 | 637 | Risk Ratio (M‐H, Random, 95% CI) | 0.44 [0.28, 0.72] |
| 4.1 RCTs including participants with medium and large varices | 5 | 585 | Risk Ratio (M‐H, Random, 95% CI) | 0.40 [0.27, 0.59] |
| 4.2 RCTs including participants with small or large varices | 1 | 52 | Risk Ratio (M‐H, Random, 95% CI) | 2.7 [0.57, 12.68] |
| 5 Serious adverse events, by liver injury Show forest plot | 6 | 637 | Risk Ratio (M‐H, Random, 95% CI) | 0.55 [0.43, 0.70] |
| 5.1 RCTs including participants with cirrhosis | 5 | 569 | Risk Ratio (M‐H, Random, 95% CI) | 0.57 [0.44, 0.73] |
| 5.2 RCTs including participants with or without cirrhosis | 1 | 68 | Risk Ratio (M‐H, Random, 95% CI) | 0.35 [0.16, 0.79] |
| 6 Serious adverse events, by size of varices Show forest plot | 6 | 637 | Risk Ratio (M‐H, Random, 95% CI) | 0.55 [0.43, 0.70] |
| 6.1 RCTs including participants with medium and large varices | 5 | 585 | Risk Ratio (M‐H, Random, 95% CI) | 0.53 [0.41, 0.69] |
| 6.2 RCTs including participants with small or large varices | 1 | 52 | Risk Ratio (M‐H, Random, 95% CI) | 0.75 [0.39, 1.44] |
| 7 Variceal bleeding, by liver injury Show forest plot | 6 | 637 | Risk Ratio (M‐H, Random, 95% CI) | 0.43 [0.27, 0.69] |
| 7.1 RCTs including participants with cirrhosis | 5 | 569 | Risk Ratio (M‐H, Random, 95% CI) | 0.47 [0.28, 0.78] |
| 7.2 RCTs including participants with or without cirrhosis | 1 | 68 | Risk Ratio (M‐H, Random, 95% CI) | 0.22 [0.07, 0.70] |
| 8 Variceal bleeding, by size of varices Show forest plot | 6 | 637 | Risk Ratio (M‐H, Random, 95% CI) | 0.43 [0.27, 0.69] |
| 8.1 RCTs including participants with medium and large varices | 5 | 585 | Risk Ratio (M‐H, Random, 95% CI) | 0.38 [0.26, 0.55] |
| 8.2 RCTs including participants with small or large varices | 1 | 52 | Risk Ratio (M‐H, Random, 95% CI) | 2.7 [0.57, 12.68] |
| Outcome or subgroup title | No. of studies | No. of participants | Statistical method | Effect size |
| 1 Mortality Show forest plot | 6 | Risk Ratio (M‐H, Random, 95% CI) | Subtotals only | |
| 1.1 Worst‐case scenario analysis | 6 | 637 | Risk Ratio (M‐H, Random, 95% CI) | 0.59 [0.46, 0.74] |
| 1.2 Extreme worst‐case scenario analysis | 6 | 637 | Risk Ratio (M‐H, Random, 95% CI) | 0.59 [0.46, 0.74] |
| 1.3 Extreme best‐case scenario analysis | 6 | 637 | Risk Ratio (M‐H, Random, 95% CI) | 0.53 [0.42, 0.68] |
| 2 Upper gastrointestinal bleeding Show forest plot | 6 | Risk Ratio (M‐H, Random, 95% CI) | Subtotals only | |
| 2.1 Worst‐case scenario analysis | 6 | 637 | Risk Ratio (M‐H, Random, 95% CI) | 0.48 [0.28, 0.83] |
| 2.2 Extreme worst‐case scenario analysis | 6 | 637 | Risk Ratio (M‐H, Random, 95% CI) | 0.48 [0.28, 0.83] |
| 2.3 Extreme best‐case scenario analysis | 6 | 637 | Risk Ratio (M‐H, Random, 95% CI) | 0.43 [0.27, 0.67] |
| 3 Serious adverse events Show forest plot | 6 | Risk Ratio (M‐H, Fixed, 95% CI) | Subtotals only | |
| 3.1 Worst‐case scenario analysis | 6 | 637 | Risk Ratio (M‐H, Fixed, 95% CI) | 0.56 [0.47, 0.66] |
| 3.2 Extreme worst‐case scenario analysis | 6 | 637 | Risk Ratio (M‐H, Fixed, 95% CI) | 0.56 [0.47, 0.66] |
| 3.3 Extreme best‐case scenario analysis | 6 | 637 | Risk Ratio (M‐H, Fixed, 95% CI) | 0.54 [0.45, 0.64] |
| 4 Variceal bleeding Show forest plot | 6 | Risk Ratio (M‐H, Random, 95% CI) | Subtotals only | |
| 4.1 Worst‐case scenario analysis | 6 | 637 | Risk Ratio (M‐H, Random, 95% CI) | 0.47 [0.27, 0.82] |
| 4.2 Extreme worst‐case scenario analysis | 6 | 637 | Risk Ratio (M‐H, Random, 95% CI) | 0.47 [0.27, 0.82] |
| 4.3 Extreme best‐case scenario analysis | 6 | 637 | Risk Ratio (M‐H, Random, 95% CI) | 0.41 [0.26, 0.65] |