| Yoga compared with wait‐list for urinary incontinence in women |
| Patient or population: women with either stress‐predominant or urge‐predominant urinary incontinence Settings: community Intervention: yoga Comparison: wait‐list |
| Number of women who report they are cured (they no longer experience urinary incontinence) | ‐ | ‐ | ‐ | ‐ | ‐ | The study did not report this outcome. |
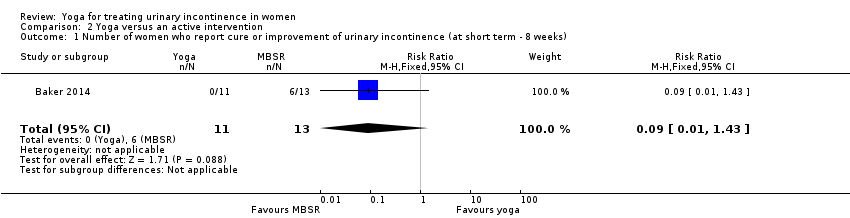
| Number of women who report cure or improvement of urinary incontinence at short term (six weeks) | 111 per 1000 | 703 per 1000
(160 to 1000) | RR 6.33 (1.44 to 27.88) | 18
(1 study) | ⊕⊝⊝⊝
very low1,2 | Number of women who reported satisfaction with change in urine leakage. |
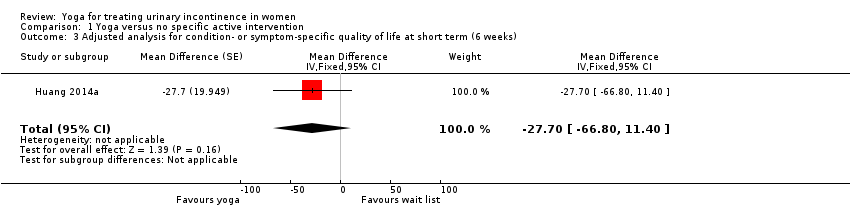
| Urinary incontinence condition‐ or symptom‐specific quality of life at short term (6 weeks) Measured by Incontinence Impact Questionnaire Short Form (IIQ‐7) (lower = better) | The mean change in the control group was a decrease of 31 units. | The mean change in the intervention group was 1.74 units higher (33.02 units lower to 36.50 units higher). | Not applicable | 18
(1 study) | ⊕⊝⊝⊝
very low1,2 | |
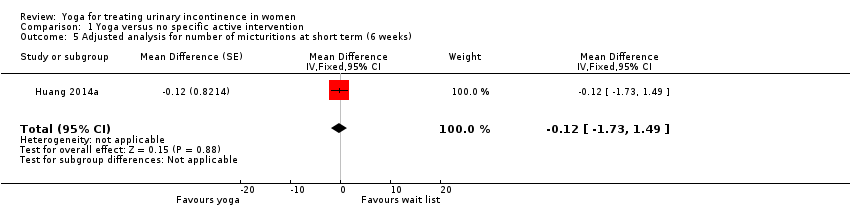
| Number of micturitions (daily) at short term (6 weeks) | The mean change in the control group was a decrease of 0.13 micturitions. | The mean change in the intervention group was
0.77 fewer micturitions (2.13 fewer to 0.59 more). | Not applicable | 18
(1 study) | ⊕⊝⊝⊝
very low1,2 | |
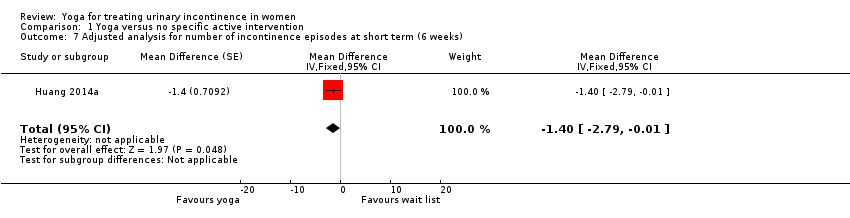
| Number of episodes of incontinence (daily) at short term (6 weeks) | The mean change in the control group was a decrease of 0.27 episodes. | The mean change in the intervention group was
1.57 fewer episodes (2.83 to 0.31 to fewer). | Not applicable | 18
(1 study) | ⊕⊝⊝⊝
very low1,2 | |
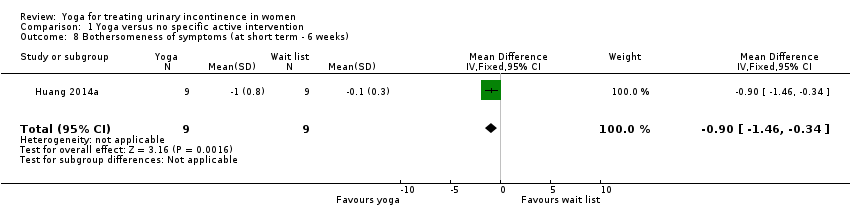
| Bothersomeness of symptoms at short term (6 weeks) Measured by Urogenital Distress Inventory 6 (UDI‐6) (lower = better) | The mean change in the control group was a decrease of 0.1 units. | The mean change in the intervention group was 0.90 units lower (0.34 to 1.46 lower). | Not applicable | 18
(1 study) | ⊕⊝⊝⊝
very low1,2 | |
| Adverse effects at short term (6 weeks) | 222 per 1000 | 222 per 1000
(0 to 600) | RD 0% (‐38% to 38%) | 18
(1 study) | ⊕⊝⊝⊝
very low1,2 | 2 women in each group reported an adverse effect. However, there were 7 adverse effects overall and the distribution of adverse effects between groups is not reported. None of the adverse effects were considered to be potentially related to the study and none were serious. |
| *The basis for the assumed risk (e.g. the median control group risk across studies) is provided in footnotes. The corresponding risk (and its 95% confidence interval) is based on the assumed risk in the comparison group and the relative effect of the intervention (and its 95% CI).
CI: confidence interval; RD: risk difference; RR: risk ratio |
| GRADE Working Group grades of evidence
High certainty: Further research is very unlikely to change our confidence in the estimate of effect.
Moderate certainty: Further research is likely to have an important impact on our confidence in the estimate of effect and may change the estimate.
Low certainty: Further research is very likely to have an important impact on our confidence in the estimate of effect and is likely to change the estimate.
Very low certainty: We are very uncertain about the estimate. |