IRM de la próstata, con o sin biopsia dirigida por IRM y biopsia sistemática para detectar el cáncer de próstata
Resumen
Antecedentes
La imagen por resonancia magnética (IRM) multiparamétrica, con o sin biopsia dirigida por IRM, es una prueba alternativa a la biopsia sistemática dirigida por ecografía transrectal en pacientes con sospecha de cáncer de próstata. Actualmente, la evidencia acerca de qué prueba se debe utilizar es insuficiente para colaborar con la toma de decisiones basada en evidencia detallada.
Objetivos
Determinar la exactitud diagnóstica de las pruebas iniciales con IRM sola, la biopsia dirigida por IRM, la guía clínica con IRM (IRM con o sin biopsia dirigida por IRM) y la biopsia sistemática en comparación con la biopsia guiada por plantilla como patrón de referencia para detectar el cáncer de próstata clínicamente significativo como la enfermedad de interés, definida como grado 2 o más según la International Society of Urological Pathology (ISUP). Las enfermedades de interés secundarias fueron las detección de cáncer de próstata de grado 1, grado 3 o de grado mayor, y un posible cambio en la cantidad de procedimientos de biopsia.
Métodos de búsqueda
Se realizó una búsqueda bibliográfica sistemática exhaustiva hasta el 31 de julio de 2018. Se realizaron búsquedas en CENTRAL, MEDLINE, Embase, otras ocho bases de datos y en un registro de ensayos.
Criterios de selección
Se tuvieron en cuenta para la inclusión todos los estudios transversales, que investigaran una o más pruebas iniciales comprobadas por el patrón de referencia, o que investigaran la correspondencia entre la guía clínica con IRM y la biopsia sistemática, ambas realizadas en el mismo individuo. Solamente se incluyeron los estudios con pacientes masculinos sin biopsia previa o que anteriormente tuvieron un resultado negativo de la biopsia (o una combinación de ambos criterios). Los estudios que incluyeron la IRM debían informar tanto sobre los pacientes con IRM positiva como con IRM negativa. Todos los estudios debían informar sobre la enfermedad de interés primaria.
Obtención y análisis de los datos
Dos autores de la revisión extrajeron de forma independiente los datos y evaluaron el riesgo de sesgo mediante la herramienta QUADAS‐2. Para calcular la exactitud de la prueba, se estimó la sensibilidad y la especificidad con el modelo de dos variables. Para calcular la correspondencia entre la guía clínica con IRM y la biopsia sistemática, se sintetizaron los cocientes de detección mediante metanálisis de efectos aleatorios. Para calcular las proporciones de participantes con cáncer de próstata detectado por una sola de las pruebas iniciales, se utilizaron modelos de regresión logística binarios o polinomiales de efectos aleatorios. Se utilizaron los criterios GRADE para evaluar la certeza de la evidencia de las comparaciones principales.
Resultados principales
Los análisis de la exactitud de la prueba incluyeron 18 estudios en total.
IRM comparada con la biopsia guiada por plantilla: Sobre la base de una sensibilidad agrupada de 0,91 (intervalo de confianza [IC] del 95%: 0.83 a 0,95; 12 estudios; baja certeza de la evidencia) y una especificidad combinada de 0,37 (IC del 95%: 0.29 a 0,46; 12 estudios; certeza baja de la evidencia) usando una prevalencia inicial del 30%, el IRM puede resultar en 273 (IC del 95%: 249 a 285) verdaderos positivos, 441 falsos positivos (IC del 95%: 378 a 497), 259 verdaderos negativos (IC del 95%: 203 a 322) y 27 (IC del 95%: 15 a 51) falsos negativos cada 1000 pacientes. Se bajó el nivel de la certeza de la evidencia debido a limitaciones e inconsistencias en el estudio.
Biopsia dirigida por IRM en comparación con biopsia guiada por plantilla: Sobre la base de una sensibilidad agrupada de 0,80 (IC del 95%: 0.69 a 0,87; ocho estudios; baja certeza de la evidencia) y una especificidad combinada de 0,94 (IC del 95%: 0.90 a 0,97; ocho estudios; certeza baja de la evidencia) usando una prevalencia inicial del 30%, la biopsia dirigida por IRM puede resultar en 240 (IC del 95%: 207 a 261) verdaderos positivos, 42 (IC del 95%: 21 a 70) falsos positivos, 658 (IC del 95%: 630 a 679) verdaderos negativos y 60 (IC del 95%: 39 a 93) falsos negativos cada 1000 pacientes. Se bajó el nivel de la certeza de la evidencia debido a limitaciones e inconsistencias en el estudio.
Guía clínica con IRM en comparación con biopsia guiada por plantilla: Sobre la base de una sensibilidad agrupada de 0,72 (IC del 95%: 0.60 a 0,82; ocho estudios; baja certeza de la evidencia) y una especificidad combinada de 0,96 (IC del 95%: 0.94 a 0,98; ocho estudios; certeza baja de la evidencia) usando una prevalencia inicial del 30%, la vía de la IRM puede resultar en 216 (IC del 95%: 180 a 246) verdaderos positivos, 28 (IC del 95%: 14 a 42) falsos positivos, 672 (IC del 95%: 658 a 686) verdaderos negativos y 84 (IC del 95%: 54 a 120) falsos negativos cada 1000 pacientes. Se bajó el nivel de la certeza de la evidencia debido a limitaciones, inconsistencia e imprecisión en el estudio.
Biopsia sistemática en comparación con biopsia guiada por plantilla: Sobre la base de una sensibilidad agrupada de 0,63 (IC del 95%: 0.19 a 0,93; cuatro estudios; baja certeza de la evidencia) y una especificidad combinada de 1,00 (IC del 95%): 0.91 a 1,00; cuatro estudios; certeza baja de la evidencia) usando una prevalencia inicial del 30%, la biopsia sistemática puede resultar en 189 (IC del 95%: 57 a 279) verdaderos positivos, 0 (IC del 95%: 0 a 63) falsos positivos, 700 (IC del 95%: 637 a 700) verdaderos negativos y 111 (IC del 95%: 21 a 243) falsos negativos cada 1000 pacientes. Se bajó el nivel de la certeza de la evidencia debido a limitaciones e inconsistencias en el estudio.
Análisis de correspondencia: En una población mixta de hombrees sin biopsia previa y con biopsia previa negativa que comparó la guía clínica con IRM frente a la biopsia sistemática, se halló un cociente de detección agrupado de 1,12 (IC del 95%: 1,02 a 1,23; 25 estudios). Se encontraron cocientes de detección agrupados de 1,44 (IC del 95%: 1,19 a 1,75; 10 estudios) en hombres con biopsia negativa previa y 1,05 (IC del 95%): 0,95 a 1,16; 20 estudios) en hombres sin biopsia previa.
Conclusiones de los autores
Entre las estrategias diagnósticas que se tuvieron en cuenta, la guía clínica con IRM tiene la exactitud diagnóstica más favorable en la detección del cáncer de próstata clínicamente significativo. En comparación con la biopsia sistemática, aumenta la cantidad detectada de cáncer significativo y al mismo tiempo reduce la cantidad diagnosticada de cáncer no significativo. La certeza en estos resultados se vio reducida por las limitaciones del estudio, cuestiones específicas relacionadas con el sesgo de selección, así como la inconsistencia. En función de estos resultados, se debería tratar de mejorar aún más las guías clínicas diagnósticas del cáncer de próstata.
Resumen en términos sencillos
La IRM de la próstata, con o sin biopsia dirigida por IRM, ¿es mejor que la biopsia sistemática para detectar el cáncer de próstata en los hombres?
Antecedentes
Muchos tipos de cáncer de próstata tienen un crecimiento lento y tal vez no tengan efectos perjudiciales a lo largo de la vida de un individuo. Al mismo tiempo, los tipos de cáncer clínicamente significativos pueden causar problemas como obstrucción de las vías urinarias, lesiones óseas dolorosas y la muerte. Para detectar estos tipos de cáncer de manera temprana, habitualmente se utiliza la prueba de antígeno prostático específico (PSA) seguida de muestras de tejido de la próstata con guía ecográfica. Más recientemente, para ayudar a establecer un diagnóstico, también se utilizó la imagen por resonancia magnética (IRM).
¿Cuál era el objetivo de esta revisión?
El objetivo de esta revisión fue comparar la IRM sola, la IRM más una biopsia, y una guía clínica que utiliza la IRM para ayudar a decidir si se debe hacer una biopsia o no (de aquí en adelante se denominará como “guía clínica con IRM”) con la biopsia estándar con guía ecográfica (de aquí en adelante se denominará como “biopsia sistemática”) en referencia a la biopsia guiada por plantilla.
¿Cuáles son los principales resultados?
Se examinó la evidencia hasta julio de 2018. La revisión incluyó 43 estudios, principalmente de países occidentales, de hombres de 61 a 73 años de edad.
En una población de 1000 hombres en riesgo de cáncer de próstata, donde 300 hombres en realidad tienen cáncer de próstata clínicamente significativo, la IRM identificará correctamente a 273 hombres con cáncer de próstata clínicamente significativo pero no a los 27 hombres restantes; para los 700 hombres que no tienen cáncer de próstata clínicamente significativo, la IRM identificará correctamente a 259 como que no tienen cáncer de próstata pero clasificará erróneamente a 441 hombres con cáncer de próstata clínicamente significativo.
En la misma población, la biopsia dirigida por IRM identificará correctamente a 240 de 300 hombres con cáncer de próstata clínicamente significativo, pero no a los 60 hombres restantes; para los 700 hombres que no tienen cáncer de próstata clínicamente significativo, la IRM identificará correctamente a 658 que no tienen cáncer de próstata, pero clasificará erróneamente a 42 hombres con cáncer de próstata clínicamente significativo.
La vía de la IRM identificará correctamente a 216 de 300 hombres con cáncer de próstata clínicamente significativo, pero no a los 84 hombres restantes; para los 700 hombres que no tienen cáncer de próstata clínicamente significativo, la vía de la IRM identificará correctamente a 672 como que no tienen cáncer de próstata, pero clasificará erróneamente a 28 hombres como que tienen cáncer de próstata clínicamente significativo.
Las biopsias sistemáticas identificarán correctamente a 189 de 300 hombres con cáncer de próstata clínicamente significativo, pero no a los 111 hombres restantes; para los 700 hombres que no tienen cáncer de próstata clínicamente significativo, las biopsias sistemáticas pueden identificar correctamente a los 700 como que no tienen cáncer de próstata y no clasificarán erróneamente a ningún hombre con cáncer de próstata clínicamente significativo.
Cuando se compara la guía clínica con IRM con la biopsia sistemática en un grupo mixto de hombres que podrían o no haberse sometido a una biopsia previa, se halló que la guía clínica con IRM tiene un 12% más de probabilidades de establecer un diagnóstico correcto. En los hombres sin una biopsia previa, la guía clínica con IRM tiene un 5% más de probabilidades de establecer un diagnóstico correcto, mientras que en los hombres que tuvieron un resultado negativo en la biopsia, hay un 44% más de probabilidades de establecer un diagnóstico correcto.
¿Cuán confiable es la evidencia?
La calidad de la evidencia de los resultados principales de esta revisión se calificó como baja. Es probable que las investigaciones adicionales de alta calidad modifiquen estos resultados.
¿Cuáles son las implicaciones de esta revisión?
Los resultados de esta revisión Cochrane indican que la guía clínica con IRM es mejor que las biopsias sistemáticas para establecer un diagnóstico correcto de cáncer de próstata clínicamente significativo. Sin embargo, la guía clínica con IRM aún no logra identificar a algunos pacientes con cáncer de próstata clínicamente significativo. Por lo tanto, es importante seguir investigando en esta área.
Authors' conclusions
Summary of findings
| Detecting ISUP grade 2 or higher prostate cancer by MRI, MRI‐targeted biopsy, MRI pathway and systematic biopsy | ||||||||||
| Population | 13,770 men with a suspicion of prostate cancer (PSA‐ or DRE‐based) undergoing their first biopsy (biopsy‐naïve men) or a repeat biopsy (prior‐negative biopsy men) | |||||||||
| Setting | University hospitals and specialized care centers | |||||||||
| Index tests | MRI; MRI‐targeted biopsy (MRI‐TBx) in men with a positive MRI; the MRI pathway (MRI with or without MRI‐TBx); and systematic biopsy (SBx) | |||||||||
| Reference standard | Template‐guided biopsy, which comprehensively samples all zones of the prostate | |||||||||
| Tests | Population type (biopsy‐naïve, prior‐negative biopsy, or mixed) | Summary | Summary | Detection | Missed grade 2 or higher prostate cancer per 1000 men (95% CI)a | Number of | Number of studies with a | |||
| Participant | Index | Reference | Flow and timing | |||||||
| MRI | Mixed | 0.91 | 0.37 | NA | 27 | 3091 (12) | 7 | 0 | 11 | 2 |
| MRI‐TBx | Mixed | 0.80 | 0.94 | NA | 60 | 1553 (8) | 4 | 0 | 6 | 0 |
| MRI pathway | Mixed | 0.72 | 0.96 | NA | 84 | 2257 (8) | 4 | 0 | 6 | 0 |
| SBx | Mixed | 0.63 | 1.00 | NA | 111 | 3421 (4) | 2 | 1 | 1 | 1 |
| MRI pathwayvs SBx | Mixed | NA | NA | 1.12 | MRI pathway missed 12% (2 to 23) less than SBx | 6944 (25) | 13 | 15 | NA | 8 |
| Biopsy‐naïve | NA | NA | 1.05 | MRI pathway missed 5% (−5 to 16) less than SBx | 5219 (20) | 9 | 12 | NA | 7 | |
| Prior‐negative biopsy | NA | NA | 1.44 | MRI pathway missed 44% (19 to 75) less than SBx | 1564 (10) | 5 | 6 | NA | 1 | |
| DRE: digital rectal exam; ISUP: International Society of Urological Pathology; MRI: magnetic resonance imaging; MRI‐TBx: MRI‐targeted biopsy; MRI pathway: magnetic resonance imaging with or without magnetic resonance imaging‐targeted biopsy; N: number; NA: not applicable; PSA: prostate‐specific antigen; SBx: systematic biopsy. | ||||||||||
| Detecting ISUP grade 1 prostate cancer by MRI, MRI‐targeted biopsy, MRI pathway and systematic biopsy | ||||||||||
| Population | 10,051 men with a suspicion of prostate cancer (PSA‐ or DRE‐based) undergoing their first biopsy (biopsy‐naïve men) or a repeat biopsy (prior‐negative biopsy men) | |||||||||
| Setting | University hospitals and specialized care centers | |||||||||
| Index tests | MRI; MRI‐targeted biopsy (MRI‐TBx) in men with a positive MRI; the MRI pathway (MRI with or without MRI‐TBx); and systematic biopsy (SBx) | |||||||||
| Reference standard | Template‐guided biopsy, which comprehensively samples all zones of the prostate | |||||||||
| Tests | Population type (biopsy‐naïve, prior‐negative biopsy, or mixed) | Summary | Summary | Detection | Avoided | Number of | Number of studies with a | |||
| Participant | Index | Reference | Flow and timing | |||||||
| MRI | Mixed | 0.70 | 0.27 | NA | 63 | 1764 (10) | 5 | 0 | 5 | 1 |
| MRI‐TBx | Mixed | 0.51 | 1.00 | NA | 103 | 497 (5) | 3 | 0 | 3 | 0 |
| MRI pathway | Mixed | 0.34 | 1.00 | NA | 139 | 681 (5) | 3 | 0 | 3 | 0 |
| SBx | Mixed | 0.55 | 0.99 | NA | 95 | 3421 (4) | 2 | 1 | 1 | 1 |
| MRI pathwayvs SBx | Mixed | NA | NA | 0.61 | MRI pathway | 5442 (21) | 11 | 11 | NA | 8 |
| Biopsy‐naïve | NA | NA | 0.63 | 4079 (17) | 9 | 9 | NA | 7 | ||
| Prior‐negative biopsy | NA | NA | 0.62 | 1202 (8) | 5 | 5 | NA | 2 | ||
| DRE: digital rectal exam; ISUP: International Society of Urological Pathology; MRI: magnetic resonance imaging; MRI‐TBx: MRI‐targeted biopsy; MRI pathway: magnetic resonance imaging with or without magnetic resonance imaging‐targeted biopsy; N: number; NA: not applicable; PSA: prostate‐specific antigen; SBx: systematic biopsy. aAt the representative pre‐test probability of 21% of having grade 1 prostate cancer, based on prevalence findings in the test accuracy analysis (proportion avoided = [prevalence*1000]*[1‐sensitivity]). | ||||||||||
| Question: Should MRI be used to diagnose ISUP grade 2 or higher prostate cancer in men suspected of having clinically significant prostate cancer? | |||||
| Population: men suspected of having clinically significant prostate cancer undergoing their first biopsy (biopsy‐naïve men) or a repeat biopsy (prior‐negative biopsy men) | |||||
| Setting: university hospitals and specialized care centers | |||||
| New test: MRI only | Cut‐off value: MRI score ≥ 3 out of 5 | |||||
| Reference test: template‐guided biopsy, which comprehensively samples all zones of the prostate | Threshold: ISUP grade 2 or higher prostate cancer | |||||
| Pooled sensitivity: 0.91 (95% CI: 0.83 to 0.95) | Pooled specificity: 0.37 (95% CI: 0.29 to 0.46) | |||||
| Test result | Number of results per 1,000 men tested (95% CI) | Number of participants (studies) | Certainty of the evidence (GRADE) | ||
| Prevalence 10% | Prevalence 30% | Prevalence 40% | |||
| True positives | 9 (83 to 95) | 273 (249 to 285) | 364 (332 to 380) | 3091 (12) | ⊕⊕○○ LOWa, b |
| False negatives | 9 (5 to 17) | 27 (15 to 51) | 36 (20 to 68) | ||
| True negatives | 333 (261 to 414) | 259 (203 to 322) | 222 (174 to 276) | 3091 (12) | ⊕⊕○○ LOWa, b |
| False positives | 567 (486 to 639) | 441 (378 to 497) | 378 (324 to 426) | ||
| MRI: magnetic resonance imaging; ISUP: International Society of Urological Pathology; CI: confidence interval aA considerable number of studies had a high or unclear risk of bias, mainly in the participant selection and reference standard domains. | |||||
| Question: Should MRI‐targeted biopsy be used to diagnose ISUP grade 2 or higher prostate cancer in men suspected of having clinically significant prostate cancer? | |||||
| Population: men with a positive MRI suspected of having clinically significant prostate cancer undergoing their first biopsy (biopsy‐naïve men) or a repeat biopsy (prior‐negative biopsy men) | |||||
| Setting: university hospitals and specialized care centers | |||||
| New test: MRI‐targeted biopsy | Threshold: ISUP grade 2 or higher prostate cancer | |||||
| Reference test: template‐guided biopsy, which comprehensively samples all zones of the prostate | Threshold: ISUP grade 2 or higher prostate cancer | |||||
| Pooled sensitivity: 0.80 (95% CI: 0.69 to 0.87) | Pooled specificity: 0.94 (95% CI: 0.90 to 0.97) | |||||
| Test result | Number of results per 1,000 men tested (95% CI) | Number of participants (studies) | Certainty of the evidence (GRADE) | ||
| Prevalence 10% | Prevalence 30% | Prevalence 40% | |||
| True positives | 80 (69 to 87) | 240 (207 to 261) | 320 (276 to 348) | 1553 (8) | ⊕⊕○○ LOWa, b |
| False negatives | 20 (13 to 31) | 60 (39 to 93) | 80 (52 to 124) | ||
| True negatives | 846 (810 to 873) | 658 (630 to 679) | 564 (540 to 582) | 1553 (8) | ⊕⊕○○ LOWa, b |
| False positives | 54 (27 to 90) | 42 (21 to 70) | 36 (18 to 60) | ||
| MRI: magnetic resonance imaging; ISUP: International Society of Urological Pathology; CI: confidence interval aA considerable number of studies had a high or unclear risk of bias, mainly in the participant selection and reference standard domains. | |||||
| Question: Should an MRI pathway be used to diagnose ISUP grade 2 or higher prostate cancer in men suspected of having clinically significant prostate cancer? | |||||
| Population: men suspected of having clinically significant prostate cancer undergoing their first biopsy (biopsy‐naïve men) or a repeat biopsy (prior‐negative biopsy men) | |||||
| Setting: university hospitals and specialized care centers | |||||
| New test: MRI pathway | Threshold: ISUP grade 2 or higher prostate cancer | |||||
| Reference test: template‐guided biopsy, which comprehensively samples all zones of the prostate | Threshold: ISUP grade 2 or higher prostate cancer | |||||
| Pooled sensitivity: 0.72 (95% CI: 0.60 to 0.82) | Pooled specificity: 0.96 (95% CI: 0.94 to 0.98) | |||||
| Test result | Number of results per 1,000 men tested (95% CI) | Number of participants (studies) | Certainty of the evidence (GRADE) | ||
| Prevalence 10% | Prevalence 30% | Prevalence 40% | |||
| True positives | 72 (60 to 82) | 216 (180 to 246) | 288 (240 to 328) | 2257 (8) | ⊕⊕○○ LOWa, b |
| False negatives | 28 (18 to 40) | 84 (54 to 120) | 112 (72 to 160) | ||
| True negatives | 864 (846 to 882) | 672 (658 to 686) | 576 (564 to 588) | 2257 (8) | ⊕⊕○○ LOWa, b |
| False positives | 36 (18 to 54) | 28 (14 to 42) | 24 (12 to 36) | ||
| MRI pathway: magnetic resonance imaging with or without magnetic resonance imaging‐targeted biopsy; ISUP: International Society of Urological Pathology; CI: confidence interval aA considerable number of studies had a high or unclear risk of bias, mainly in the participant selection and reference standard domains. | |||||
| Question: Should systematic biopsy be used to diagnose ISUP grade 2 or higher prostate cancer in men suspected of having clinically significant prostate cancer? | |||||
| Population: men suspected of having clinically significant prostate cancer undergoing their first biopsy (biopsy‐naïve men) or a repeat biopsy (prior‐negative biopsy men) | |||||
| Setting: university hospitals and specialized care centers | |||||
| New test: systematic biopsy | Threshold: ISUP grade 2 or higher prostate cancer | |||||
| Reference test: template‐guided biopsy, which comprehensively samples all zones of the prostate | Threshold: ISUP grade 2 or higher prostate cancer | |||||
| Pooled sensitivity: 0.63 (95% CI: 0.19 to 0.93) | Pooled specificity: 1.00 (95% CI: 0.91 to 1.00) | |||||
| Test result | Number of results per 1,000 men tested (95% CI) | Number of participants (studies) | Certainty of the evidence (GRADE) | ||
| Prevalence 10% | Prevalence 30% | Prevalence 40% | |||
| True positives | 63 (19 to 93) | 189 (57 to 279) | 252 (76 to 372) | 3421 (4) | ⊕⊕⊕○ MODERATEa, b, c |
| False negatives | 37 (7 to 81) | 111 (21 to 243) | 148 (28 to 324) | ||
| True negatives | 900 (819 to 900) | 700 (637 to 700) | 600 (546 to 600) | 3421 (4) | ⊕⊕○○ LOWa, b, c |
| False positives | 0 (0 to 81) | 0 (0 to 63) | 0 (0 to 54) | ||
| ISUP: International Society of Urological Pathology; CI: confidence interval aA considerable number of studies had a high or unclear risk of bias, mainly in the participant selection and reference standard domains. | |||||
Background
Target condition being diagnosed
Prostate cancer is the most frequently diagnosed solid cancer among men in high‐income countries (Torre 2015). Prostate cancer is the sixth leading cause of cancer death (7.4% of deaths) among men worldwide (Center 2012). A large proportion of prostate cancer, however, is indolent and will not lead to any complaints or death if left undetected (Bell 2015). When indolent prostate cancer is detected, it can be managed by active surveillance and does not necessarily need direct treatment. In contrast, clinically significant prostate cancer has direct therapeutic implications as it may progress, metastasise and lead to prostate cancer‐specific mortality.
Next to the psychological burden of becoming a cancer patient, the harm of overdiagnosing indolent prostate cancer mainly lies in overtreatment, as many men are still offered radical prostatectomy or radiotherapy. Given the sharp increase in prostate‐specific antigen (PSA)‐testing, prostate cancer diagnoses and the increasing concerns of overdiagnosis and overtreatment, the distinction between indolent and clinically significant prostate cancer has become more important (Ilic 2013). Defining clinically significant prostate cancer, however, remains difficult with varying definitions in the world literature (Moore 2013a). Established definitions are based on histologic parameters scored by the Gleason grading (Epstein 2010), or the International Society of Urological Pathology (ISUP) grade systems (Epstein 2016), with some using additional parameters like PSA, familial history, race or volume of cancer (Epstein 1994; Goto 1996; Harnden 2008; Wolters 2011). Moreover, other clinical parameters such as age and comorbidity may also influence the potential for progression and mortality of the individual with prostate cancer.
Clinical pathway
Opportunistic PSA‐based screening is practised worldwide and men considered to be at risk of clinically significant prostate cancer (elevated PSA level, abnormal digital rectal examination, African‐American origin and positive family history) are generally advised to have a systematic biopsy (Carter 2013; Carroll 2016; Mottet 2017). Prediction models and clinical risk calculators, using a variety of clinical parameters and biomarkers, are being investigated and implemented to help select patients for biopsy (Alberts 2019; Ankerst 2018; Ferro 2016; Foley 2016; Radtke 2017). The systematic biopsy may be repeated several times in the case of persistent suspicion of clinically significant prostate cancer after a prior‐negative biopsy or during active surveillance of indolent prostate cancer.
Any prostate biopsy is associated with a risk of infection (1% to 8%) and an increased risk of life‐threatening sepsis (1% to 4%), as a consequence of increasing antibiotic resistance (Borghesi 2017; Loeb 2013). Other associated morbidities include dysuria, hematospermia, haematuria, rectal bleeding, vasovagal episodes and urinary retention (Djavan 2001; Loeb 2013). These drawbacks of prostate biopsy limit the willingness of physicians and patients to perform and undergo potentially unnecessary biopsies.
In contrast with systematic biopsy, magnetic resonance imaging (MRI)‐targeted biopsy is only performed when suspected lesions for clinically significant prostate cancer are detected on MRI. Due to the selective performance of targeted biopsies, the MRI, with MRI‐targeted biopsy, is able to more accurately detect clinically significant prostate cancer while purposefully detecting less indolent prostate cancer (Schoots 2015; Siddiqui 2015). Therefore, MRI and MRI‐targeted biopsy are increasingly investigated in addition to or as a replacement for systematic biopsy, either in the setting of prior‐negative biopsy, initial biopsy or during active surveillance. Studies have shown that MRI and MRI‐targeted biopsy significantly improved the detection rate in the prior‐negative biopsy men, but not in biopsy‐naïve men (Schoots 2015; Valerio 2015). Moreover, randomised controlled trials performed in biopsy‐naïve men provide contradictory findings as to whether or not MRI with MRI‐targeted biopsy has a higher detection rate for clinically significant prostate cancer as compared to systematic biopsy (Baco 2016; Kasivisvanathan 2018; Panebianco 2015; Porpiglia 2017; Tonttilla 2016). Consequently, international guidelines recommend considering the use of MRI and MRI‐targeted biopsy, if available, in the setting of persistent clinical suspicion of prostate cancer after prior‐negative biopsy (AUA Guideline 2018; EAU Guideline 2018). However, international guidelines do not recommend a pre‐biopsy MRI or upfront MRI‐directed biopsy management in biopsy‐naïve men, let alone MRI‐directed biopsy management as an alternative to systematic biopsy. Figure 1 illustrates the clinical pathway and design of this review.
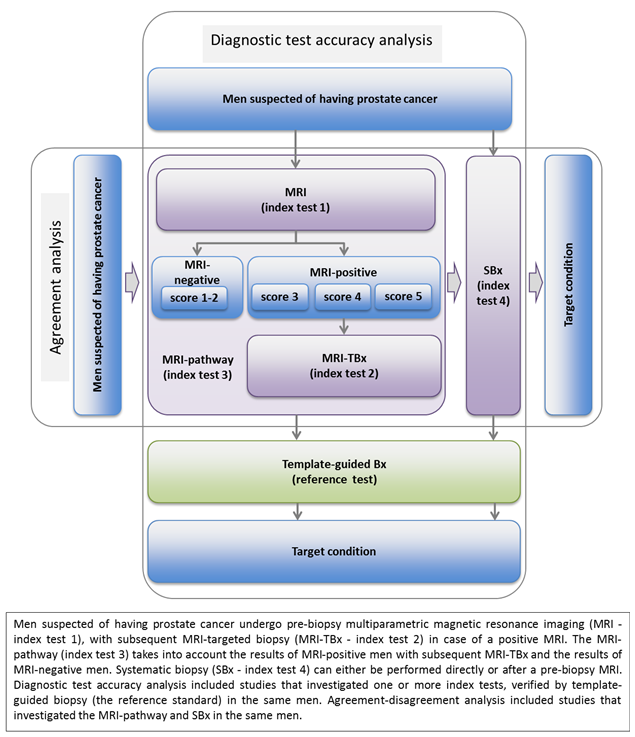
Clinical pathway flow diagram and study design
Index tests
MRI
MRI is used to identify and locate suspicious lesions for clinically significant prostate cancer. Different MRI techniques and MRI systems from different vendors are used worldwide. The multiparametric pulse sequences are T2‐weighted imaging (T2W), diffusion‐weighted imaging (DWI), dynamic contrast‐enhanced (DCE) imaging and spectroscopy. Furthermore, different MRI magnets on different platforms from different vendors exist.
In addition, several scoring systems for the suspicion of prostate cancer on MRI have been developed. Radiologists use multi‐level scoring systems according to the Likert scale principle; where the presence of clinically significant prostate cancer in a lesion can be subjectively categorised as highly unlikely to highly likely, with a varying number of subdivisions. The 1 to 5 scale according to the Prostate Imaging ‐ Reporting and Data System (PI‐RADS) version 2 (Weinreb 2016), provides guidance for radiologists with more objective criteria and is currently most often used.
MRI‐targeted biopsy
MRI‐targeted biopsy in men with a positive MRI can either be performed with MRI‐guidance within the MRI scanner (in‐bore), or by ultrasound guidance with the use of computer‐based software that overlays the target identified on MRI onto the ultrasound image, 'software registration', or without the use of software, 'visual registration'. No significant differences in clinically significant prostate cancer detection appear to exist between these navigational approaches (Moore 2013a; Schoots 2015; Wegelin 2017).
MRI pathway
The MRI pathway (MRI with or without MRI‐targeted biopsy) comprises the performance of an MRI and subsequent performance of MRI‐targeted biopsies if a suspicious lesion is seen. Therefore, men with a negative MRI do not receive MRI‐targeted biopsy.
Systematic biopsy
Systematic transrectal ultrasound (TRUS)‐guided biopsy is a biopsy technique in which the peripheral zone of the prostate is sampled by 8 to 12 cores (with a maximum of 19), depending on the size of the prostate. TRUS is performed primarily for anatomic guidance, as suspicious lesions for prostate cancer, in general, cannot be visualised by ultrasound. This approach may, therefore, result in random and systematic errors, which can lead to hitting insignificant lesions while missing significant lesions (El‐Shater Bosaily 2015). The estimated false‐negative rate of systematic biopsy for any cancer is 25% to 40% (Hu 2012). Also, misclassification occurs by not hitting the cancer lesion at its greatest diameter or highest grade, shown by reclassification in almost half of men when a more accurate biopsy test is applied (Barzell 2007; Barzell 2012; Taira 2010; Taira 2013).
Alternative test(s)
Different biopsy approaches, such as transrectal or transperineal, with different numbers of biopsy cores are used. Transrectal saturation biopsy (defined as more than 20 biopsies of the prostate) aims comprehensively to sample the prostate (Kuru 2013b). However, most transrectal biopsy approaches do not sample the anterior zones of the prostate and therefore lack accuracy. In addition, such an intensified biopsy approach is less frequently used in daily clinical practice as it is widely seen as being a high burden to patients, having an increased complication rate and contributing to overdiagnosing insignificant prostate cancer (Jiang 2013). Furthermore, different ultrasound imaging techniques for localizing suspicious lesions in the prostate are also being developed and evaluated, including contrast‐enhanced ultrasound, computer‐assisted TRUS, sonoelastography and histoscanning. However, these techniques need further development before considering a potential application in daily clinical care (Kuru 2015).
Rationale
To reduce overdiagnosis and overtreatment of indolent prostate cancer, while improving the detection of clinically significant prostate cancer and reducing the number of biopsy procedures, we need more accurate diagnostic methods and better risk‐stratification (Alberts 2015). In a recent international multicentre randomised controlled trial, MRI in combination with MRI‐targeted biopsy (the MRI pathway) detected 12% more clinically significant prostate cancer and 13% less indolent prostate cancer than systematic biopsy in biopsy‐naïve men, and achieved a 28% reduction of biopsies, because men with a negative MRI did not receive prostate biopsy (Kasivisvanathan 2018). These results indicate that a pre‐biopsy MRI and MRI‐targeted biopsy in the presence of an MRI‐suspicious lesion would be superior to a systematic biopsy. If that is confirmed by other studies and longer follow‐up of those men not biopsied, it may initiate a change to the guidelines.
Previous systematic reviews on diagnostic performances of the MRI pathway or the pre‐biopsy MRI approach written by De Rooij 2014a, Futterer 2015, Gayet 2016, Hamoen 2015, Moore 2013b, Schoots 2015, Valerio 2015 and Van Hove 2014 have been based on study designs that did not accurately capture target conditions and index or reference test definitions, leading to a number of biases and inaccurate findings. Studies in these reviews included mainly men with a positive MRI, and disregarded men with a negative MRI, inevitably leading to inaccurate true‐negative and false‐negative values of the MRI pathway. In addition, they used systematic biopsy or radical whole‐mount surgical specimens as reference standards, which inherently have a number of biases: systematic biopsy may miss clinically significant prostate cancer caused by both random and systematic errors, whereas radical whole‐mount surgical specimens are only available for men with a positive biopsy who opted for surgery. Furthermore, the established definitions of clinically significant prostate cancer, based on histology from systematic biopsy and possibly additional non‐histological parameters, cannot be applied to results from the MRI pathway (Robertson 2014). The intention of the MRI pathway is to oversample areas of high suspicion, with the result that MRI‐targeted biopsies tend to show longer cancer core length and higher Gleason grading than systematic biopsies (Haffner 2011). This results in a drift towards higher risk classification, which is an artefact of the MRI‐targeted sampling method and may prompt men and physicians to more radical treatment. Based on these observations, the International Working Group on Standards of Reporting for MRI‐targeted biopsy studies (START) agreed that definitions of clinical significance in MRI‐targeted biopsy studies should solely focus on histologic definitions, that is, Gleason grade and maximum cancer core length (Moore 2013a).
Considering the above information, we performed a systematic review and meta‐analysis of the literature. We only included studies with data on both MRI‐positive and ‐negative men, that reported histologically confirmed target conditions only. Furthermore, we only included studies that used an appropriate reference standard (described in Reference standards) for the test accuracy analyses. To provide additional evidence where test accuracy evidence was limited, we selected from the agreement evidence only those studies that investigated the MRI pathway and systematic biopsy in the same men according to the above‐stated criteria.
We aimed to assess the diagnostic accuracy of the four index tests (MRI, MRI‐targeted biopsy, the MRI pathway and systematic biopsy) and the agreement between the two main index tests (the MRI pathway versus systematic biopsy) for detecting prostate cancer.
Objectives
Primary objective
To determine the diagnostic accuracy of the index tests MRI only, MRI‐targeted biopsy, MRI pathway (MRI with or without MRI‐targeted biopsy) and systematic biopsy as compared to template‐guided biopsy as the reference standard in detecting ISUP grade 2 or higher, grade 3 or higher and grade 1 prostate cancer.
Secondary objectives
-
To compare the diagnostic accuracy between the index tests MRI only, MRI‐targeted biopsy, MRI pathway (MRI with or without MRI‐targeted biopsy) and systematic biopsy in detecting grade 2 or higher, grade 3 or higher and grade 1 prostate cancer.
-
To determine the agreement between the two index tests, the MRI pathway and systematic biopsy, for detecting grade 2 or higher, grade 3 or higher and grade 1 prostate cancer.
-
To determine the proportion of prostate cancer not detected by systematic biopsy but only by the MRI pathway (added value MRI pathway) and the proportion of prostate cancer not detected by the MRI pathway but only by systematic biopsy (added value systematic biopsy) for grade 2 or higher, grade 3 or higher and grade 1 prostate cancer.
-
To determine the potential change in the number of biopsy procedures between the MRI pathway and systematic biopsy in the test accuracy and the agreement analyses.
-
To investigate what clinical and methodological sources of heterogeneity affect the index tests, including type of population (prior‐negative biopsy or biopsy‐naïve), MRI pulse sequences (mpMRI or bpMRI or additional spectroscopy), MRI scoring system, MRI suspicion score threshold for MRI‐targeted biopsy, navigational approach of MRI‐targeted biopsy, MRI lesion location, number of biopsy cores (or biopsy density) and core distribution in the reference standard.
Methods
Criteria for considering studies for this review
Types of studies
We considered any cross‐sectional study, if it investigated:
-
the diagnostic accuracy of one or more of the index tests (MRI, MRI pathway (including MRI‐targeted biopsy) or systematic biopsy) verified by the reference standard (template‐guided biopsy), with each index test and reference standard performed in the same men or compared as in a randomised trial of test accuracy; or
-
agreement evidence between the MRI pathway and systematic biopsy, with each test performed in the same men.
Studies involving MRI had to report on both MRI‐positive and MRI‐negative men.
We excluded studies when we could not extract a complete two‐by‐two table on a per‐participant basis for the primary target condition, even after contacting the study authors.
We did not apply any language or other restrictions.
Participants
The study population consisted of men with a clinical suspicion of prostate cancer (based on PSA or digital rectal exam (DRE) outcome) in the biopsy‐naïve or prior‐negative biopsy setting (or a mix of both). We excluded men with a previous diagnosis of prostate cancer.
Index tests
MRI
MRI was comprised of at least T2‐weighted imaging and one functional imaging technique (DWI or DCE), reported according to any MRI‐scoring system. The assessment categories for prostate MRI are based on a 5‐point scale (Likert or PI‐RADS), defined as very low (1), low (2), intermediate (3), high (4) and very high (5) (Dickinson 2011; Weinreb 2016). We defined the default threshold for MRI‐positivity as 3/5 or more where possible. We categorised thresholds from related assessment scores such as 2/4 or more, 6/10 or more and 5/15 or more as low, intermediate and high, based on expert opinion, for the purpose of heterogeneity analyses. We performed sensitivity analyses with studies that used a threshold of 3/5 or more. We performed additional analyses by increasing or decreasing the MRI‐positivity threshold, categorizing the MRI scores into 4/5 or more and 2/5 or more. We based all the analyses on per‐participant analysis and not on per‐lesion analysis, therefore, we did not take into account spatial concordance between MRI findings and biopsy findings.
MRI‐targeted biopsy
MRI‐targeted biopsy included only MRI‐positive men. We included all methods for MRI‐targeted biopsy (direct in‐bore, visual‐registration or software‐registration). We extracted data for this index test from studies reporting on the MRI pathway verified by the reference standard. We defined a positive MRI‐targeted biopsy as a histopathological confirmation of one of the target conditions in the MRI‐targeted biopsy cores.
The MRI pathway
The MRI pathway included MRI‐positive men (in whom MRI‐targeted biopsy was performed) and MRI‐negative men (in whom no MRI‐targeted biopsy was performed), reflecting the complete spectrum of men in the clinical population. We defined a positive MRI pathway as a histopathological confirmation of one of the target conditions by MRI‐targeted biopsy in MRI‐positive men. Therefore, we defined a negative MRI pathway as a negative MRI or a negative MRI‐targeted biopsy Appendix 1.
Systematic biopsy
Systematic biopsy included either systematic transrectal or transperineal ultrasound‐guided biopsies, with generally 8 to 12 cores dedicated to the peripheral zone of the prostate; we excluded studies on additional ultrasound imaging techniques. We defined a positive systematic biopsy as a histopathological confirmation of one of the target conditions in the biopsy cores.
Target conditions
The primary target condition was clinically significant prostate cancer, defined as ISUP grade 2 or higher, based on histopathology findings and scored as Gleason score (GS) 3 + 4 or higher (Epstein 2016). Secondary target conditions were grade 1 (GS 3 + 3, indolent prostate cancer) and grade 3 or higher (GS 4 + 3 or higher). We based all target conditions on ISUP grade only, without cancer volume criteria, in order to overcome differences between definitions and biopsy methods, according to START guidelines (Moore 2013a).
Reference standards
Template‐guided biopsy served as the reference standard. In general, two different techniques are used: the transperineal template‐guided mapping biopsy (TTMB) and the template‐guided saturation biopsy (TSB). TTMB is defined as “transperineal TRUS‐guided biopsies of the prostate performed with the patient in lithotomy position using a 5‐mm brachytherapy grid, with at least one biopsy from each hole”. TSB is defined as “20 or more transperineal or transrectal TRUS‐guided biopsies of the prostate performed with the intention to comprehensively sample the whole prostate, according to a predefined core distribution pattern” (Kuru 2013b; Sivaraman 2015). Template‐guided biopsies using a uniform grid and taken at 5 mm intervals can technically only miss those tumours that are smaller than the distance between the adjacent cores (Ahmed 2011; Sivaraman 2015). The sensitivity and negative predictive value of this technique for detecting grade 2 or higher prostate cancer 0.5 cm3 or greater in volume have both been shown to be 95%, with a sensitivity of 76% for detecting all cancers (Ahmed 2011; Crawford 2013; Simmons 2014). Although the template‐guided biopsy is not perfect, owing to the fact that the test accuracy depends on the intensity of cores taken and core trajectory (Huo 2012; Pham 2015; Valerio 2015), it is the optimal reference standard, as it avoids the biases of other reference standards that have been used as described in the Rationale. An alternative approach could be to use template‐guided biopsy in combination with other biopsy methods (a ‘composite’ reference standard) to overcome the inadequacy of template‐guided biopsy only; however, this would introduce incorporation bias.
Therefore, in this analysis, we used only template‐guided biopsy as the reference standard. Template‐guided biopsy had to comprehensively sample all (including the anterior) zones of the prostate, with a minimum of 20 biopsy cores. We defined a positive template‐guided biopsy as histopathological confirmation of one of the target conditions within the biopsy cores. We used the alternative composite reference standard in the sensitivity analyses.
Search methods for identification of studies
Electronic searches
We performed a comprehensive search, with no restriction on language of publication or publication status, in the following electronic databases:
-
Cochrane Central Register of Controlled Trials (CENTRAL; 2018, Issue 7) in the Cochrane Library (searched 31 July 2018), including ClinicalTrials;
-
MEDLINE Ovid, including electronic publications ahead of print (from inception to 31 July 2018);
-
Embase.com (from inception to 31 July 2018);
-
CINAHL EBSCO (Cumulative Index to Nursing and Allied Health Literature; from inception to 31 July 2018);
-
Web of Science (Core Collection) (from inception to 31 July 2018);
-
Scopus (from inception to 31 July 2018);
-
Google.com (31 July 2018);
-
Google Scholar (31 July 2018);
-
WorldCat (31 July 2018);
-
ProQuest (ProQuest Dissertations & Theses; 31 July 2018);
-
OpenGrey (31 July 2018).
The search strategies are provided in Appendix 2.
Searching other resources
We searched for additional references in the Science Citation Index of Web of Science and by manually searching the references of relevant articles.
We also searched the following trials registers for planned or ongoing studies:
-
ClinicalTrials.gov (31 July 2018);
-
World Health Organization International Clinical Trials Registry Platform (apps.who.int/trialsearch; searched 31 July 2018);
-
Open trials (https://opentrials.net/, searched 31 July 2018).
We searched Embase and Web of Science for conference proceedings.
Data collection and analysis
Selection of studies
We checked the primary search results for overlapping content and Cochrane Urology's Information Specialist deduplicated the search results (Bramer 2016). Two reviewers (FD, DO) independently screened all abstracts and full‐text articles for eligibility according to the Criteria for considering studies for this review. We contacted study authors to obtain additional information when reported data were insufficient. When more than one publication on the same cohort was found, we selected the most complete publication. We resolved disagreements by consensus (FD, DO and IS).
Data extraction and management
Two review authors (FD, DO) extracted data using a predefined data‐extraction form. FD and DO extracted variables on study methodology, patient characteristics, test characteristics, the definition of target conditions and results. We constructed two‐by‐two tables for cross‐classification of the index tests versus reference standard for test accuracy data, and the MRI pathway versus systematic biopsy for agreement data, based on per‐participant data (Appendix 1). We contacted study authors to obtain additional information when necessary. We resolved any data extraction disagreements by consensus (FD, DO, IS).
Assessment of methodological quality
Two review authors (FD, DO) independently assessed all included studies for methodological quality using the Quality Assessment of Diagnostic Accuracy Studies (QUADAS‐2) tool (Whiting 2011), tailored to this review (Table 1). We resolved any discrepancies by discussion (FD, DO, IS).
| Domain 1: Participant selection | |
| SQ 1: Was a consecutive or random sample of participants enrolled? | Yes: if stated that participants were consecutively or randomly selected No: if one of these criteria was not met Unclear: if insufficient information to make a judgement |
| SQ 2: Did the study avoid inappropriate exclusions? | Yes: if stated that the study did not exclude men 1) aged between 50 and 70 years, 2) with PSA values between 4 and 10 ng/mL, or 3) with an abnormal DRE No: if one of these criteria was not met Unclear: insufficient information to make a judgement |
| Risk of bias Could the selection of participants have introduced bias? | Low risk: if ‘Yes’ for all SQ's High risk: if ‘No’ for at least 1 SQ Unclear risk: if 'Unclear' for at least 1 SQ |
| Concerns for applicability Are there concerns that the included participants and setting do not match the review question? | Low concern: the participants were referred because of a suspicion of prostate cancer. High concern: the participants were not referred because of a suspicion of prostate cancer, e.g. PSA‐screening trials are less applicable to the current clinical practice. Unclear concern: insufficient information to make a judgement |
| Domain 2: Index texts | |
| SQ 1: If applicable, was the MRI assessed without knowledge of the results of the reference (or other index) biopsies? | Yes: if stated that the radiologist was unaware of all biopsy results; or, if the order of testing was MRI before all biopsies for every participant No: if stated that the radiologist was aware of any biopsy results during MRI assessment Unclear: insufficient information to make a judgement |
| SQ 2: If applicable, were the MRI‐targeted biopsies performed independently of the performance and the results of the reference (or other index) biopsies? | Yes: if stated that the performance of MRI‐targeted biopsies was not influenced by the performance or trajectory of reference (or other index) biopsies No: if stated that MRI‐targeted biopsies were not, or differently, taken from locations already hit by the reference (or other index) biopsies; or, if the performance of MRI‐targeted biopsies was dependent on the judgement of the same operator that also performed the reference (or other index) biopsies without blinding Unclear: insufficient information to make a judgement |
| SQ 3: If applicable, were the systematic biopsies taken independently of the performance and the results of the reference (of other index) biopsies? | Yes: if stated that the systematic biopsies were taken blinded for
No: if stated that the systematic biopsy operator was not blinded for MRI results, or was the same operator that also performed the reference (or other index) biopsies without blinding Unclear: insufficient information to make a judgement |
| Risk of bias Could the conduct or interpretation of the index test have introduced bias? | Low risk: ‘Yes’ for all applicable SQs High risk: ‘No’ for at least one applicable SQ Unclear risk: ‘Unclear’ for at least one applicable SQ |
| Concerns for applicability Are there concerns that the index tests, their conduct or their interpretation differ from the review question? | Low concern: if stated that, when applicable,
High concern: the index test did not meet the criteria above Unclear concern: insufficient information to make a judgement |
| Domain 3: Reference standard | |
| SQ1: Is the reference standard likely to correctly classify the target condition? (i.e. Is histological diagnosis made from appropriately sampled tissue?) | Yes: if stated that the whole prostate was comprehensively sampled by a full 5‐mm transperineal TTMB, or by a equivalently well described transperineal template‐guided biopsy method with a prostate volume based median of ≤ 20 biopsy cores. No: one of these criteria was not met (i.e. in‐house transperineal saturation biopsy or transrectal saturation biopsy are less likely to appropriately sample the whole prostate). Unclear: insufficient information to make a judgement |
| SQ2: Was the reference standard performed independent of the index test? | Yes: if stated that the reference biopsies were taken without knowledge of the MRI‐score and location of target lesions; and, if incorporation was avoided (i.e. the index test was not part of the reference standard). No: one of these criteria was not met Unclear: insufficient information to make a judgement |
| Risk of bias Could the reference standard, its conduct, or its interpretation have introduced bias? | Low risk: 'Yes’ for all SQs High risk: ’No’ for at least 1 of the 3 SQs Unclear risk: ’Unclear’ for at least 1 SQ |
| Concerns for applicability Are there concerns that the target condition as defined by the reference standard does not match the question? | Low concern: data were presented for GS ≥ 3+4 without any volume criteria (ISUP grade ≥ 2), if necessary after requesting additional data from study authors High concern: data were presented for an alternative target condition definition and study authors did not provide additional data. Unclear: insufficient information to make a judgement |
| Domain 4: Flow and timing | |
| SQ1: Did all participants receive the same biopsy methods (i.e. was differential verification avoided)? | Yes: if stated that all participants received the same type of index test(s) and reference standard, prostate volume dependency was allowed. No: if one of these criteria was not met Unclear: if insufficient information to make a judgement |
| SQ2: Were all enrolled participants included in the analysis, or were exclusions explained and not leading to a relevant bias? | Yes: if stated that all eligible participants were enrolled and included in the final analyses; or, if reasons to excluded participants did not cause a relevant bias (e.g. participants with claustrophobia who refused MRI). No: one of these criteria was not met. Unclear: if insufficient information to make a judgement |
| Risk of bias Could the participant flow have introduced bias? | Low risk: ’Yes’ for all SQs High risk: ’No’ for at least 1 SQ Unclear risk: ’Unclear’, for at least 1 SQ |
| DCE: dynamic contrast‐enhanced; DRE: digital rectal examination; DWI: diffusion‐weighted imaging; MRI: magnetic resonance imaging; PSA: prostate‐specific antigen; QUADAS: Quality Assessment of Diagnostic Accuracy Studies; SQ: signalling question; TTMB: template‐guided mapping biopsy; ISUP: International Society of Urological Pathology | |
Statistical analysis and data synthesis
For the test accuracy analyses (MRI, MRI‐targeted biopsy, MRI pathway, systematic biopsy versus reference standard (template‐guided biopsy)), we calculated pooled estimates of sensitivity and specificity using the bivariate model, in accordance with the Cochrane Handbook for Diagnostic Test Accuracy Reviews (Macaskill 2010). Furthermore, we assessed heterogeneity graphically using paired forest plots of sensitivity and specificity (Macaskill 2010). If we observed little or no heterogeneity, we considered simplifications of the bivariate models by dropping the correlation between sensitivity and specificity. We compared index tests by combining all the studies that investigated the index test of interest and adding a covariate to the bivariate model for the type of index test. We used likelihood ratio tests to assess whether the pooled sensitivity and specificity differed significantly between index tests. We based prevalences on the number of prostate cancers detected by the reference standard.
For the agreement analysis (MRI pathway versus systematic biopsy), we focused on the number of target conditions identified (concordance and discordance of test results) because neither test is a valid reference test. We calculated the proportion of detected cases (total number of cancers) as the number of concordant positive results plus the number of discordant positive results of both tests (Appendix 1). We calculated the detection rate of either test as the number of positive results of that test divided by the total number of cancers detected. We synthesised pooled estimates of detection ratios (detection rate of the MRI pathway:detection rate of systematic biopsy) by performing random‐effects meta‐analyses. We calculated the variance of the detection ratio taking into account the paired data in the analysis. We pooled the detection ratio on a log‐scale and used the delta method to estimate the standard error of the detection ratio on the log scale.
To calculate pooled proportions of prostate cancer not detected by systematic biopsy but only by the MRI pathway (added value MRI pathway) and pooled proportions of prostate cancer not detected by the MRI pathway but only by systematic biopsy (added value systematic biopsy), we used mixed models (multinomial logistic regression models with a random intercept for study effects). To calculate the pooled proportions of participants with prostate cancer and a negative MRI, we performed a random‐effects meta‐analysis on these proportions after transformation to the log‐odds scale. The added‐value data were constructed such that we assessed the tests as add‐on tests (i.e. considering reclassification by each test) (Appendix 3). We based post‐test probability estimates (negative predictive values (NPV) and positive predictive values (PPV)) on Bayes’ theorem, using the point estimates and 95% confidence intervals of the pooled positive and negative likelihood ratio, with prevalences based on the test accuracy data and given clinically useful percentages (10% (low) to 50% (high)). We used Statistical Analysis Software (SAS) version 9.3 for Windows and R version 3.5.0 to perform all statistical analyses.
Investigations of heterogeneity
To explore sources of heterogeneity, we assessed the following covariates by adding them one by one in our bivariate model: population setting (biopsy naïve versus prior negative biopsy); MRI magnet strength (3 versus 1.5 T); MRI sequence (multiparametric MRI versus biparametric MRI); MRI positivity threshold (4/5 or more (high) versus 3/5 or more (intermediate) versus 2/5 or more (low)); use of endorectal coil; MRI‐targeted biopsy method (software versus visual registration); biopsy approach (transperineal versus transrectal); and radiologist experience (high versus little or unclear). We scored radiologist experience in studies as high when the radiologist was 'experienced', 'dedicated', a 'uro‐' or 'mpMRI‐radiologist', or when radiologists had prostate MRI training, more than one year's or more than 100 cases' experience in reading prostate MRI. We scored radiologist experience as 'little' when studies reported a lack of experience. We tested the same covariates using meta‐regression techniques for the detection ratio. To ensure adequate data for the analyses, we applied an arbitrary threshold of five studies for each subgroup of a covariate investigated in the analyses of heterogeneity.
Sensitivity analyses
To examine the robustness of our findings, we performed several sensitivity analyses, limited to studies meeting certain quality or additional criteria. The quality criteria comprised low risk of bias and no applicability concerns in the QUADAS‐2 domains. The additional criteria comprised:
-
using an MRI positivity threshold of 3/5 of more;
-
tests with head‐to‐head comparative data only (MRI versus the MRI pathway; MRI positivity threshold effect (3/5 or more to 4/5 or more));
-
comparison within the same study (biopsy naïve versus prior negative biopsy);
-
a reference standard with template‐guided biopsy via the transperineal approach;
-
a composite reference standard (template‐guided biopsy and MRI‐targeted biopsy); and
-
highly experienced radiologist(s).
Assessment of reporting bias
We did not assess reporting bias, since there is no evidence of reporting bias in test accuracy reviews nor is there a reliable method to detect this (Deeks 2005).
Certainty of evidence and summary of findings tables
We rated the certainty of evidence on a per‐outcome basis according to Grading of Recommendations Assessment, Development and Evaluation (GRADE) guidance for studies of diagnostic accuracy (Schünemann 2008). GRADE takes into account five criteria related not only to internal validity (study limitations or risk of bias, inconsistency, imprecision, publication bias), but also to external validity (directness of results). We applied the following methods:
-
Study limitations and risk of bias: We used QUADAS‐2 to assess risk of bias.
-
Indirectness: We considered indirectness from the perspective of test accuracy. We used QUADAS‐2 for concerns of applicability and looked for important differences between the populations studied (for example, in the spectrum of disease) and the setting.
-
Inconsistency: We assessed pooled sensitivity and specificity estimates for clinically important inconsistency and downgraded if this remained unexplained by prespecified secondary analyses.
-
Imprecision: We used a contextualized approach and considered a precise estimate to be one that would allow a clinically meaningful decision. When assessing the need to downgrade for imprecision, we assessed whether an effect size taken from the upper or lower boundary of the confidence intervals for our projected true positives, false negatives, true negatives and false positives for a given prevalence would have changed these clinical judgments about the usefulness of a given test.
-
Publication bias: See above.
For the four main comparisons, we rated the certainty of evidence for true positives and false negatives as well as true negatives and false positives as 'high', 'moderate', 'low', or 'very low' using GRADEpro GDT. We present summaries of the evidence in 'Summary of findings' tables (summary of findings Table 3; summary of findings Table 4; summary of findings Table 5; summary of findings Table 6), which provide key information about the best estimate of the magnitude of the effect in relative terms and absolute differences for each relevant comparison of alternative management strategies; numbers of participants and studies addressing each important outcome; and the rating of the confidence in effect estimates.
Results
Results of the search
Of the 18,286 records found through the search strategy, we assessed 551 full‐text articles for eligibility (Figure 2). A total of 43 studies were eligible for inclusion in this review and provided data for multiple tests. We present study and patient baseline characteristics per test in Table 2 and Table 3 for the test accuracy analysis and Table 4 and Table 5 for the agreement analysis (and Appendix 4).

Study flow chart
csPCa: clinically significant prostate cancer; MRI: magnetic resonance imaging; MRI pathway: magnetic resonance imaging with subsequent magnetic resonance imaging‐targeted biopsy; MRI‐TBx: magnetic resonance imaging‐targeted biopsy; SBx: systematic biopsy
| Study | MRI | Index biopsy | Reference standard | Target | |||||
| Study | Consecutive | N of | Index | MRI‐scale; | MRI‐TBx | Technique | Median N | Independence | ISUP |
| No | 54 | MRI | 1‐5; ≥ 3 | Cognitive/transperineal | TTMB | 45 (21‐137) | No | G = 1 | |
| Yes | 576 | MRI, SBx | 1‐5; ≥ 3 | NA/transrectal | TTMB | > 40b | Yes | G = 1 | |
| Yes | 123 | MRI, | 1‐5; ≥ 3 | Cognitive/transrectal | TSBc | 24d | Yes | G = 1 | |
| Yes | Bx‐naïve: 597 | MRI, | 1‐5; ≥ 3 | Software/transperineal | TSBe | 24 (22‐25) | No | G ≥ 2 | |
| Yes | Bx‐naïve: 83 | MRI | 1‐5; ≥ 3 | Cognitive/transperineal | TSBe | (24‐40) | No | G = 1 | |
| Yes | 295 | MRI, | 1‐5; ≥ 3 | Software/transperineal | TSBe | (18‐24) | Unclear | G = 1 | |
| Yes | Centre 1: 163 | MRI | 1‐5; ≥ 3 | Software, | TSBe | 24 (22‐26f), | No | G = 1 | |
| Unclear | 287 | MRI, | 1‐5; ≥ 3 | Software/transperineal | TSBe | 24 (24‐25) | Unclear | G ≥ 2 | |
| Unclear | Bx‐naïve: 95 | MRI, | 1‐5; ≥ 3 | Software/transperineal | TSBg | 24 (23‐27f) | Yes | G = 1 | |
| No | 39 | MRI, | 1‐4; ≥2 | Software/transperineal | TSBe | 24 (14‐34) | No | G = 1 | |
| Yes | 163 | MRI, | 1‐5; ≥ 3 | Software/Transrectal | TSB | 40 (30‐55) | No | G = 1 | |
| Unclear | 9 | MRI | 1‐5; ≥ 3 | NA | TSBh | 24 (24–28) | Unclear | G = 1 | |
| Unclear | 78 | MRI, | 0‐1: ≥1 | Cognitive/transrectal | TSBh | 28 (26‐32) | No | G = 1 | |
| Yes | 344 | MRI | 1‐5; ≥ 3 | Software, | TTMB | 30 | No | G = 1 | |
| Unclear | 33 | MRI | 1‐5; ≥ 3 | NA | TTMB | 55 (42‐63f) | Yes | G = 1 | |
| Unclear | 50 | SBx | NA | NA/transrectal | TSBh | 36 | Yes | G = 1 | |
| Unclear | 42 | SBx | NA | NA/transrectal | TSBh | 36 | Yes | G = 1 | |
| Yes | 2753 | SBx | NA | NA/transrectal | TSBc | 21 | No | G = 1 | |
| Bx: biopsy; ISUP G : International Society of Urological Pathology grade; MRI: magnetic resonance imaging; MRI‐pathway: magnetic resonance imaging with or without magnetic resonance imaging‐targeted biopsy; MRI‐TBx: magnetic resonance imaging‐targeted biopsy; N: number; NA: not applicable; PI‐RADS v1, v2: Prostate Imaging Reporting Data System version 1 or 2; SBx: systematic biopsy; TSB: transperineal saturation biopsy; TTMB: transperineal template mapping biopsy | |||||||||
aIncluded participants were part of the same study cohort (no randomised populations were included).
bNot reported but estimated.
cTransrectal.
dMean value (as opposed to median).
eGinsburg biopsies.
fInterquartile range (as opposed to range).
gTransperineal optimised prostate biopsy (TOP).
hIn‐house transperineal saturation biopsy
| Patient characteristics of the included diagnostic test accuracy studies | ||||
| Study | Population | Median age | Median PSA | Median prostate |
| Prior‐negative Bx | 64 (39‐75) | 10 (2‐23) | 53 (19‐136) | |
| Bx‐naïve | 63 (7.6)a | 7.1 (2.9)a | NR | |
| Prior‐negative Bx | 62 (57‐68b) | 6.3 (4,8‐8,9b) | 55 (20‐149)a | |
| Mixedc | 65 (60‐71b) | 7.2 (5.3‐10.4b) | 45 (34‐64b) | |
| Mixedc | 64 (6.8)a | 13.3 (12,1)a | 68 (35)a | |
| Prior‐negative Bx | 65 (59‐69b) | 7.8 (6.0‐12b) | 65 (44‐83b) | |
| Bx‐naïve | 64 (57‐69b) | 6.6 (4.6‐9.0b) | 44 (33‐55b) | |
| Prior‐negative Bx | 66 (61‐72b) | 9.7 (7.1‐13.9b) | 52 (36‐75b) | |
| Mixedc | 65 (58‐71b) | 7.2 (5.4‐10.2b) | 46 (36‐60b) | |
| Prior‐negative Bx | 64 (47‐77)a | 10 (1.2‐36) | NR | |
| Bx‐naïve | 63 (57‐68b) | 5.8 (4.4‐8.9b) | 44 (34‐60b) | |
| Bx‐naïve | 68 (46‐81) | 11.5 (1.2‐92.5) 10 (2.7‐61)d | NR | |
| Prior‐negative Bx | 63 (49‐72) | 11 (3.7‐45) | NR | |
| Bx‐naïve | 63 (56‐67b) | 5.2 (3.7‐7.1b) | 40 (30‐54b) | |
| Prior‐negative Bx | 65 (61‐69b) | 7.1 (5.1‐13.6b) | 44 (32‐65b) | |
| Bx‐naïve | 67 (54‐84)a | 8 (4‐18)a | 58 (19‐165)a | |
| Prior‐negative Bx | 65 (50‐75)a | 8.3 (4.4‐19)a | 59 (21‐152)a | |
| Bx‐naïve | 64 (8)a | 12.5 (7.2)a | 46 (25)a | |
| Bx: biopsy; NR: not reported; PSA: prostate specific antigen | ||||
aMean (standard deviation or range) (as opposed to median (range)).
bInterquartile range (as opposed to range).
cResults not reported per population type.
dReported per transperineal saturation biopsy‐positive (n = 71) and transperineal saturation biopsy‐negative men (n = 103), respectively.
| Study | MRI | Index biopsy | Target | ||||||
| Study | Consecutive | N of | Index tests | MRI‐scale; | MRI‐TBx | SBx | MRI‐TBx & | ISUP | |
| Technique | Median N | Independence | Route | ||||||
| Yes | Bx‐naïve: 74 | MRI‐pathway | 1‐5; ≥ 3 | Software | 12 (12‐12b) | Yes | Transrectal | G = 1 | |
| Unclear | 206 | MRI‐pathway | 1‐5; ≥ 3 | Software | 10 (10‐10) | Yes | Transrectal | G = 1 | |
| Yes | 1020 | MRI‐pathway | 1‐5; ≥ 3 | Software | 10c | Yes | Transrectal | G = 1 | |
| Yes | 168 | MRI‐pathway | 1‐5; ≥ 3 | Cognitive | (8‐19) | Unclear | Transrectal | G = 1 | |
| Yes | 65 | MRI‐pathway | 1‐5; ≥ 3 | Cognitive | 18 (16.2‐19.8b) | No | Transrectal | G = 1 | |
| Yes | 420 | MRI‐pathway | 1‐5; ≥ 3 | Cognitive | 12d | Yes | Transperineal | G ≥ 2 | |
| Unclear | Bx‐naïve: 50 | MRI‐pathway | Other | Software | 12‐14e | Unclear | Transrectal | G = 1 | |
| No | 38 | MRI‐pathway | 1‐5; ≥4 | Cognitive | NR | No | Transrectal | G ≥ 2 | |
| Yes | 391 | MRI‐pathway | TZ: 0‐4; ≥2 | Software Cognitive | 12 (10‐12) | Unclear | Transrectal | G ≥ 2 | |
| Yes | Bx‐naïve: 329 | MRI‐pathway | 1‐5; ≥ 3 | Software | 12 | Unclear | Transrectal | G ≥ 2 | |
| Unclear | 60 | MRI‐pathway | 1‐5; ≥ 3 | Cognitive | 12 | Yes | Transperineal | G = 1 | |
| Yes | Bx‐naïve: 387 | MRI‐pathway | 1‐5; ≥ 3 | Software | 11 (10‐12) | No | Transrectal | G = 1 | |
| Unclear | 53 | MRI‐pathway | 1‐5; ≥4 | Cognitive | 12 | Yes | Transrectal | G = 1 | |
| Unclear | Bx‐naïve: 134 | MRI‐pathway | 1‐5; ≥ 3 | Cognitive | 12c | No | Transrectal | G = 1 | |
| Unclear | Bx‐naïve: 183 | MRI‐pathway | 1‐5; ≥4 | Software Cognitive | 14c | No | Transrectal | G = 1 | |
| Unclear | 76 | MRI‐pathway | 1‐4; ≥2 | Cognitive | 12 (12‐12) | No | Transrectal | G = 1 | |
| Unclear | 123 | MRI‐pathway | 1‐4; ≥2 | Cognitive | 12 | No | Transrectal | G = 1 | |
| Unclear | 52 | MRI‐pathway | 0‐1: ≥1 | Cognitive | NR | Unclear | Transrectal | G = 1 | |
| Yes | Bx‐naïve: 570 | MRI‐pathway | 1‐5; ≥ 3 | Cognitive | 10, 14 or 45f | Unclear | Transrectal | G = 1 | |
| Yes | 110 | MRI‐pathway | 1‐4; ≥2 | Software | 15 | No | Transrectal | G = 1 | |
| Yes | 223 | MRI‐pathway | 1‐5; ≥ 3 | In‐bore | 12 | Unclear | Transrectal | G = 1 | |
| Yes | 251 | MRI‐pathway | 1‐5; ≥ 3 | Software Cognitive | 12.2c | Yes | Transrectal | G = 1 | |
| Yes | 143 | MRI‐pathway | 1‐4; ≥2 | Software | 12c | Unclear | Transrectal | G = 1 | |
| Yes | 53 | MRI‐pathway | 1‐4; ≥2 | Cognitive | 12 (12‐14) | Yes | Transrectal | G = 1 | |
| Yes | 626 | MRI‐pathway | 1‐5; ≥ 3 | In‐bore | 12c | Yes | Transrectal | G = 1 | |
| Bx: biopsy; ISUP G : International Society of Urological Pathology grade; MRI: magnetic resonance imaging; MRI‐pathway: magnetic resonance imaging with or without magnetic resonance imaging‐targeted biopsy; MRI‐TBx: magnetic resonance imaging‐targeted biopsy; N: number; NA: not applicable; PI‐RADS v1, v2: Prostate Imaging Reporting Data System version 1 or 2; PZ: peripheral zone; SBx: systematic biopsy; TSB: transperineal saturation biopsy; TTMB: transperineal template mapping biopsy; TZ: transition zone | |||||||||
aIncluded participants were part of the same study cohort (no randomised populations were included).
bInterquartile range (as opposed to range).
cMean value (as opposed to median value).
d10 cores in peripheral zone, two cores in transition zone.
e2 additional cores in transitional zone in prior‐negative Bx men.
f10 and 14 in Bx‐naïve men with positive and negative MRI, respectively; 10 and 45 in prior‐negative Bx men with a positive and negative MRI, respectively.
| Study | Population | Median age | Median PSA | Median prostate |
| Bx‐naïve | 73 (72‐74b) | 4.2 (3.4–5.8b) | 53 (37‐71b) | |
| Prior‐negative Bx | 65 (58‐68b) | 12.8 (8.9‐19.6b) | NR | |
| Bx‐naïve | 67 (61‐71b) | 8 (5.7‐13b) | 53 (40‐72b) | |
| Bx‐naïve | 61 (8)c | 8.3 (6.1)c | 49 (7)c | |
| Prior‐negative Bx | 64 (60‐68b) | 10.9 (7.2‐14.7b) | 48 (34‐63b) | |
| Bx‐naïve | 67 (45‐91) | 9.7 (2.4‐35.7) | 45 (21‐83) | |
| Bx‐naïve | 59 (8)c | 6.0 (3.5)c | 38 (18)c | |
| Prior‐negative Bx | 64 (48‐77)c | 14.4 (1.8‐33.1)c | NR | |
| Bx‐naïve | 64 (7)c | 8.5 (3.9)c | 56 (30)c | |
| Bx‐naïve | 64 (59‐69b) | 5.8 (4.4‐8.1b) | 45(33‐62b) | |
| Bx‐naïve | 64 (6.7)c | 7.2 (6‐9.4b) | 48 (35‐63b) | |
| Bx‐naïve | 64 (45–74)c | 6.3 (4.4b) | (32‐70)d | |
| Bx‐naïve | 66 (47‐76) | 7.4 (4‐14) | 42 (17‐107) | |
| Mixed | 65 (6)c | 7.5 (5.7‐9.6b) | 37 (28‐49b) | |
| Bx‐naïve | 64 (7)c | 10.2 (15.1)c | NR | |
| Bx‐naïve | 66 (43‐83) | 6.4 (3.3‐9.8) | 39 (17‐127) | |
| Bx‐naïve | 62 (10)c | 6.4 (1.8)c | 40 (18)c | |
| Bx‐naïve | 62 (43‐79) | 5 (3‐8.9) | 45 (17‐93) | |
| Bx‐naïve | 64 (51‐82) | NR | NR | |
| Bx‐naïve | 65 (7)c | 8.4 (6.3)c | 49 (22)c | |
| Bx‐naïve | 63 (57‐68b) | 5.3 (4.1‐6.6b) | 41 (30‐59b) | |
| Bx‐naïve | 64 (59‐68b) | 6.5 (5.6‐9.6b) | 50 (38‐63b) | |
| Prior‐negative Bx | 64 (47‐82)c | 11.59 (0.4‐96.9)c | 69 (17‐309)c | |
| Bx‐naïve | 63 (60‐66b) | 6.1 (4.2‐9.9b) | 28 (24‐37b) | |
| Bx‐naïve | 65 (59‐68b) | 6.4 (4.6‐8.2b) | 55 (41‐77b) | |
| Bx: biopsy; NR: not reported; PSA: prostate specific antigen | ||||
aResults not reported per population type.
bInterquartile range (as apposed to range).
cMean (SD or range) (as opposed to median (range)).
dRange of interquartile ranges across three centres.
Eighteen studies addressed the test accuracy analysis (index tests versus reference standard (template‐guided biopsy)): 15 studies on MRI (Abd‐Alazeez 2014; Ahmed 2017; Dal Moro 2019; Distler 2017; Grey 2015; Hansen 2016a; Hansen 2018; Hansen 2017; Kesch 2017; Lawrence 2014; Mortezavi 2018; Muthuveloe 2016; Pepe 2013; Thompson 2016; Tsivian 2017); eight studies on MRI, MRI‐targeted biopsy and the MRI pathway in the same men (Dal Moro 2019; Distler 2017; Hansen 2016a; Hansen 2017; Kesch 2017; Lawrence 2014; Mortezavi 2018; Pepe 2013); and four studies on systematic biopsy (Ahmed 2017; Nafie 2014; Nafie 2017; Ploussard 2014). These studies included 6871 men, of whom 5075 were biopsy naïve and 1796 had a history of at least one prior negative biopsy. We did not find any studies that investigated both the MRI pathway and systematic biopsy verified by the reference standard in the same men.
Twenty‐five studies addressed the agreement analysis between the MRI pathway and systematic biopsy in detecting prostate cancer (Alberts 2017; Boesen 2017a; Boesen 2018; Castellucci 2017; Chang 2017; Chen 2015; Cool 2016; Costa 2013; Delongchamps 2013; Filson 2016; Garcia Bennett 2017; Grönberg 2018; Jambor 2015; Jambor 2017; Kim 2017; Lee 2016; Lee 2017; Okcelik 2016; Panebianco 2015; Peltier 2015; Pokorny 2014; Rouvière 2019a; Say 2016; Tonttilla 2016; Van der Leest 2018), with 6944 men, of whom 5353 were biopsy naïve and 1591 had a history of at least one prior negative biopsy.
Methodological quality of included studies
Test accuracy studies
Thirteen out of 18 test accuracy studies used a prospective study design, while the remaining studies used a retrospective design (Table 2). According to our QUADAS‐2 assessment (Table 1), the studies assessed and presented results per index test (MRI (Figure 3); MRI‐targeted biopsy (Figure 4); the MRI pathway (Figure 5); and systematic biopsy (Figure 6)). A considerable number of studies had a high or unclear risk of bias in the participant selection (n = 9/18) and reference standard domains (n = 12/18). Almost no risk of bias was present in the index test (n = 1/18) and flow and timing domains (n = 3/18). Furthermore, only three out of 18 studies had applicability concerns because either they had selected an explicitly high‐risk population or had used an alternative MRI‐scale or MRI‐positivity threshold (other than the default 5‐point scale with an MRI‐positivity threshold of 3/5 or more).

Diagnostic test accuracy of magnetic resonance imaging (MRI) verified by template‐guided biopsy: risk of bias and applicability concerns summary: review authors' judgements about each domain for each included study

Diagnostic test accuracy of magnetic resonance imaging‐targeted biopsy (MRI‐TBx) in MRI‐positive men: risk of bias and applicability concerns summary: review authors' judgements about each domain for each included study

Diagnostic test accuracy of the MRI pathway: risk of bias and applicability concerns summary: review authors' judgements about each domain for each included study

Diagnostic test accuracy of systematic biopsy (SBx): risk of bias and applicability concerns summary: review authors' judgements about each domain for each included study
Agreement studies
Eighteen out of 25 agreement studies used a prospective study design, while the remaining studies used a retrospective design (Table 4). A considerable number of studies (n = 13/25) had a high or unclear risk of bias in the participant selection domain (Figure 7). In the index test domain, a considerable number of studies (n = 15/25) had a high or unclear risk of bias in the performance of systematic biopsy but almost no risk of bias was present in the performance of the MRI pathway (n = 1/18). Few studies had a high or unclear risk of bias in the flow and timing domain (n = 8/25). Furthermore, applicability concerns were present in 15 out of 25 studies, mainly because they used an alternative method to perform one of the index tests (other than that defined in Table 1).

Agreement analyses between the MRI pathway and systematic biopsy (SBx): risk of bias and applicability concerns summary: review authors' judgements about each domain for each included study
Overall, we acknowledge concerns about the independence and applicability of tests in both test accuracy and agreement analyses, for which we performed sensitivity analyses to exclude studies with such quality concerns.
Findings
Test accuracy: index tests verified by the reference standard, template‐guided biopsy
In this section, we quantified the test accuracy of the different index tests for detecting grade 2 or higher, grade 3 or higher and grade 1 prostate cancer, in mixed populations of men with first and repeat biopsies, using sensitivity, specificity and predictive values.
Sensitivity and specificity
Detection of grade 2 or higher prostate cancer
1. MRI compared with template‐guided biopsy
For grade 2 or higher prostate cancer, the pooled sensitivity and specificity of prostate MRI was 0.91 (95% CI 0.83 to 0.95) and 0.37 (95% CI 0.29 to 0.46), respectively (12 studies, 3091 men; prevalence 29% (95% CI 22% to 38%); Table 6; Figure 8). Hence, 9% of men with grade 2 or higher prostate cancer were not identified as such by MRI. In other words, at the assumptive prevalence of 30%, MRI may result in 273 (95% CI: 249 to 285) true positives, 441 false positives (95% CI: 378 to 497), 259 true negatives (95% CI: 203 to 322) and 27 (95% CI: 15 to 51) false negatives per 1000 men (summary of findings Table 3).

Diagnostic test accuracy of MRI for indicating grade 2 and higher prostate cancer.
Summary ROC plot of MRI verified by template‐guided biopsy. The 95% confidence region illustrates the uncertainty around the pooled summary point; the 95% prediction region illustrates the heterogeneity
MRI: magnetic resonance imaging
| Diagnostic accuracy of the index tests verified by template‐guided biopsy as the reference standard | |||||||
| Index test | MRI | Target | N participants | Proportion | Sensitivity | Specificity | P value |
| MRI | Positive + negative | G = 1 | 1764 (10) | 0.28 (0.20 to 0.38) | 0.70 (0.59 to 0.80) | 0.27 (0.19 to 0.37) | P < 0.01b |
| G ≥ 1 | 1764 (10) | 0.39 (0.30 to 0.50) | 0.84 (0.74 to 0.90) | 0.39 (0.30 to 0.50) | NA | ||
| G ≥ 2 | 3091 (12) | 0.29 (0.22 to 0.37) | 0.91 (0.83 to 0.95) | 0.37 (0.29 to 0.46) | P < 0.01b | ||
| G ≥ 3 | 1438 (7) | 0.31 (0.21 to 0.42) | 0.95 (0.87 to 0.99) | 0.35 (0.26 to 0.46) | ID | ||
| MRI‐TBx | Positive | G = 1 | 497 (5) | NA | 0.51 (0.21 to 0.81) | 1.00 (0.77 to 1.00) | NA |
| G ≥ 1 | 611 (6) | NA | 0.71 (0.61 to 0.80) | 0.93 (0.87 to 0.96) | NA | ||
| G ≥ 2 | 1553 (8) | NA | 0.80 (0.69 to 0.87) | 0.94 (0.90 to 0.97) | NA | ||
| G ≥ 3 | 428 (3) | NA | ID | ID | ID | ||
| MRI‐pathway | Positive + negative | G = 1 | 681 (5) | 0.24 (0.16 to 0.36) | 0.34 (0.19 to 0.53) | 1.00 (0.90 to 1.00) | P = 0.52c |
| G ≥ 1 | 844 (6) | 0.28 (0.21 to 0.35) | 0.58 (0.52 to 0.65) | 0.96 (0.92 to 0.98) | NA | ||
| G ≥ 2 | 2257 (8) | 0.29 (0.24 to 0.35) | 0.72 (0.60 to 0.82) | 0.96 (0.94 to 0.98) | P = 0.06c | ||
| G ≥ 3 | 604 (3) | 0.29 (0.26 to 0.33) | ID | ID | ID | ||
| SBx | NA | G = 1 | 3421 (4) | NA | 0.55 (0.25 to 0.83) | 0.99 (0.81 to 1.00) | NA |
| G ≥ 1 | 3421 (4) | NA | 0.65 (0.31 to 0.88) | 1.00 (0.88 to 1.00) | NA | ||
| G ≥ 2 | 3421 (4) | NA | 0.63 (0.19 to 0.93) | 1.00 (0.91 to 1.00) | NA | ||
| G ≥ 3 | 626 (2) | NA | ID | ID | ID | ||
| CI: confidence interval; G: International Society of Urological Pathology grade; ID: inadequate data; MRI: magnetic resonance imaging; MRI‐pathway: magnetic resonance imaging with or without magnetic resonance imaging‐targeted biopsy; MRI‐TBx: magnetic resonance imaging‐targeted biopsy; N: number; NA: not applicable; SBx: systematic biopsy | |||||||
aData did not allow differentiation between the mix of included participants (biopsy‐naïve and prior‐negative biopsy men).
bComparing sensitivity between MRI and the MRI‐pathway.
cComparing sensitivity between the MRI‐pathway and SBx.
2. MRI‐targeted biopsy compared with template‐guided biopsy
For grade 2 or higher prostate cancer, the pooled sensitivity and specificity of MRI‐targeted biopsy (in men with a positive MRI) were 0.80 (95% CI 0.69 to 0.87) and 0.94 (95% CI 0.90 to 0.97), respectively (8 studies, 1553 men; prevalence 34% (95% CI 24% to 46%); Table 6; Figure 9). Hence, MRI‐targeted biopsy in men with a positive MRI missed 20% of men with grade 2 or higher prostate cancer. At the assumptive prevalence of 30%, MRI‐targeted biopsy may result in 240 (95% CI: 207 to 261) true positives, 42 (95% CI: 21 to 70) false positives, 658 (95% CI: 630 to 669) true negatives and 60 (95% CI: 39 to 93) false negatives per 1000 men biopsied (summary of findings Table 4).
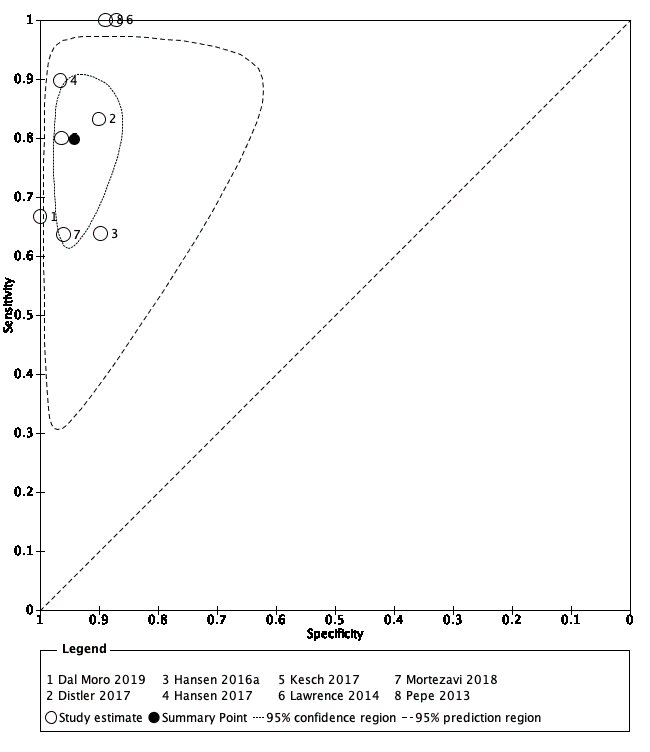
Diagnostic test accuracy of MRI‐targeted biopsy for detecting grade 2 and higher prostate cancer
Summary ROC plot of MRI‐targeted biopsy (in an MRI‐positive population) verified by template‐guided biopsy. The 95% confidence region illustrates the uncertainty around the pooled summary point; the 95% prediction region illustrates the heterogeneity
MRI: magnetic resonance imaging
3. MRI pathway (MRI with or without MRI‐targeted biopsy) compared with template‐guided biopsy
For grade 2 or higher prostate cancer, the pooled sensitivity and specificity of MRI pathway were 0.72 (95% CI 0.60 to 0.82) and 0.96 (95% CI 0.94 to 0.98), respectively (8 studies, 2257 men; prevalence 26% (95% CI 18% to 36%); Table 6; Figure 10). Hence, the MRI pathway missed 28% of men with grade 2 or higher prostate cancer. At the assumptive prevalence of 30%, the MRI pathway may result in 216 (95% CI: 180 to 246) true positives, 28 (95% CI: 14 to 42) false positives, 672 (95% CI: 658 to 686) true negatives and 84 (95% CI: 54 to 120) false negatives per 1000 men (summary of findings Table 5). The implications of these results, taking into account each step in the MRI pathway (MRI with subsequent MRI‐targeted biopsy in MRI‐positive men only), are shown in Figure 11.

Diagnostic test accuracy of the MRI pathway for detecting grade 2 and higher prostate cancer
Summary ROC plot of the MRI pathway verified by template‐guided biopsy. The 95% confidence region illustrates the uncertainty around the pooled summary point; the 95% prediction region illustrates the heterogeneity
MRI: magnetic resonance imaging; MRI pathway: MRI with or without MRI‐targeted biopsy

Test consequence graphic showing results that would be obtained if a hypothetical cohort of 1000 men were tested for prostate cancer using the MRI pathway.
4. Systematic biopsy compared with template‐guided biopsy
For grade 2 or higher prostate cancer, the pooled sensitivity and specificity of systematic biopsy were 0.63 (95% CI 0.19 to 0.93) and 1.00 (95% CI 0.91 to 1.00), respectively (4 studies, 3421 men; prevalence 34% (95% CI 21% to 51%); Table 6; Figure 12). This analysis included the large and high‐quality PROMIS‐study, Ahmed 2017 (sensitivity 0.48 (95% CI 0.43 to 0.54); specificity 0.99 (95% CI 0.97 to 1.00); 576 men; prevalence 53%). Hence, the systematic biopsy approach missed approximately 37% of men with grade 2 or higher prostate cancer. At the assumptive prevalence of 30%, systematic biopsy may result in 189 (95% CI: 57 to 279) true positives, 0 (95% CI: 0 to 63) false positives, 700 (95% CI: 637 to 700) true negatives and 111 (95% CI: 21 to 243) false negatives per 1000 men (summary of findings Table 6, Figure 13).

Diagnostic test accuracy of systematic biopsy for detecting grade 2 and higher prostate cancer
Summary ROC plot of systematic biopsy verified by template‐guided biopsy

Test consequence graphic showing results that would be obtained if a hypothetical cohort of 1000 men were tested for prostate cancer using systematic biopsy.
5. Comparison of diagnostic accuracy between the index tests
Comparing the accuracy of the MRI with the accuracy of the MRI pathway showed a substantial decrease in sensitivity (0.91 versus 0.72) and increase in specificity (0.37 versus 0.96), which were both statistically significant (P < 0.01; Figure 14). Comparing the accuracy of the MRI pathway with the accuracy of systematic biopsy showed a substantial decrease in sensitivity (0.72 versus 0.63; P = 0.06) and similar specificities (Figure 15).
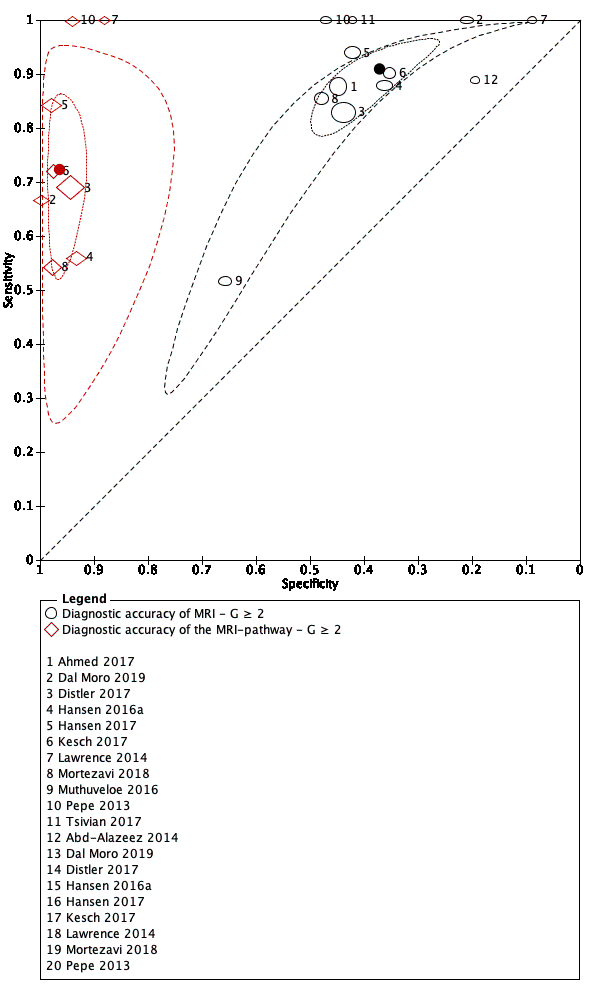
Comparison of diagnostic test accuracy between MRI and the MRI pathway for detecting grade 2 and higher prostate cancer.
Summary ROC plot of MRI and the MRI pathway verified by template‐guided biopsy
G: International Society of Urological Pathology grade; MRI: magnetic resonance imaging; MRI pathway: MRI with or without MRI‐targeted biopsy

Comparison of diagnostic test accuracy between the MRI pathway and systematic biopsy for detecting grade 2 and higher prostate cancer.
Summary ROC plot of the MRI pathway versus systematic biopsy, verified by template‐guided biopsy
G: International Society of Urological Pathology grade; MRI: magnetic resonance imaging; MRI pathway: MRI with or without MRI‐targeted biopsy; SBx: systematic biopsy
Detection of grade 3 or higher prostate cancer
1. MRI compared with template‐guided biopsy
The pooled sensitivity and specificity of MRI were 0.95 (95% CI 0.87 to 0.99) and 0.35 (95% CI 0.26 to 0.46), respectively (7 studies, 1438 men; prevalence 14% (95% CI 8% to 23%); Table 6). Hence, 5% of men with grade 3 or higher prostate cancer were not identified by MRI. At the assumptive prevalence of 14%, MRI may result in 133 (95% CI: 122 to 139) true positives, 559 (95% CI: 464 to 636) false positives, 301 (95% CI: 244 to 396) true negatives and 7 (95% CI: 1 to 18) false negatives per 1000 men.
2. MRI‐targeted biopsy, MRI pathway and systematic biopsy compared with template‐guided biopsy
For MRI‐targeted biopsy, the MRI pathway and systematic biopsy, insufficient data on grade 3 or higher prostate cancer were available to perform meta‐analyses; individual study results are presented in the Data table 19, Data table 23 and Data table 27, respectively.
Detection of grade 1 prostate cancer
The sensitivities and specificities for grade 1 prostate cancer were as follows:
1. MRI: 0.70 (95% CI 0.59 to 0.80) and 0.27 (95% CI 0.19 to 0.37), respectively (10 studies, 1764 men; prevalence 20% (95% CI 17% to 23%); Table 6);
2. MRI‐targeted biopsy: 0.51 (95% CI 0.21 to 0.81) and 1.00 (95% CI 0.77 to 1.00), respectively (5 studies, 497 men; prevalence 22% (95% CI 19% to 26%); Table 6);
3. MRI pathway: 0.34 (95% CI 0.19 to 0.53) and 1.00 (95% CI 0.90 to 1.00), respectively (5 studies, 681 men; prevalence 21% (95% CI 18% to 24%); Table 6);
4. systematic biopsy: 0.55 (95% CI 0.25 to 0.83) and 0.99 (95% CI 0.81 to 1.00), respectively (4 studies, 3421 men; prevalence 20% (95% CI 16% to 25%); Table 6).
Hence, comparing the sensitivity of the MRI pathway and systematic biopsy, the MRI pathway potentially avoided the detection of 66% of men with indolent prostate cancer, whereas systematic biopsy potentially avoided detection of 45% of men with indolent prostate cancer (P = 0.52).
Predictive values
The pooled prevalences of grade 2 or higher prostate cancer in the accuracy studies that assessed MRI, MRI‐targeted biopsy, MRI pathway and systematic biopsy, were 29% (95% CI 22% to 38%), 34% (95% CI 24% to 46%), 26% (95% CI 18% to 36%), and 34% (95% CI 21% to 51%), respectively (Table 7). Obviously, the prevalence of grade 2 or higher prostate cancer for MRI‐targeted biopsy is higher than that for the other index tests, due to the 'enriched' population resulting from the selection of only MRI‐positive men.
| Predictive values of the index tests and prostate cancer prevalences | ||||||
| Test | MRI | Target | N participants | Prevalenceb | NPVc | PPVc |
| MRI | Positive + negative | G = 1 | 1764 (10) | 0.20 (0.17 to 0.23) | 0.79 (0.74 to 0.82) | 0.20 (0.18 to 0.21) |
| G ≥ 2 | 3091 (12) | 0.29 (0.22 to 0.38) | 0.91 (0.86 to 0.94) | 0.37 (0.35 to 0.39) | ||
| G ≥ 3 | 1438 (7) | 0.14 (0.08 to 0.23) | 0.98 (0.95 to 0.99) | 0.19 (0.17 to 0.21) | ||
| MRI‐TBx | Positive | G = 1 | 497 (5) | 0.22 (0.19 to 0.26) | 0.88 (0.78 to 0.94) | 0.98 (0.23 to 1.00) |
| G ≥ 2 | 1553 (8) | 0.34 (0.24 to 0.46) | 0.90 (0.85 to 0.93) | 0.88 (0.80 to 0.92) | ||
| G ≥ 3 | 428 (3) | 0.21 (0.12 to 0.35) | ID | ID | ||
| MRI‐pathway | Positive + negative | G = 1 | 681 (5) | 0.21 (0.18 to 0.24) | 0.85 (0.81 to 0.88) | 0.95 (0.38 to 1.00) |
| G ≥ 2 | 2257 (8) | 0.26 (0.18 to 0.36) | 0.91 (0.87 to 0.94) | 0.88 (0.80 to 0.92) | ||
| G ≥ 3 | 604 (3) | 0.16 (0.09 to 0.27) | ID | ID | ||
| SBx | NA | G = 1 | 3421 (4) | 0.20 (0.16 to 0.25) | 0.90 (0.81 to 0.95) | 0.94 (0.37 to 1.00) |
| G ≥ 2 | 3421 (4) | 0.34 (0.21 to 0.51) | 0.84 (0.60 to 0.95) | 1.00 (0.76 to 1.00) | ||
| G ≥ 3 | 626 (2) | 0.10 (0.08 to 0.12) | ID | ID | ||
| CI: confidence interval; G: International Society of Urological Pathology grade; ID: inadequate data; MRI: magnetic resonance imaging; MRI‐pathway: magnetic resonance imaging with or without magnetic resonance imaging‐targeted biopsy; MRI‐TBx: magnetic resonance imaging‐targeted biopsy; NA: not applicable; NPV: negative predictive value; PPV: positive predictive value; SBx: systematic biopsy | ||||||
aData did not allow differentiation between the mix of included participants (biopsy‐naïve and prior‐negative biopsy men).
bPrevalence is pooled estimate of all detected cancer by template‐guided biopsy.
cBased on the Bayes’ theorem using the point estimates and 95% confidence intervals of the pooled positive and negative likelihood ratio and the point estimate of the prevalence.
The NPVs and PPVs of the index tests as a function of the pooled grade 2 or higher, grade 3 or higher and grade 1 prostate cancer prevalences are presented in Table 7. We are only able to compare these predictive values for the index tests at a prespecified prevalence. At a prespecified prevalence of 30% grade 2 or higher prostate cancer (based on the prevalence findings in the test accuracy analysis), the NPVs for MRI, MRI‐targeted biopsy, the MRI pathway and systematic biopsy are 91% (95% CI 86 to 94%), 92% (95% CI 88 to 94%), 89% (95% CI 85 to 92%) and 86% (95% CI 65 to 95%), respectively (Appendix 5). Consequently, in the MRI pathway, a negative MRI falsely predicts the absence of grade 2 or higher prostate cancer in 9% of men (Figure 9), while a negative systematic biopsy falsely predicts the absence of grade 2 or higher prostate cancer in 14% of men (Figure 13).
Sensitivity and specificity at a higher MRI‐positive threshold
In clinical practice, lesions with an MRI suspicion score of 3 (likelihood for clinically significant cancer is equivocal (Barentsz 2012)) might or might not be targeted with biopsies. By increasing the threshold of MRI‐positivity from 3/5 to 4/5, the proportion of negative MRI increased from 30% (95% CI 23% to 38%) to 59% (95% CI 43% to 74%) (Table 8). The pooled sensitivity of MRI for detecting grade 2 or higher prostate cancer decreased from 0.89 (95% CI 0.82 to 0.94) to 0.72 (95% CI 0.52 to 0.86). The pooled specificity increased from 0.39 (95% CI 0.32 to 0.47) to 0.78 (95% CI 0.68 to 0.86), indicating that with a threshold 4/5 for MRI positivity, a negative MRI failed to identify 28% of men with grade 2 or higher prostate cancer.
| MRI‐positivity threshold effect, verified by template‐guided biopsy as the reference standard, with threshold ≥ 3and ≥ 4 out of 5 for identifying prostate cancer | |||||
| MRI threshold | Target | N participants | Proportion | Sensitivity | Specificity |
| ≥ 3/5 | G = 1 | 1647 (8) | 0.29 (0.21 to 0.40) | 0.68 (0.57 to 0.77) | 0.28 (0.19 to 0.39) |
| G ≥ 2 | 2974 (10) | 0.30 (0.23 to 0.38) | 0.89 (0.82 to 0.94) | 0.39 (0.32 to 0.47) | |
| G ≥ 3 | 1438 (7) | 0.31 (0.21 to 0.42) | 0.96 (0.87 to 0.99) | 0.35 (0.26 to 0.46) | |
| ≥ 4/5 | G = 1 | 834 (4) | 0.60 (0.38 to 0.78) | 0.26 (0.16 to 0.40) | 0.57 (0.36 to 0.76) |
| G ≥ 2 | 1083 (5) | 0.59 (0.43 to 0.74) | 0.72 (0.52 to 0.86) | 0.78 (0.68 to 0.86) | |
| G ≥ 3 | 834 (4) | 0.60 (0.38 to 0.78) | 0.86 (0.51 to 0.97) | 0.68 (0.51 to 0.81) | |
| CI: confidence interval; G: International Society of Urological Pathology grade; MRI: magnetic resonance imaging; N: number | |||||
aData did not allow differentiation between the mix of included participants (biopsy‐naïve and prior‐negative biopsy men).
Furthermore, the pooled sensitivity of MRI for detecting grade 3 or higher prostate cancer at a threshold of 4/5 is 0.86 (95% CI 0.51 to 0.97), indicating that a positive MRI missed 14% of men with grade 3 or higher prostate cancer. The MRI‐threshold dependency (3/5 versus 4/5) for detecting grade 2 or higher and grade 3 or higher prostate cancer is depicted by ROC plots in Figure 16 and Figure 17, respectively.

MRI‐positivity threshold effect for indicating grade 2 and higher prostate cancer.
Summary ROC plot of MRI verified by template‐guided biopsy, with different thresholds for positivity: intermediate (3/5) vs high (4/5)
G: International Society of Urological Pathology grade; MRI: magnetic resonance imaging

MRI‐positivity threshold effect for indicating grade 3 and higher prostate cancer.
Summary ROC plot of MRI verified by template‐guided biopsy, with different thresholds for positivity: intermediate (3/5) vs high (4/5)
G: International Society of Urological Pathology grade; MRI: magnetic resonance imaging
Agreement between the MRI pathway and systematic biopsy
In this section, we focused on agreement and disagreement (concordance and discordance) in the number of target conditions identified by the MRI pathway and systematic biopsy. In addition, we have presented the proportions of participants with prostate cancer detected only by the MRI pathway and only by systematic biopsy (added values).
Prostate cancer detection in the MRI pathway and systematic biopsy
Detection ratios for grade 2 or higher prostate cancer
In a mixed population (of biopsy‐naïve and prior‐negative biopsy men), the pooled detection ratio of grade 2 or higher prostate cancer was 1.12 (95% CI 1.02 to 1.23; 25 studies, 6944 men; Table 9; Figure 18), meaning that the MRI pathway increased the grade 2 or higher prostate cancer detection rate by 12% over systematic biopsy.
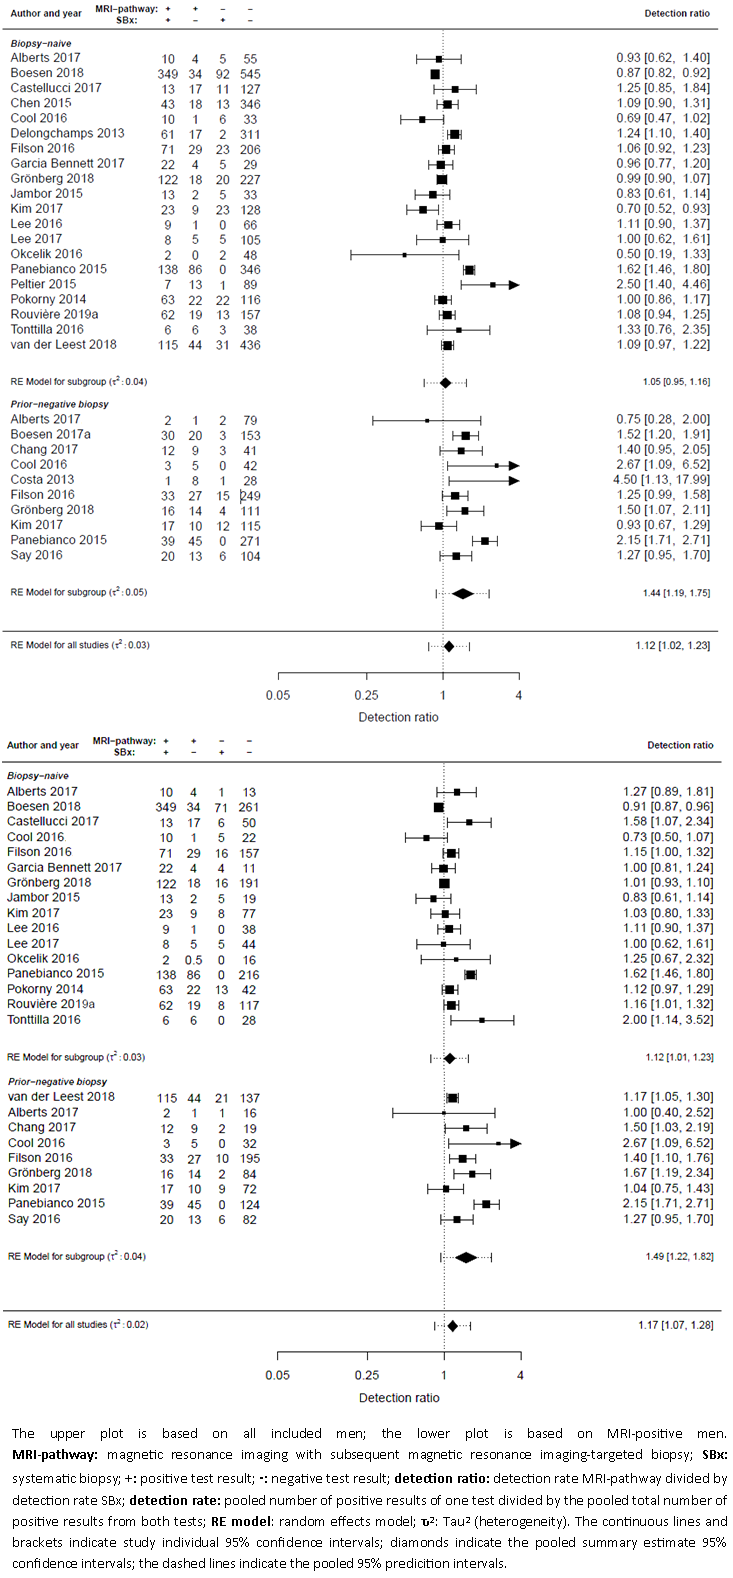
Forest plots of the agreement analysis (MRI pathway vs systematic biopsy) for detecting grade 2 and higher prostate cancer
| Population | Target condition | N participants (studies) | Proportion prostate cancer detected in % (95% CI) | Detection ratiob | Difference | ||||
| Biopsy status | MRI, proportion in % (95% CI)a | MRI‐pathway and SBx combined (total cancer detected) | MRI‐pathway | SBx | MRI‐pathway versus SBx | P value | |||
| Mixedd | Positive + negative | G = 1 | 5442 (21) | 25.6 (22.8 to 28.8) | 12.3 (10.1 to 15.1) | 20.8 (18.0 to 24.1) | 0.61 (0.52 to 0.71) | P < 0.01 | NA |
| G ≥ 1 | 6524 (24) | 50.2 (46.4 to 54.3) | 37.9 (33.4 to 42.6) | 43.3 (39.1 to 47.8) | 0.88 (0.81 to 0.95) | P < 0.01 | NA | ||
| G ≥ 2 | 6944 (25) | 26.7 (23.3 to 30.7) | 22.9 (19.5 to 26.8) | 19.4 (15.9 to 23.5) | 1.12 (1.02 to 1.23) | P = 0.01 | NA | ||
| G ≥ 3 | 5981 (21) | 15.0 (12.7 to 18.0) | 12.7 (10.5 to 15.6) | 9.7 (7.5 to 12.7) | 1.20 (1.06 to 1.36) | P < 0.01 | NA | ||
| Positive | G = 1 | 3460 (19) | 29.5 (26.0 to 33.8) | 18.8 (15.2 to 23.4) | 22.4 (18.9 to 26.9) | 0.85 (0.75 to 0.97) | P = 0.01 | NA | |
| G ≥ 1 | 3998 (20) | 68.0 (62.3 to 73.5) | 61.1 (54.1 to 67.7) | 58.9 (51.5 to 65.9) | 1.03 (0.95 to 1.10) | P = 0.52 | NA | ||
| G ≥ 2 | 3998 (20) | 42.6 (37.6 to 48.1) | 37.9 (32.7 to 43.7) | 31.6 (26.2 to 37.9) | 1.17 (1.07 to 1.28) | P < 0.01 | NA | ||
| G ≥ 3 | 3902 (18) | 24.2 (20.9 to 28.1) | 21.0 (17.8 to 24.8) | 16.3 (13.1 to 20.3) | 1.24 (1.11 to 1.38) | P < 0.01 | NA | ||
| Biopsy‐naïve | Positive + negative | G = 1 | 4079 (17) | 27.2 (23.9 to 31.1) | 13.5 (10.7 to 17.2) | 22.4 (19.1 to 26.3) | 0.63 (0.54 to 0.74) | P < 0.01 | P = 0.91 |
| G ≥ 1 | 4799 (19) | 53.2 (48.7 to 57.9) | 41.0 (35.8 to 46.4) | 47.8 (42.8 to 52.9) | 0.85 (0.77 to 0.93) | P < 0.01 | P = 0.12 | ||
| G ≥ 2 | 5219 (20) | 27.7 (23.7 to 32.6) | 23.4 (19.3 to 28.1) | 21.4 (17.2 to 26.5) | 1.05 (0.95 to 1.16) | P = 0.35 | P < 0.01 | ||
| G ≥ 3 | 4306 (16) | 15.5 (12.6 to 19.5) | 12.7 (9.9 to 16.5) | 10.8 (8.0 to 14.8) | 1.09 (0.94 to 1.26) | P = 0.27 | P < 0.01 | ||
| Positive | G = 1 | 2682 (16) | 31.8 (27.7 to 36.9) | 21.3 (17.0 to 26.9) | 23.7 (19.6 to 29.1) | 0.85 (0.74 to 0.98) | P = 0.03 | P = 0.35 | |
| G ≥ 1 | 2955 (17) | 70.9 (65.0 to 76.6) | 63.7 (56.3 to 70.6) | 63.8 (56.2 to 70.7) | 0.99 (0.92 to 1.08) | P = 0.88 | P = 0.05 | ||
| G ≥ 2 | 2955 (17) | 44.2 (38.6 to 50.4) | 39.2 (33.3 to 45.7) | 34.4 (28.3 to 41.3) | 1.12 (1.01 to 1.23) | P = 0.03 | P < 0.01 | ||
| G ≥ 3 | 2899 (15) | 24.8 (21.0 to 29.6) | 21.2 (17.4 to 25.7) | 17.5 (13.8 to 22.3) | 1.16 (1.02 to 1.31) | P = 0.02 | P < 0.01 | ||
| Prior‐negative biopsy | Positive + negative | G = 1 | 1202 (8) | 23.0 (18.0 to 30.2) | 10.9 (7.9 to 15.3) | 17.8 (12.7 to 25.2) | 0.62 (0.44 to 0.88) | P < 0.01 | P = 0.91 |
| G ≥ 1 | 1564 (10) | 40.7 (35.1 to 47.2) | 30.0 (24.1 to 37.0) | 30.3 (24.3 to 37.5) | 0.97 (0.85 to 1.11) | P = 0.70 | P = 0.12 | ||
| G ≥ 2 | 1564 (10) | 22.8 (20.0 to 26.2) | 20.5 (17.7 to 23.5) | 13.2 (10.8 to 16.4) | 1.44 (1.19 to 1.75) | P < 0.01 | P < 0.01 | ||
| G ≥ 3 | 1514 (9) | 12.6 (10.5 to 15.6) | 11.5 (9.4 to 14.2) | 6.3 (4.4 to 9.1) | 1.64 (1.27 to 2.11) | P < 0.01 | P < 0.01 | ||
| Positive | G = 1 | 655 (7) | 27.9 (22.1 to 36.2) | 18.2 (12.8 to 26.7) | 18.9 (13.3 to 27.5) | 1.03 (0.89 to 1.18) | P = 0.71 | P = 0.35 | |
| G ≥ 1 | 920 (8) | 54.8 (44.6 to 66.4) | 48.5 (37.0 to 61.5) | 39.4 (27.1 to 53.9) | 1.16 (1.02 to 1.32) | P = 0.02 | P = 0.05 | ||
| G ≥ 2 | 920 (8) | 31.3 (27.4 to 36.1) | 28.6 (24.7 to 33.1) | 18.3 (15.1 to 22.5) | 1.49 (1.22 to 1.82) | P < 0.01 | P < 0.01 | ||
| G ≥ 3 | 880 (7) | 17.9 (14.3 to 22.9) | 16.7 (13.1 to 21.5) | 9.4 (6.4 to 14.2) | 1.65 (1.30 to 2.09) | P < 0.01 | P < 0.01 | ||
| CI: confidence interval; G: International Society of Urological Pathology grade; MRI: magnetic resonance imaging; MRI‐pathway: magnetic resonance imaging with or without magnetic resonance imaging‐targeted biopsy; MRI‐TBx: magnetic resonance imaging‐targeted biopsy; N: number; SBx: systematic biopsy | |||||||||
aProportion of participants with a positive or negative magnetic resonance imaging result, based on the studies reporting grade 2 or higher.
bDetection ratio is detection rate of magnetic resonance imaging‐pathway divided by detection rate of systematic biopsy; the detection rate is the pooled number of positive results of the test divided by the pooled total number of positive results from both tests.
cEvaluating the difference in detection ratio's between the populations (biopsy‐naïve men versus prior‐negative biopsy) for each target condition.
dMixed: biopsy‐naïve and prior‐negative biopsy men.
For men in the biopsy‐naïve setting, cancer proportion (total prostate cancer detected by both tests) was 27.7% (95% CI 23.7 to 32.6%; 20 studies, 5219 men), versus prior‐negative biopsy setting 22.8% (95% CI 20.0 to 26.2%; 10 studies, 1564 men). The pooled detection ratios for grade 2 or higher prostate cancer were 1.05 (95% CI 0.95 to 1.16) versus 1.44 (95% CI 1.19 to 1.75), respectively (P < 0.01; Table 9, Figure 18).
When focusing on only MRI‐positive men in both subgroups, the pooled detection ratio increased from 1.05 to 1.12 (95% CI 1.01 to 1.23) and from 1.44 to 1.49 (95% CI 1.22 to 1.82), respectively (Figure 18).
Detection ratios for grade 3 or higher prostate cancer
For men in the biopsy‐naïve setting, cancer proportion was 15.5% (95% CI 12.6 to 19.5%; 16 studies, 4306 men), and in the prior‐negative biopsy setting cancer proportion was 12.6% (95% CI 10.5 to 15.6%; 9 studies; 1514 men). The pooled detection ratio of grade 3 or higher prostate cancer was 1.09 (95% CI 0.94 to 1.26) and 1.64 (95% CI 1.27 to 2.11), respectively (Table 9). When focusing on only MRI‐positive men in both subgroups, the pooled detection ratio increased from 1.09 to 1.16 (95% CI 1.02 to 1.31) and from 1.64 to 1.65 (95% CI 1.30 to 2.09), respectively.
Detection ratios for grade 1 prostate cancer
For men in the biopsy‐naïve setting, cancer proportion was 27.2% (95% CI 23.9 to 31.1%; 17 studies, 4079 men), and in the prior‐negative biopsy setting, cancer proportion was 23.0% (95% CI 18.0 to 30.2%; 8 studies; 1202 men). The pooled detection ratio of grade 1 prostate cancer was 0.63 (95% CI 0.54 to 0.74) and 0.62 (95% CI 0.44 to 0.88), respectively (Table 9).
The agreement data results based on meta‐analysis with mixed modelling (multinomial logistic regression models) are presented in Table 9; the results based on direct random‐effects meta‐analysis are presented in Appendix 6.
Added values of the MRI pathway and systematic biopsy in prostate cancer detection
Added values in grade 2 or higher prostate cancer detection
Per 100 biopsy‐naïve men, the MRI pathway detected approximately 23 men with grade 2 or higher prostate cancer (23.4%, 95% CI 19.4 to 28.2%; 20 studies, 5219 men; Table 10). In addition to the MRI pathway, systematic biopsy detected four additional men (4.3%, 95% CI 2.6% to 6.9%) (Table 10). The total number of detected cases was 27 (27.7%, 95% CI 23.7% to 32.6%). Conversely, systematic biopsy detected 21 men (21.4%, 95% CI 17.2% to 26.5%), and the MRI pathway detected six additional men (6.3%, 95% CI 4.8% to 8.2%).
| Population | Target | N participants | Proportion prostate cancer detected in % (95% CI) | ||||||
| Biopsy status | MRI, | MRI‐pathway and SBx combined (total cancer detected) | MRI‐pathway | SBx | Both MRI‐pathway and SBx | Only MRI‐pathway (added valueb) | Only SBx (added valueb) | ||
| Mixedc | Positive + negative | G = 1d | 5442 (21) | 19.5 (16.9 to 22.7) | 10.3 (8.1 to 13.1) | 16.8 (14.2 to 19.9) | 7.6 (5.5 to 10.2) | 2.7 (1.8 to 4.0) | 9.2 (7.4 to 11.4) |
| G ≥ 1 | 6524 (24) | 50.2 (46.4 to 54.3) | 37.9 (33.4 to 42.6) | 43.3 (39.1 to 47.8) | 30.9 (26.3 to 36.0) | 6.9 (5.2 to 9.2) | 12.4 (10.2 to 14.9) | ||
| G ≥ 2 | 6944 (25) | 26.7 (23.3 to 30.7) | 22.9 (19.5 to 26.9) | 19.4 (15.9 to 23.6) | 15.6 (12.2 to 19.6) | 7.3 (5.9 to 9.0) | 3.8 (2.5 to 5.7) | ||
| G ≥ 3 | 5981 (21) | 15.0 (12.7 to 18.0) | 12.7 (10.5 to 15.6) | 9.7 (7.5 to 12.7) | 7.4 (5.3 to 10.2) | 5.3 (4.3 to 6.5) | 2.3 (1.4 to 3.7) | ||
| Positive | G = 1d | 3460 (19) | 19.7 (15.9 to 24.7) | 15.8 (12.2 to 20.7) | 15.8 (12 to 20.8) | 12.0 (8.4 to 16.8) | 3.9 (2.6 to 5.7) | 3.8 (2.3 to 6.2) | |
| G ≥ 1 | 3998 (20) | 68.0 (62.3 to 73.5) | 61.1 (54.1 to 67.7) | 58.9 (51.5 to 65.9) | 52.0 (43.6 to 59.9) | 9.1 (5.9 to 13.5) | 6.9 (4.6 to 10.1) | ||
| G ≥ 2 | 3998 (20) | 42.6 (37.6 to 48.1) | 37.9 (32.7 to 43.7) | 31.6 (26.2 to 37.9) | 27.0 (21.4 to 33.4) | 10.9 (8.5 to 13.9) | 4.6 (2.9 to 7.2) | ||
| G ≥ 3 | 3902 (18) | 24.2 (20.9 to 28.1) | 21 (17.8 to 24.8) | 16.3 (13.1 to 20.3) | 13.2 (10.1 to 16.9) | 7.9 (6.3 to 9.7) | 3.1 (1.9 to 5.2) | ||
| Negative | G = 1d | 1666 (19) | 16.8 (12.9 to 21.6) | NA | 16.8 (12.9 to 21.6) | NA | NA | 16.8 (12.9 to 21.6) | |
| G ≥ 1 | 1781 (20) | 23.1 (19.7 to 26.9) | NA | 23.1 (19.7 to 26.9) | NA | NA | 23.1 (19.7 to 26.9) | ||
| G ≥ 2 | 1781 (20) | 7.2 (5.3 to 9.8) | NA | 7.2 (5.3 to 9.8) | NA | NA | 7.2 (5.3 to 9.8) | ||
| G ≥ 3 | 1725 (18) | 2.7 (1.6 to 4.6) | NA | 2.7 (1.6 to 4.6) | NA | NA | 2.7 (1.6 to 4.6) | ||
| Biopsy‐naïve | Positive + negative | G = 1d | 4079 (17) | 20.9 (18.0 to 24.7) | 11.2 (8.4 to 14.9) | 18.5 (15.6 to 22.2) | 8.8 (6.2 to 12.3) | 2.4 (1.4 to 4.0) | 9.8 (8.0 to 11.8) |
| G ≥ 1 | 4799 (19) | 53.2 (48.7 to 57.9) | 41.0 (35.8 to 46.4) | 47.8 (42.8 to 52.9) | 35.6 (30.2 to 41.2) | 5.4 (3.6 to 8.0) | 12.2 (8.7 to 16.7) | ||
| G ≥ 2 | 5219 (20) | 27.7 (23.7 to 32.6) | 23.4 (19.4 to 28.2) | 21.4 (17.2 to 26.5) | 17.1 (13.0 to 22) | 6.3 (4.8 to 8.2) | 4.3 (2.6 to 6.9) | ||
| G ≥ 3 | 4306 (16) | 15.5 (12.6 to 19.5) | 12.7 (9.9 to 16.5) | 10.8 (8.0 to 14.8) | 8.0 (5.4 to 11.6) | 4.7 (3.5 to 6.3) | 2.8 (1.7 to 4.8) | ||
| Positive | G = 1d | 2682 (16) | 21.1 (16.7 to 27.1) | 17.0 (12.6 to 22.9) | 17.7 (13.3 to 23.8) | 13.6 (9.3 to 19.5) | 3.4 (2.1 to 5.3) | 4.1 (2.5 to 6.7) | |
| G ≥ 1 | 2955 (17) | 70.9 (65.0 to 76.6) | 63.7 (56.3 to 70.6) | 63.8 (56.2 to 70.7) | 56.6 (47.7 to 64.6) | 7.1 (4.2 to 11.9) | 7.2 (4.7 to 10.8) | ||
| G ≥ 2 | 2955 (17) | 44.2 (38.6 to 50.4) | 39.2 (33.3 to 45.7) | 34.4 (28.3 to 41.3) | 29.5 (23.2 to 36.5) | 9.8 (7.1 to 13.2) | 4.9 (2.8 to 8.3) | ||
| G ≥ 3 | 2899 (15) | 24.8 (21.0 to 29.6) | 21.2 (17.4 to 25.7) | 17.5 (13.8 to 22.3) | 13.9 (10.3 to 18.3) | 7.3 (5.4 to 9.7) | 3.7 (2.2 to 6.1) | ||
| Negative | G = 1 | 1287 (16) | 18.4 (14.2 to 23.7) | NA | 18.4 (14.2 to 23.7) | NA | NA | 18.4 (14.2 to 23.7) | |
| G ≥ 1 | 1343 (17) | 25.5 (20.7 to 30.9) | NA | 25.5 (20.7 to 30.9) | NA | NA | 25.5 (20.7 to 30.9) | ||
| G ≥ 2 | 1343 (17) | 8.1 (5.6 to 11.6) | NA | 8.1 (5.6 to 11.6) | NA | NA | 8.1 (5.6 to 11.6) | ||
| G ≥ 3 | 1297 (15) | 3.0 (1.6 to 5.5) | NA | 3.0 (1.6 to 5.5) | NA | NA | 3.0 (1.6 to 5.5) | ||
| Prior‐negative biopsy | Positive + negative | G = 1d | 1202 (8) | 17.6 (13.0 to 25.0) | 9.8 (6.9 to 14.3) | 13.5 (8.9 to 21.0) | 5.8 (3.2 to 10.0) | 4.1 (2.6 to 6.2) | 7.7 (3.9 to 14.8) |
| G ≥ 1 | 1564 (10) | 40.7 (35.1 to 47.2) | 30.0 (24.1 to 37.0) | 30.3 (24.3 to 37.5) | 19.6 (13.7 to 27.1) | 10.3 (7.5 to 13.9) | 10.7 (7.4 to 15) | ||
| G ≥ 2 | 1564 (10) | 22.8 (20.0 to 26.2) | 20.5 (17.7 to 23.5) | 13.2 (10.8 to 16.4) | 10.9 (8.7 to 13.5) | 9.6 (7.7 to 11.8) | 2.3 (1.2 to 4.5) | ||
| G ≥ 3 | 1514 (9) | 12.6 (10.5 to 15.6) | 11.5 (9.4 to 14.2) | 6.3 (4.4 to 9.1) | 5.1 (3.4 to 7.7) | 6.3 (5.2 to 7.7) | 1.1 (0.5 to 2.6) | ||
| Positive | G = 1d | 655 (7) | 19.5 (13.9 to 28.8) | 16.5 (11.0 to 25.2) | 12.4 (7.2 to 21.6) | 9.4 (4.6 to 17.9) | 7.1 (4.1 to 11.8) | 3.0 (1.0 to 8.0) | |
| G ≥ 1 | 920 (8) | 54.8 (44.6 to 66.4) | 48.5 (37.0 to 61.5) | 39.4 (27.1 to 53.9) | 33.1 (20.1 to 48.7) | 15.4 (8.2 to 26.4) | 6.3 (3.8 to 9.8) | ||
| G ≥ 2 | 920 (8) | 31.3 (27.4 to 36.1) | 28.6 (24.7 to 33.1) | 18.3 (15.1 to 22.5) | 15.7 (12.7 to 19.1) | 13.0 (9.7 to 17.0) | 2.7 (1.2 to 5.7) | ||
| G ≥ 3 | 880 (7) | 17.9 (14.3 to 22.9) | 16.7 (13.1 to 21.5) | 9.4 (6.4 to 14.2) | 8.2 (5.2 to 12.6) | 8.5 (6.1 to 11.5) | 1.2 (0.4 to 3.2) | ||
| Negative | G = 1 | 341 (7) | 14.2 (5.9 to 30.2) | NA | 14.2 (5.9 to 30.2) | NA | NA | 14.2 (5.9 to 30.2) | |
| G ≥ 1 | 400 (8) | 19.5 (12.9 to 28.3) | NA | 19.5 (12.9 to 28.3) | NA | NA | 19.5 (12.9 to 28.3) | ||
| G ≥ 2 | 400 (8) | 5.3 (3.1 to 8.9) | NA | 5.3 (3.1 to 8.9) | NA | NA | 5.3 (3.1 to 8.9) | ||
| G ≥ 3 | 390 (7) | 3.3 (1.7 to 6.3) | NA | 3.3 (1.7 to 6.3) | NA | NA | 3.3 (1.7 to 6.3) | ||
| CI: confidence interval; G: International Society of Urological Pathology grade; MRI: magnetic resonance imaging; MRI‐pathway: magnetic resonance imaging with or without magnetic resonance imaging‐targeted biopsy; MRI‐TBx: magnetic resonance imaging‐targeted biopsy: N: number; NA: not applicable; SBx: systematic biopsy | |||||||||
aProportion of participants with a positive or negative MRI result, based on the studies reporting grade 2 or higher.
bAdded value MRI‐pathway is the proportion of prostate cancer not detected by systematic biopsy but only by the MRI‐pathway; added value of systematic biopsy is the proportion of prostate cancer not detected by the MRI‐pathway but only by systematic biopsy.
cMixed: biopsy‐naïve and prior‐negative biopsy men.
dThe tests are considered as 'add‐on tests', taking into account grade reclassification by each test (Appendix 3). Therefore, G = 1 results differ from results in Table 9, where the tests are considered as 'replacement tests', not taking into account grade reclassification.
Per 100 men with prior negative biopsy, the MRI pathway detected 21 men with grade 2 or higher prostate cancer (20.5%, 95% CI 17.7% to 23.5%; 10 studies, 1564 men; Table 10). In addition to the MRI pathway, systematic biopsy detected two additional men (2.3%, 95% CI 1.2% to 4.5%). The total number of detected cases was 23 (22.8%, 95% CI 20.0% to 26.2%). Conversely, systematic biopsy detected 13 men (13.2%, 95% CI 10.8% to 16.4%), and the MRI pathway detected 10 additional men (9.6%, 95% CI 7.7% to 11.8%).
Figure 19 shows the point estimates of the added values with their 95% confidence region and 95% prediction region. The 95% confidence region illustrates the uncertainty around the point estimate; the 95% prediction region illustrates the heterogeneity. Although the uncertainty of the point estimates was reasonably small, the heterogeneity was large, especially in the direction of systematic biopsy. This indicates that future individual studies might find considerable divergent results, especially for the added value of systematic biopsy. Furthermore, the heterogeneity appeared to be larger in biopsy‐naïve men than in prior‐negative men.

Added value of systematic biopsy plotted against the added value of the MRI pathway per population type in the agreement analysis, for detecting grade 2 and higher prostate cancer
Added values in grade 3 or higher prostate cancer detection
Per 100 biopsy‐naïve men, the MRI pathway detected approximately 13 men with grade 3 or higher prostate cancer (12.7%, 95% CI 9.9% to 16.5%; 16 studies, 4306 men; Table 10). In addition to the MRI pathway, systematic biopsy detected three additional men (2.8%, 95% CI 1.7% to 4.8%; Table 10). The total number of detected cases was 16 (15.5%, 95% CI 12.6% to 19.5%). Conversely, systematic biopsy detected 11 men (10.8%, 95% CI 8.0% to 14.8%) and the MRI pathway detected five additional men (4.7%, 95% CI 3.5% to 6.3%).
Per 100 men with prior negative biopsy, the MRI pathway detected 12 men with grade 3 or higher prostate cancer (11.5%, 95% CI 9.4% to 14.2%; 9 studies, 1514 men; Table 10). In addition to the MRI pathway, systematic biopsy detected one additional man (1.1%, 95% CI 0.5% to 2.6%). The total number of detected cases was 13 (12.6%, 95% CI 10.5% to 15.6%). Conversely, systematic biopsy detected six men (6.3%, 95% CI 4.4% to 9.1%), and the MRI pathway detected six additional men (6.3%, 95% CI 5.2% to 7.7%).
Added values in grade 1 prostate cancer detection
Per 100 biopsy‐naïve men, the MRI pathway detected approximately 11 men with grade 1 prostate cancer (11.2%, 95% CI 8.4% to 14.9%; 17 studies, 4079 men; Table 10). In addition to the MRI pathway, systematic biopsy detected 10 additional men (9.8%, 95% CI 8.0% to 11.8%). The total number of detected cases was 21 (20.9%, 95% CI 18.0% to 24.7%). Conversely, systematic biopsy detected 19 men (18.5%, 95% CI 15.6% to 22.2%) and the MRI pathway detected two additional men (2.4%, 95% CI 1.4% to 4.0%).
Per 100 men with prior negative biopsy, the MRI pathway detected 10 men with grade 1 prostate cancer (9.8%, 95% CI 6.9% to 14.3%; 8 studies, 1202 men; Table 10). In addition to the MRI pathway, systematic biopsy detected eight additional men (7.7%, 95% CI 3.9% to 14.8%). The total number of detected cases was 18 (17.6%, 95% CI 13.0% to 25.0%). Conversely, systematic biopsy detected 14 men (13.5%, 95% CI 8.9% to 21.0%), and the MRI pathway detected four additional men (4.1%, 95% CI 2.6% to 6.2%).
Added values of the MRI pathway and systematic biopsy in MRI‐positive and MRI‐negative men
Stratifying men further into MRI positive and MRI negative aids in interpreting the added value in each of these categories. The pooled proportions of positive and negative MRI were respectively 67.0% (95% CI 58.7% to 74.4%) and 33.0% (95% CI 25.6% to 41.3%) in the biopsy‐naïve setting and were equivalent in the prior negative biopsy setting (Table 10).
Per 100 biopsy‐naïve men with a positive MRI, the MRI pathway detected approximately 39 men with grade 2 or higher prostate cancer (39.2%, 95% CI 33.3% to 45.7%; 17 studies, 2955 men; Table 10). In addition to the MRI pathway, systematic biopsy detected five men (4.9%, 95% CI 2.8% to 8.3%). The total number of detected cases was 44 (44.2%, 95% CI 38.6% to 50.4%). Conversely, systematic biopsy detected 34 men (34.4%, 95% CI 28.3% to 41.3%) and the MRI pathway detected 10 additional men (9.8%, 95% CI 7.1% to 13.2%).
Per 100 biopsy‐naïve men with a negative MRI, systematic biopsy detected eight additional men with grade 2 or higher prostate cancer (8.1%, 95% CI 5.6% to 11.6%; 17 studies, 1343 men) and 18 additional men with grade 1 prostate cancer (18.4%, 95% CI 14.2% to 23.7%; 16 studies, 1287 men).
Per 100 men with a prior negative biopsy and a positive MRI, the MRI pathway detected approximately 29 men with grade 2 or higher prostate cancer (28.6%, 95% CI 24.7% to 33.1%; 8 studies, 920 men). In addition to the MRI pathway, systematic biopsy detected three men (2.7%, 95% CI 1.2% to 5.7%). The total number of detected cases was 31 (31.3%, 95% CI 27.4% to 36.1%). Conversely, systematic biopsy detected 18 men (18.3%, 95% CI 15.1% to 22.5%) and the MRI pathway detected an extra 13 men (13.0%, 95% CI 9.7% to 17.0%).
Per 100 men with a prior negative biopsy and a negative MRI, systematic biopsy detected five men with grade 2 or higher prostate cancer (5.3%, 95% CI 3.1% to 8.9%; 8 studies, 400 men) and an 14 additional men with grade 1 prostate cancer (14.2%, 95% CI 5.9% to 30.2%; 7 studies, 341 men).
Number needed to biopsy by systematic biopsy in addition to the MRI pathway
In biopsy‐naïve men with a positive MRI, the number needed to biopsy (NNB) for systematic biopsy in addition to MRI‐targeted biopsy for grade 2 or higher prostate cancer detection was 20 (95% CI 12 to 36; Table 11). In other words, to detect one additional man with grade 2 or higher prostate cancer, 20 men need to be biopsied by systematic biopsy in addition to MRI‐targeted biopsy. The NNB for detecting grade 3 or higher prostate cancer was 27 (95% CI 16 to 45).
| Agreement analysis: number needed to biopsy by systematic biopsy to detect one extra prostate cancer not detected by the MRI‐pathway | |||
| Population | Target | NNBa | |
| Biopsy status | MRI | ||
| Biopsy‐naïve | Positive | G = 1 | 24 (15 to 40) |
| G ≥ 2 | 20 (12 to 36) | ||
| G ≥ 3 | 27 (16 to 45) | ||
| Negative | G = 1 | 5 (4 to 7) | |
| G ≥ 2 | 13 (9 to 18) | ||
| G ≥ 3 | 33 (18 to 63) | ||
| Prior‐negative biopsy | Positive | G = 1 | 33 (13 to 100) |
| G ≥ 2 | 37 (18 to 83) | ||
| G ≥ 3 | 83 (31 to 250) | ||
| Negative | G = 1 | 7 (3 to 17) | |
| G ≥ 2 | 19 (11 to 32) | ||
| G ≥ 3 | 31 (16 to 63) | ||
| CI: confidence interval; G: International Society of Urological Pathology grade; MRI: magnetic resonance imaging; MRI‐pathway: magnetic resonance imaging with or without magnetic resonance imaging‐targeted biopsy; N: number; NA: not applicable; NNB: number needed to biopsy; SBx: systematic biopsy | |||
aNumber needed to biopsy by systematic biopsy is 100 divided by the added value of systematic biopsy.
In biopsy‐naïve men with a negative MRI, the NNB for grade 2 or higher prostate cancer detection was 13 (95% CI 9 to 18). The NNB for detecting grade 3 or higher was 33 (95% CI 18 to 63), considerably higher than for detecting grade 2 or higher prostate cancer.
In men with a prior negative biopsy and a positive MRI, the NNBs for grade 2 or higher and grade 3 or higher prostate cancer were 37 (95% CI 18 to 83) and 83 (95% CI 31 to 250), respectively. The NNBs in MRI‐negative men were 19 (95% CI 11 to 32) and 31 (95% CI 16 to 63), respectively.
Heterogeneity analyses
For the test accuracy analyses (index tests versus reference standard (template‐guided biopsy)), the heterogeneity is illustrated by the 95% prediction region around the pooled estimates, as shown in Figure 8 (MRI), Figure 9 (MRI‐targeted biopsy), Figure 10 (MRI pathway) and Figure 12 (systematic biopsy). We observed considerable heterogeneity in all index tests. Due to limited data, we were unable to explore heterogeneity for these tests.
For the agreement analyses (MRI pathway versus systematic biopsy), the heterogeneity (total τ2 = 0.03) is illustrated in Figure 18. Due to limited data, exploration of heterogeneity was only possible by independent analyses of different population types, endorectal coil use, MRI pulse sequences, MRI risk thresholds and MRI‐targeted biopsy techniques (Table 12). We found a statistically significant difference in the detection ratio of the MRI pathway versus systematic biopsy between the subgroups of population (prior negative biopsy versus biopsy naïve) and endorectal coil use (‘yes’ versus ‘no’), suggesting that they may be sources of heterogeneity. There was no statistically significant difference in the detection ratio of the MRI pathway versus systematic biopsy, between studies using mpMRI or bpMRI, between studies with a low or intermediate MRI risk threshold, and between studies using a software or a cognitive MRI‐targeted biopsy technique.
| Heterogeneity exploration in the agreement analysis: detection ratio MRI‐pathway vs systematic biopsy for G ≥ 2 prostate cancer | ||||
| Covariate | Category | N participants | Detection ratio | P value |
| Population | Biopsy‐naïve | 5219 (20) | 1.05 (0.95 to 1.16) | 0.002 |
| Prior to negative biopsy | 1564 (10) | 1.44 (1.19 to 1.75) | ||
| Field strength | 3T | 5407 (19) | ID | ID |
| 1.5T | 1143 (4) | ID | ID | |
| Endorectal coil | Yes | 1815 (6) | 1.42 (1.07 to 1.88) | 0.008 |
| No | 4082 (14) | 1.03 (0.94 to 1.12) | ||
| MRI pulse sequence | mpMRI | 4941 (16) | 1.18 (1.05 to 1.33) | 0.233 |
| bpMRI | 1775 (6) | 1.03 (0.91 to 1.17) | ||
| mpMRI + spectroscopy | 105 (2) | ID | ID | |
| MRI risk threshold | Low | 605 (6) | 1.18 (1.03 to 1.35) | 0.556 |
| Intermediate | 5859 (15) | 1.14 (1.03 to 1.26) | ||
| High | 428 (3) | ID | ID | |
| MRI‐TBx technique | Software | 3313 (9) | 1.15 (0.99 to 1.33) | 0.483 |
| Cognitive | 2194 (12) | 1.17 (1.00 to 1.36) | ||
| In‐bore | 849 (2) | ID | ID | |
| Route index test | Transrectal | 6464 (23) | ID | ID |
| Transperineal | 480 (2) | ID | ID | |
| bpMRI: biparametric magnetic resonance imaging; CI: confidence interval; G: International Society of Urological Pathology grade; ID: inadequate data; mpMRI: multiparametric magnetic resonance imaging; MRI: magnetic resonance imaging; MRI‐pathway: magnetic resonance imaging with or without magnetic resonance imaging‐targeted biopsy; MRI‐TBx: magnetic resonance imaging‐targeted biopsy; N: number; SBx: systematic biopsy | ||||
aDetection ratio is the detection rate of MRI‐pathway divided by detection rate of systematic biopsy; the detection rate = the pooled number of positive results of the test divided by the pooled total number of positive results from both tests.
Sensitivity analyses
We performed sensitivity analyses for the detection of grade 2 or higher prostate cancer by excluding studies based on certain quality and additional criteria.
Test accuracy analyses
Excluding studies with a high or unclear risk of bias or applicability concern in one of the four QUADAS‐2 domains did not substantially change the accuracy results of MRI, MRI‐targeted biopsy and the MRI pathway (Table 13), although we were unable to confirm this for applicability concerns in MRI‐targeted biopsy and the MRI pathway analyses because of a limited number of studies. We could not perform any sensitivity analyses for systematic biopsy due to the limited number of studies.
| Sensitivity analyses of the diagnostic test accuracy of MRI and the MRI‐pathway for detecting G ≥ 2 prostate cancer, verified by template‐guided biopsy as the reference standard | ||||||||
| Covariate | Category | MRI | MRI‐pathwaya | |||||
| N | Sensitivity | Specificity | N | Sensitivity | Specificity | |||
| Main analyses (as reference) | No selection | 12 | 0.91 (0.83 to 0.95) | 0.37 (0.29 to 0.46) | 8 | 0.72 (0.60 to 0.82) | 0.96 (0.94 to 0.98) | |
| QUADAS domains | Participant selection | Only low risk of bias | 5 | 0.86 (0.83 to 0.88) | 0.39 (0.31 to 0.47) | 4 | 0.61 (0.54 to 0.69) | 0.97 (0.92 to 0.99) |
| Only low applicability concern | 11 | 0.91 (0.83 to 0.96) | 0.36 (0.28 to 0.46) | 7 | 0.69 (0.60 to 0.77) | 0.97 (0.94 to 0.98) | ||
| Index test | Only low risk of bias | 12 | 0.91 (0.83 to 0.95) | 0.37 (0.29 to 0.46) | 8 | 0.72 (0.60 to 0.82) | 0.96 (0.94 to 0.98) | |
| Only low applicability concern | 9 | 0.90 (0.85 to 0.94) | 0.37 (0.31 to 0.43) | 6 | 0.68 (0.59 to 0.77) | 0.97 (0.94 to 0.99) | ||
| Reference standard | Only low risk of bias | 4 | 0.93 (0.82 to 0.98) | 0.34 (0.24 to 0.45) | 2 | ID | ID | |
| Only low applicability concern | 12 | 0.91 (0.83 to 0.95) | 0.37 (0.29 to 0.46) | 8 | 0.72 (0.60 to 0.82) | 0.96 (0.94 to 0.98) | ||
| Flow and timing | Only low risk of bias | 11 | 0.91 (0.83 to 0.96) | 0.36 (0.28 to 0.46) | 8 | 0.72 (0.60 to 0.82) | 0.96 (0.94 to 0.98) | |
| Additional analyses | MRI positivity threshold | Only threshold 3/5 | 10 | 0.89 (0.82 to 0.94) | 0.39 (0.32 to 0.47) | 6 | 0.68 (0.59 to 0.77) | 0.97 (0.94 to 0.98) |
| MRI positivity threshold effect | MRI positivity threshold 3/5 (only studies with also 4/5) | 5 | 0.87 (0.73 to 0.94) | 0.45 (0.33 to 0.57) | 0 | ID | ID | |
| MRI positivity threshold 4/5 (only studies with also 3/5) | 5 | 0.72 (0.52 to 0.86) | 0.78 (0.68 to 0.86) | 0 | ID | ID | ||
| MRI vs MRI‐pathway | Only MRI and MRI‐pathway in the same men (paired data) | 8 | 0.92 (0.83 to 0.96) | 0.35 (0.27 to 0.44) | 8 | 0.72 (0.60 to 0.82) | 0.96 (0.94 to 0.98) | |
| Reference standard | Only TTMB, TSB or TOP | 9 | 0.90 (0.84 to 0.93) | 0.36 (0.29 to 0.44) | 6 | 0.69 (0.58 to 0.78) | 0.96 (0.93 to 0.97) | |
| Template‐guided biopsy + MRI‐TBx (composite reference standard) | 11 | 0.94 (0.91 to 0.96) | 1.00 (1.00 to 1.00) | 8 | 0.72 (0.63 to 0.80) | 1.00 (1.00 to 1.00) | ||
| Experience of radiologist | Only high experience | 10 | 0.91 (0.85 to 0.95) | 0.34 (0.27 to 0.42) | 7 | 0.69 (0.60 to 0.77) | 0.97 (0.94 to 0.98) | |
| CI: confidence interval; G: International Society of Urological Pathology grade; ID: inadequate data; MRI: magnetic resonance imaging; MRI‐pathway: magnetic resonance imaging with or without magnetic resonance imaging‐targeted biopsy; MRI‐TBx: magnetic resonance imaging‐targeted biopsy; N: number; NA: not applicable; QUADAS: Quality Assessment of Diagnostic Accuracy Studies; SBx: systematic biopsy; TOP: transperineal optimised prostate biopsy;TSB: Ginsburg transperineal saturation biopsy; TTMB: transperineal template mapping biopsy | ||||||||
aThe diagnostic test accuracy analyses of magnetic resonance imaging‐targeted biopsy are based on the same studies as the MRI‐pathway.
To further assess the reliability of our results, we performed additional sensitivity analyses. In particular, excluding studies with MRI‐positivity thresholds other than threshold 3/5 did not substantially change the accuracy results of all MRI‐involved tests. Furthermore, the accuracy of MRI and the MRI pathway did not substantially change when assessed only in studies that had performed both tests in the same men (paired data), indicating no selection bias in the analysis comparing MRI with the MRI pathway (Figure 14). Similarly, the accuracy of MRI did not substantially change when assessed only in studies that had investigated multiple MRI‐positivity thresholds in the same men (paired data), indicating no selection bias in the MRI‐positivity threshold effect analyses (Figure 16). Regarding our choice of reference standard, excluding studies with an in‐house TSB or a transrectal TSB (potentially less accurate techniques than TTMB, with biopsies at every 5 mm) did not substantially change the accuracy of MRI and the MRI pathway. In addition, using a composite reference standard (template‐guided biopsy + MRI‐targeted biopsy), thus regarding the additional prostate cancer detected by MRI‐targeted biopsy as ‘true’ positives instead of ‘false’ positives, did not substantially change the accuracy of MRI, MRI‐targeted biopsy and the MRI pathway. Excluding studies in which the radiologist had little or unclear experience did not change the accuracy results of MRI, MRI‐targeted biopsy and the MRI pathway.
Agreement analyses
Excluding studies with a high or unclear risk of bias or applicability concern in three of the four QUADAS‐2 domains (participant selection, index test (MRI pathway), flow & timing) did not substantially change the detection ratio between the MRI pathway and systematic biopsy (Table 14). Excluding studies with a high or unclear risk of bias and applicability concern in the index test (systematic biopsy) domain, however, did result in an equal detection rate of both index tests instead of a higher detection rate of the MRI pathway. Furthermore, excluding studies with MRI‐positivity thresholds other than threshold 3/5 did not substantially change the detection ratio between the MRI pathway and systematic biopsy. The difference in the detection ratios between population types did not notably change when we analysed only studies that compared biopsy‐naïve and prior‐negative biopsy men in the same study. Excluding studies in which the radiologist had little or unclear experience did not change the detection ratio between the MRI pathway and systematic biopsy.
| Sensitivity analyses of the agreement between the MRI‐pathway vs systematic biopsy for detecting G ≥ 2 prostate cancer | ||||
| Covariate | Category | N | Detection ratio | |
| Main analyses (as reference) | Mixed population | 25 | 1.12 (1.02 to 1.23) | |
| QUADAS domains | Patient selection | Only low risk of bias | 12 | 1.08 (1.00 to 1.17) |
| Only low applicability concern | 23 | 1.09 (1.01 to 1.17) | ||
| Index test (MRI‐pathway) | Only low risk of bias | 24 | 1.11 (1.02 to 1.22) | |
| Only low applicability concern | 14 | 1.13 (1.01 to 1.26) | ||
| Index test (SBx) | Only low risk of bias | 10 | 1.04 (0.94 to 1.15) | |
| Only low applicability concern | 20 | 1.07 (0.99 to 1.15) | ||
| Flow and timing | Only low risk of bias | 17 | 1.10 (1.00 to 1.22) | |
| Additional analyses | MRI positivity threshold | Only threshold 3/5 | 15 | 1.14 (1.03 to 1.26) |
| Population | Biopsy‐naïve (only studies with also prior‐negative biopsy men) | 6 | 0.98 (0.76 to 1.28)b | |
| Prior‐negative biopsy (only studies with also biopsy‐naïve men) | 6 | 1.42 (1.03 to 1.95)b | ||
| Experience of radiologist | Only high experience | 21 | 1.13 (1.03 to 1.24) | |
| CI: confidence interval; G: International Society of Urological Pathology grade; MRI‐pathway: magnetic resonance imaging (MRI) with or without MRI‐targeted biopsy; N: number; QUADAS: Quality Assessment of Diagnostic Accuracy Studies; SBx: systematic biopsy | ||||
aDetection ratio is the detection rate of the MRI‐pathway divided by detection rate of systematic biopsy; the detection rate is the pooled number of positive results of the test divided by the pooled total number of positive results from both tests.
bThe reference detection ratio for these categories are 1.05 (95% CI 0.95 to 1.16) for the biopsy‐naïve men and 1.44 (95% CI 1.19 to 1.75) for the prior‐negative biopsy men (Table 9).
Discussion
Summary of main results
This systematic review presents the test accuracy of the MRI, MRI‐targeted biopsy, the MRI pathway (MRI with or without MRI‐targeted biopsy) and the current standard testing with systematic biopsies in prostate cancer diagnosis, using template‐guided biopsy sampling of the whole prostate as the reference standard (Figure 1). Although the results of the MRI pathway represent the complete MRI‐informed clinical pathway, the diagnostic test accuracy results of the MRI and MRI‐targeted biopsy inform us on each diagnostic step in between (Figure 9). The MRI test alone indicates the presence of disease without MRI‐targeted biopsy results. The MRI‐targeted biopsy refers to only MRI‐positive men with targeted biopsy results.
We carried out two types of analyses:
-
test accuracy analyses of four index tests in prostate cancer diagnosis, providing evidence to determine their discriminative value in current clinical practice; and
-
agreement analyses for detecting prostate cancer between two index tests (the MRI pathway and the current practice of systematic biopsy), providing additional evidence for biopsy decision making.
Quantity and quality of evidence
A considerable number of studies in both the diagnostic accuracy (n = 9/18) and agreement analyses (n = 13/25) had a high or unclear risk of bias or applicability concern in one of the QUADAS‐2 domains. These issues, in addition to concerns over inconsistency and imprecision, prompted us to downgrade the certainty of evidence to low for all four main comparisons and outcomes. Overall, we acknowledge concerns about the independent performance and applicability of tests in both test accuracy and agreement analyses, for which we performed sensitivity analyses to exclude studies with such quality concerns. Furthermore, a considerable amount of heterogeneity was present in both diagnostic accuracy and agreement analyses, but only limited exploration was possible due to the paucity of studies in each subgroup. Only population type (biopsy‐naïve versus prior‐negative biopsy men) and the usage of an endorectal coil (‘yes ’ versus ‘no ’) may have explained some of the heterogeneity in the agreement analyses.
Test accuracy analysis of MRI, MRI‐targeted biopsy, MRI pathway and systematic biopsy, verified by the reference standard, template‐guided biopsy
The MRI missed the identification of 9% of men with grade 2 or higher prostate cancer (pooled sensitivity 0.91, 95% CI 0.83 to 0.95; specificity 0.37, 95% CI 0.29 to 0.46; summary of findings Table 3); MRI‐targeted biopsy in MRI‐positive men missed the diagnosis in 20% of men with grade 2 or higher prostate cancer (pooled sensitivity of 0.80, 95% CI 0.69 to 0.87; specificity 0.94, 95% CI 0.90 to 0.97; summary of findings Table 4); whereas the MRI pathway (in both MRI‐positive and MRI‐negative men) missed the diagnosis in 28% (pooled sensitivity 0.72, 95% CI 0.60 to 0.82; specificity 0.96, 95% CI 0.94 to 0.98; summary of findings Table 5). Systematic biopsy missed 37% of men with grade 2 or higher prostate cancer (pooled sensitivity 0.63, 95% CI 0.19 to 0.93; specificity 1.00, 95% CI 0.91 to 1.00; summary of findings Table 6). Hence, systematic biopsy had a substantially lower sensitivity than the MRI pathway (P = 0.06; Figure 15; summary of findings Table 1).
The MRI pathway beneficially avoided the detection of 66% of grade 1 prostate cancer (pooled sensitivity 0.34, 95% CI 0.19 to 0.53) and reduced 29% of biopsies all in MRI‐negative men (pooled percentage negative MRI 29%, 95% CI 24% to 35%; summary of findings Table 2). In contrast, the systematic biopsy approach avoided 45% of grade 1 prostate cancer (pooled sensitivity 0.55, 95% CI 0.25 to 0.83) and a biopsy procedure was performed in all men (100%).
Agreement analyses between the MRI pathway and systematic biopsy
The MRI pathway significantly outperformed systematic biopsy by detecting 12% more grade 2 or higher prostate cancer (pooled detection ratio 1.12, 95% CI 1.02 to 1.23), irrespective of population type (summary of findings Table 1). This percentage increased in men with prior negative biopsies to 44% (pooled detection ratio 1.44, 95% CI 1.19 to 1.75) but decreased in biopsy‐naïve men to 5% (pooled detection ratio 1.05, 95% CI 0.95 to 1.16). We observed similar outcomes for the detection of grade 3 or higher prostate cancer.
The MRI pathway beneficially detected less grade 1 prostate cancer than systematic biopsy, with a reduction of 37% in biopsy‐naïve men (pooled detection ratio 0.63, 95% CI 0.54 to 0.74) and 38% in men with prior negative biopsy (pooled detection ratio 0.62, 95% CI 0.44 to 0.88; summary of findings Table 2). The MRI pathway beneficially reduced a third of biopsies, all in MRI‐negative men (pooled percentage negative MRI 33%, 95% CI 26% to 41%; and 30%, 95% CI 19% to 44%; in biopsy‐naïve and prior‐negative biopsy men, respectively).
Strengths and weaknesses of the review
Strengths and weaknesses of included studies.
Strengths included that the test accuracy studies investigated one or more index tests verified by template‐guided biopsy in the same men, comprehensively sampling all zones of the prostate with a minimum of 20 biopsy cores (reference standard). The studies in the agreement analysis investigated the MRI pathway and systematic biopsy in the same men. We included only studies involving MRI for both test accuracy and agreement analyses that investigated men with positive and negative MRIs. These criteria ensured that we avoided a number of biases and inaccurate findings, as stated in the Rationale. This systematic review contains many large studies, including the appraised PROMIS study (Ahmed 2017) and others (Distler 2017; Hansen 2016a; Hansen 2017; Kesch 2017; Mortezavi 2018) that showed results very consistent with the pooled accuracy estimates from our meta‐analyses. We have summarised the limitations of the included studies with reference to each of the four, quality domains, as assessed by our QUADAS‐2 tool:
-
Participant selection: In both test accuracy and agreement analyses, multiple studies showed an unclear or high risk of bias in this domain. Retrospective and nonconsecutive inclusion of participants might have led to manipulation of data.
-
Index tests: In the test accuracy studies, we identified almost no high or unclear risk of bias in the performance of index tests. In the agreement analysis, however, multiple studies did not perform the MRI pathway and systematic biopsy blinded from each other. This could possibly have led to MRI‐informed systematic biopsy in some studies, with (sub‐)conscious over‐ or underperformance of systematic biopsies.
-
Reference test: Similar concerns exist for the reference standard in the diagnostic accuracy analyses, because multiple studies showed an unclear or high risk of bias regarding the independent performance of template‐guided biopsies or appropriate sampling of the whole prostate. Both factors possibly led to (sub‐)conscious under‐ or overestimation of index test accuracy in some studies. Because template‐guided biopsy is performed mostly in the context of scientific research and is not performerd regularly in most clinical practices, the possibility of selection bias should be taken into consideration. However, investigators responsible for the largest test accuracy studies included in this review do perform template‐guided biopsy in regular practice.
-
Flow and timing: Only a limited number of studies showed a high or unclear risk of bias, indicating that most studies performed the tests in a similar manner in all participants and did not exclude any participants for reasons that could cause bias.
Despite the risks of biases as described in the above domains, the sensitivity analyses, which excluded studies with a high or unclear risk of bias, demonstrated the robustness of the main results (Table 13; Table 14).
Strengths and weaknesses of the review process
Quality assessment and data extraction
We selected the included studies from the available literature using a very sensitive method, without restrictions, and two review authors independently extracted data, according to the Cochrane DTA principles (Higgins 2011). We successfully requested additional data from study authors to enable accurate extraction of two‐by‐two contingency tables, which otherwise we would have had to exclude from this review. Similarly, in order to minimise heterogeneity, extensive effort was undertaken to retrieve data for the target condition solely based on Gleason Score grading. Regardless, we had to exclude several eligible studies due to insufficient reported data. Limited reporting of methodological details resulted in multiple ‘unclear’ assessments of methodological quality items and limited heterogeneity explorations.
Review analyses
The use of template‐guided biopsy to verify the index tests ensured that the absence or presence of the disease was accurately investigated in the whole population referred for biopsy. This approach excluded all the inherent biases of other reference standards (i.e. systematic biopsies and radical prostatectomies) used in previous systematic reviews. However, it should be noted that template‐guided biopsy is not a perfect test, as its diagnostic accuracy is dependent on the intensity and trajectory of cores taken. This is reflected by the pooled specificity of MRI‐targeted biopsy (0.94, 95% CI 0.90 to 0.97), which indicates that MRI‐targeted biopsy detected 6% grade 2 or higher prostate cancer in addition to those detected by the reference standard. These ‘false’ positives, however, would likely be regarded as ‘true’ positives in clinical practice. Because the results of both tests are based on the same histopathological diagnosis, either positive result will be considered in subsequent decision making. Sensitivity analyses with a composite reference standard (template‐guided biopsy + MRI‐targeted biopsy), thus regarding these ‘false’ positives as ‘true’ positives, however, showed no substantial difference in the accuracy of MRI and the MRI pathway. Nevertheless, underestimation of the specificity and PPV of both MRI‐targeted biopsy and MRI pathway should be considered accordingly. Furthermore, the inherent chance of up‐ or downgrading of prostate cancer of any biopsy result following radical prostatectomy should be taken into account (Epstein 2012).
It should also be taken into consideration that the results are based on per‐participant analyses and not on per‐lesion analyses. Therefore, spatial concordance between (multiple) MRI findings and biopsy findings are not taken into account. For example, when a suspicious MRI lesion is identified in the right apex, while cancer is detected by template‐guided biopsy in the left apex, the MRI is regarded as a true positive in the per‐participant analyses; in reality, however, the MRI reading is a false positive in the right apex and false negative in the left apex. The underlying cause could be both interpretative problems with MRI, such as original misreading or truly invisible tumours (Borofsky 2018; Rosenkrantz 2017; Schouten 2017), and inaccurate MRI‐targeted biopsy, due to technical or mechanical flaws or intralesional heterogeneity (Cash 2016; Coker 2018; Gold 2019). As a consequence, the sensitivity of the MRI might be overestimated. Unfortunately, no data were available to assess the individual contributions of these factors in this review.
We analysed the test accuracy of MRI, MRI‐targeted biopsy and MRI pathway separately to provide insight into the accuracy of different steps in the MRI‐informed clinical pathway. MRI‐targeted biopsy is only performed in MRI‐positive men, and therefore its results disregard men with false‐negative MRIs. Caution must be taken when applying the results of only MRI or MRI‐targeted biopsy to the clinical practice in which the MRI pathway applies, as suggested in previous studies and reviews (De Rooij 2014a; Futterer 2015; Gayet 2016; Hamoen 2015; Moore 2013b; Schoots 2015; Valerio 2015;Van Hove 2014). The diagnostic accuracy analyses of the MRI pathway in this review overcome the above‐discussed difficulties of MRI and MRI‐targeted biopsy by presenting histological findings of the whole population.
In addition to the assessment of test accuracy, this review also analysed the agreement of prostate cancer detection between the MRI pathway and systematic biopsy in studies that performed both tests in the same men. Agreement evidence focuses on the number of target conditions identified (concordance and discordance of test results) because neither test is a valid reference test. Consequently, agreement analysis does not provide diagnostic accuracy measures like sensitivity and specificity but rather a detection ratio that indicates which test detects more of the target condition. These analyses enabled us to provide evidence in clinical scenarios in addition to evidence from test accuracy data.
Despite strict inclusion criteria, we still included a relatively large number of studies in the test accuracy analyses of MRI (n = 15), MRI‐targeted biopsy (n = 8) and the MRI pathway (n = 8)—and an even larger number of studies in the agreement analyses between the MRI pathway and systematic biopsy (n = 25) —resulting in reliable analyses regarding the primary objectives. However, a relatively limited number of studies was available to assess the diagnostic accuracy of systematic biopsy (n = 4), with the consequence that the pooled sensitivity estimate of systematic biopsy was imprecise. The small number of studies per covariate precluded us form performing subgroup analyses for test accuracy analyses. Similarly, a relatively limited number of agreement studies resulted in large 95% confidence intervals around some of the pooled detection ratio estimates in the subgroup analyses.
Regarding the heterogeneity exploration in the agreement analyses, only population type (prior‐negative biopsy versus biopsy‐naïve men) and endorectal coil use (‘yes’ versus ‘no’) were statistically significant factors that may have explained some of the heterogeneity. A sensitivity analysis suggested population type to be a significant factor. However, we were not able to rule out the possibility that the statistically significant difference between studies with and without the use of an endorectal coil is caused by dependence on other factors, such as period of investigation (most prior to 2015) or risk of bias and applicability concerns in the performance of the tests. Furthermore, heterogeneity exploration suggested that MRI pulse sequences (mpMRI versus bpMRI) or MRI‐targeted biopsy techniques (software versus cognitive) were not significant sources of heterogeneity. Although we could not perform any reliable heterogeneity exploration in the test accuracy analyses, it should be considered that the test accuracy estimates were based on studies with (a mix of) different population types and methods of index tests.
Furthermore, we evaluated several test accuracy measures to inform both policymakers and clinical physicians. These measures are related to two categories:
-
differentiation between men with and without clinically significant prostate cancer (discrimination); and
-
estimation of the post‐test probability of clinically significant prostate cancer (prediction).
While discrimination purposes are mainly of concern in health‐policy decisions, predictive measures are most useful in daily practice for predicting the probability of clinically significant prostate cancer in a man suspected of having prostate cancer, once the test result is known.
Within‐ and between‐study comparisons
We compared the test accuracy of MRI and the MRI pathway with a mix of within‐ and between‐study evidence. We confirmed the findings in sensitivity analyses with only within‐study data; however, we could only compare test accuracy between the MRI pathway and systematic biopsy with between‐study data. Although the agreement analyses between MRI pathway and systematic biopsy do not provide diagnostic test accuracy estimates, we investigated it only in within‐study data, in which individual studies performed both tests in the same population.
Diagnostic test accuracy analysis versus agreement analysis
In the test accuracy analysis in a mixed population, the pooled sensitivity for detecting grade 2 or higher prostate cancer was 0.72 (95% CI 0.60 to 0.82) for the MRI pathway and 0.63 (95% CI 0.19 to 0.93) for systematic biopsy—substantially in favour of the MRI pathway (P = 0.06). Similarly, in the agreement analysis between MRI pathway and systematic biopsy in the mixed population, the pooled detection ratio for detecting grade 2 or higher prostate cancer was 1.12 (95% CI 1.02 to 1.23; P = 0.01), statistically significantly in favour of the MRI pathway. Furthermore, the results of both analyses regarding grade 1 prostate cancer show that the MRI pathway beneficially detected less than systematic biopsy. Therefore, the results and conclusions from the test accuracy analysis and agreement analysis are consistent, despite the numerous differences between the two types of analyses.
Comparison with previous research
Previously published reviews on test accuracy of the MRI pathway or the prebiopsy MRI approach have been based on study designs that did not accurately capture target conditions and index or reference test definitions, leading to a number of biases and inaccurate findings, as described in the Rationale (De Rooij 2014a; Futterer 2015; Gayet 2016; Hamoen 2015; Moore 2013b; Schoots 2015; Valerio 2015; Van Hove 2014; Wegelin 2017; Woo 2018). These reviews included studies that reported only on men with a positive MRI, thereby disregarding men with a negative MRI, inevitably leading to inaccurate true‐negative and false‐negative values for the MRI pathway. In addition, they used systematic biopsy or radical whole‐mount surgical specimens as reference standards.
Distinguishing between biopsy‐naïve men and men with prior‐negative biopsy is paramount in daily practice. Several international prostate cancer guidelines recently started to recommend prebiopsy MRI in prior‐negative biopsy men, based on a beneficial prostate cancer detection by the MRI pathway over systematic biopsy (EAU Guideline 2018, NCCN Guideline 2018). However, international guidelines have not made any such recommendations in biopsy‐naïve men. High‐level evidence of prostate cancer detection by the MRI pathway as compared to systematic biopsy in biopsy‐naïve men has been scarce. Single‐centre, randomised controlled trials provided contradictory findings as to whether or not the MRI pathway has a higher detection rate for clinically significant prostate cancer compared to systematic biopsy (Baco 2016; Panebianco 2015; Tonttilla 2016).
Two multicentre randomised controlled trials (Kasivisvanathan 2018; Porpiglia 2017) investigated the MRI pathway and systematic biopsy in biopsy‐naïve men. Furthermore, two high‐quality prospective multicentre cohort studies (Rouvière 2019a; Van der Leest 2018) investigated the agreement of prostate cancer detection between the MRI pathway and systematic biopsy. We did not include the randomised controlled trials in this review, as they did not meet the inclusion criteria of performing the index tests and/or reference standard in the same men. Both randomised controlled trials showed that the MRI pathway detected significantly more grade 2 or higher prostate cancer than systematic biopsy, in contrast to the results from the agreement analyses in this review, including the two cohort studies. The data can be compared as follows:
-
Kasivisvanathan 2018: The MRI pathway avoided 28% of biopsy procedures. The MRI pathway detected 37.7% (95% CI 31.7% to 43.7%; 95/252) men with grade 2 or higher prostate cancer versus 25.8% (95% CI 20.4% to 31.3%; 64/248) by systematic biopsy. The MRI pathway detected 9.1% (95% CI 5.6% to 12.7%; 23/252) men with grade 1 prostate cancer versus 22.2% (95% CI 17.0% to 27.3%; 55/248) by systematic biopsy. The MRI pathway detected significantly more men with grade 2 or higher prostate cancer (absolute difference 11.9%, 95% CI 3.8% to 20.0%) and beneficially reduced the detection of grade 1 prostate cancer (absolute difference 13.1%, 95% CI 6.8% to 19.3%).
-
Porpiglia 2017: The MRI pathway avoided 24% of biopsy procedures. The MRI pathway detected 41.1% (95% CI 31.8% to 50.4%; 44/107) men with grade 2 or higher prostate cancer versus 13.3% (95% CI 6.8% to 19.8%; 14/105) by systematic biopsy. The MRI pathway detected 4.7% (95% CI 0.7% to 8.7%; 5/107) men with grade 1 prostate cancer versus 16.2% (95% CI 9.1% to 23.2%; 17/105) by systematic biopsy. The MRI pathway detected significantly more men with grade 2 or higher prostate cancer (absolute difference 27.8%, 95% CI 16.4% to 39.2%) and beneficially reduced the detection of grade 1 prostate cancer (absolute difference 11.5%, 95% CI 3.4% to 19.6%).
-
Rouvière 2019a: The total proportion of detected men with grade 2 or higher prostate cancer was 37.5% (95% CI 31.4% to 43.8%; 94/251). The MRI pathway could have avoided 17.9% (45/251) of biopsy procedures. The MRI pathway detected 32.3% (95% CI 26.5% to 38.1%; 81/251) men with grade 2 or higher prostate cancer versus 29.9% (95% CI 24.2% to 35.5%; 75/251) by systematic biopsy. The MRI pathway detected 9.2% (95% CI 5.6 to 12.7%; 23/251) men with grade 1 versus 22.3% (95% CI 17.2% to 27.5%; 56/251) by systematic biopsy. The MRI pathway detected an equivalent proportion of grade 2 or higher prostate cancer (absolute difference 2.4%, 95% CI −5.7% to 10.5%) and beneficially reduced the detection of grade 1 prostate cancer (absolute difference 13.1%, 95% CI 6.9% to 19.4%).
-
Van der Leest 2018: The total proportion of detected men with grade 2 or higher prostate cancer was 32.0% (95% CI 28% to 36%; 200/626). The MRI pathway could have avoided 49.4% of biopsy procedures. The MRI pathway detected 25.4% (95% CI 22% to 29%; 159/626) men with grade 2 or higher prostate cancer versus 23.3% (95% CI 20% to 27%; 146/626) by systematic biopsy. The MRI pathway detected 14.1% (95% CI 11% to 17%; 88/626) men with grade 1 versus 24.8% (95% CI 21% to 28%; 155/626) by systematic biopsy. The MRI pathway detected an equivalent proportion of men with grade 2 or higher prostate cancer (absolute difference 2.1%, 95% CI to 2.7% to 6.8%) and beneficially reduced the detection of grade 1 prostate cancer (absolute difference 10.7%, 95% CI 6.4% to 15.0%).
-
This Cochrane review, Drost 2019: The total proportion of detected grade 2 or higher prostate cancer in biopsy‐naïve men was 27.7% (95% CI 23.7% to 32.6%; Table 9). The MRI pathway could have avoided 33% of biopsy procedures. The MRI pathway detected 23.4% (95% CI 19.3% to 28.1%) men with grade 2 or higher prostate cancer versus 21.4% (95% CI 17.2% to 26.5%) by systematic biopsy. The MRI pathway detected 13.5% (95% CI 10.7% to 17.2%) men with grade 1 versus 22.4% (95% CI 19.1% to 26.3%) by systematic biopsy. The MRI pathway detected an equivalent proportion of men with grade 2 or higher prostate cancer (absolute difference 2.0%, 95% CI 1.1% to 4.6%) and beneficially reduced the detection of grade 1 prostate cancer (absolute difference 8.2%, 95% CI 6.0% to 10.3%).
The most remarkable differences are the following:
-
In this Cochrane review, the proportion of negative MRIs was 33% (95% CI 26 to 41%), with similar rates in both the randomised controlled trials, while it was 49.4% in the cohort study Van der Leest 2018. This study classified only 6.4% of MRIs as PI‐RADS assessment score 3. Although in this Cochrane review most included studies used experienced radiologists, obviously a dedication to limit PI‐RADS assessment score 3, as strived for by Van der Leest 2018, may safely increase the proportion of negative MRIs and may avoid more biopsies.
-
In this Cochrane review, an equivalent proportion of men with grade 2 or higher prostate cancer was detected by the MRI pathway and systematic biopsy, consistent with the two agreement studies of Van der Leest 2018 and Rouvière 2019a. In contrast, the MRI pathway detected considerably more men with grade 2 or higher prostate cancer than systematic biopsy in the two randomised controlled trials: Kasivisvanathan 2018 (absolute difference 11.9%, 95% CI 3.8% to 20.0%), and Porpiglia 2017 (absolute difference 27.8%, 95% CI 16.4% to 39.2%). Hence, while the randomised controlled trials showed a superiority of the MRI pathway over systematic biopsy, the agreement studies did not. Despite these inconsistencies, none of the studies showed an inferiority of the MRI pathway over systematic biopsy in detecting grade 2 or higher prostate cancer.
-
In this Cochrane review, the proportion of men with grade 2 or higher prostate cancer detected by the MRI pathway was 23.4%, 95% CI 19.3 to 28.1%), significantly higher in the two randomised controlled trials (Kasivisvanathan 2018: 37.7%, 95% CI 31.7 to 43.7%; Porpiglia 2017: 41.1%, 95% CI 31.8 to 50.4%).
-
In this Cochrane review, the MRI pathway detected 13.5% (95% CI 10.7 to 17.2%) of men with grade 1 prostate cancer, while the MRI pathway detected 9.1% (95% CI 5.6 to 12.7%) in Kasivisvanathan 2018 and 4.7% (95% CI 0.7 to 8.7%) in Porpiglia 2017.
Explanatory reasons for these inconsistencies might be multiple. With the published information and data in this review, we could not clarify these inconsistencies. However, we may discuss some general exploratory findings within the context of this review:
The quality and methodology of the tests might influence results, as investigated by our heterogeneity analyses (Table 12). However, we could not objectify the influence of many quality and methodology covariates due to limited numbers in the subgroups and shortcomings in study focus.
Although the systematic biopsy is suggested to be a standardised test and has a systematic approach, we still observed a remarkably large variance in detection rates in the included studies. We observed a similar large variance in detection rates for the MRI pathway. Next to differences in the proportion (and severity) of detected prostate cancer, this might also suggest differences in the quality of biopsy procedures. The introduction of software registration for MRI‐targeted biopsy and the visual feedback it provides during the performance of biopsy procedures might, in fact, train operators (i.e. urologists and radiologists) to distribute systematic biopsy cores more evenly throughout the prostate according to the standardised systematic biopsy protocol. This may lead to an improved prostate cancer detection rate by systematic biopsy. Furthermore, systematic biopsy protocols in a study may outperform daily clinical practice. Another explanation for equivalent outcome could be the lack of blinding for MRI results during the performance of systematic biopsy, which may influence systematic biopsy positively. In this review, however, a sensitivity analysis with only studies with a low risk of such bias resulted in an equal detection rate of both tests. Moreover, both the cohort studies, Rouvière 2019a and Van der Leest 2018, followed strict standardised biopsy protocols for systematic biopsy and results of both index tests were blinded but they observed no significant difference in detection rates between the MRI pathway and systematic biopsy.
The number of MRI‐targeted biopsy cores may influence the outcome of the MRI pathway, owing to the fact that diagnostic accuracy depends on the intensity and trajectory of cores taken due to the potential presence of considerable tumour heterogeneity (Huo 2012; Pham 2015; Valerio 2015). Therefore, a high number of MRI‐targeted biopsy cores per suspicious lesion may benefit the diagnostic yield. In this review, the included studies showed a large variation in the number of MRI‐targeted biopsy cores per lesions or per participant (Appendix 4), and we could not perform a heterogeneity analysis. Although the biopsy protocols differed between the two randomised and two cohort studies, we could not draw any explanatory conclusions. Kasivisvanathan 2018 used a maximal four cores per target; Porpiglia 2017 used three to six cores per target; Van der Leest 2018 obtained two to four cores per target; and Rouvière 2019a obtained up to three cores.
The proportion (and severity) of detected prostate cancer within a population may influence the final outcome of the test (Rouvière 2019a). In a high‐prevalence or high‐risk (large volume clinically significant prostate cancer) population, both tests are likely to detect more grade 2 or higher prostate cancer; a high pre‐test probability will result in a high post‐test probability. Hypothetically, in a high‐risk population, systematic biopsy might more easily detect an equivalent proportion of grade 2 or higher prostate cancer compared to the MRI pathway. This may influence the added value of the MRI pathway and systematic biopsy either way. Therefore, the population at risk (either biopsy‐naïve or prior‐negative biopsy men) may influence the diagnostic yield of either test. In the agreement analysis, the proportion of detected grade 2 or higher prostate cancer was 27.7% (95% CI 23.7% to 32.6%) in biopsy‐naïve men and 22.8% (20.0 to 26.2%) in prior‐negative biopsy men. We were unable to investigate within this review whether this difference explained the difference in detection ratios between the two population groups.
Applicability of findings to the review question
Participant selection
Inclusion criteria allowed a broad spectrum of men with a suspicion of prostate cancer and an indication for prostate biopsy to be investigated, in accordance with most clinical practices. We excluded from our analyses only men with a previous diagnosis of prostate cancer.
We made a clear distinction between different types of population (biopsy naïve, prior‐negative biopsy or mixed). Importantly, in the test accuracy analysis, we could not perform a subgroup analysis between biopsy‐naïve and prior‐negative biopsy men for the MRI pathway and systematic biopsy because most studies presented data only as a mixed population, not per population type. This limits the extrapolation of the results to daily practice, in which distinguishing between both populations is critical. In the MRI pathway analysis, the number of men with prior‐negative biopsy (n = 1402) dominated the number of biopsy‐naïve men (n = 855). In contrast, in the systematic biopsy analysis, the number of biopsy‐naïve men (n = 3379) dominated the number of men with prior‐negative biopsy (n = 42). Therefore, caution is advised when extrapolating these results from a mixed population to populations of only biopsy‐naïve men or prior‐negative biopsy men. In the agreement analyses between MRI pathway and systematic biopsy, on the other hand, subgroup analysis showed a substantial difference in population type. In prior‐negative biopsy men, the pooled detection ratio for detecting grade 2 or higher prostate cancer was 1.44 (95% CI 1.19 to 1.75) in favour of the MRI pathway. However, in biopsy‐naïve men, the pooled detection ratio for detecting grade 2 or higher prostate cancer was only 1.05 (95% CI 0.95 to 1.16), not favouring one test over the other.
We included very few studies with applicability concerns regarding the indication for biopsy (e.g. prostate cancer screening studies with a very low threshold for biopsy). However, studies may have used considerably different thresholds for the indication of a biopsy.
Sensitivity and specificity are often regarded as independent of disease prevalence and results from one setting are transferred to another setting with a different prevalence of prostate cancer in the population. However, it should be acknowledged that sensitivity and specificity do depend on the spectrum of the disease (e.g. a more severe cancer is more easily recognised on MRI and diagnosed by biopsy). Furthermore, positive and negative predictive values are heavily dependent on disease prevalence and can, therefore, not be applied in settings with disease prevalence differing from that of the evaluated population (Rouvière 2018).
The prevalences and proportions of detected grade 2 or higher prostate cancer in the included studies in this review were rather high (Table 7; Table 10) compared to the setting of most clinical practices. These prevalences were based on template‐guided biopsy, and the proportions were based on the combined use of the MRI pathway and systematic biopsy. Moreover, it should be taken into account that the populations studied were mostly from referral (tertiary), high‐volume and expert centres, with the advantages of state‐of‐the‐art equipment, optimised protocols, and highly experienced subspecialised radiologists. Consequently, it is critical to consider the prevalence (and severity) of the disease and the setting of the population to be evaluated before applying the results of this review.
The issues of prostate cancer diagnosis are global, but the current analysis is highly focused on Western populations. The literature shows an incomplete picture of other populations where the advantages of MRI may not be forthcoming because of the higher prevalence of advanced cancers. Prevalence differences have been investigated in subpopulations within the same country (Rodger 2015) and between different populations and races (Feletto 2015; Kamangar 2006; Kelly 2017). These differences may influence the potential benefit of an MRI‐directed biopsy management in those populations.
Index tests
All techniques for the performance of the MRI pathway (including MRI and MRI‐targeted biopsy) were eligible, with the only criteria being the use of T2‐weighted imaging and one functional imaging technique (DWI or DCE). The included studies used 1.5 or 3 Tesla MRI magnets and cognitive‐ or software‐guided MRI‐targeted biopsy via transrectal or transperineal routes, among other variations in methodology. These variations are likely to explain some amount of heterogeneity in the results, but we could not reliably investigate them as sources of heterogeneity in the diagnostic accuracy analyses and could only partially investigate them in the agreement analyses.
Differences in MRI‐scoring system and thresholds for MRI positivity (and for MRI‐targeted biopsy) are likely to influence results. Applicability assessment showed multiple studies with alternative MRI scoring systems and lower or higher positivity thresholds than the default (defined as 3/5 or more) in both test accuracy and agreement analyses. The pooled estimates from both main analyses, however, did not change importantly after excluding studies with alternative MRI scoring systems and thresholds in the sensitivity analysis. This shows the robustness of the main pooled estimates.
For systematic biopsy in the test accuracy and agreement analyses, there were almost no concerns of applicability, as systematic biopsy was mainly performed with 8 to 12 cores directed at the peripheral zone of the prostate in all studies.
Reference standard
There were no applicability concerns regarding the reference standard (template‐guided biopsy), as the target conditions were based on histopathology findings according to the Gleason scoring system and the ISUP grade without any volume criteria. Although in clinical practice other definitions are being used, our target condition definitions enable and simplify comparison between tests and literature.

Clinical pathway flow diagram and study design
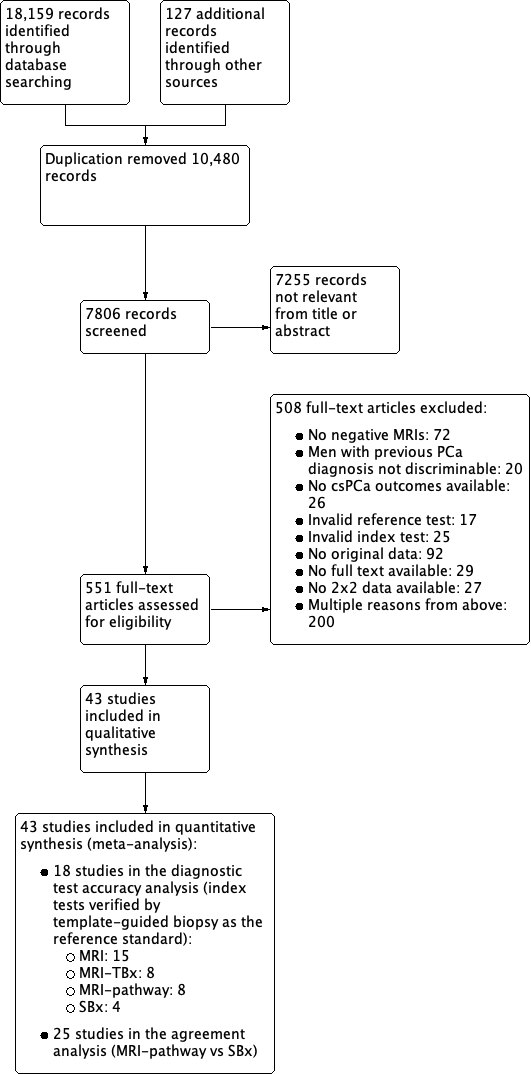
Study flow chart
csPCa: clinically significant prostate cancer; MRI: magnetic resonance imaging; MRI pathway: magnetic resonance imaging with subsequent magnetic resonance imaging‐targeted biopsy; MRI‐TBx: magnetic resonance imaging‐targeted biopsy; SBx: systematic biopsy

Diagnostic test accuracy of magnetic resonance imaging (MRI) verified by template‐guided biopsy: risk of bias and applicability concerns summary: review authors' judgements about each domain for each included study

Diagnostic test accuracy of magnetic resonance imaging‐targeted biopsy (MRI‐TBx) in MRI‐positive men: risk of bias and applicability concerns summary: review authors' judgements about each domain for each included study

Diagnostic test accuracy of the MRI pathway: risk of bias and applicability concerns summary: review authors' judgements about each domain for each included study
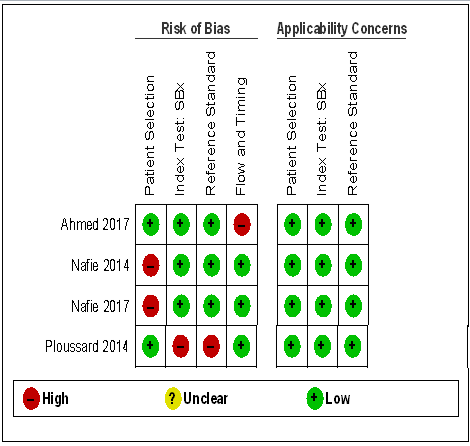
Diagnostic test accuracy of systematic biopsy (SBx): risk of bias and applicability concerns summary: review authors' judgements about each domain for each included study

Agreement analyses between the MRI pathway and systematic biopsy (SBx): risk of bias and applicability concerns summary: review authors' judgements about each domain for each included study
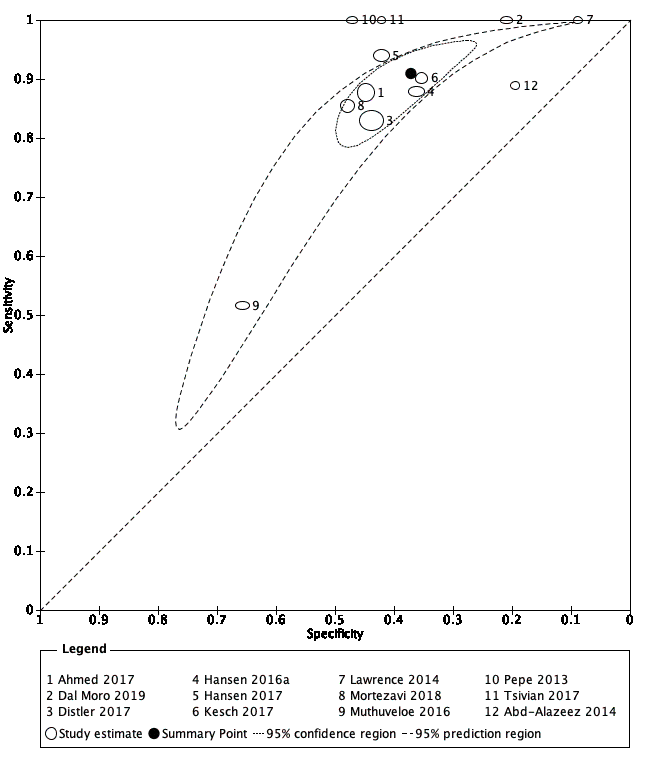
Diagnostic test accuracy of MRI for indicating grade 2 and higher prostate cancer.
Summary ROC plot of MRI verified by template‐guided biopsy. The 95% confidence region illustrates the uncertainty around the pooled summary point; the 95% prediction region illustrates the heterogeneity
MRI: magnetic resonance imaging

Diagnostic test accuracy of MRI‐targeted biopsy for detecting grade 2 and higher prostate cancer
Summary ROC plot of MRI‐targeted biopsy (in an MRI‐positive population) verified by template‐guided biopsy. The 95% confidence region illustrates the uncertainty around the pooled summary point; the 95% prediction region illustrates the heterogeneity
MRI: magnetic resonance imaging

Diagnostic test accuracy of the MRI pathway for detecting grade 2 and higher prostate cancer
Summary ROC plot of the MRI pathway verified by template‐guided biopsy. The 95% confidence region illustrates the uncertainty around the pooled summary point; the 95% prediction region illustrates the heterogeneity
MRI: magnetic resonance imaging; MRI pathway: MRI with or without MRI‐targeted biopsy

Test consequence graphic showing results that would be obtained if a hypothetical cohort of 1000 men were tested for prostate cancer using the MRI pathway.

Diagnostic test accuracy of systematic biopsy for detecting grade 2 and higher prostate cancer
Summary ROC plot of systematic biopsy verified by template‐guided biopsy

Test consequence graphic showing results that would be obtained if a hypothetical cohort of 1000 men were tested for prostate cancer using systematic biopsy.

Comparison of diagnostic test accuracy between MRI and the MRI pathway for detecting grade 2 and higher prostate cancer.
Summary ROC plot of MRI and the MRI pathway verified by template‐guided biopsy
G: International Society of Urological Pathology grade; MRI: magnetic resonance imaging; MRI pathway: MRI with or without MRI‐targeted biopsy
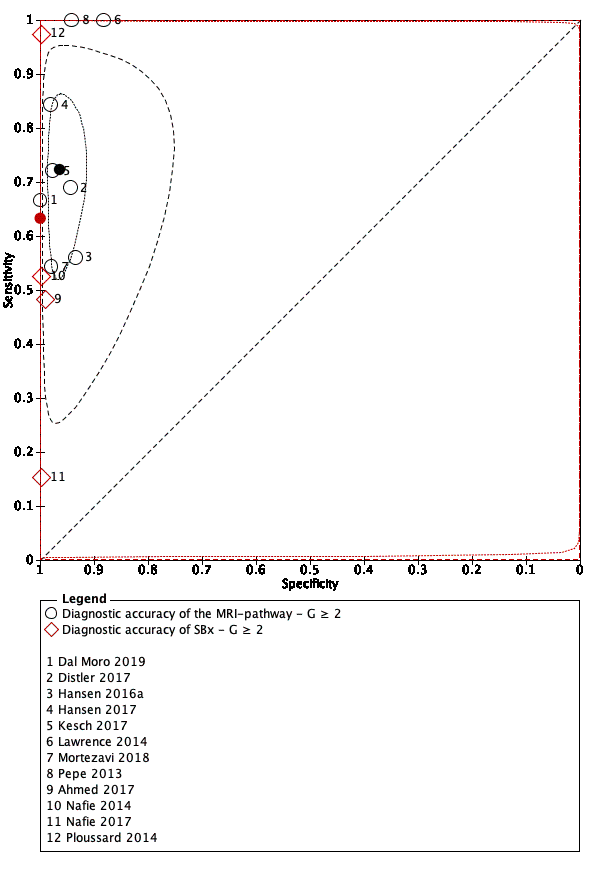
Comparison of diagnostic test accuracy between the MRI pathway and systematic biopsy for detecting grade 2 and higher prostate cancer.
Summary ROC plot of the MRI pathway versus systematic biopsy, verified by template‐guided biopsy
G: International Society of Urological Pathology grade; MRI: magnetic resonance imaging; MRI pathway: MRI with or without MRI‐targeted biopsy; SBx: systematic biopsy
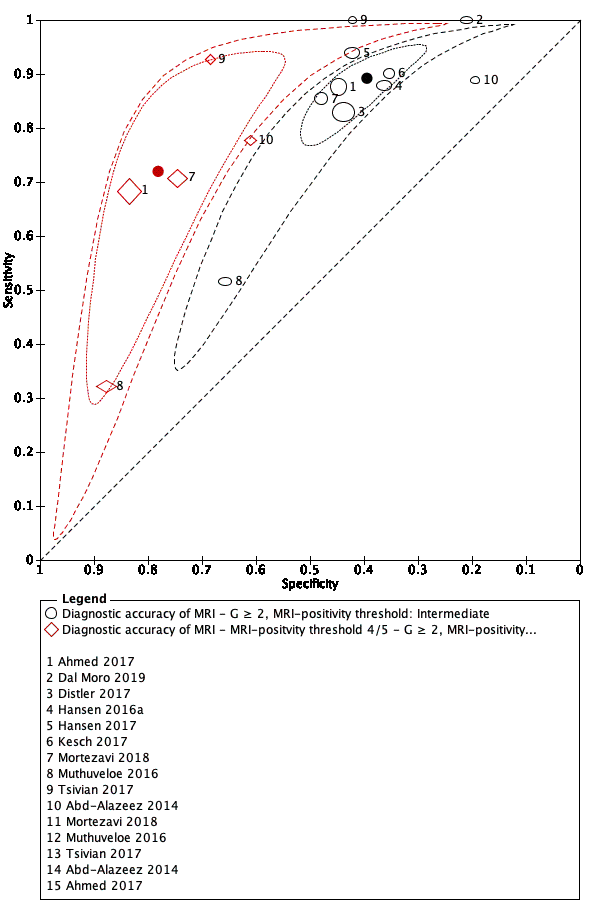
MRI‐positivity threshold effect for indicating grade 2 and higher prostate cancer.
Summary ROC plot of MRI verified by template‐guided biopsy, with different thresholds for positivity: intermediate (3/5) vs high (4/5)
G: International Society of Urological Pathology grade; MRI: magnetic resonance imaging

MRI‐positivity threshold effect for indicating grade 3 and higher prostate cancer.
Summary ROC plot of MRI verified by template‐guided biopsy, with different thresholds for positivity: intermediate (3/5) vs high (4/5)
G: International Society of Urological Pathology grade; MRI: magnetic resonance imaging

Forest plots of the agreement analysis (MRI pathway vs systematic biopsy) for detecting grade 2 and higher prostate cancer
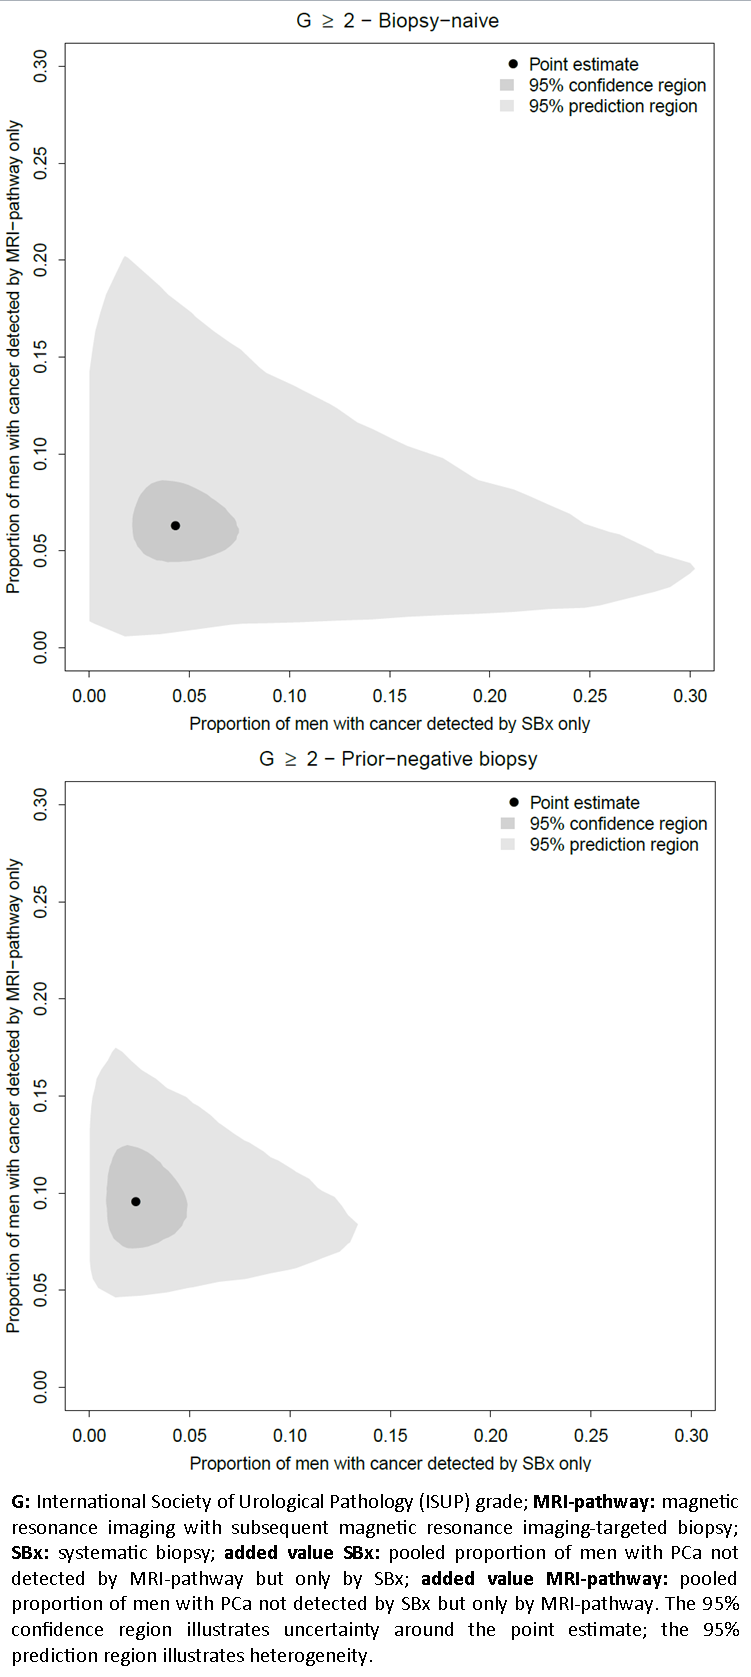
Added value of systematic biopsy plotted against the added value of the MRI pathway per population type in the agreement analysis, for detecting grade 2 and higher prostate cancer

Diagnostic accuracy of MRI ‐ G = 1.

Diagnostic accuracy of MRI ‐ G ≥ 1.

Diagnostic accuracy of MRI ‐ G ≥ 2.
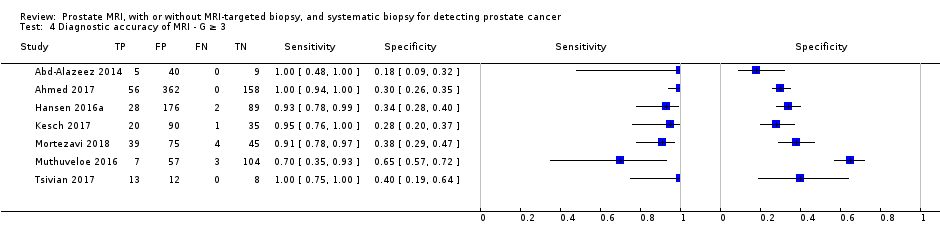
Diagnostic accuracy of MRI ‐ G ≥ 3.

Diagnostic accuracy of MRI ‐ MRI‐positvity threshold 4/5 ‐ G = 1.

Diagnostic accuracy of MRI ‐ MRI‐positvity threshold 4/5 ‐ G ≥ 1.
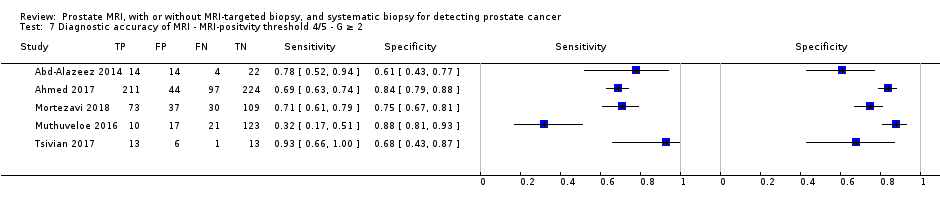
Diagnostic accuracy of MRI ‐ MRI‐positvity threshold 4/5 ‐ G ≥ 2.

Diagnostic accuracy of MRI ‐ MRI‐positvity threshold 4/5 ‐ G ≥ 3.

Diagnostic accuracy of MRI ‐ Biopsy‐naïve ‐ G ≥ 1.

Diagnostic accuracy of MRI ‐ Biopsy‐naïve ‐ G ≥ 2.

Diagnostic accuracy of MRI ‐ Biopsy‐naïve ‐ G ≥ 3.

Diagnostic accuracy of MRI ‐ Prior‐negative biopsy ‐ G ≥ 1.

Diagnostic accuracy of MRI ‐ Prior‐negative biopsy ‐ G ≥ 2.
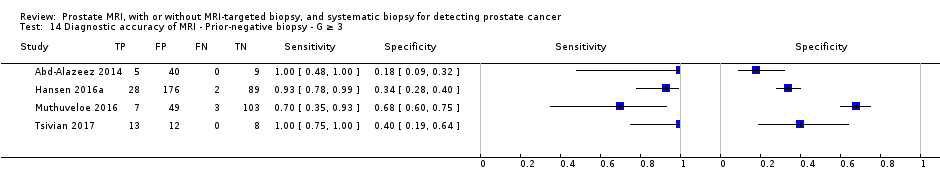
Diagnostic accuracy of MRI ‐ Prior‐negative biopsy ‐ G ≥ 3.
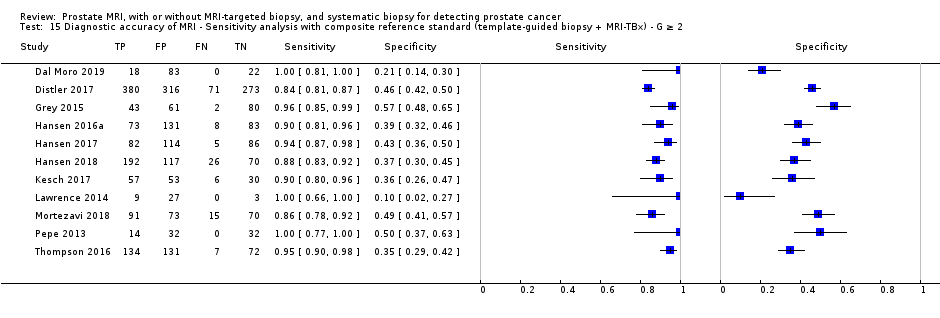
Diagnostic accuracy of MRI ‐ Sensitivity analysis with composite reference standard (template‐guided biopsy + MRI‐TBx) ‐ G ≥ 2.

Diagnostic accuracy of TBx ‐ G = 1.

Diagnostic accuracy of TBx ‐ G ≥ 1.

Diagnostic accuracy of TBx ‐ G ≥ 2.

Diagnostic accuracy of TBx ‐ G ≥ 3.

Diagnostic accuracy of the MRI‐pathway ‐ G = 1.

Diagnostic accuracy of the MRI‐pathway ‐ G ≥ 1.

Diagnostic accuracy of the MRI‐pathway ‐ G ≥ 2.

Diagnostic accuracy of the MRI‐pathway ‐ G ≥ 3.

Diagnostic accuracy of SBx ‐ G = 1.

Diagnostic accuracy of SBx ‐ G ≥ 1.

Diagnostic accuracy of SBx ‐ G ≥ 2.

Diagnostic accuracy of SBx ‐ G ≥ 3.

MRI‐pathway vs SBx ‐ G = 1.
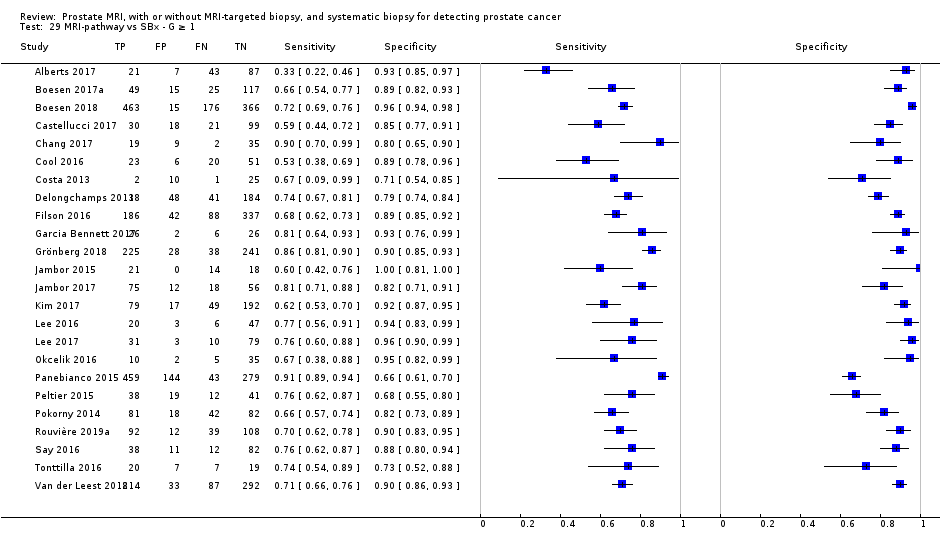
MRI‐pathway vs SBx ‐ G ≥ 1.

MRI‐pathway vs SBx ‐ G ≥ 2.

MRI‐pathway vs SBx ‐ G ≥ 3.

MRI‐pathway vs SBx ‐ Biopsy‐naïve ‐ G = 1.

MRI‐pathway vs SBx ‐ Biopsy‐naïve ‐ G ≥ 1.

MRI‐pathway vs SBx ‐ Biopsy‐naïve ‐ G ≥ 2.

MRI‐pathway vs SBx ‐ Biopsy‐naïve ‐ G ≥ 3.

MRI‐pathway vs SBx ‐ Prior‐negative biopsy ‐ G = 1.

MRI‐pathway vs SBx ‐ Prior‐negative biopsy ‐ G ≥ 1.

MRI‐pathway vs SBx ‐ Prior‐negative biopsy ‐ G ≥ 2.

MRI‐pathway vs SBx ‐ Prior‐negative biopsy ‐ G ≥ 3.

MRI‐pathway vs SBx ‐ Positive MRI ‐ G = 1.

MRI‐pathway vs SBx ‐ Positive MRI ‐ G ≥ 1.
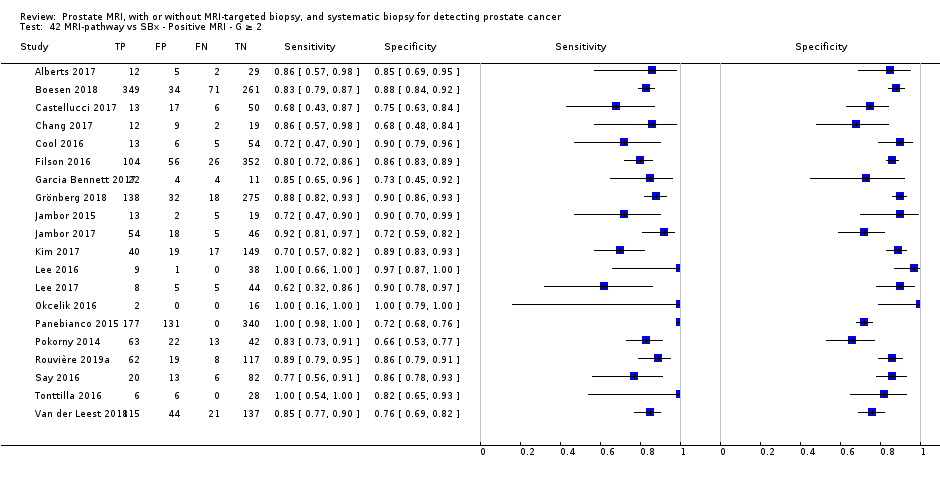
MRI‐pathway vs SBx ‐ Positive MRI ‐ G ≥ 2.
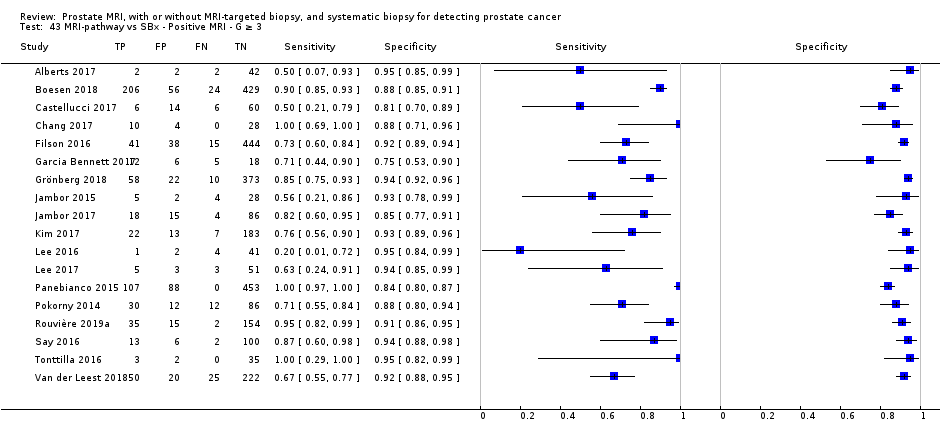
MRI‐pathway vs SBx ‐ Positive MRI ‐ G ≥ 3.

MRI‐pathway vs SBx ‐ Negative MRI ‐ G = 1.
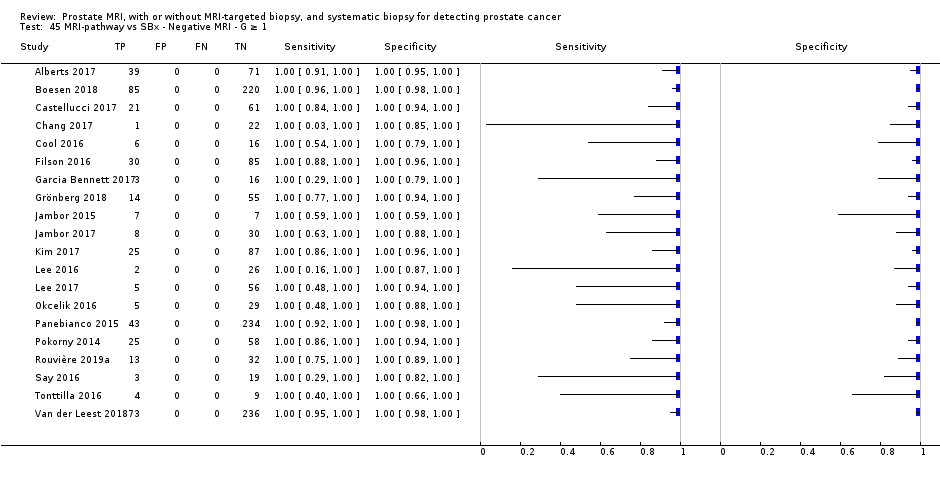
MRI‐pathway vs SBx ‐ Negative MRI ‐ G ≥ 1.
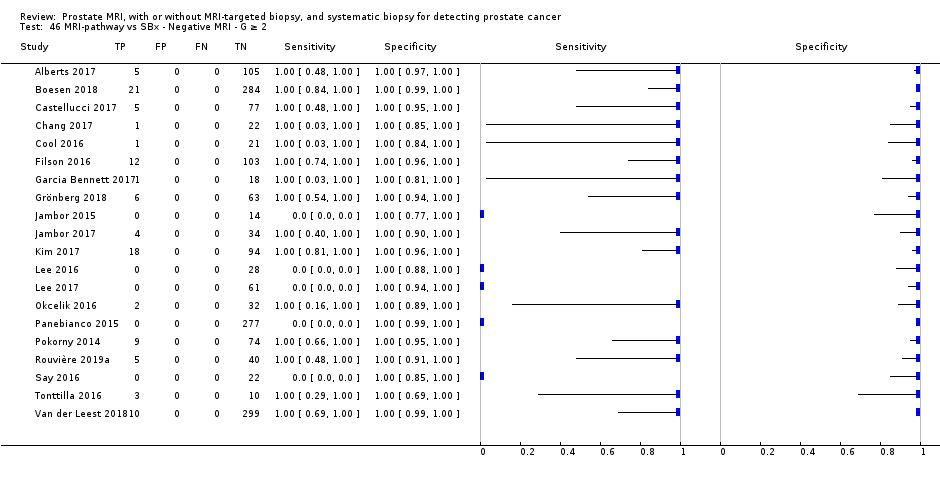
MRI‐pathway vs SBx ‐ Negative MRI ‐ G ≥ 2.

MRI‐pathway vs SBx ‐ Negative MRI ‐ G ≥ 3.

MRI‐pathway vs SBx ‐ Positive MRI ‐ Biopsy‐naïve ‐ G = 1.
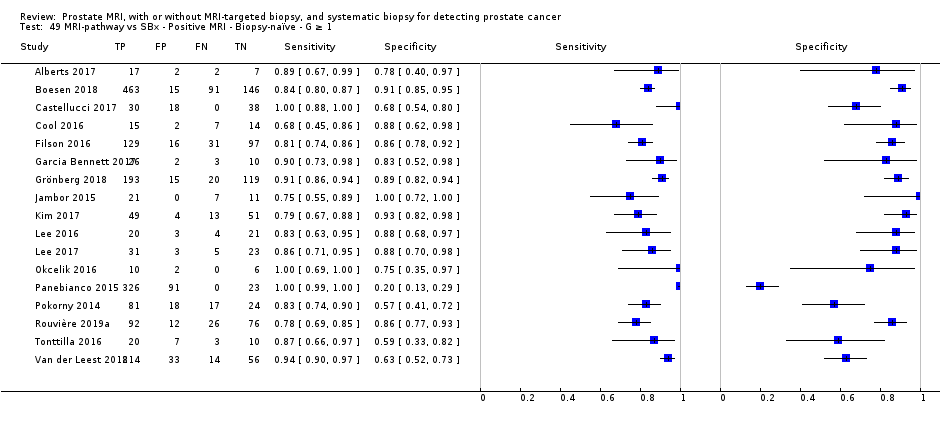
MRI‐pathway vs SBx ‐ Positive MRI ‐ Biopsy‐naïve ‐ G ≥ 1.
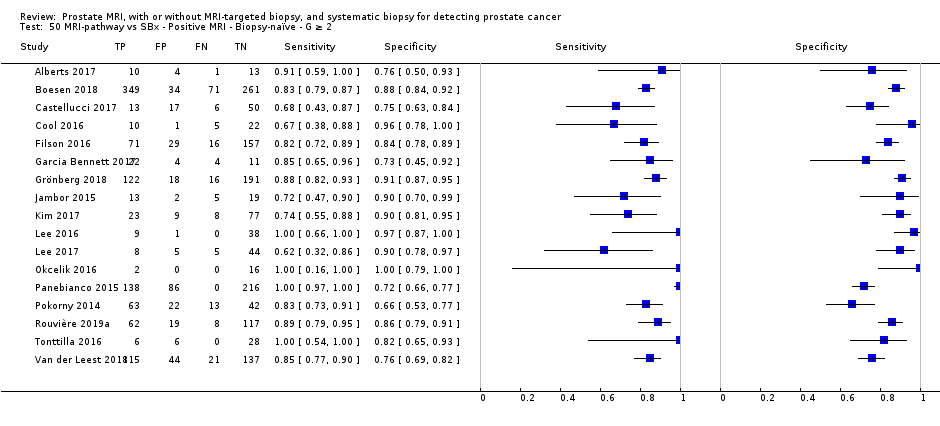
MRI‐pathway vs SBx ‐ Positive MRI ‐ Biopsy‐naïve ‐ G ≥ 2.
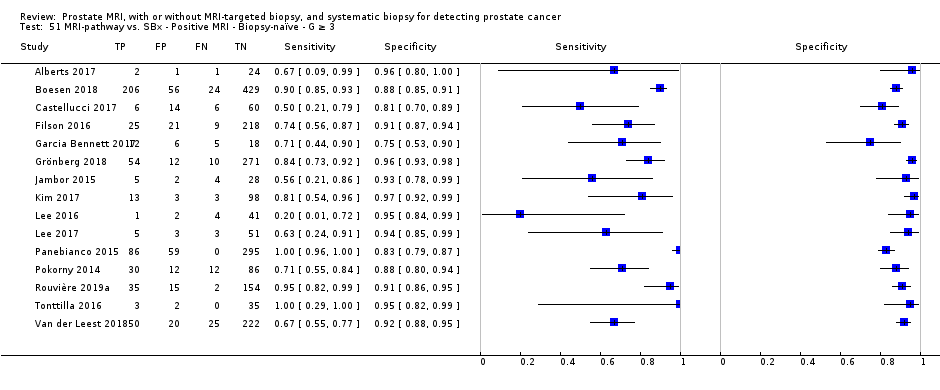
MRI‐pathway vs. SBx ‐ Positive MRI ‐ Biopsy‐naïve ‐ G ≥ 3.

MRI‐pathway vs SBx ‐ Negative MRI ‐ Biopsy‐naïve ‐ G = 1.

MRI‐pathway vs SBx ‐ Negative MRI ‐ Biopsy‐naïve ‐ G ≥ 1.
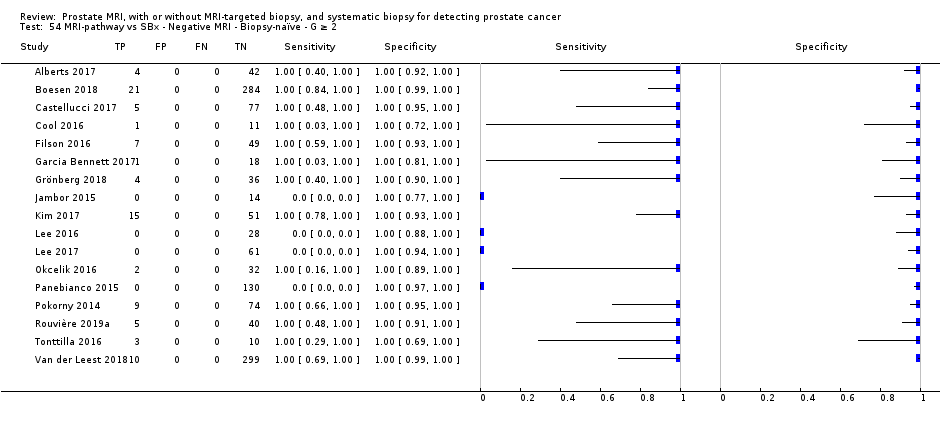
MRI‐pathway vs SBx ‐ Negative MRI ‐ Biopsy‐naïve ‐ G ≥ 2.

MRI‐pathway vs SBx ‐ Negative MRI ‐ Biopsy‐naïve ‐ G ≥ 3.

MRI‐pathway vs SBx ‐ Positive MRI ‐ Prior‐negative biopsy ‐ G = 1.
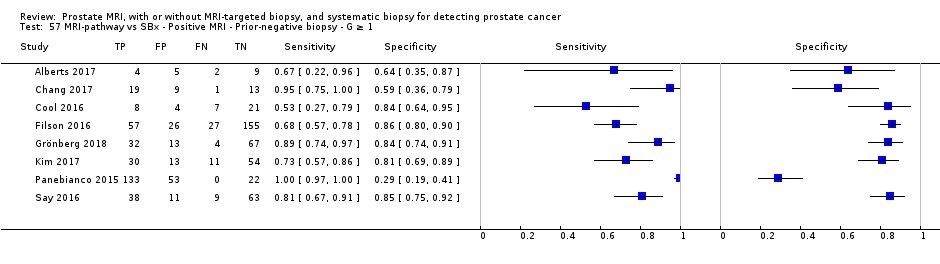
MRI‐pathway vs SBx ‐ Positive MRI ‐ Prior‐negative biopsy ‐ G ≥ 1.

MRI‐pathway vs SBx ‐ Positive MRI ‐ Prior‐negative biopsy ‐ G ≥ 2.

MRI‐pathway vs SBx ‐ Positive MRI ‐ Prior‐negative biopsy ‐ G ≥ 3.

MRI‐pathway vs SBx ‐ Negative MRI ‐ Prior‐negative biopsy ‐ G = 1.

MRI‐pathway vs SBx ‐ Negative MRI ‐ Prior‐negative biopsy ‐ G ≥ 1.

MRI‐pathway vs SBx ‐ Negative MRI ‐ Prior‐negative biopsy ‐ G ≥ 2.

MRI‐pathway vs SBx ‐ Negative MRI ‐ Prior‐negative biopsy ‐ G ≥ 3.
| Detecting ISUP grade 2 or higher prostate cancer by MRI, MRI‐targeted biopsy, MRI pathway and systematic biopsy | ||||||||||
| Population | 13,770 men with a suspicion of prostate cancer (PSA‐ or DRE‐based) undergoing their first biopsy (biopsy‐naïve men) or a repeat biopsy (prior‐negative biopsy men) | |||||||||
| Setting | University hospitals and specialized care centers | |||||||||
| Index tests | MRI; MRI‐targeted biopsy (MRI‐TBx) in men with a positive MRI; the MRI pathway (MRI with or without MRI‐TBx); and systematic biopsy (SBx) | |||||||||
| Reference standard | Template‐guided biopsy, which comprehensively samples all zones of the prostate | |||||||||
| Tests | Population type (biopsy‐naïve, prior‐negative biopsy, or mixed) | Summary | Summary | Detection | Missed grade 2 or higher prostate cancer per 1000 men (95% CI)a | Number of | Number of studies with a | |||
| Participant | Index | Reference | Flow and timing | |||||||
| MRI | Mixed | 0.91 | 0.37 | NA | 27 | 3091 (12) | 7 | 0 | 11 | 2 |
| MRI‐TBx | Mixed | 0.80 | 0.94 | NA | 60 | 1553 (8) | 4 | 0 | 6 | 0 |
| MRI pathway | Mixed | 0.72 | 0.96 | NA | 84 | 2257 (8) | 4 | 0 | 6 | 0 |
| SBx | Mixed | 0.63 | 1.00 | NA | 111 | 3421 (4) | 2 | 1 | 1 | 1 |
| MRI pathwayvs SBx | Mixed | NA | NA | 1.12 | MRI pathway missed 12% (2 to 23) less than SBx | 6944 (25) | 13 | 15 | NA | 8 |
| Biopsy‐naïve | NA | NA | 1.05 | MRI pathway missed 5% (−5 to 16) less than SBx | 5219 (20) | 9 | 12 | NA | 7 | |
| Prior‐negative biopsy | NA | NA | 1.44 | MRI pathway missed 44% (19 to 75) less than SBx | 1564 (10) | 5 | 6 | NA | 1 | |
| DRE: digital rectal exam; ISUP: International Society of Urological Pathology; MRI: magnetic resonance imaging; MRI‐TBx: MRI‐targeted biopsy; MRI pathway: magnetic resonance imaging with or without magnetic resonance imaging‐targeted biopsy; N: number; NA: not applicable; PSA: prostate‐specific antigen; SBx: systematic biopsy. | ||||||||||
| Detecting ISUP grade 1 prostate cancer by MRI, MRI‐targeted biopsy, MRI pathway and systematic biopsy | ||||||||||
| Population | 10,051 men with a suspicion of prostate cancer (PSA‐ or DRE‐based) undergoing their first biopsy (biopsy‐naïve men) or a repeat biopsy (prior‐negative biopsy men) | |||||||||
| Setting | University hospitals and specialized care centers | |||||||||
| Index tests | MRI; MRI‐targeted biopsy (MRI‐TBx) in men with a positive MRI; the MRI pathway (MRI with or without MRI‐TBx); and systematic biopsy (SBx) | |||||||||
| Reference standard | Template‐guided biopsy, which comprehensively samples all zones of the prostate | |||||||||
| Tests | Population type (biopsy‐naïve, prior‐negative biopsy, or mixed) | Summary | Summary | Detection | Avoided | Number of | Number of studies with a | |||
| Participant | Index | Reference | Flow and timing | |||||||
| MRI | Mixed | 0.70 | 0.27 | NA | 63 | 1764 (10) | 5 | 0 | 5 | 1 |
| MRI‐TBx | Mixed | 0.51 | 1.00 | NA | 103 | 497 (5) | 3 | 0 | 3 | 0 |
| MRI pathway | Mixed | 0.34 | 1.00 | NA | 139 | 681 (5) | 3 | 0 | 3 | 0 |
| SBx | Mixed | 0.55 | 0.99 | NA | 95 | 3421 (4) | 2 | 1 | 1 | 1 |
| MRI pathwayvs SBx | Mixed | NA | NA | 0.61 | MRI pathway | 5442 (21) | 11 | 11 | NA | 8 |
| Biopsy‐naïve | NA | NA | 0.63 | 4079 (17) | 9 | 9 | NA | 7 | ||
| Prior‐negative biopsy | NA | NA | 0.62 | 1202 (8) | 5 | 5 | NA | 2 | ||
| DRE: digital rectal exam; ISUP: International Society of Urological Pathology; MRI: magnetic resonance imaging; MRI‐TBx: MRI‐targeted biopsy; MRI pathway: magnetic resonance imaging with or without magnetic resonance imaging‐targeted biopsy; N: number; NA: not applicable; PSA: prostate‐specific antigen; SBx: systematic biopsy. aAt the representative pre‐test probability of 21% of having grade 1 prostate cancer, based on prevalence findings in the test accuracy analysis (proportion avoided = [prevalence*1000]*[1‐sensitivity]). | ||||||||||
| Question: Should MRI be used to diagnose ISUP grade 2 or higher prostate cancer in men suspected of having clinically significant prostate cancer? | |||||
| Population: men suspected of having clinically significant prostate cancer undergoing their first biopsy (biopsy‐naïve men) or a repeat biopsy (prior‐negative biopsy men) | |||||
| Setting: university hospitals and specialized care centers | |||||
| New test: MRI only | Cut‐off value: MRI score ≥ 3 out of 5 | |||||
| Reference test: template‐guided biopsy, which comprehensively samples all zones of the prostate | Threshold: ISUP grade 2 or higher prostate cancer | |||||
| Pooled sensitivity: 0.91 (95% CI: 0.83 to 0.95) | Pooled specificity: 0.37 (95% CI: 0.29 to 0.46) | |||||
| Test result | Number of results per 1,000 men tested (95% CI) | Number of participants (studies) | Certainty of the evidence (GRADE) | ||
| Prevalence 10% | Prevalence 30% | Prevalence 40% | |||
| True positives | 9 (83 to 95) | 273 (249 to 285) | 364 (332 to 380) | 3091 (12) | ⊕⊕○○ LOWa, b |
| False negatives | 9 (5 to 17) | 27 (15 to 51) | 36 (20 to 68) | ||
| True negatives | 333 (261 to 414) | 259 (203 to 322) | 222 (174 to 276) | 3091 (12) | ⊕⊕○○ LOWa, b |
| False positives | 567 (486 to 639) | 441 (378 to 497) | 378 (324 to 426) | ||
| MRI: magnetic resonance imaging; ISUP: International Society of Urological Pathology; CI: confidence interval aA considerable number of studies had a high or unclear risk of bias, mainly in the participant selection and reference standard domains. | |||||
| Question: Should MRI‐targeted biopsy be used to diagnose ISUP grade 2 or higher prostate cancer in men suspected of having clinically significant prostate cancer? | |||||
| Population: men with a positive MRI suspected of having clinically significant prostate cancer undergoing their first biopsy (biopsy‐naïve men) or a repeat biopsy (prior‐negative biopsy men) | |||||
| Setting: university hospitals and specialized care centers | |||||
| New test: MRI‐targeted biopsy | Threshold: ISUP grade 2 or higher prostate cancer | |||||
| Reference test: template‐guided biopsy, which comprehensively samples all zones of the prostate | Threshold: ISUP grade 2 or higher prostate cancer | |||||
| Pooled sensitivity: 0.80 (95% CI: 0.69 to 0.87) | Pooled specificity: 0.94 (95% CI: 0.90 to 0.97) | |||||
| Test result | Number of results per 1,000 men tested (95% CI) | Number of participants (studies) | Certainty of the evidence (GRADE) | ||
| Prevalence 10% | Prevalence 30% | Prevalence 40% | |||
| True positives | 80 (69 to 87) | 240 (207 to 261) | 320 (276 to 348) | 1553 (8) | ⊕⊕○○ LOWa, b |
| False negatives | 20 (13 to 31) | 60 (39 to 93) | 80 (52 to 124) | ||
| True negatives | 846 (810 to 873) | 658 (630 to 679) | 564 (540 to 582) | 1553 (8) | ⊕⊕○○ LOWa, b |
| False positives | 54 (27 to 90) | 42 (21 to 70) | 36 (18 to 60) | ||
| MRI: magnetic resonance imaging; ISUP: International Society of Urological Pathology; CI: confidence interval aA considerable number of studies had a high or unclear risk of bias, mainly in the participant selection and reference standard domains. | |||||
| Question: Should an MRI pathway be used to diagnose ISUP grade 2 or higher prostate cancer in men suspected of having clinically significant prostate cancer? | |||||
| Population: men suspected of having clinically significant prostate cancer undergoing their first biopsy (biopsy‐naïve men) or a repeat biopsy (prior‐negative biopsy men) | |||||
| Setting: university hospitals and specialized care centers | |||||
| New test: MRI pathway | Threshold: ISUP grade 2 or higher prostate cancer | |||||
| Reference test: template‐guided biopsy, which comprehensively samples all zones of the prostate | Threshold: ISUP grade 2 or higher prostate cancer | |||||
| Pooled sensitivity: 0.72 (95% CI: 0.60 to 0.82) | Pooled specificity: 0.96 (95% CI: 0.94 to 0.98) | |||||
| Test result | Number of results per 1,000 men tested (95% CI) | Number of participants (studies) | Certainty of the evidence (GRADE) | ||
| Prevalence 10% | Prevalence 30% | Prevalence 40% | |||
| True positives | 72 (60 to 82) | 216 (180 to 246) | 288 (240 to 328) | 2257 (8) | ⊕⊕○○ LOWa, b |
| False negatives | 28 (18 to 40) | 84 (54 to 120) | 112 (72 to 160) | ||
| True negatives | 864 (846 to 882) | 672 (658 to 686) | 576 (564 to 588) | 2257 (8) | ⊕⊕○○ LOWa, b |
| False positives | 36 (18 to 54) | 28 (14 to 42) | 24 (12 to 36) | ||
| MRI pathway: magnetic resonance imaging with or without magnetic resonance imaging‐targeted biopsy; ISUP: International Society of Urological Pathology; CI: confidence interval aA considerable number of studies had a high or unclear risk of bias, mainly in the participant selection and reference standard domains. | |||||
| Question: Should systematic biopsy be used to diagnose ISUP grade 2 or higher prostate cancer in men suspected of having clinically significant prostate cancer? | |||||
| Population: men suspected of having clinically significant prostate cancer undergoing their first biopsy (biopsy‐naïve men) or a repeat biopsy (prior‐negative biopsy men) | |||||
| Setting: university hospitals and specialized care centers | |||||
| New test: systematic biopsy | Threshold: ISUP grade 2 or higher prostate cancer | |||||
| Reference test: template‐guided biopsy, which comprehensively samples all zones of the prostate | Threshold: ISUP grade 2 or higher prostate cancer | |||||
| Pooled sensitivity: 0.63 (95% CI: 0.19 to 0.93) | Pooled specificity: 1.00 (95% CI: 0.91 to 1.00) | |||||
| Test result | Number of results per 1,000 men tested (95% CI) | Number of participants (studies) | Certainty of the evidence (GRADE) | ||
| Prevalence 10% | Prevalence 30% | Prevalence 40% | |||
| True positives | 63 (19 to 93) | 189 (57 to 279) | 252 (76 to 372) | 3421 (4) | ⊕⊕⊕○ MODERATEa, b, c |
| False negatives | 37 (7 to 81) | 111 (21 to 243) | 148 (28 to 324) | ||
| True negatives | 900 (819 to 900) | 700 (637 to 700) | 600 (546 to 600) | 3421 (4) | ⊕⊕○○ LOWa, b, c |
| False positives | 0 (0 to 81) | 0 (0 to 63) | 0 (0 to 54) | ||
| ISUP: International Society of Urological Pathology; CI: confidence interval aA considerable number of studies had a high or unclear risk of bias, mainly in the participant selection and reference standard domains. | |||||
| Domain 1: Participant selection | |
| SQ 1: Was a consecutive or random sample of participants enrolled? | Yes: if stated that participants were consecutively or randomly selected No: if one of these criteria was not met Unclear: if insufficient information to make a judgement |
| SQ 2: Did the study avoid inappropriate exclusions? | Yes: if stated that the study did not exclude men 1) aged between 50 and 70 years, 2) with PSA values between 4 and 10 ng/mL, or 3) with an abnormal DRE No: if one of these criteria was not met Unclear: insufficient information to make a judgement |
| Risk of bias Could the selection of participants have introduced bias? | Low risk: if ‘Yes’ for all SQ's High risk: if ‘No’ for at least 1 SQ Unclear risk: if 'Unclear' for at least 1 SQ |
| Concerns for applicability Are there concerns that the included participants and setting do not match the review question? | Low concern: the participants were referred because of a suspicion of prostate cancer. High concern: the participants were not referred because of a suspicion of prostate cancer, e.g. PSA‐screening trials are less applicable to the current clinical practice. Unclear concern: insufficient information to make a judgement |
| Domain 2: Index texts | |
| SQ 1: If applicable, was the MRI assessed without knowledge of the results of the reference (or other index) biopsies? | Yes: if stated that the radiologist was unaware of all biopsy results; or, if the order of testing was MRI before all biopsies for every participant No: if stated that the radiologist was aware of any biopsy results during MRI assessment Unclear: insufficient information to make a judgement |
| SQ 2: If applicable, were the MRI‐targeted biopsies performed independently of the performance and the results of the reference (or other index) biopsies? | Yes: if stated that the performance of MRI‐targeted biopsies was not influenced by the performance or trajectory of reference (or other index) biopsies No: if stated that MRI‐targeted biopsies were not, or differently, taken from locations already hit by the reference (or other index) biopsies; or, if the performance of MRI‐targeted biopsies was dependent on the judgement of the same operator that also performed the reference (or other index) biopsies without blinding Unclear: insufficient information to make a judgement |
| SQ 3: If applicable, were the systematic biopsies taken independently of the performance and the results of the reference (of other index) biopsies? | Yes: if stated that the systematic biopsies were taken blinded for
No: if stated that the systematic biopsy operator was not blinded for MRI results, or was the same operator that also performed the reference (or other index) biopsies without blinding Unclear: insufficient information to make a judgement |
| Risk of bias Could the conduct or interpretation of the index test have introduced bias? | Low risk: ‘Yes’ for all applicable SQs High risk: ‘No’ for at least one applicable SQ Unclear risk: ‘Unclear’ for at least one applicable SQ |
| Concerns for applicability Are there concerns that the index tests, their conduct or their interpretation differ from the review question? | Low concern: if stated that, when applicable,
High concern: the index test did not meet the criteria above Unclear concern: insufficient information to make a judgement |
| Domain 3: Reference standard | |
| SQ1: Is the reference standard likely to correctly classify the target condition? (i.e. Is histological diagnosis made from appropriately sampled tissue?) | Yes: if stated that the whole prostate was comprehensively sampled by a full 5‐mm transperineal TTMB, or by a equivalently well described transperineal template‐guided biopsy method with a prostate volume based median of ≤ 20 biopsy cores. No: one of these criteria was not met (i.e. in‐house transperineal saturation biopsy or transrectal saturation biopsy are less likely to appropriately sample the whole prostate). Unclear: insufficient information to make a judgement |
| SQ2: Was the reference standard performed independent of the index test? | Yes: if stated that the reference biopsies were taken without knowledge of the MRI‐score and location of target lesions; and, if incorporation was avoided (i.e. the index test was not part of the reference standard). No: one of these criteria was not met Unclear: insufficient information to make a judgement |
| Risk of bias Could the reference standard, its conduct, or its interpretation have introduced bias? | Low risk: 'Yes’ for all SQs High risk: ’No’ for at least 1 of the 3 SQs Unclear risk: ’Unclear’ for at least 1 SQ |
| Concerns for applicability Are there concerns that the target condition as defined by the reference standard does not match the question? | Low concern: data were presented for GS ≥ 3+4 without any volume criteria (ISUP grade ≥ 2), if necessary after requesting additional data from study authors High concern: data were presented for an alternative target condition definition and study authors did not provide additional data. Unclear: insufficient information to make a judgement |
| Domain 4: Flow and timing | |
| SQ1: Did all participants receive the same biopsy methods (i.e. was differential verification avoided)? | Yes: if stated that all participants received the same type of index test(s) and reference standard, prostate volume dependency was allowed. No: if one of these criteria was not met Unclear: if insufficient information to make a judgement |
| SQ2: Were all enrolled participants included in the analysis, or were exclusions explained and not leading to a relevant bias? | Yes: if stated that all eligible participants were enrolled and included in the final analyses; or, if reasons to excluded participants did not cause a relevant bias (e.g. participants with claustrophobia who refused MRI). No: one of these criteria was not met. Unclear: if insufficient information to make a judgement |
| Risk of bias Could the participant flow have introduced bias? | Low risk: ’Yes’ for all SQs High risk: ’No’ for at least 1 SQ Unclear risk: ’Unclear’, for at least 1 SQ |
| DCE: dynamic contrast‐enhanced; DRE: digital rectal examination; DWI: diffusion‐weighted imaging; MRI: magnetic resonance imaging; PSA: prostate‐specific antigen; QUADAS: Quality Assessment of Diagnostic Accuracy Studies; SQ: signalling question; TTMB: template‐guided mapping biopsy; ISUP: International Society of Urological Pathology | |
| Study | MRI | Index biopsy | Reference standard | Target | |||||
| Study | Consecutive | N of | Index | MRI‐scale; | MRI‐TBx | Technique | Median N | Independence | ISUP |
| No | 54 | MRI | 1‐5; ≥ 3 | Cognitive/transperineal | TTMB | 45 (21‐137) | No | G = 1 | |
| Yes | 576 | MRI, SBx | 1‐5; ≥ 3 | NA/transrectal | TTMB | > 40b | Yes | G = 1 | |
| Yes | 123 | MRI, | 1‐5; ≥ 3 | Cognitive/transrectal | TSBc | 24d | Yes | G = 1 | |
| Yes | Bx‐naïve: 597 | MRI, | 1‐5; ≥ 3 | Software/transperineal | TSBe | 24 (22‐25) | No | G ≥ 2 | |
| Yes | Bx‐naïve: 83 | MRI | 1‐5; ≥ 3 | Cognitive/transperineal | TSBe | (24‐40) | No | G = 1 | |
| Yes | 295 | MRI, | 1‐5; ≥ 3 | Software/transperineal | TSBe | (18‐24) | Unclear | G = 1 | |
| Yes | Centre 1: 163 | MRI | 1‐5; ≥ 3 | Software, | TSBe | 24 (22‐26f), | No | G = 1 | |
| Unclear | 287 | MRI, | 1‐5; ≥ 3 | Software/transperineal | TSBe | 24 (24‐25) | Unclear | G ≥ 2 | |
| Unclear | Bx‐naïve: 95 | MRI, | 1‐5; ≥ 3 | Software/transperineal | TSBg | 24 (23‐27f) | Yes | G = 1 | |
| No | 39 | MRI, | 1‐4; ≥2 | Software/transperineal | TSBe | 24 (14‐34) | No | G = 1 | |
| Yes | 163 | MRI, | 1‐5; ≥ 3 | Software/Transrectal | TSB | 40 (30‐55) | No | G = 1 | |
| Unclear | 9 | MRI | 1‐5; ≥ 3 | NA | TSBh | 24 (24–28) | Unclear | G = 1 | |
| Unclear | 78 | MRI, | 0‐1: ≥1 | Cognitive/transrectal | TSBh | 28 (26‐32) | No | G = 1 | |
| Yes | 344 | MRI | 1‐5; ≥ 3 | Software, | TTMB | 30 | No | G = 1 | |
| Unclear | 33 | MRI | 1‐5; ≥ 3 | NA | TTMB | 55 (42‐63f) | Yes | G = 1 | |
| Unclear | 50 | SBx | NA | NA/transrectal | TSBh | 36 | Yes | G = 1 | |
| Unclear | 42 | SBx | NA | NA/transrectal | TSBh | 36 | Yes | G = 1 | |
| Yes | 2753 | SBx | NA | NA/transrectal | TSBc | 21 | No | G = 1 | |
| Bx: biopsy; ISUP G : International Society of Urological Pathology grade; MRI: magnetic resonance imaging; MRI‐pathway: magnetic resonance imaging with or without magnetic resonance imaging‐targeted biopsy; MRI‐TBx: magnetic resonance imaging‐targeted biopsy; N: number; NA: not applicable; PI‐RADS v1, v2: Prostate Imaging Reporting Data System version 1 or 2; SBx: systematic biopsy; TSB: transperineal saturation biopsy; TTMB: transperineal template mapping biopsy | |||||||||
| aIncluded participants were part of the same study cohort (no randomised populations were included). | |||||||||
| Patient characteristics of the included diagnostic test accuracy studies | ||||
| Study | Population | Median age | Median PSA | Median prostate |
| Prior‐negative Bx | 64 (39‐75) | 10 (2‐23) | 53 (19‐136) | |
| Bx‐naïve | 63 (7.6)a | 7.1 (2.9)a | NR | |
| Prior‐negative Bx | 62 (57‐68b) | 6.3 (4,8‐8,9b) | 55 (20‐149)a | |
| Mixedc | 65 (60‐71b) | 7.2 (5.3‐10.4b) | 45 (34‐64b) | |
| Mixedc | 64 (6.8)a | 13.3 (12,1)a | 68 (35)a | |
| Prior‐negative Bx | 65 (59‐69b) | 7.8 (6.0‐12b) | 65 (44‐83b) | |
| Bx‐naïve | 64 (57‐69b) | 6.6 (4.6‐9.0b) | 44 (33‐55b) | |
| Prior‐negative Bx | 66 (61‐72b) | 9.7 (7.1‐13.9b) | 52 (36‐75b) | |
| Mixedc | 65 (58‐71b) | 7.2 (5.4‐10.2b) | 46 (36‐60b) | |
| Prior‐negative Bx | 64 (47‐77)a | 10 (1.2‐36) | NR | |
| Bx‐naïve | 63 (57‐68b) | 5.8 (4.4‐8.9b) | 44 (34‐60b) | |
| Bx‐naïve | 68 (46‐81) | 11.5 (1.2‐92.5) 10 (2.7‐61)d | NR | |
| Prior‐negative Bx | 63 (49‐72) | 11 (3.7‐45) | NR | |
| Bx‐naïve | 63 (56‐67b) | 5.2 (3.7‐7.1b) | 40 (30‐54b) | |
| Prior‐negative Bx | 65 (61‐69b) | 7.1 (5.1‐13.6b) | 44 (32‐65b) | |
| Bx‐naïve | 67 (54‐84)a | 8 (4‐18)a | 58 (19‐165)a | |
| Prior‐negative Bx | 65 (50‐75)a | 8.3 (4.4‐19)a | 59 (21‐152)a | |
| Bx‐naïve | 64 (8)a | 12.5 (7.2)a | 46 (25)a | |
| Bx: biopsy; NR: not reported; PSA: prostate specific antigen | ||||
| aMean (standard deviation or range) (as opposed to median (range)). | ||||
| Study | MRI | Index biopsy | Target | ||||||
| Study | Consecutive | N of | Index tests | MRI‐scale; | MRI‐TBx | SBx | MRI‐TBx & | ISUP | |
| Technique | Median N | Independence | Route | ||||||
| Yes | Bx‐naïve: 74 | MRI‐pathway | 1‐5; ≥ 3 | Software | 12 (12‐12b) | Yes | Transrectal | G = 1 | |
| Unclear | 206 | MRI‐pathway | 1‐5; ≥ 3 | Software | 10 (10‐10) | Yes | Transrectal | G = 1 | |
| Yes | 1020 | MRI‐pathway | 1‐5; ≥ 3 | Software | 10c | Yes | Transrectal | G = 1 | |
| Yes | 168 | MRI‐pathway | 1‐5; ≥ 3 | Cognitive | (8‐19) | Unclear | Transrectal | G = 1 | |
| Yes | 65 | MRI‐pathway | 1‐5; ≥ 3 | Cognitive | 18 (16.2‐19.8b) | No | Transrectal | G = 1 | |
| Yes | 420 | MRI‐pathway | 1‐5; ≥ 3 | Cognitive | 12d | Yes | Transperineal | G ≥ 2 | |
| Unclear | Bx‐naïve: 50 | MRI‐pathway | Other | Software | 12‐14e | Unclear | Transrectal | G = 1 | |
| No | 38 | MRI‐pathway | 1‐5; ≥4 | Cognitive | NR | No | Transrectal | G ≥ 2 | |
| Yes | 391 | MRI‐pathway | TZ: 0‐4; ≥2 | Software Cognitive | 12 (10‐12) | Unclear | Transrectal | G ≥ 2 | |
| Yes | Bx‐naïve: 329 | MRI‐pathway | 1‐5; ≥ 3 | Software | 12 | Unclear | Transrectal | G ≥ 2 | |
| Unclear | 60 | MRI‐pathway | 1‐5; ≥ 3 | Cognitive | 12 | Yes | Transperineal | G = 1 | |
| Yes | Bx‐naïve: 387 | MRI‐pathway | 1‐5; ≥ 3 | Software | 11 (10‐12) | No | Transrectal | G = 1 | |
| Unclear | 53 | MRI‐pathway | 1‐5; ≥4 | Cognitive | 12 | Yes | Transrectal | G = 1 | |
| Unclear | Bx‐naïve: 134 | MRI‐pathway | 1‐5; ≥ 3 | Cognitive | 12c | No | Transrectal | G = 1 | |
| Unclear | Bx‐naïve: 183 | MRI‐pathway | 1‐5; ≥4 | Software Cognitive | 14c | No | Transrectal | G = 1 | |
| Unclear | 76 | MRI‐pathway | 1‐4; ≥2 | Cognitive | 12 (12‐12) | No | Transrectal | G = 1 | |
| Unclear | 123 | MRI‐pathway | 1‐4; ≥2 | Cognitive | 12 | No | Transrectal | G = 1 | |
| Unclear | 52 | MRI‐pathway | 0‐1: ≥1 | Cognitive | NR | Unclear | Transrectal | G = 1 | |
| Yes | Bx‐naïve: 570 | MRI‐pathway | 1‐5; ≥ 3 | Cognitive | 10, 14 or 45f | Unclear | Transrectal | G = 1 | |
| Yes | 110 | MRI‐pathway | 1‐4; ≥2 | Software | 15 | No | Transrectal | G = 1 | |
| Yes | 223 | MRI‐pathway | 1‐5; ≥ 3 | In‐bore | 12 | Unclear | Transrectal | G = 1 | |
| Yes | 251 | MRI‐pathway | 1‐5; ≥ 3 | Software Cognitive | 12.2c | Yes | Transrectal | G = 1 | |
| Yes | 143 | MRI‐pathway | 1‐4; ≥2 | Software | 12c | Unclear | Transrectal | G = 1 | |
| Yes | 53 | MRI‐pathway | 1‐4; ≥2 | Cognitive | 12 (12‐14) | Yes | Transrectal | G = 1 | |
| Yes | 626 | MRI‐pathway | 1‐5; ≥ 3 | In‐bore | 12c | Yes | Transrectal | G = 1 | |
| Bx: biopsy; ISUP G : International Society of Urological Pathology grade; MRI: magnetic resonance imaging; MRI‐pathway: magnetic resonance imaging with or without magnetic resonance imaging‐targeted biopsy; MRI‐TBx: magnetic resonance imaging‐targeted biopsy; N: number; NA: not applicable; PI‐RADS v1, v2: Prostate Imaging Reporting Data System version 1 or 2; PZ: peripheral zone; SBx: systematic biopsy; TSB: transperineal saturation biopsy; TTMB: transperineal template mapping biopsy; TZ: transition zone | |||||||||
| aIncluded participants were part of the same study cohort (no randomised populations were included). | |||||||||
| Study | Population | Median age | Median PSA | Median prostate |
| Bx‐naïve | 73 (72‐74b) | 4.2 (3.4–5.8b) | 53 (37‐71b) | |
| Prior‐negative Bx | 65 (58‐68b) | 12.8 (8.9‐19.6b) | NR | |
| Bx‐naïve | 67 (61‐71b) | 8 (5.7‐13b) | 53 (40‐72b) | |
| Bx‐naïve | 61 (8)c | 8.3 (6.1)c | 49 (7)c | |
| Prior‐negative Bx | 64 (60‐68b) | 10.9 (7.2‐14.7b) | 48 (34‐63b) | |
| Bx‐naïve | 67 (45‐91) | 9.7 (2.4‐35.7) | 45 (21‐83) | |
| Bx‐naïve | 59 (8)c | 6.0 (3.5)c | 38 (18)c | |
| Prior‐negative Bx | 64 (48‐77)c | 14.4 (1.8‐33.1)c | NR | |
| Bx‐naïve | 64 (7)c | 8.5 (3.9)c | 56 (30)c | |
| Bx‐naïve | 64 (59‐69b) | 5.8 (4.4‐8.1b) | 45(33‐62b) | |
| Bx‐naïve | 64 (6.7)c | 7.2 (6‐9.4b) | 48 (35‐63b) | |
| Bx‐naïve | 64 (45–74)c | 6.3 (4.4b) | (32‐70)d | |
| Bx‐naïve | 66 (47‐76) | 7.4 (4‐14) | 42 (17‐107) | |
| Mixed | 65 (6)c | 7.5 (5.7‐9.6b) | 37 (28‐49b) | |
| Bx‐naïve | 64 (7)c | 10.2 (15.1)c | NR | |
| Bx‐naïve | 66 (43‐83) | 6.4 (3.3‐9.8) | 39 (17‐127) | |
| Bx‐naïve | 62 (10)c | 6.4 (1.8)c | 40 (18)c | |
| Bx‐naïve | 62 (43‐79) | 5 (3‐8.9) | 45 (17‐93) | |
| Bx‐naïve | 64 (51‐82) | NR | NR | |
| Bx‐naïve | 65 (7)c | 8.4 (6.3)c | 49 (22)c | |
| Bx‐naïve | 63 (57‐68b) | 5.3 (4.1‐6.6b) | 41 (30‐59b) | |
| Bx‐naïve | 64 (59‐68b) | 6.5 (5.6‐9.6b) | 50 (38‐63b) | |
| Prior‐negative Bx | 64 (47‐82)c | 11.59 (0.4‐96.9)c | 69 (17‐309)c | |
| Bx‐naïve | 63 (60‐66b) | 6.1 (4.2‐9.9b) | 28 (24‐37b) | |
| Bx‐naïve | 65 (59‐68b) | 6.4 (4.6‐8.2b) | 55 (41‐77b) | |
| Bx: biopsy; NR: not reported; PSA: prostate specific antigen | ||||
| aResults not reported per population type. | ||||
| Diagnostic accuracy of the index tests verified by template‐guided biopsy as the reference standard | |||||||
| Index test | MRI | Target | N participants | Proportion | Sensitivity | Specificity | P value |
| MRI | Positive + negative | G = 1 | 1764 (10) | 0.28 (0.20 to 0.38) | 0.70 (0.59 to 0.80) | 0.27 (0.19 to 0.37) | P < 0.01b |
| G ≥ 1 | 1764 (10) | 0.39 (0.30 to 0.50) | 0.84 (0.74 to 0.90) | 0.39 (0.30 to 0.50) | NA | ||
| G ≥ 2 | 3091 (12) | 0.29 (0.22 to 0.37) | 0.91 (0.83 to 0.95) | 0.37 (0.29 to 0.46) | P < 0.01b | ||
| G ≥ 3 | 1438 (7) | 0.31 (0.21 to 0.42) | 0.95 (0.87 to 0.99) | 0.35 (0.26 to 0.46) | ID | ||
| MRI‐TBx | Positive | G = 1 | 497 (5) | NA | 0.51 (0.21 to 0.81) | 1.00 (0.77 to 1.00) | NA |
| G ≥ 1 | 611 (6) | NA | 0.71 (0.61 to 0.80) | 0.93 (0.87 to 0.96) | NA | ||
| G ≥ 2 | 1553 (8) | NA | 0.80 (0.69 to 0.87) | 0.94 (0.90 to 0.97) | NA | ||
| G ≥ 3 | 428 (3) | NA | ID | ID | ID | ||
| MRI‐pathway | Positive + negative | G = 1 | 681 (5) | 0.24 (0.16 to 0.36) | 0.34 (0.19 to 0.53) | 1.00 (0.90 to 1.00) | P = 0.52c |
| G ≥ 1 | 844 (6) | 0.28 (0.21 to 0.35) | 0.58 (0.52 to 0.65) | 0.96 (0.92 to 0.98) | NA | ||
| G ≥ 2 | 2257 (8) | 0.29 (0.24 to 0.35) | 0.72 (0.60 to 0.82) | 0.96 (0.94 to 0.98) | P = 0.06c | ||
| G ≥ 3 | 604 (3) | 0.29 (0.26 to 0.33) | ID | ID | ID | ||
| SBx | NA | G = 1 | 3421 (4) | NA | 0.55 (0.25 to 0.83) | 0.99 (0.81 to 1.00) | NA |
| G ≥ 1 | 3421 (4) | NA | 0.65 (0.31 to 0.88) | 1.00 (0.88 to 1.00) | NA | ||
| G ≥ 2 | 3421 (4) | NA | 0.63 (0.19 to 0.93) | 1.00 (0.91 to 1.00) | NA | ||
| G ≥ 3 | 626 (2) | NA | ID | ID | ID | ||
| CI: confidence interval; G: International Society of Urological Pathology grade; ID: inadequate data; MRI: magnetic resonance imaging; MRI‐pathway: magnetic resonance imaging with or without magnetic resonance imaging‐targeted biopsy; MRI‐TBx: magnetic resonance imaging‐targeted biopsy; N: number; NA: not applicable; SBx: systematic biopsy | |||||||
| aData did not allow differentiation between the mix of included participants (biopsy‐naïve and prior‐negative biopsy men). | |||||||
| Predictive values of the index tests and prostate cancer prevalences | ||||||
| Test | MRI | Target | N participants | Prevalenceb | NPVc | PPVc |
| MRI | Positive + negative | G = 1 | 1764 (10) | 0.20 (0.17 to 0.23) | 0.79 (0.74 to 0.82) | 0.20 (0.18 to 0.21) |
| G ≥ 2 | 3091 (12) | 0.29 (0.22 to 0.38) | 0.91 (0.86 to 0.94) | 0.37 (0.35 to 0.39) | ||
| G ≥ 3 | 1438 (7) | 0.14 (0.08 to 0.23) | 0.98 (0.95 to 0.99) | 0.19 (0.17 to 0.21) | ||
| MRI‐TBx | Positive | G = 1 | 497 (5) | 0.22 (0.19 to 0.26) | 0.88 (0.78 to 0.94) | 0.98 (0.23 to 1.00) |
| G ≥ 2 | 1553 (8) | 0.34 (0.24 to 0.46) | 0.90 (0.85 to 0.93) | 0.88 (0.80 to 0.92) | ||
| G ≥ 3 | 428 (3) | 0.21 (0.12 to 0.35) | ID | ID | ||
| MRI‐pathway | Positive + negative | G = 1 | 681 (5) | 0.21 (0.18 to 0.24) | 0.85 (0.81 to 0.88) | 0.95 (0.38 to 1.00) |
| G ≥ 2 | 2257 (8) | 0.26 (0.18 to 0.36) | 0.91 (0.87 to 0.94) | 0.88 (0.80 to 0.92) | ||
| G ≥ 3 | 604 (3) | 0.16 (0.09 to 0.27) | ID | ID | ||
| SBx | NA | G = 1 | 3421 (4) | 0.20 (0.16 to 0.25) | 0.90 (0.81 to 0.95) | 0.94 (0.37 to 1.00) |
| G ≥ 2 | 3421 (4) | 0.34 (0.21 to 0.51) | 0.84 (0.60 to 0.95) | 1.00 (0.76 to 1.00) | ||
| G ≥ 3 | 626 (2) | 0.10 (0.08 to 0.12) | ID | ID | ||
| CI: confidence interval; G: International Society of Urological Pathology grade; ID: inadequate data; MRI: magnetic resonance imaging; MRI‐pathway: magnetic resonance imaging with or without magnetic resonance imaging‐targeted biopsy; MRI‐TBx: magnetic resonance imaging‐targeted biopsy; NA: not applicable; NPV: negative predictive value; PPV: positive predictive value; SBx: systematic biopsy | ||||||
| aData did not allow differentiation between the mix of included participants (biopsy‐naïve and prior‐negative biopsy men). | ||||||
| MRI‐positivity threshold effect, verified by template‐guided biopsy as the reference standard, with threshold ≥ 3and ≥ 4 out of 5 for identifying prostate cancer | |||||
| MRI threshold | Target | N participants | Proportion | Sensitivity | Specificity |
| ≥ 3/5 | G = 1 | 1647 (8) | 0.29 (0.21 to 0.40) | 0.68 (0.57 to 0.77) | 0.28 (0.19 to 0.39) |
| G ≥ 2 | 2974 (10) | 0.30 (0.23 to 0.38) | 0.89 (0.82 to 0.94) | 0.39 (0.32 to 0.47) | |
| G ≥ 3 | 1438 (7) | 0.31 (0.21 to 0.42) | 0.96 (0.87 to 0.99) | 0.35 (0.26 to 0.46) | |
| ≥ 4/5 | G = 1 | 834 (4) | 0.60 (0.38 to 0.78) | 0.26 (0.16 to 0.40) | 0.57 (0.36 to 0.76) |
| G ≥ 2 | 1083 (5) | 0.59 (0.43 to 0.74) | 0.72 (0.52 to 0.86) | 0.78 (0.68 to 0.86) | |
| G ≥ 3 | 834 (4) | 0.60 (0.38 to 0.78) | 0.86 (0.51 to 0.97) | 0.68 (0.51 to 0.81) | |
| CI: confidence interval; G: International Society of Urological Pathology grade; MRI: magnetic resonance imaging; N: number | |||||
| aData did not allow differentiation between the mix of included participants (biopsy‐naïve and prior‐negative biopsy men). | |||||
| Population | Target condition | N participants (studies) | Proportion prostate cancer detected in % (95% CI) | Detection ratiob | Difference | ||||
| Biopsy status | MRI, proportion in % (95% CI)a | MRI‐pathway and SBx combined (total cancer detected) | MRI‐pathway | SBx | MRI‐pathway versus SBx | P value | |||
| Mixedd | Positive + negative | G = 1 | 5442 (21) | 25.6 (22.8 to 28.8) | 12.3 (10.1 to 15.1) | 20.8 (18.0 to 24.1) | 0.61 (0.52 to 0.71) | P < 0.01 | NA |
| G ≥ 1 | 6524 (24) | 50.2 (46.4 to 54.3) | 37.9 (33.4 to 42.6) | 43.3 (39.1 to 47.8) | 0.88 (0.81 to 0.95) | P < 0.01 | NA | ||
| G ≥ 2 | 6944 (25) | 26.7 (23.3 to 30.7) | 22.9 (19.5 to 26.8) | 19.4 (15.9 to 23.5) | 1.12 (1.02 to 1.23) | P = 0.01 | NA | ||
| G ≥ 3 | 5981 (21) | 15.0 (12.7 to 18.0) | 12.7 (10.5 to 15.6) | 9.7 (7.5 to 12.7) | 1.20 (1.06 to 1.36) | P < 0.01 | NA | ||
| Positive | G = 1 | 3460 (19) | 29.5 (26.0 to 33.8) | 18.8 (15.2 to 23.4) | 22.4 (18.9 to 26.9) | 0.85 (0.75 to 0.97) | P = 0.01 | NA | |
| G ≥ 1 | 3998 (20) | 68.0 (62.3 to 73.5) | 61.1 (54.1 to 67.7) | 58.9 (51.5 to 65.9) | 1.03 (0.95 to 1.10) | P = 0.52 | NA | ||
| G ≥ 2 | 3998 (20) | 42.6 (37.6 to 48.1) | 37.9 (32.7 to 43.7) | 31.6 (26.2 to 37.9) | 1.17 (1.07 to 1.28) | P < 0.01 | NA | ||
| G ≥ 3 | 3902 (18) | 24.2 (20.9 to 28.1) | 21.0 (17.8 to 24.8) | 16.3 (13.1 to 20.3) | 1.24 (1.11 to 1.38) | P < 0.01 | NA | ||
| Biopsy‐naïve | Positive + negative | G = 1 | 4079 (17) | 27.2 (23.9 to 31.1) | 13.5 (10.7 to 17.2) | 22.4 (19.1 to 26.3) | 0.63 (0.54 to 0.74) | P < 0.01 | P = 0.91 |
| G ≥ 1 | 4799 (19) | 53.2 (48.7 to 57.9) | 41.0 (35.8 to 46.4) | 47.8 (42.8 to 52.9) | 0.85 (0.77 to 0.93) | P < 0.01 | P = 0.12 | ||
| G ≥ 2 | 5219 (20) | 27.7 (23.7 to 32.6) | 23.4 (19.3 to 28.1) | 21.4 (17.2 to 26.5) | 1.05 (0.95 to 1.16) | P = 0.35 | P < 0.01 | ||
| G ≥ 3 | 4306 (16) | 15.5 (12.6 to 19.5) | 12.7 (9.9 to 16.5) | 10.8 (8.0 to 14.8) | 1.09 (0.94 to 1.26) | P = 0.27 | P < 0.01 | ||
| Positive | G = 1 | 2682 (16) | 31.8 (27.7 to 36.9) | 21.3 (17.0 to 26.9) | 23.7 (19.6 to 29.1) | 0.85 (0.74 to 0.98) | P = 0.03 | P = 0.35 | |
| G ≥ 1 | 2955 (17) | 70.9 (65.0 to 76.6) | 63.7 (56.3 to 70.6) | 63.8 (56.2 to 70.7) | 0.99 (0.92 to 1.08) | P = 0.88 | P = 0.05 | ||
| G ≥ 2 | 2955 (17) | 44.2 (38.6 to 50.4) | 39.2 (33.3 to 45.7) | 34.4 (28.3 to 41.3) | 1.12 (1.01 to 1.23) | P = 0.03 | P < 0.01 | ||
| G ≥ 3 | 2899 (15) | 24.8 (21.0 to 29.6) | 21.2 (17.4 to 25.7) | 17.5 (13.8 to 22.3) | 1.16 (1.02 to 1.31) | P = 0.02 | P < 0.01 | ||
| Prior‐negative biopsy | Positive + negative | G = 1 | 1202 (8) | 23.0 (18.0 to 30.2) | 10.9 (7.9 to 15.3) | 17.8 (12.7 to 25.2) | 0.62 (0.44 to 0.88) | P < 0.01 | P = 0.91 |
| G ≥ 1 | 1564 (10) | 40.7 (35.1 to 47.2) | 30.0 (24.1 to 37.0) | 30.3 (24.3 to 37.5) | 0.97 (0.85 to 1.11) | P = 0.70 | P = 0.12 | ||
| G ≥ 2 | 1564 (10) | 22.8 (20.0 to 26.2) | 20.5 (17.7 to 23.5) | 13.2 (10.8 to 16.4) | 1.44 (1.19 to 1.75) | P < 0.01 | P < 0.01 | ||
| G ≥ 3 | 1514 (9) | 12.6 (10.5 to 15.6) | 11.5 (9.4 to 14.2) | 6.3 (4.4 to 9.1) | 1.64 (1.27 to 2.11) | P < 0.01 | P < 0.01 | ||
| Positive | G = 1 | 655 (7) | 27.9 (22.1 to 36.2) | 18.2 (12.8 to 26.7) | 18.9 (13.3 to 27.5) | 1.03 (0.89 to 1.18) | P = 0.71 | P = 0.35 | |
| G ≥ 1 | 920 (8) | 54.8 (44.6 to 66.4) | 48.5 (37.0 to 61.5) | 39.4 (27.1 to 53.9) | 1.16 (1.02 to 1.32) | P = 0.02 | P = 0.05 | ||
| G ≥ 2 | 920 (8) | 31.3 (27.4 to 36.1) | 28.6 (24.7 to 33.1) | 18.3 (15.1 to 22.5) | 1.49 (1.22 to 1.82) | P < 0.01 | P < 0.01 | ||
| G ≥ 3 | 880 (7) | 17.9 (14.3 to 22.9) | 16.7 (13.1 to 21.5) | 9.4 (6.4 to 14.2) | 1.65 (1.30 to 2.09) | P < 0.01 | P < 0.01 | ||
| CI: confidence interval; G: International Society of Urological Pathology grade; MRI: magnetic resonance imaging; MRI‐pathway: magnetic resonance imaging with or without magnetic resonance imaging‐targeted biopsy; MRI‐TBx: magnetic resonance imaging‐targeted biopsy; N: number; SBx: systematic biopsy | |||||||||
| aProportion of participants with a positive or negative magnetic resonance imaging result, based on the studies reporting grade 2 or higher. | |||||||||
| Population | Target | N participants | Proportion prostate cancer detected in % (95% CI) | ||||||
| Biopsy status | MRI, | MRI‐pathway and SBx combined (total cancer detected) | MRI‐pathway | SBx | Both MRI‐pathway and SBx | Only MRI‐pathway (added valueb) | Only SBx (added valueb) | ||
| Mixedc | Positive + negative | G = 1d | 5442 (21) | 19.5 (16.9 to 22.7) | 10.3 (8.1 to 13.1) | 16.8 (14.2 to 19.9) | 7.6 (5.5 to 10.2) | 2.7 (1.8 to 4.0) | 9.2 (7.4 to 11.4) |
| G ≥ 1 | 6524 (24) | 50.2 (46.4 to 54.3) | 37.9 (33.4 to 42.6) | 43.3 (39.1 to 47.8) | 30.9 (26.3 to 36.0) | 6.9 (5.2 to 9.2) | 12.4 (10.2 to 14.9) | ||
| G ≥ 2 | 6944 (25) | 26.7 (23.3 to 30.7) | 22.9 (19.5 to 26.9) | 19.4 (15.9 to 23.6) | 15.6 (12.2 to 19.6) | 7.3 (5.9 to 9.0) | 3.8 (2.5 to 5.7) | ||
| G ≥ 3 | 5981 (21) | 15.0 (12.7 to 18.0) | 12.7 (10.5 to 15.6) | 9.7 (7.5 to 12.7) | 7.4 (5.3 to 10.2) | 5.3 (4.3 to 6.5) | 2.3 (1.4 to 3.7) | ||
| Positive | G = 1d | 3460 (19) | 19.7 (15.9 to 24.7) | 15.8 (12.2 to 20.7) | 15.8 (12 to 20.8) | 12.0 (8.4 to 16.8) | 3.9 (2.6 to 5.7) | 3.8 (2.3 to 6.2) | |
| G ≥ 1 | 3998 (20) | 68.0 (62.3 to 73.5) | 61.1 (54.1 to 67.7) | 58.9 (51.5 to 65.9) | 52.0 (43.6 to 59.9) | 9.1 (5.9 to 13.5) | 6.9 (4.6 to 10.1) | ||
| G ≥ 2 | 3998 (20) | 42.6 (37.6 to 48.1) | 37.9 (32.7 to 43.7) | 31.6 (26.2 to 37.9) | 27.0 (21.4 to 33.4) | 10.9 (8.5 to 13.9) | 4.6 (2.9 to 7.2) | ||
| G ≥ 3 | 3902 (18) | 24.2 (20.9 to 28.1) | 21 (17.8 to 24.8) | 16.3 (13.1 to 20.3) | 13.2 (10.1 to 16.9) | 7.9 (6.3 to 9.7) | 3.1 (1.9 to 5.2) | ||
| Negative | G = 1d | 1666 (19) | 16.8 (12.9 to 21.6) | NA | 16.8 (12.9 to 21.6) | NA | NA | 16.8 (12.9 to 21.6) | |
| G ≥ 1 | 1781 (20) | 23.1 (19.7 to 26.9) | NA | 23.1 (19.7 to 26.9) | NA | NA | 23.1 (19.7 to 26.9) | ||
| G ≥ 2 | 1781 (20) | 7.2 (5.3 to 9.8) | NA | 7.2 (5.3 to 9.8) | NA | NA | 7.2 (5.3 to 9.8) | ||
| G ≥ 3 | 1725 (18) | 2.7 (1.6 to 4.6) | NA | 2.7 (1.6 to 4.6) | NA | NA | 2.7 (1.6 to 4.6) | ||
| Biopsy‐naïve | Positive + negative | G = 1d | 4079 (17) | 20.9 (18.0 to 24.7) | 11.2 (8.4 to 14.9) | 18.5 (15.6 to 22.2) | 8.8 (6.2 to 12.3) | 2.4 (1.4 to 4.0) | 9.8 (8.0 to 11.8) |
| G ≥ 1 | 4799 (19) | 53.2 (48.7 to 57.9) | 41.0 (35.8 to 46.4) | 47.8 (42.8 to 52.9) | 35.6 (30.2 to 41.2) | 5.4 (3.6 to 8.0) | 12.2 (8.7 to 16.7) | ||
| G ≥ 2 | 5219 (20) | 27.7 (23.7 to 32.6) | 23.4 (19.4 to 28.2) | 21.4 (17.2 to 26.5) | 17.1 (13.0 to 22) | 6.3 (4.8 to 8.2) | 4.3 (2.6 to 6.9) | ||
| G ≥ 3 | 4306 (16) | 15.5 (12.6 to 19.5) | 12.7 (9.9 to 16.5) | 10.8 (8.0 to 14.8) | 8.0 (5.4 to 11.6) | 4.7 (3.5 to 6.3) | 2.8 (1.7 to 4.8) | ||
| Positive | G = 1d | 2682 (16) | 21.1 (16.7 to 27.1) | 17.0 (12.6 to 22.9) | 17.7 (13.3 to 23.8) | 13.6 (9.3 to 19.5) | 3.4 (2.1 to 5.3) | 4.1 (2.5 to 6.7) | |
| G ≥ 1 | 2955 (17) | 70.9 (65.0 to 76.6) | 63.7 (56.3 to 70.6) | 63.8 (56.2 to 70.7) | 56.6 (47.7 to 64.6) | 7.1 (4.2 to 11.9) | 7.2 (4.7 to 10.8) | ||
| G ≥ 2 | 2955 (17) | 44.2 (38.6 to 50.4) | 39.2 (33.3 to 45.7) | 34.4 (28.3 to 41.3) | 29.5 (23.2 to 36.5) | 9.8 (7.1 to 13.2) | 4.9 (2.8 to 8.3) | ||
| G ≥ 3 | 2899 (15) | 24.8 (21.0 to 29.6) | 21.2 (17.4 to 25.7) | 17.5 (13.8 to 22.3) | 13.9 (10.3 to 18.3) | 7.3 (5.4 to 9.7) | 3.7 (2.2 to 6.1) | ||
| Negative | G = 1 | 1287 (16) | 18.4 (14.2 to 23.7) | NA | 18.4 (14.2 to 23.7) | NA | NA | 18.4 (14.2 to 23.7) | |
| G ≥ 1 | 1343 (17) | 25.5 (20.7 to 30.9) | NA | 25.5 (20.7 to 30.9) | NA | NA | 25.5 (20.7 to 30.9) | ||
| G ≥ 2 | 1343 (17) | 8.1 (5.6 to 11.6) | NA | 8.1 (5.6 to 11.6) | NA | NA | 8.1 (5.6 to 11.6) | ||
| G ≥ 3 | 1297 (15) | 3.0 (1.6 to 5.5) | NA | 3.0 (1.6 to 5.5) | NA | NA | 3.0 (1.6 to 5.5) | ||
| Prior‐negative biopsy | Positive + negative | G = 1d | 1202 (8) | 17.6 (13.0 to 25.0) | 9.8 (6.9 to 14.3) | 13.5 (8.9 to 21.0) | 5.8 (3.2 to 10.0) | 4.1 (2.6 to 6.2) | 7.7 (3.9 to 14.8) |
| G ≥ 1 | 1564 (10) | 40.7 (35.1 to 47.2) | 30.0 (24.1 to 37.0) | 30.3 (24.3 to 37.5) | 19.6 (13.7 to 27.1) | 10.3 (7.5 to 13.9) | 10.7 (7.4 to 15) | ||
| G ≥ 2 | 1564 (10) | 22.8 (20.0 to 26.2) | 20.5 (17.7 to 23.5) | 13.2 (10.8 to 16.4) | 10.9 (8.7 to 13.5) | 9.6 (7.7 to 11.8) | 2.3 (1.2 to 4.5) | ||
| G ≥ 3 | 1514 (9) | 12.6 (10.5 to 15.6) | 11.5 (9.4 to 14.2) | 6.3 (4.4 to 9.1) | 5.1 (3.4 to 7.7) | 6.3 (5.2 to 7.7) | 1.1 (0.5 to 2.6) | ||
| Positive | G = 1d | 655 (7) | 19.5 (13.9 to 28.8) | 16.5 (11.0 to 25.2) | 12.4 (7.2 to 21.6) | 9.4 (4.6 to 17.9) | 7.1 (4.1 to 11.8) | 3.0 (1.0 to 8.0) | |
| G ≥ 1 | 920 (8) | 54.8 (44.6 to 66.4) | 48.5 (37.0 to 61.5) | 39.4 (27.1 to 53.9) | 33.1 (20.1 to 48.7) | 15.4 (8.2 to 26.4) | 6.3 (3.8 to 9.8) | ||
| G ≥ 2 | 920 (8) | 31.3 (27.4 to 36.1) | 28.6 (24.7 to 33.1) | 18.3 (15.1 to 22.5) | 15.7 (12.7 to 19.1) | 13.0 (9.7 to 17.0) | 2.7 (1.2 to 5.7) | ||
| G ≥ 3 | 880 (7) | 17.9 (14.3 to 22.9) | 16.7 (13.1 to 21.5) | 9.4 (6.4 to 14.2) | 8.2 (5.2 to 12.6) | 8.5 (6.1 to 11.5) | 1.2 (0.4 to 3.2) | ||
| Negative | G = 1 | 341 (7) | 14.2 (5.9 to 30.2) | NA | 14.2 (5.9 to 30.2) | NA | NA | 14.2 (5.9 to 30.2) | |
| G ≥ 1 | 400 (8) | 19.5 (12.9 to 28.3) | NA | 19.5 (12.9 to 28.3) | NA | NA | 19.5 (12.9 to 28.3) | ||
| G ≥ 2 | 400 (8) | 5.3 (3.1 to 8.9) | NA | 5.3 (3.1 to 8.9) | NA | NA | 5.3 (3.1 to 8.9) | ||
| G ≥ 3 | 390 (7) | 3.3 (1.7 to 6.3) | NA | 3.3 (1.7 to 6.3) | NA | NA | 3.3 (1.7 to 6.3) | ||
| CI: confidence interval; G: International Society of Urological Pathology grade; MRI: magnetic resonance imaging; MRI‐pathway: magnetic resonance imaging with or without magnetic resonance imaging‐targeted biopsy; MRI‐TBx: magnetic resonance imaging‐targeted biopsy: N: number; NA: not applicable; SBx: systematic biopsy | |||||||||
| aProportion of participants with a positive or negative MRI result, based on the studies reporting grade 2 or higher. | |||||||||
| Agreement analysis: number needed to biopsy by systematic biopsy to detect one extra prostate cancer not detected by the MRI‐pathway | |||
| Population | Target | NNBa | |
| Biopsy status | MRI | ||
| Biopsy‐naïve | Positive | G = 1 | 24 (15 to 40) |
| G ≥ 2 | 20 (12 to 36) | ||
| G ≥ 3 | 27 (16 to 45) | ||
| Negative | G = 1 | 5 (4 to 7) | |
| G ≥ 2 | 13 (9 to 18) | ||
| G ≥ 3 | 33 (18 to 63) | ||
| Prior‐negative biopsy | Positive | G = 1 | 33 (13 to 100) |
| G ≥ 2 | 37 (18 to 83) | ||
| G ≥ 3 | 83 (31 to 250) | ||
| Negative | G = 1 | 7 (3 to 17) | |
| G ≥ 2 | 19 (11 to 32) | ||
| G ≥ 3 | 31 (16 to 63) | ||
| CI: confidence interval; G: International Society of Urological Pathology grade; MRI: magnetic resonance imaging; MRI‐pathway: magnetic resonance imaging with or without magnetic resonance imaging‐targeted biopsy; N: number; NA: not applicable; NNB: number needed to biopsy; SBx: systematic biopsy | |||
| aNumber needed to biopsy by systematic biopsy is 100 divided by the added value of systematic biopsy. | |||
| Heterogeneity exploration in the agreement analysis: detection ratio MRI‐pathway vs systematic biopsy for G ≥ 2 prostate cancer | ||||
| Covariate | Category | N participants | Detection ratio | P value |
| Population | Biopsy‐naïve | 5219 (20) | 1.05 (0.95 to 1.16) | 0.002 |
| Prior to negative biopsy | 1564 (10) | 1.44 (1.19 to 1.75) | ||
| Field strength | 3T | 5407 (19) | ID | ID |
| 1.5T | 1143 (4) | ID | ID | |
| Endorectal coil | Yes | 1815 (6) | 1.42 (1.07 to 1.88) | 0.008 |
| No | 4082 (14) | 1.03 (0.94 to 1.12) | ||
| MRI pulse sequence | mpMRI | 4941 (16) | 1.18 (1.05 to 1.33) | 0.233 |
| bpMRI | 1775 (6) | 1.03 (0.91 to 1.17) | ||
| mpMRI + spectroscopy | 105 (2) | ID | ID | |
| MRI risk threshold | Low | 605 (6) | 1.18 (1.03 to 1.35) | 0.556 |
| Intermediate | 5859 (15) | 1.14 (1.03 to 1.26) | ||
| High | 428 (3) | ID | ID | |
| MRI‐TBx technique | Software | 3313 (9) | 1.15 (0.99 to 1.33) | 0.483 |
| Cognitive | 2194 (12) | 1.17 (1.00 to 1.36) | ||
| In‐bore | 849 (2) | ID | ID | |
| Route index test | Transrectal | 6464 (23) | ID | ID |
| Transperineal | 480 (2) | ID | ID | |
| bpMRI: biparametric magnetic resonance imaging; CI: confidence interval; G: International Society of Urological Pathology grade; ID: inadequate data; mpMRI: multiparametric magnetic resonance imaging; MRI: magnetic resonance imaging; MRI‐pathway: magnetic resonance imaging with or without magnetic resonance imaging‐targeted biopsy; MRI‐TBx: magnetic resonance imaging‐targeted biopsy; N: number; SBx: systematic biopsy | ||||
| aDetection ratio is the detection rate of MRI‐pathway divided by detection rate of systematic biopsy; the detection rate = the pooled number of positive results of the test divided by the pooled total number of positive results from both tests. | ||||
| Sensitivity analyses of the diagnostic test accuracy of MRI and the MRI‐pathway for detecting G ≥ 2 prostate cancer, verified by template‐guided biopsy as the reference standard | ||||||||
| Covariate | Category | MRI | MRI‐pathwaya | |||||
| N | Sensitivity | Specificity | N | Sensitivity | Specificity | |||
| Main analyses (as reference) | No selection | 12 | 0.91 (0.83 to 0.95) | 0.37 (0.29 to 0.46) | 8 | 0.72 (0.60 to 0.82) | 0.96 (0.94 to 0.98) | |
| QUADAS domains | Participant selection | Only low risk of bias | 5 | 0.86 (0.83 to 0.88) | 0.39 (0.31 to 0.47) | 4 | 0.61 (0.54 to 0.69) | 0.97 (0.92 to 0.99) |
| Only low applicability concern | 11 | 0.91 (0.83 to 0.96) | 0.36 (0.28 to 0.46) | 7 | 0.69 (0.60 to 0.77) | 0.97 (0.94 to 0.98) | ||
| Index test | Only low risk of bias | 12 | 0.91 (0.83 to 0.95) | 0.37 (0.29 to 0.46) | 8 | 0.72 (0.60 to 0.82) | 0.96 (0.94 to 0.98) | |
| Only low applicability concern | 9 | 0.90 (0.85 to 0.94) | 0.37 (0.31 to 0.43) | 6 | 0.68 (0.59 to 0.77) | 0.97 (0.94 to 0.99) | ||
| Reference standard | Only low risk of bias | 4 | 0.93 (0.82 to 0.98) | 0.34 (0.24 to 0.45) | 2 | ID | ID | |
| Only low applicability concern | 12 | 0.91 (0.83 to 0.95) | 0.37 (0.29 to 0.46) | 8 | 0.72 (0.60 to 0.82) | 0.96 (0.94 to 0.98) | ||
| Flow and timing | Only low risk of bias | 11 | 0.91 (0.83 to 0.96) | 0.36 (0.28 to 0.46) | 8 | 0.72 (0.60 to 0.82) | 0.96 (0.94 to 0.98) | |
| Additional analyses | MRI positivity threshold | Only threshold 3/5 | 10 | 0.89 (0.82 to 0.94) | 0.39 (0.32 to 0.47) | 6 | 0.68 (0.59 to 0.77) | 0.97 (0.94 to 0.98) |
| MRI positivity threshold effect | MRI positivity threshold 3/5 (only studies with also 4/5) | 5 | 0.87 (0.73 to 0.94) | 0.45 (0.33 to 0.57) | 0 | ID | ID | |
| MRI positivity threshold 4/5 (only studies with also 3/5) | 5 | 0.72 (0.52 to 0.86) | 0.78 (0.68 to 0.86) | 0 | ID | ID | ||
| MRI vs MRI‐pathway | Only MRI and MRI‐pathway in the same men (paired data) | 8 | 0.92 (0.83 to 0.96) | 0.35 (0.27 to 0.44) | 8 | 0.72 (0.60 to 0.82) | 0.96 (0.94 to 0.98) | |
| Reference standard | Only TTMB, TSB or TOP | 9 | 0.90 (0.84 to 0.93) | 0.36 (0.29 to 0.44) | 6 | 0.69 (0.58 to 0.78) | 0.96 (0.93 to 0.97) | |
| Template‐guided biopsy + MRI‐TBx (composite reference standard) | 11 | 0.94 (0.91 to 0.96) | 1.00 (1.00 to 1.00) | 8 | 0.72 (0.63 to 0.80) | 1.00 (1.00 to 1.00) | ||
| Experience of radiologist | Only high experience | 10 | 0.91 (0.85 to 0.95) | 0.34 (0.27 to 0.42) | 7 | 0.69 (0.60 to 0.77) | 0.97 (0.94 to 0.98) | |
| CI: confidence interval; G: International Society of Urological Pathology grade; ID: inadequate data; MRI: magnetic resonance imaging; MRI‐pathway: magnetic resonance imaging with or without magnetic resonance imaging‐targeted biopsy; MRI‐TBx: magnetic resonance imaging‐targeted biopsy; N: number; NA: not applicable; QUADAS: Quality Assessment of Diagnostic Accuracy Studies; SBx: systematic biopsy; TOP: transperineal optimised prostate biopsy;TSB: Ginsburg transperineal saturation biopsy; TTMB: transperineal template mapping biopsy | ||||||||
| aThe diagnostic test accuracy analyses of magnetic resonance imaging‐targeted biopsy are based on the same studies as the MRI‐pathway. | ||||||||
| Sensitivity analyses of the agreement between the MRI‐pathway vs systematic biopsy for detecting G ≥ 2 prostate cancer | ||||
| Covariate | Category | N | Detection ratio | |
| Main analyses (as reference) | Mixed population | 25 | 1.12 (1.02 to 1.23) | |
| QUADAS domains | Patient selection | Only low risk of bias | 12 | 1.08 (1.00 to 1.17) |
| Only low applicability concern | 23 | 1.09 (1.01 to 1.17) | ||
| Index test (MRI‐pathway) | Only low risk of bias | 24 | 1.11 (1.02 to 1.22) | |
| Only low applicability concern | 14 | 1.13 (1.01 to 1.26) | ||
| Index test (SBx) | Only low risk of bias | 10 | 1.04 (0.94 to 1.15) | |
| Only low applicability concern | 20 | 1.07 (0.99 to 1.15) | ||
| Flow and timing | Only low risk of bias | 17 | 1.10 (1.00 to 1.22) | |
| Additional analyses | MRI positivity threshold | Only threshold 3/5 | 15 | 1.14 (1.03 to 1.26) |
| Population | Biopsy‐naïve (only studies with also prior‐negative biopsy men) | 6 | 0.98 (0.76 to 1.28)b | |
| Prior‐negative biopsy (only studies with also biopsy‐naïve men) | 6 | 1.42 (1.03 to 1.95)b | ||
| Experience of radiologist | Only high experience | 21 | 1.13 (1.03 to 1.24) | |
| CI: confidence interval; G: International Society of Urological Pathology grade; MRI‐pathway: magnetic resonance imaging (MRI) with or without MRI‐targeted biopsy; N: number; QUADAS: Quality Assessment of Diagnostic Accuracy Studies; SBx: systematic biopsy | ||||
| aDetection ratio is the detection rate of the MRI‐pathway divided by detection rate of systematic biopsy; the detection rate is the pooled number of positive results of the test divided by the pooled total number of positive results from both tests. | ||||
| Test | No. of studies | No. of participants |
| 1 Diagnostic accuracy of MRI ‐ G = 1 Show forest plot | 10 | 1764 |
| 2 Diagnostic accuracy of MRI ‐ G ≥ 1 Show forest plot | 10 | 1764 |
| 3 Diagnostic accuracy of MRI ‐ G ≥ 2 Show forest plot | 12 | 3091 |
| 4 Diagnostic accuracy of MRI ‐ G ≥ 3 Show forest plot | 7 | 1438 |
| 5 Diagnostic accuracy of MRI ‐ MRI‐positvity threshold 4/5 ‐ G = 1 Show forest plot | 4 | 834 |
| 6 Diagnostic accuracy of MRI ‐ MRI‐positvity threshold 4/5 ‐ G ≥ 1 Show forest plot | 4 | 834 |
| 7 Diagnostic accuracy of MRI ‐ MRI‐positvity threshold 4/5 ‐ G ≥ 2 Show forest plot | 5 | 1083 |
| 8 Diagnostic accuracy of MRI ‐ MRI‐positvity threshold 4/5 ‐ G ≥ 3 Show forest plot | 4 | 834 |
| 9 Diagnostic accuracy of MRI ‐ Biopsy‐naïve ‐ G ≥ 1 Show forest plot | 3 | 748 |
| 10 Diagnostic accuracy of MRI ‐ Biopsy‐naïve ‐ G ≥ 2 Show forest plot | 3 | 748 |
| 11 Diagnostic accuracy of MRI ‐ Biopsy‐naïve ‐ G ≥ 3 Show forest plot | 3 | 748 |
| 12 Diagnostic accuracy of MRI ‐ Prior‐negative biopsy ‐ G ≥ 1 Show forest plot | 8 | 870 |
| 13 Diagnostic accuracy of MRI ‐ Prior‐negative biopsy ‐ G ≥ 2 Show forest plot | 9 | 1157 |
| 14 Diagnostic accuracy of MRI ‐ Prior‐negative biopsy ‐ G ≥ 3 Show forest plot | 4 | 544 |
| 15 Diagnostic accuracy of MRI ‐ Sensitivity analysis with composite reference standard (template‐guided biopsy + MRI‐TBx) ‐ G ≥ 2 Show forest plot | 11 | 3192 |
| 16 Diagnostic accuracy of TBx ‐ G = 1 Show forest plot | 5 | 497 |
| 17 Diagnostic accuracy of TBx ‐ G ≥ 1 Show forest plot | 6 | 611 |
| 18 Diagnostic accuracy of TBx ‐ G ≥ 2 Show forest plot | 8 | 1553 |
| 19 Diagnostic accuracy of TBx ‐ G ≥ 3 Show forest plot | 3 | 428 |
| 20 Diagnostic accuracy of the MRI‐pathway ‐ G = 1 Show forest plot | 5 | 681 |
| 21 Diagnostic accuracy of the MRI‐pathway ‐ G ≥ 1 Show forest plot | 6 | 844 |
| 22 Diagnostic accuracy of the MRI‐pathway ‐ G ≥ 2 Show forest plot | 8 | 2257 |
| 23 Diagnostic accuracy of the MRI‐pathway ‐ G ≥ 3 Show forest plot | 3 | 604 |
| 24 Diagnostic accuracy of SBx ‐ G = 1 Show forest plot | 4 | 3421 |
| 25 Diagnostic accuracy of SBx ‐ G ≥ 1 Show forest plot | 4 | 3421 |
| 26 Diagnostic accuracy of SBx ‐ G ≥ 2 Show forest plot | 4 | 3421 |
| 27 Diagnostic accuracy of SBx ‐ G ≥ 3 Show forest plot | 2 | 626 |
| 28 MRI‐pathway vs SBx ‐ G = 1 Show forest plot | 21 | 5442 |
| 29 MRI‐pathway vs SBx ‐ G ≥ 1 Show forest plot | 24 | 6524 |
| 30 MRI‐pathway vs SBx ‐ G ≥ 2 Show forest plot | 25 | 6944 |
| 31 MRI‐pathway vs SBx ‐ G ≥ 3 Show forest plot | 21 | 5981 |
| 32 MRI‐pathway vs SBx ‐ Biopsy‐naïve ‐ G = 1 Show forest plot | 17 | 4079 |
| 33 MRI‐pathway vs SBx ‐ Biopsy‐naïve ‐ G ≥ 1 Show forest plot | 19 | 4799 |
| 34 MRI‐pathway vs SBx ‐ Biopsy‐naïve ‐ G ≥ 2 Show forest plot | 20 | 5219 |
| 35 MRI‐pathway vs SBx ‐ Biopsy‐naïve ‐ G ≥ 3 Show forest plot | 16 | 4306 |
| 36 MRI‐pathway vs SBx ‐ Prior‐negative biopsy ‐ G = 1 Show forest plot | 8 | 1202 |
| 37 MRI‐pathway vs SBx ‐ Prior‐negative biopsy ‐ G ≥ 1 Show forest plot | 10 | 1564 |
| 38 MRI‐pathway vs SBx ‐ Prior‐negative biopsy ‐ G ≥ 2 Show forest plot | 10 | 1564 |
| 39 MRI‐pathway vs SBx ‐ Prior‐negative biopsy ‐ G ≥ 3 Show forest plot | 9 | 1514 |
| 40 MRI‐pathway vs SBx ‐ Positive MRI ‐ G = 1 Show forest plot | 19 | 3460 |
| 41 MRI‐pathway vs SBx ‐ Positive MRI ‐ G ≥ 1 Show forest plot | 20 | 3998 |
| 42 MRI‐pathway vs SBx ‐ Positive MRI ‐ G ≥ 2 Show forest plot | 20 | 3998 |
| 43 MRI‐pathway vs SBx ‐ Positive MRI ‐ G ≥ 3 Show forest plot | 18 | 3902 |
| 44 MRI‐pathway vs SBx ‐ Negative MRI ‐ G = 1 Show forest plot | 19 | 1666 |
| 45 MRI‐pathway vs SBx ‐ Negative MRI ‐ G ≥ 1 Show forest plot | 20 | 1781 |
| 46 MRI‐pathway vs SBx ‐ Negative MRI ‐ G ≥ 2 Show forest plot | 20 | 1781 |
| 47 MRI‐pathway vs SBx ‐ Negative MRI ‐ G ≥ 3 Show forest plot | 18 | 1725 |
| 48 MRI‐pathway vs SBx ‐ Positive MRI ‐ Biopsy‐naïve ‐ G = 1 Show forest plot | 16 | 2682 |
| 49 MRI‐pathway vs SBx ‐ Positive MRI ‐ Biopsy‐naïve ‐ G ≥ 1 Show forest plot | 17 | 2955 |
| 50 MRI‐pathway vs SBx ‐ Positive MRI ‐ Biopsy‐naïve ‐ G ≥ 2 Show forest plot | 17 | 2955 |
| 51 MRI‐pathway vs. SBx ‐ Positive MRI ‐ Biopsy‐naïve ‐ G ≥ 3 Show forest plot | 15 | 2899 |
| 52 MRI‐pathway vs SBx ‐ Negative MRI ‐ Biopsy‐naïve ‐ G = 1 Show forest plot | 16 | 1287 |
| 53 MRI‐pathway vs SBx ‐ Negative MRI ‐ Biopsy‐naïve ‐ G ≥ 1 Show forest plot | 17 | 1343 |
| 54 MRI‐pathway vs SBx ‐ Negative MRI ‐ Biopsy‐naïve ‐ G ≥ 2 Show forest plot | 17 | 1343 |
| 55 MRI‐pathway vs SBx ‐ Negative MRI ‐ Biopsy‐naïve ‐ G ≥ 3 Show forest plot | 15 | 1297 |
| 56 MRI‐pathway vs SBx ‐ Positive MRI ‐ Prior‐negative biopsy ‐ G = 1 Show forest plot | 7 | 655 |
| 57 MRI‐pathway vs SBx ‐ Positive MRI ‐ Prior‐negative biopsy ‐ G ≥ 1 Show forest plot | 8 | 920 |
| 58 MRI‐pathway vs SBx ‐ Positive MRI ‐ Prior‐negative biopsy ‐ G ≥ 2 Show forest plot | 8 | 920 |
| 59 MRI‐pathway vs SBx ‐ Positive MRI ‐ Prior‐negative biopsy ‐ G ≥ 3 Show forest plot | 7 | 880 |
| 60 MRI‐pathway vs SBx ‐ Negative MRI ‐ Prior‐negative biopsy ‐ G = 1 Show forest plot | 7 | 341 |
| 61 MRI‐pathway vs SBx ‐ Negative MRI ‐ Prior‐negative biopsy ‐ G ≥ 1 Show forest plot | 8 | 400 |
| 62 MRI‐pathway vs SBx ‐ Negative MRI ‐ Prior‐negative biopsy ‐ G ≥ 2 Show forest plot | 8 | 400 |
| 63 MRI‐pathway vs SBx ‐ Negative MRI ‐ Prior‐negative biopsy ‐ G ≥ 3 Show forest plot | 7 | 390 |