生物制剂或托法替布治疗未曾接受过甲氨蝶呤的类风湿性关节炎患者:系统评价和网络meta分析
摘要
研究背景
生物减病抗风湿药物(生物制剂)在治疗类风湿性关节炎(rheumatoid arthritis, RA)方面非常有效,但目前很少有同类生物比较研究。我们进行了系统综述、标准meta分析和网络meta分析(network meta‐analysis, NMA)来更新2009年Cochrane综述。本综述主要针对首次接受甲氨蝶呤(methotrexate, MTX)治疗的成人类风湿性关节炎患者。
研究目的
比较生物制剂(阿巴西普、阿达木单抗、阿那白滞素、妥珠单抗、依那西普、戈利木单抗、英夫利昔、托珠单抗)和小分子依法替尼与比较物(甲氨蝶呤(MTX)/其他风湿药)对首次接受甲氨蝶呤的类风湿关节炎患者的益处和危害。
研究方法
2015年6月,我们检索了Cochrane对照试验中心注册库(Cochrane Central Register of Controlled Trials, CENTRAL)、MEDLINE和Embase的随机对照试验(RCTs);以及试验注册库。我们使用了标准的Cochrane方法。我们计算了比值比(odds ratios, OR)和平均差(mean differences, MD)以及传统meta分析的95%置信区间(confidence intervals, CI)和网络meta分析(network meta‐analysis, NMA)使用贝叶斯混合处理比较方法的95%可信区间(credible intervals, CrI)。为便于解释,我们将OR转换为风险比(risk ratios, RR)。我们还提供了绝对测量的结果,如风险差(risk difference, RD)和获益/伤害需治病例数(umber needed to treat for an additional beneficial or harmful, NNTB/H)。
主要结果
共有6485名受试者的19项随机对照试验符合纳入标准(包括来自2009年原始综述的5项研究),4种TNF生物制剂(阿达木单抗(6项研究;1851名受试者),依那西普(3项研究;678名受试者),戈利木单抗(一项研究;637名受试者)和英夫利昔单抗(7项研究;1363名受试者))和两种非tnf生物制剂(阿巴西普(一项研究;509名受试者)和利妥昔单抗(一项研究;748名受试者))。
不到50%的研究被判定为分配方案随机序列的生成、分配方案隐藏和盲法的低偏倚风险,21%的研究被判定为选择性报告的低偏倚风险,53%的研究被判定为失访的低偏倚风险,89%的研究被判定为主要基线失衡的低偏倚风险。三项试验采用生物单药治疗,即不使用甲氨蝶呤。没有安慰剂对照试验,也没有托法替尼试验。试验持续时间为6至24个月。一半的试验包括早期RA患者(病程少于两年),另一半包括已确诊RA患者(2至10年)。
生物制剂+MTX与活性对照(MTX( 17项试验(6344名受试者) /MTX+甲泼尼龙 2项试验(141名受试者) )
在传统的meta分析中,根据ACR50(美国风湿病学会量表)和RA缓解率显示,与对照药相比,含有MTX的生物制剂具有统计学意义和临床意义的获益,但由于不一致性,证据被降级为中等质量。对于ACR50,生物制剂与MTX显示风险率(risk ratio, RR)为1.40(95% CI [1.30,1.49])、绝对差为16%(95% CI [13%, 20%]),NNTB=7(95% CI [6, 8])。对于RA缓解率,生物制剂与MTX显示RR为1.62(95% CI [1.33, 1.98])、绝对差为15%(95% CI [11%, 19%]),NNTB=5(95% CI [6, 7])。生物制剂与MTX也有统计学上显著的相关,但不具有临床意义,身体功能的改善(中等质量证据因不一致而降级),HAQ评分的改善为‐0.10(95% CI [‐0.16, ‐0.04], 0至3级),绝对差为‐3.3%(95% CI [‐5.3%, ‐1.3%]),NNTB=4(95% CI [2, 15])。
我们没有观察到与MTX相比,MTX生物制剂在放射学进展(低质量证据,因不精确和不一致而降级)或严重不良事件(中等质量证据,因不精确而降级)方面存在差异的证据。基于低质量的证据,由于不良事件而停药的结果尚无定论(RR为1.32,但95%置信区间包括重要危害的可能性,为0.89至1.97)。癌症的结果也不确定(Peto OR=0.71, 95% CI [0.38, 1.33]),由于严重不精确,证据质量下降。
不含MTX的生物制剂与活性比较剂(MTX 3项试验(866名受试者)
在ACR50、HAQ、缓解(这些益处相关证据为中等质量证据,因不精确而降级)、不良事件引起的停药和严重不良事件(这些危害相关证据为低质量证据,因严重不精确而降级)方面,没有统计学意义或临床重要差异的证据。所有的研究都是针对TNF生物单药治疗的,而没有非TNF生物单药治疗的研究。没有研究测量放射学进展。
作者结论
在未使用MTX的RA受试者中,有中等质量证据表明,与单独使用MTX相比,MTX生物制剂与三个疗效结局(ACR50、HAQ评分和RA缓解率)的绝对和相对有意义的临床获益相关。使用含有MTX的生物制剂减少放射学进展的获益并不明显(低质量证据)。我们发现中等到低质量的证据表明,与MTX相比,MTX生物治疗与任何更高的严重不良事件风险无关,但对于因不良事件和癌症而停药24个月的结果尚无定论。
TNF生物单一疗法与MTX的任何结局均无统计学显着差异或临床意义(中等质量证据),并且没有非TNF生物单一疗法的可用数据资料。
我们的结论是,在从未接触过MTX的人群中使用含有MTX的生物制剂是有益的,并且几乎没有/非结论性证据表明其有害。需要更多关于托法替尼、放射学进展和该患者群体危害的数据,以全面评估比较疗效和安全性。
简语概要
生物制剂治疗未曾接受过甲氨蝶呤(MTX)的类风湿性关节炎(RA)患者
研究问题
我们在2015年6月之前进行的试验中,研究了生物制剂或托法替布对之前未接受过甲氨蝶呤(methotrexate, MTX)治疗的类风湿性关节炎(rheumatoid arthritis, RA)患者的益处和危害。四种TNF生物制剂(阿达木单抗、依那西普、戈利木单抗、英夫利昔单抗)和两种非TNF生物制剂(阿巴西普、利妥昔单抗)的数据资料可用。
什么是RA?什么是生物制剂/托法替尼?
在RA中,通常抵抗感染的免疫系统会攻击关节内膜,使其发炎。如果不进行治疗,炎症会导致关节损伤和残疾。生物制剂或托法替布是可以减少关节炎症/损伤并改善症状的药物。
本综述表明,在那些患有类风湿性关节炎的患者中:
‐生物制剂(阿巴西普、阿达木单抗、依那西普、戈利木单抗、英夫利昔单抗、利妥昔单抗)与MTX联合可能改善RA的体征和症状(关节压痛或肿胀)、RA缓解的几率(症状消失),并可能略微改善功能性能力。由于担心某些结果的不一致性,我们降低了结果的质量等级。
‐生物制剂与MTX联合使用可能对严重不良事件或因不良事件导致的停药风险影响很小或没有影响。由于担心某些结果的不一致性和数据资料缺乏,我们降低了结果的质量等级。
‐通常来说,我们对于副作用和并发症没有掌握精确的信息。由于缺乏数据资料,我们不确定生物制剂对癌症风险的影响。
‐单独使用TNF生物制剂(阿达木单抗、依那西普、戈利木单抗)(不与MTX联合使用)可能对RA体征和症状或RA缓解机会产生很小或没有影响(没有单独使用非TNF生物制剂的数据资料)。
类风湿性关节炎患者服用生物制剂时会发生情况的最佳估计:
ACR50(美国风湿病学会50量表:关节压痛或肿胀、疼痛和残疾的数量) :
生物制剂+MTX与MTX: 服用生物制剂(与MTX联合)的100人中,有56人的RA得到改善,而服用MTX的100人中,有40人的RA得到改善(改善16%)。
生物单一疗法(TNF生物制剂)与MTX: 服用生物制剂的100人中有35人的RA有所改善,而服用MTX的100人中有37人的RA有所改善(减少2%)
缓解(DAS<1.6或DAS28<2.6)
生物制剂+MTX与MTX: 服用生物制剂(与MTX联合)的100人中有37人的RA症状消失,而服用MTX的100人中有22人的RA症状消失(改善15%)。
生物单一疗法(TNF生物制剂)与MTX: 服用生物制剂的100人中有22人的RA症状消失,而服用MTX的100人中有20人的RA症状消失(改善2%)。
X射线测量的疾病损伤进展(0至448分)
生物制剂+MTX与MTX: 服用生物制剂(与MTX联合)的患者的影像学进展为0.45分,而服用MTX的患者则进展为3分(减少0.5%)。
没有针对生物单一疗法的研究。
因不良反应而停药
生物制剂+MTX与MTX: 服用生物制剂(与MTX联合)的100名受试者中有7人因不良事件退出研究,而服用MTX的受试者中有100名有5人退出研究(多出2%)。
生物单一疗法(TNF生物制剂)与MTX: 服用生物制剂的100人中有6人因不良事件退出研究,而服用MTX的100人中有6人退出研究(差异为0%)。
严重不良事件
生物制剂+MTX与MTX: 服用生物制剂(与MTX联合)的100名受试者中有11名报告了严重不良事件,而服用MTX的100名受试者中有10名报告了严重不良事件(严重不良事件增加了1%)。
生物单一疗法(TNF生物制剂)与MTX: 服用生物制剂的100名受试者中有3名报告了严重不良事件,而服用MTX的100名受试者中有7名报告了严重不良事件(严重不良事件减少了4%)。
癌症
生物制品(单独使用或与MTX联合使用)和MTX对照组报告癌症的人数相同(每100人中就有1人)。然而,癌症事件很少,因此这种解释需要谨慎。
Authors' conclusions
Background
Description of the condition
Rheumatoid Arthritis (RA) is a chronic inflammatory arthritis characterized by inflammation of the synovial lining of the joints, tendons and periarticular structures, with main disease features of joint pain, swelling and joint destruction (Lee 2001). RA affects 0.5% to 1.0% of the population (Kvien 2004) and frequently leads to health‐related quality of life (HRQoL) deficits (Kvien 2005; Lubeck 2004), functional limitation, and in people with refractory disease, untreated disease or longer disease duration, or both, to joint destruction, severe disability and disfigurement (Odegard 2005; Yelin 2007).
Pharmacological treatment options for RA include non‐steroidal anti‐inflammatory drugs (NSAIDs), glucocorticoids, traditional disease‐modifying anti‐rheumatic drugs (DMARDs), biologic DMARDs and oral small molecules (e.g. tofacitinib). Traditional DMARDs (referred to as DMARDs from here on), most commonly methotrexate (MTX), but also including sulfasalazine, hydroxychloroquine, leflunomide, cyclosporine etc., either alone or in combination, are usually the first choice drug for people with early or established RA; when these fail, biologics (alone or with DMARDs) or DMARD combinations or tofacitinib are treatment options (Singh 2012; Singh 2016a; Smolen 2014). DMARDs are the cornerstone of RA management since their use is associated with improvement in pain and physical function and a reduction in radiographic progression (Finckh 2006; Pincus 2002) and disability (Cash 1994; Strand 2008).
Description of the interventions
Biologics are newer treatment options available for treatment of RA. Biologics are medications that are made in live cell systems. Biologics are frequently categorized based on their mechanism of action. Two broad categories are biologics that do or do not inhibit tumor necrosis factor (TNF), a key cytokine in RA (Scott 2006). Further classification is based on whether the biologic is a receptor or an antibody (for TNF inhibitors ), or the specific cytokine/pathway/cell they inhibit (non‐TNF biologic). The currently approved biologics for the treatment of RA are:
-
TNF biologics
-
monoclonal antibodies against the TNF (TNF antibody biologic)
-
Soluble TNF receptor
-
etanercept (Enbrel, approved 1998) (FDA 1998a), that binds free‐circulating TNF so that it does not bind to the cellular receptor.
-
-
-
Non‐TNF biologics
-
anti‐CD28 therapy:
-
abatacept (Orencia, approved 2005) (FDA 2005)
-
-
anti‐B‐cell therapy:
-
rituximab (Rituxan/Mabthera, approved 1997 for lymphoma and 2006 for RA) (FDA 1997;Drugs 2006)
-
-
anti‐interleukin (IL)‐6 therapy:
-
tocilizumab (Actemra, approved 2010) (FDA 2010)
-
-
anti‐IL‐1 therapy:
-
anakinra (Kineret, approved 2001) (FDA 2001)
-
-
Tofacitinib (XELJANZ), an oral small molecule drug, (FDA 2012), was approved in 2012 in the USA. Biologics or tofacitinib provide clinically important improvements in pain, function and HRQoL in people not responding to traditional DMARDs such as methotrexate (MTX) (Boyce 2016; Strand 2008). Although biosimilars (generic medications for biologics) are available in the USA, Europe and other regions, these were not available at the literature review cut‐off. Therefore, our network meta‐analysis and systematic review includes biologics or tofacitinib.
How the intervention might work
Systemic and joint inflammation in RA is mediated by the activation of several potential targets including T‐cells (Cope 2008), B‐cells (Buggati 2014), macrophages (Szekanecz 2007), and other immune cells (Woolley 2003) in response to an environmental trigger/antigen, associated with expression of chemokines, metalloproteinases and inflammatory cytokines (TNF‐alpha, IL‐1, IL‐6 etc.) (Brennan 2008; Choy 2001) and activation of host cells such as fibroblasts, osteoclasts and chondrocytes leading to bone and cartilage destruction, a hallmark of RA (Brennan 2008; Connell 2006). Treatment guidelines published recently ( Saag 2008; Singh 2012; Singh 2016a; Smolen 2014) and consensus statements (Furst 2008; Furst 2010; Furst 2012) highlight the current evidence and the role of biologics or tofacitinib in the management of RA.
Why it is important to do this overview
Biologics are used in a variety of scenarios, most commonly when someone has a sub‐optimal response (DMARD/MTX‐inadequate responders (MTX‐IR)) or intolerance to traditional DMARDs such as MTX (Singh 2016a). Tofacitinib is also used in this patient population. It is not well known what role, if any, these drugs can play in the treatment of people with RA who are MTX‐naive, although this is not a current treatment option in many countries due to their greater costs. It is not clear whether or not they are more effective than traditional DMARDs and how the harms compare to traditional DMARDs in people with RA who are MTX‐naive.
Existing Cochrane systematic reviews of biologics have included trials that evaluated the benefits and harms of single biologics compared with either placebo, MTX or other DMARDs. But to inform choice of biologic, data about the comparative benefits and harms of different biologics is needed. Ideally, evaluation of comparative effectiveness requires head‐to‐head comparison studies, but when these are scant (Gabay 2013; Schiff 2008a; Weinblatt 2013), indirect comparisons that use a common comparator may be informative (Song 2003). Use of all available data from both direct and indirect comparisons is the essence of network meta‐analysis (NMA). Our review differs from the usual systematic reviews, in that it is not intended to examine only one intervention for RA but aims to systematically review and simultaneously compare the existing randomized trials of biologics or tofacitinib for RA and, while doing so, consider both direct and indirect evidence using a network meta‐analysis (NMA) (Becker 2008; Puhan 2014).
Our previous overview and NMA of biologics for RA was performed in 2009 (Singh 2009) and is ready for an update. Due to feasibility issues, an a priori decision was made to examine use of biologics or tofacitinib in four RA populations separately:
-
methotrexate‐naive (people who have not previously been treated with methotrexate; MTX‐naive) (this publication);
-
methotrexate/disease‐modifying anti‐rheumatic drug incomplete (inadequate) responder (MTX/DMARD‐IR, that is, people whose treatment with MTX/DMARDs failed due to lack of efficacy (primary or secondary), adverse event, patient preference etc. or a combination of these reasons), assessing the effect of biologic + MTX/DMARD (Singh 2016b);
-
methotrexate/disease‐modifying anti‐rheumatic drug incomplete (inadequate) responder (MTX/DMARD‐IR), assessing the effect of biologic monotherapy (Singh 2016c); and
-
biologic‐experienced (people whose treatment with biologic failed due to lack of efficacy (primary or secondary), adverse event, cost, patient preference etc. or a combination of these reasons (Singh 2017).
Objectives
To compare the benefits and harms of biologics (abatacept, adalimumab, anakinra, certolizumab pegol, etanercept, golimumab, infliximab, rituximab, tocilizumab) and small molecule tofacitinib versus comparator (methotrexate (MTX)/other DMARDs) in people with RA who are naive to methotrexate.
Methods
Criteria for considering reviews for inclusion
NOTE: this update uses individual studies, not reviews, for the basis of all analyses.
Randomized controlled trials (RCTs) of biologics or tofacitinib for RA in people who are MTX‐naive.
Types of studies
Our 2009 review only included studies that examined the efficacy/safety of standard‐dose biologics. for the 2015 update we expanded our inclusion criteria to include studies with any dose of biologic, provided they had clinically relevant outcomes. We included all nine approved biologics for RA (TNF biologics (adalimumab, certolizumab pegol, etanercept, golimumab, infliximab) and non‐TNF biologics (abatacept, anakinra, rituximab, tocilizumab)) and also searched for trials of tofacitinib.
Types of participants
Adults 18 years or older, with RA meeting the 1987 American College of Rheumatology (ACR) classification criteria for RA (Arnett 1988) or the 2010 ACR/European League Against Rheumatism (EULAR) classification criteria for RA (Aletaha 2010), who are MTX‐naive.
Types of interventions
TNF biologics: adalimumab, certolizumab pegol, etanercept, golimumab, infliximab; or non‐TNF biologics: abatacept, anakinra, rituximab, tocilizumab; or tofacitinib used alone or in combination with traditional DMARD/other biologic compared to placebo alone or to placebo plus traditional DMARDs or biologics or combinations of DMARDs.
Types of outcome measures
Primary/major outcomes
We pre‐specified seven outcomes, ACR50, Health Assessment Questionnaire (HAQ), RA disease remission, radiographic progression, withdrawals due to adverse events, serious adverse events (SAEs) and cancer.
-
ACR50, defined as 50% improvement in both tender and swollen joint counts and 50% improvement in at least three of the following five variables: patient global assessment, physician global assessment, pain score, function measurement with instruments such as HAQ score, and acute phase reactant (erythrocyte sedimentation rate (ESR) or C‐reactive protein (CRP) (Chung 2006; Felson 1995). We chose ACR50, as clinical and statistical evidence supports this as the preferred endpoint for contemporary RA clinical trials (Ghogomu 2014). We specified that we would assess outcomes at the longest duration of follow‐up. Most RA trials assess benefits and harms outcomes between four and six months, with some trials assessing longer‐term outcomes.
-
Function measured by HAQ score or modified HAQ calculated as score changes (Fries 1980; Pincus 1983) and the proportion achieving minimal clinically important difference on HAQ 0.22 or less (Wells 1993).
-
RA disease remission defined as DAS less than 1.6 or DAS28 less than 2.6 (Fransen 2005; Prevoo 1996).
-
Radiographic progression, as measured by Larsen/Sharp/modified Sharp scores (Larsen 1977; Sharp 1971; Van der Heijde 1989).
-
Withdrawals due to adverse events (Ioannidis 2004)
-
Serious adverse events (SAEs) (Ioannidis 2004)
-
Cancer
We recognize that RCTs included in this overview are limited in their ability to assess long term safety, since rare or delayed effects will not be detected. We therefore also searched websites of various regulatory agencies, including the US Food and Drug Administration (FDA), Health Canada and European Medicines Agency (EMA) to summarize warnings related to each of the biologics.
Search methods for identification of reviews
NOTE: this update uses individual studies, not reviews, for the basis of all analyses.
We conducted a search starting at the end date of last search and up to June 2015 (one search and analysis update to February 2014 and a second one to June 2015) for the 2015 update. A Cochrane Information Specialist (TR) conducted an updated search for the 2015 update to identify individual studies in multiple databases, namely: the Cochrane Central Register of Controlled Trials (CENTRAL; in The Cochrane Library, 2015, Issue 1), MEDLINE (via OVID 1946 to 11 February 2015), and Embase (via OVID 1947 to 11 February 2015). We considered the 31 studies in the 2009 version (Singh 2009), which contained all people with RA, including those that were MTX‐naive. We searched trials registers, including clinicaltrials.gov and the WHO trials register for ongoing studies, who.int/ictrp/en/.
Data collection and analysis
Selection of reviews
Two abstractors (SN/TC) reviewed the results of the search (titles and abstracts), and obtained the full texts of articles identified as relevant for this update.
Data extraction and management
Two pairs of abstractors (SN/TC; TC/JS), within each pair, independently extracted data from the reviews using a predefined data extraction form created as a Microsoft Excel® spreadsheet for the 2015 update and independently abstracted additional data for all doses (SN/JS) and additional outcomes, since the original review only included standard doses of biologics and not all outcomes were the same. TC double‐checked all data for accuracy after the initial abstraction.
We resolved disagreements by discussion with JS or GW, as appropriate. We obtained additional information from the original RCTs where necessary, from the online supplementary materials or by contacting study authors. AM and JS designed the spreadsheets.
Assessment of methodological quality of included reviews
NOTE: this update uses individual studies, not reviews, for the basis of all analyses.
Two abstractors (JS/TC; SN/TC) independently evaluated the risk of bias of included studies and overall quality of the evidence as summarized below.
Risk of bias of included trials
Two abstractors (JS/ETG) independently assessed risk of bias for each included trial using the Cochrane 'Risk of bias' tool. We assessed the risk of bias on each of the following criteria: random sequence generation, allocation concealment, presence of blinding (participants, personnel, and outcome assessors) in the studies, incomplete outcome data, and selective outcome reporting (Higgins 2011). The risk of bias was assessed as recommended: low risk, high risk, or unclear risk (either lack of information or uncertainty over the potential for bias). We resolved disagreements by discussion between the review authors.
Quality of evidence
Two review authors (JS and AM) independently assessed the overall quality of the evidence for each outcome using the GRADE approach (Guyatt 2008). The GRADE approach improves reliability in comparison to intuitive judgments about the certainty of a body of evidence (Mustafa 2013). The GRADE system specifies four levels of quality of evidence.
-
High quality for randomized trials; or double‐upgraded observational studies.
-
Moderate quality for downgraded randomized trials; or upgraded observational studies.
-
Low quality for double‐downgraded randomized trials; or observational studies.
-
Very low quality for triple‐downgraded randomized trials; or downgraded observational studies; or case series/case reports.
Randomized trial evidence could be downgraded by one or two levels depending on the presence of five factors.
-
Serious (‐1) or very serious (‐2) limitation to study quality
-
Important inconsistency (‐1)
-
Some (‐1) or major (‐2) uncertainty about directness
-
Imprecise or sparse data (‐1)
-
High probability of reporting bias (‐1)
Data synthesis
Statistical analyses
We performed the standard and NMA analyses including important factors such as the route of biologic (intravenous versus subcutaneous), dose (low dose (LD) versus standard dose (SD) versus high dose (HD)) and concomitant MTX/DMARD, for the 2015 update. We also performed pre‐specified analyses for subgroups by trial and RA disease duration, since they might contribute to differences in benefits and harms of biologics. In order to handle rare events in direct comparison meta‐analyses, we used Peto's odds ratios as the effect measure. For other outcomes, we used odds ratio (OR) or mean difference (MD) as effect measures. We considered P values less than 0.05 and 95% confidence intervals (CI) or credible intervals (CrI) that did not include 1 to be statistically significant.
The standard meta‐analysis (direct comparisons) determined the effectiveness of treatments directly compared to each other and was performed using Review Manager 5 (RevMan5) (RevMan 2014). We used the I2 statistic for quantifying heterogeneity of the results in individual studies (Higgins 2003), since heterogeneity is a common issue encountered while performing meta‐analyses ( Higgins 2002; Thompson 1999). This statistic combines the Chi2 statistic and the number of studies contributing to each summary estimate in the figure. In all the forest plots presenting effect measure data per treatment, we applied the random‐effects model as the default option (DerSimonian 2007) for illustrative purposes. We estimated the number needed to treat for an additional beneficial outcome (NNTB) and number needed to treat for an additional harmful outcome (NNTH), with 95% CIs on the basis of the derived OR comparing treatment to control and considering the overall event rate in the placebo group as a proxy for the community baseline event rate. This method enables direct translation into clinical practice (Osiri 2003), using Visual Rx with the overall (pooled) number of responders within the available studies as proxy for the expected rate of responders in a given RA population (Cates 2009).
We conducted a network meta analysis (NMA) based on a Bayesian mixed treatment comparison (MTC) approach, using the WinBUGS statistical software for the Bayesian analysis (MRC Biostatistics Unit, Cambridge, UK) (Spiegelhalter 2003). We performed a Markov Chain Monte Carlo (MCMC) simulation with at least 5000 or more iterations (as needed) to derive the corresponding 95% CrIs. We used informative priors for the variance parameters (Turner 2012). Where considered more suitable, we used vague priors for basic parameters. Assessment of model fit for the NMA was based on deviance information criterion (DIC) and comparison of residual deviance (Spiegelhalter 2003). We assessed trace plots and the Brooks‐Gelman‐Rubin statistic to ensure that convergence was reached (Spiegelhalter 2003). We applied the continuity correction for zero event cells to make non‐zero cells where needed. In order to assess inconsistency (conflict between direct and indirect evidence (Wells 2009), we compared deviance and deviance information criteria (DIC) statistics in fitted consistency and inconsistency models (Dias 2011) and examined the inconsistency plot. We chose between the random‐effects model and the fixed‐effect model based on the assessment of the DIC and comparison of residual deviance to number of unconstrained data points.
We used OR as effect measure for dichotomous outcomes, that is, the number of participants achieving ACR50, remission, serious adverse events, and withdrawals due to adverse events; and MD for continuous outcomes such as HAQ and radiographic progression. For cancer data, we anticipated that events would be rare (Bradburn 2007; Sweeting 2004). In order to handle these expected sparse data, we applied an empirical Bayes (treatment arm‐based) approach (Salanti 2008). AK and AH performed data analyses, under the supervision of GW.
Sub‐group analyses/planned comparisons
In addition to the biologic + MTX versus comparator and biologic alone (monotherapy) versus comparator analysis, we conducted the following a priori subgroup analyses using the standard meta‐analysis or NMA.
-
By type of biologic: TNF biologics versus non‐TNF biologics
-
By type of biologic, receptor versus antibody: medications targeting TNF receptor (etanercept) versus monoclonal antibodies against TNF (adalimumab, certolizumab pegol, golimumab, infliximab) versus non‐TNF biologic
-
By biologic dose: high‐dose (HD) versus standard‐dose (SD) versus low‐dose (LD) biologic. We expanded the definitions of standard dose of each biologic from 2009 to include the newer biologics and tofacitinib, as follows:
-
abatacept intravenous: every four weeks intravenously at 500 mg dose in people weighing less than 60 kg, 750 mg in people weighing 60 kg to 100 kg and 1000 mg in people weighing more than 100 kg, after the initial dosing regimen of baseline, two‐ and four‐week infusions;
-
abatacept subcutaneous: 125 mg subcutaneous weekly;
-
adalimumab: 40 mg subcutaneous every two weeks;
-
anakinra: 100 mg subcutaneous every day;
-
certolizumab pegol: 400 mg initially and at weeks 2 and 4, followed by 200 mg every other week (for maintenance dosing, 400 mg every four weeks can be considered);
-
etanercept: 25 mg subcutaneous twice weekly or 50 mg subcutaneous once weekly;
-
golimumab: 50 mg administered by subcutaneous injection once a month;
-
infliximab: 3 mg/kg intravenous every eight weeks after initial dosing at 0, 2 and 6 weeks;
-
rituximab: two 1000 mg intravenous doses two weeks apart;
-
tocilizumab intravenous: starting dose is 4 mg per kg every four weeks followed by an increase to 8 mg per kg every four weeks based on clinical response;
-
tocilizumab subcutaneous: 162 mg administered subcutaneously every other week, followed by an increase to every week based on clinical response for people weighing less than 100 kg, and 162 mg administered subcutaneously every week for people weighing 100 kg or more;
-
tofacitinib: 5 mg orally twice a day, or 10 mg once daily.
-
The following subgroup analyses, specified a priori, were also performed using NMA.
-
Trial duration: short duration (six months or less), intermediate duration (between six and 12 months) or long duration (more than 12 months)
-
RA disease duration: early RA (mean/median duration of less than two years) (Boers 2001), established RA (mean/median duration 2 to 10 years) or late RA (mean/median duration more than 10 years) (Barlow 1999).
Results
Description of included reviews
NOTE: this update uses individual studies, not reviews, for the basis of all analyses.
Figure 1 shows the overall study selection process. We identified a total of 19 trials from 8771 titles (including five of the 31 RCTs from the Cochrane Reviews in our original 2009 overview), including 6485 MTX‐naive participants. Data for analyses were available from all trials. In 17 trials the comparator was MTX, while MTX + methylprednisolone was the comparator in two studies (Durez 2007; Nam 2014a). Therefore, we refer to the comparator as "MTX" for simplicity throughout the Results, Abstract, Plain language summary, Discussion and tables.

Study flow diagram
Characteristics of included studies are provided in Table 1. Study sample size ranged from 20 to 1049 participants. Nine studies were performed in participants with established RA (2 to 10 years), nine studies were performed in participants with early RA (less than two years) and one study included participants with unclear disease duration. These studies included four TNF biologics (adalimumab, etanercept, golimumab and infliximab) and two non‐TNF biologics (abatacept and rituximab).
| Study name | Biologic(s) | Biologic dose(s) | Number of study arms | Non‐biologic comparator | Concomitant use of MTX | Trial duration | RA duration | Biologic‐naive | Total number of participants |
| Adalimumab | SD | 2 | MTX + PL | Yes | 13 months | Established | Yes | 148 | |
| Infliximab | SD | 2 | MTX + PL | Yes | 8 years | Established | No | 20 | |
| Adalimumab (+/‐ MTX) | SD | 3 | MTX + PL | Yes | 24 months | Established | Yes | 799 | |
| Adalimumab | SD | 2 | MTX + PL | Yes | 12 months | Early | Yes | 172 | |
| Infliximab | SD | 2 | MP + MTX | Yes | 12 months | Early | No | 29 | |
| Emery 2008 (COMET) | Etanercept | SD | 2 | MTX + PL | Yes | 12 months | Established | Yes | 542 |
| Emery 2009 (GO‐BEFORE) | Golilumab (+/‐ MTX) | SD, HD | 4 | MTX + PL | Yes | 12 months | Established | No | 637 |
| Kavanaugh 2013 (OPTIMA) | Adalimumab | SD | 2 | MTX + PL | Yes | 6 months | Established | No | 1032 |
| Etanercept | SD | 2 | MTX | No | 6 months | Unknown | Yes | 26 | |
| Infliximab | SD | 2 | MP + MTX | Yes | 6 months | Early | Yes | 112 | |
| Etanercept | SD | 2 | MTX + PL | Yes | 12 months | Early | Yes | 110 | |
| Infliximab | SD | 2 | MTX + PL | Yes | 12 months | Early | Yes | 20 | |
| Infliximab | SD | 2 | MTX + PL | Yes | 24 months | Early | Yes | 93 | |
| Adalimumab | SD | 2 | MTX + PL | Yes | 12 months | Established | No | 65 | |
| St Clair 2004 (ASPIRE) | Infliximab | SD, HD | 3 | MTX + PL | Yes | 12 months | Early | Yes | 1049 |
| Rituximab | SD, LD | 3 | MTX + PL | Yes | 24 months | Early | Yes | 748 | |
| Adalimumab | SD | 2 | MTX + PL | Yes | 6 months | Early | Yes | 334 | |
| Infliximab | SD | 2 | MTX | Yes | 12 months | Established | Yes | 40 | |
| Abatacept | SD | 2 | MTX + PL | Yes | 24 months | Established | No | 509 |
HD: high dose; LD: low dose; MTX: methotrexate; PL: placebo; SD = standard dose
Eighteen trials included a biologic + MTX as the intervention of interest. Only one trial studied a biologic monotherapy (etanercept) (Marcora 2006). Most (n = 14) studies had a duration of 6 to 13 months, while five studies had a duration of 24 months or greater. We found no tofacitinib studies eligible for inclusion, since in the only study that enrolled participants who were MTX‐naive (Lee 2014), more than one‐third of the participants were not naive to other traditional DMARDs and data were not reported separately.
Three hundred and fifty‐one studies were excluded, and the main reasons for exclusion were wrong drug exposure, duplicate studies or abstracts. One hundred and twenty‐six of the 351 excluded studies were included in the other split updates. See additional details in Appendix 1. Ongoing trials listed in trial registers are provided in Appendix 2.
Methodological quality of included reviews
For the 2015 update, two reviewers abstracted these study characteristics from the published reports of the individual trials.
Risk of bias of included trials in the 2015 update
Detailed 'Risk of bias' assessments for each trial including the reasons for each judgment are available at the Cochrane Musculoskeletal website Risk of bias A and Risk of bias B.
Allocation (selection bias)
All trials were described as randomized, however, only eight of 19 (42%) reported adequate sequence generation and we assessed them as low risk, while 11 (58%) did not describe the method used and we assessed them as unclear risk. We assessed allocation concealment as low risk in seven (37%) trials, unclear in 11 (58%) trials, and high risk in one (5%) trial.
Blinding (performance and detection bias)
We judged a total of eight (42%) trials at low risk of performance bias, and seven (37%) at unclear risk of bias. In four (21%) trials, participants were not blinded and these trials were at high risk of performance bias.
We assessed low risk of detection bias in nine (47%) trials, high risk of detection bias in three (16%) and unclear risk in seven (37%) trials.
Incomplete outcome data (attrition bias)
We judged more trials (10 out of 19; 53%) at low risk of attrition bias and nine (47%) trials were at high risk of attrition bias because more than 20% of participants withdrew/dropped out.
Selective reporting (reporting bias)
We judged four (21%) trials at low risk of bias and fifteen (79%) trials as unclear risk, since the study protocols were not available and we did not have enough information in the study report to assess selective reporting.
Other potential sources of bias
We assessed major baseline imbalance and 17 (89%) trials had low risk of bias, and two (11%) had high risk of bias.
Effect of interventions
In comparison to the original 2009 version, the 2015 update has several new key aspects:
-
instead of six biologics, we included all nine biologics and tofacitinib in our search although only studies from six biologics met the criteria for this review;
-
we included cancer and serious adverse events as outcomes;
-
we included all doses of biologics and analyzed by dose;
-
we analyzed outcomes by whether MTX/other DMARDs were used concomitantly or not; and
-
we used a Bayesian approach rather than a frequentist approach for analyses and reported odds ratios and 95% CrI.
For the 2015 version, we extracted all relevant data from the included RCTs. We pre‐specified 7 outcomes, ACR50, HAQ, RA disease remission, radiographic progression, withdrawals due to adverse events, serious adverse events (SAEs) and cancer. Analyses and comparisons for all pre‐specified outcomes were performed where data were available.
We followed the principles below while describing results to keep this review as comprehensive as possible.
-
We first present the odds ratios for the biologic + MTX and biologic alone (monotherapy) versus comparator, followed by pre‐specified comparisons (e.g. TNF versus non‐TNF biologic), followed by subgroup analyses, where data were available.
-
In the odds ratio analyses, only the last set of odds ratios compare the biologic by dose; other analyses prior to the dose analysis include all doses and provide comparison by a different characteristic of interest, for example, the type of biologic.
-
In the main analyses, when not specified, the biologic is in standard dose. We specify high dose and low dose in every instance when considered.
-
For biologics that are approved for only one route of administration (i.e. intravenous or subcutaneous only), we do not specify the route. The mention of the drug without the route implies that the only approved route for the drug was: subcutaneous (SC) for adalimumab, certolizumab pegol, etanercept and golimumab; intravenous (IV) for infliximab, and rituximab. Since only two biologics are approved for both subcutaneous and intravenous use (tocilizumab and abatacept), we specify these routes when describing results for abatacept. For other biologics, when not specified, the approved route of use is implicit. We recognize that some trials prior to approval of biologics used a different route in many cases (e.g. intravenous for golimumab).
-
We refer to the lack of statistical significance at P < 0.05 as 'not associated' or 'not significantly associated'. We also have additional comments about clinical significance, where applicable.
'Summary of findings' table
The 'Summary of findings' table presents both the direct estimates of biologics versus MTX with the quality of evidence followed by estimates from the NMA with the quality of evidence (Table 2). Absolute and risk ratio differences are provided for each estimate. We converted from OR in the NMA to RR in the 'Summary of findings' table and Abstract for ease of interpretation for clinicians.
| Comparison | Direct evidence | Network meta‐analysis | ||||||
| Outcome: ACR50 | No. of participants (studies) | RR (95% CI) | Absolute risk difference, NNTB | Quality of evidence (GRADE) | RR (95% CrI) | Absolute risk difference, NNTB | Quality of evidence (GRADE) | |
| Biologics + MTX | versus comparator | 5720 (14 studies) | 1.40 (1.30 to 1.49) | 16% (13% to 20%) NNTB = 7 (6 to 8) | ⊕⊕⊕⊖ moderate (downgraded for inconsistency)1 | n/a | ||
| TNF biologic alone (without MTX) | versus comparator | 850 (2 studies) | 0.94 (0.73 to 1.22) | ‐2% (‐11% to 7%) NNTB = n/a | ⊕⊕⊕⊖ moderate (downgraded for imprecision)2 | 1.00 (0.82 to 1.21) | 0% (‐8% to 9%) NNTB = n/a | ⊕⊕⊖⊖ low (downgraded for imprecision and indirectness)2,4 |
| TNF biologic + MTX | versus comparator | 4463 (12 studies) | 1.44 (1.34 to 1.54) | 17% (13% to 21%) NNTB = 6 (5 to 8) | ⊕⊕⊕⊕ high3 | 1.42 (1.30 to 1.54) | 18% (13% to 22%) NNTB = 6 (5 to 8) | ⊕⊕⊕⊖ moderate (downgraded for indirectness)4 |
| Non‐TNF biologic + MTX | versus comparator | 1257 (2 studies) | 1.27 (1.14 to 1.42) | 13% (7% to 19%) NNTB = 8 (6 to 14) | ⊕⊕⊕⊕ high3 | 1.31 (1.11 to 1.52) | 13% (5% to 22%) NNTB = 8 (5 to 22) | ⊕⊕⊕⊖ moderate (downgraded for indirectness)4 |
| Outcome: HAQ score 0‐3 (higher = worse): a measure of function | No. of participants (studies) | Direct evidence | Network meta‐analysis | |||||
| MD (95% CI) | Absolute risk difference, NNTB | Quality of evidence (GRADE) | MD (95% CrI) | Absolute risk difference, NNTB | Quality of evidence (GRADE) | |||
| Biologics + MTX | versus comparator | 3872 (13 studies) | ‐0.10 (‐0.16 to ‐0.04) | ‐3.3% (‐5.3% to ‐1.3%) NNTB = 4 (2 to 15) | ⊕⊕⊕⊖ moderate (downgraded for inconsistency)5 | n/a | ||
| TNF biologic alone (without MTX) | versus comparator | 557 (2 studies) | 0.09 (‐0.24 to 0.41) | 3% (‐8% to 13.7%) NNTB = n/a | ⊕⊕⊕⊖ moderate (downgraded for imprecision)2 | 0.17 (‐0.19 to 0.54) | 5.7% (‐6.3% to 18%) NNTB = n/a | ⊕⊕⊖⊖ low (downgraded for imprecision and indirectness)2,4 |
| TNF biologic + MTX | versus comparator | 2615 (11 studies) | ‐0.09 (‐0.26 to 0.07) | ‐3% (‐8.7% to 2.3%) NNTB = n/a | ⊕⊕⊖⊖ low (downgraded for imprecision and inconsistency)2,6 | ‐0.08 (‐0.25 to 0.07) | ‐2.7% (‐8.3% to 2.3%) NNTB = n/a | ⊕⊕⊖⊖ low (downgraded for imprecision and indirectness)2,4 |
| Non‐TNF biologic + MTX | versus comparator | 1257 (2 studies) | ‐0.22 (‐0.26 to ‐0.18) | ‐7.3% (‐8.7% to ‐6%) NNTB = 2 (2 to 3) | ⊕⊕⊕⊖ moderate (downgraded for inconsistency)7 | ‐0.22 (‐0.55 to 0.11) | ‐7.3% (‐18.3% to 3.7%) NNTB = n/a | ⊕⊕⊖⊖ low (downgraded for imprecision and indirectness)2,4 |
| Outcome: Remission (defined as DAS < 1.6 or DAS28 < 2.6) | No. of participants (studies) | Direct evidence | Network meta‐analysis | |||||
| RR (95% CI) | Absolute risk difference, NNTB | Quality of evidence (GRADE) | RR (95% CrI) | Absolute risk difference, NNTB | Quality of evidence (GRADE) | |||
| Biologics + MTX | versus comparator | 5128 (15 studies) | 1.62 (1.33 to 1.98) | 15% (11% to 19%) NNTB = 5 (6 to 7) | ⊕⊕⊕⊖ moderate (downgraded for inconsistency)8 | n/a | ||
| TNF biologic alone (without MTX) | versus comparator | 850 (2 studies) | 1.08 (0.83 to 1.41) | 2% (‐3% to 8%) NNTB = n/a | ⊕⊕⊕⊖ moderate (downgraded for imprecision)2 | 1.02 (0.74 to 1.39) | 1% (‐7% to 11%) NNTB = n/a | ⊕⊕⊖⊖ low (downgraded for imprecision and indirectness)2,4 |
| TNF biologic + MTX | versus comparator | 4463 (12 studies) | 1.55 (1.22 to 1.96) | 14% (9% to 19%) NNTB = 7 (5 to 10) | ⊕⊕⊕⊖ moderate (downgraded for inconsistency)9 | 1.62 (1.40 to 1.86) | 18% (12% to 23%) NNTB = 7 (5 to 10) | ⊕⊕⊕⊖ moderate (downgraded for indirectness)4 |
| Non‐TNF biologic + MTX | versus comparator | 1257 (2 studies) | 2.10 (1.45 to 3.04) | 19% (15% to 24%) NNTB = 6 (4 to 9) | ⊕⊕⊕⊖ moderate (downgraded for inconsistency)10 | 1.85 (1.46 to 2.28) | 24% (13% to 35%) NNTB = 6 (4 to 10) | ⊕⊕⊕⊖ moderate (downgraded for indirectness)4 |
| Outcome: Radiographic progression on Sharp/Van der Heijde modification (0‐448 points) | No. of participants (studies) | Direct evidence | Network meta‐analysis | |||||
| MD (95% CI) | Absolute risk difference, NNTB | Quality of evidence (GRADE) | MD (95% CrI) | Absolute risk difference, NNTB | Quality of evidence (GRADE) | |||
| Biologics + MTX | versus comparator | 2256 (5 studies) | ‐2.56 (‐6.03 to 0.92) | ‐0.57% (‐1.35% to 0.21%) NNTB = n/a | ⊕⊕⊖⊖ low (downgraded for imprecision and inconsistency)2,11 | n/a | ||
| TNF biologic + MTX | versus comparator | 1747 (4 studies) | ‐3.18 (‐6.80 to 0.43) | ‐0.71% (‐1.52% to 959.82%) NNTB = n/a | ⊕⊕⊖⊖ low (downgraded for imprecision and inconsistency)2,12 | ‐3.73 (‐5.78 to ‐1.62) | ‐0.83% (‐1.29% to ‐0.36%) NNTB = 3 (3 to 7) | ⊕⊕⊕⊖ moderate (downgraded for indirectness)4 |
| Non‐TNF biologic + MTX | versus comparator | 509 (1 study) | ‐0.43 (‐2.04 to 1.18) | ‐0.22% (‐0.46% to 0.26%) NNTB = n/a | ⊕⊕⊖⊖ low (downgraded for imprecision and inconsistency)2,11 | ‐0.42 (‐4.22 to 3.41) | ‐0.09% (‐0.94% to 0.76%) NNTB = n/a | ⊕⊕⊖⊖ low (downgraded for imprecision and indirectness)2,4 |
| Outcome: Withdrawals due to adverse events | No. of participants (studies) | Direct evidence | Network meta‐analysis | |||||
| RR (95% CI) | Absolute risk difference, NNTB | Quality of evidence (GRADE) | RR (95% CrI) | Absolute risk difference, NNTB | Quality of evidence (GRADE) | |||
| Biologics + MTX | versus comparator | 5800 (14 studies) | 1.32 (0.89 to 1.97) | 2% (0% to 4%) NNTH = n/a | ⊕⊕⊖⊖ low (downgraded for inconsistency and imprecision )1,2 | n/a | ||
| TNF biologic alone (without MTX) | versus comparator | 850 (2 studies) | 1.14 (0.62 to 2.10) | 0% (‐4% to 4%) NNTH = n/a | ⊕⊕⊖⊖ low (downgraded for serious imprecision)13 | 0.93 (0.41 to 1.90) | 0% (‐2% to 3%) NNTH = n/a | ⊕⊕⊖⊖ low (downgraded for imprecision and indirectness)2,4 |
| TNF biologic + MTX | versus comparator | 4543 (12 studies) | 1.60 (1.10 to 2.32) | 3% (1% to 4%) NNTH = 35 (17 to 183) | ⊕⊕⊕⊖ moderate (downgraded for imprecision)14 | 1.68 (1.16 to 2.56) | 3% (1% to 5%) NNTH = 31 (14 to 138) | ⊕⊕⊕⊖ moderate (downgraded for indirectness)4 |
| Non‐TNF biologic + MTX | versus comparator | 1257 (2 studies) | 0.56 (0.31 to 1.01) | ‐2% (‐5% to 1%) NNTH = n/a | ⊕⊕⊖⊖ low (downgraded for serious imprecision)13 | 0.56 (0.25 to 1.29) | ‐2% (‐3% to 1%) NNTH = n/a | ⊕⊕⊖⊖ low (downgraded for imprecision and indirectness)2,4 |
| Outcome: Serious adverse events | No. of participants (studies) | Direct evidence | Network meta‐analysis | |||||
| RR (95% CI) | Absolute risk difference, NNTB | Quality of evidence (GRADE) | RR (95% CrI) | Absolute risk difference, NNTB | Quality of evidence (GRADE) | |||
| Biologics + MTX | versus comparator | 4850 (12 studies) | 1.05 (0.87 to 1.26) | 1% (‐1% to 3%) NNTH = n/a | ⊕⊕⊕⊖ moderate (downgraded for imprecision)2 | n/a | ||
| TNF biologic alone (without MTX) | versus comparator | 319 (1 study) | 0.46 (0.16 to 1.29) | ‐4% (‐8% to 1%) NNTH = n/a | ⊕⊕⊖⊖ low (downgraded for serious imprecision)13 | 0.52 (0.16 to 1.30) | ‐5% (‐9% to 3%) NNTH = n/a | ⊕⊕⊖⊖ low (downgraded for imprecision and indirectness)2,4 |
| TNF biologic + MTX | versus comparator | 3593 (10 studies) | 1.14 (0.92 to 1.42) | 1% (‐1% to 3%) NNTH = n/a | ⊕⊕⊕⊖ moderate (downgraded for imprecision)2 | 1.16 (0.90 to 1.51) | 2% (‐1% to 4%) NNTH = n/a | ⊕⊕⊖⊖ low (downgraded for imprecision and indirectness)2,4 |
| Non‐TNF biologic + MTX | versus comparator | 1257 (2 studies) | 0.87 (0.64 to 1.18) | ‐1% (‐5% to 2%) NNTH = n/a | ⊕⊕⊖⊖ low (downgraded for serious imprecision)13 | 0.87 (0.57 to 1.34) | ‐1% (‐4% to 3%) NNTH = n/a | ⊕⊕⊖⊖ low (downgraded for imprecision and indirectness)2,4 |
| Outcome: Cancer (note: Peto OR used but can interpret as RR due to low event rate) | No. of participants (studies) | Direct evidence | Network meta‐analysis | |||||
| RR (95% CI) | Absolute risk difference, NNTB | Quality of evidence (GRADE) | RR (95% CrI) | Absolute risk difference, NNTB | Quality of evidence (GRADE) | |||
| Biologics + MTX | versus comparator | 4611 (11 studies) | 0.71 (0.38 to 1.33) | 0% (0% to 0%) NNTH = n/a | ⊕⊕⊖⊖ low (downgraded for serious imprecision)13 | n/a | ||
| TNF biologic alone (without MTX) | versus comparator | 850 (2 studies) | 0.79 (0.24 to 2.61) | 0% (‐2% to 1%) NNTH = n/a | ⊕⊕⊖⊖ low (downgraded for serious imprecision)13 | 0.94 (0.25 to 3.18) | 0% (‐1% to 2%) NNTH = n/a | ⊕⊕⊖⊖ low (downgraded for imprecision and indirectness)2,4 |
| TNF biologic + MTX | versus comparator | 3863 (10 studies) | 0.77 (0.35 to 1.69) | 0% (0% to 0%) NNTH = n/a | ⊕⊕⊖⊖ low (downgraded for serious imprecision)13 | 0.81 (0.36 to 1.73) | 0% (‐1% to 0%) NNTH = n/a | ⊕⊕⊖⊖ low (downgraded for imprecision and indirectness)2,4 |
| Non‐TNF biologic + MTX | versus comparator | 748 (1 study) | 0.62 (0.22 to 1.77) | 0% (‐3% to 1%) NNTH = n/a | ⊕⊕⊖⊖ low (downgraded for serious imprecision)13 | 0.64 (0.20 to 2.12) | 0% (‐1% to 1%) NNTH = n/a | ⊕⊕⊖⊖ low (downgraded for imprecision and indirectness)2,4 |
Comparator = MTX and/or DMARD
GRADE Working Group grades of evidence
High quality (⊕⊕⊕⊕): we are very confident that the true effect lies close to that of the estimate of the effect
Moderate quality (⊕⊕⊕⊖): we are moderately confident in the effect estimate: the true effect is likely to be close to the estimate of the effect, but there is a possibility that it is substantially different
Low quality (⊕⊕⊖⊖): our confidence in the effect estimate is limited: the true effect may be substantially different from the estimate of the effect
Very low quality (⊕⊖⊖⊖): we have very little confidence in the effect estimate: the true effect is likely to be substantially different from the estimate of effect
CI: confidence interval; CrI; credible interval; DAS: Disease Activity Score; DMARD: disease‐modifying anti‐rheumatic drug; MTX: methotrexate; n/a: not available; NNTB/NNTH: number needed to treat for an additional beneficial/harmful outcome; OR: odds ratio; RR: risk ratio; TNF: tumor necrosis factor
1Downgraded for inconsistency: I2= 51%.
2Downgraded for imprecision: 95% CI estimate includes both null effect and appreciable benefit or harm.
3No evidence of imprecision or inconsistency. Number of events > 300.
4Downgraded for indirectness/intransitivity due to differing participant characteristics (established vs late RA; types of failures); differing biologic doses and co‐interventions; and differing comparators.
5Downgraded for inconsistency: I2= 93%.
6Downgraded for inconsistency: I2= 90%.
7Downgraded for inconsistency: I2= 95%.
8Downgraded for inconsistency: I2= 75%.
9Downgraded for inconsistency: I2= 81%.
10Downgraded for inconsistency: I2= 65%.
11Downgraded for inconsistency: I2= 97%.
12Downgraded for inconsistency: I2= 96%.
13Downgraded twice for serious imprecision ‐ few events (< 300) and 95% CI estimate includes both null effect and appreciable benefit or harm.
14Downgraded for imprecision ‐ few events (< 300)
Direct estimates were fairly consistent with the NMA estimates for all seven outcomes. There was moderate‐quality evidence (downgraded for inconsistency) that biologics were associated with superior clinically meaningful and statistically significant improvements versus comparator in ACR50 and RA disease remission and physical function as measured by the HAQ did show a statistically significant difference but was not clinically meaningful. There was low‐quality evidence (downgraded for inconsistency and imprecision) that radiographic progression was not clinically meaningfully or statistically significantly reduced in those on biologics versus MTX. Based on moderate‐quality evidence, results for serious adverse events showed no statistically significant or clinically meaningful differences. Based on low‐quality evidence, results for withdrawals due to adverse and cancer were inconclusive, since the estimates included null effect as well as possibility of important harm.
Findings separately by TNF biologic and non‐TNF biologic
In standard meta‐analysis, based on high‐quality evidence, biologic + MTX was also associated with statistically significant and clinically meaningful higher odds of ACR50 compared to the comparator in both TNF biologic and non‐TNF biologic subgroups with risk ratio (RR) of 1.44 (95% CI 1.34 to 1.54) and 1.27 (95% CI 1.14 to 1.42) and absolute difference 17% (95% CI 13% to 21%) and 13% (95% CI 7% to 19%), and NNTB = 6 (95% CI 5 to 8) and = 8 (95% CI 6 to 14), respectively. Results were similar for the NMA.
In standard meta‐analysis, based on low‐quality evidence, compared to MTX, TNF biologic + MTX was associated with lower HAQ scores with better HAQ score improvement with mean difference of ‐0.09 (95% CI ‐0.26 to 0.07), which was neither statistically significant nor clinically meaningful. Based on moderate‐quality evidence, non‐TNF biologic + MTX was associated with better HAQ scores with statistically significant and clinically meaningful HAQ score improvement with a mean difference of ‐0.22 (95% CI ‐0.26 to ‐0.18) and an absolute difference of ‐7.3% (95% CI ‐8.7% to ‐6%) compared to MTX. Results did not show evidence of a clinically meaningful or statistically significant difference in TNF biologic monotherapy versus MTX.
In standard meta‐analysis, based on moderate‐quality evidence, TNF biologic + MTX showed a statistically significant and clinically meaningful higher rate of remission with RR of 1.55 (95% CI 1.22 to 1.96) and absolute difference 14% (95% CI 9% to 19%) and NNTB = 7 (95% CI 5 to 10), as did non‐TNF biologic + MTX with RR 2.10 (95% CI 1.45 to 3.04), absolute difference 19% (95% CI 15% to 24%) and NNTB = 6 (95% CI 4 to 9). Results were similar in the NMA.
In standard meta‐analysis, based on low‐quality evidence, TNF biologic + MTX showed a non‐statistically significant improvement in radiographic progression versus MTX with risk ratio of ‐3.18 (95% CI ‐6.80 to 0.43), absolute difference ‐0.71% (95% CI ‐1.52% to 959%). In NMA, this comparison was statistically significant with a difference of ‐3.73 (95% CrI ‐5.78 to ‐1.62), absolute difference , ‐0.83% (95% CI ‐1.29% to ‐0.36%) and NNTB = 3 (95%CI, 3 to 7), but the clinical significance of this difference was unclear. Non‐TNF biologic + showed a much lower non‐statistically significant improvement with an RR of ‐0.40 (95% CI ‐2.04 to 1.18), absolute difference ‐0.22% (95% CI ‐0.46% to 0.26%), which was also not significantly different in the NMA.
In standard meta‐analysis, based on moderate‐quality evidence, there was a clinically meaningful and statistically significant difference in increase in withdrawals due to adverse events in TNF biologic + MTX versus MTX with a RR of 1.60 (95% CI 1.10 to 2.32), absolute difference 3% (95% CI 1% to 4%) and NNTH = 35 (95% CI 17 to 183). Based on low‐quality evidence, there was no evidence of a clinically meaningful and statistically significant difference in this outcome among the non‐TNF biologic + MTX versus MTX, RR of 0.56 (95% CI 0.31 to 1.01), absolute difference ‐2% (95% CI ‐5% to 1%). Results were similar in the NMA.
In standard meta‐analysis, based on moderate‐quality evidence, there was no evidence of a statistically significant or clinically meaningful difference in serious averse events for TNF biologic + MTX versus MTX with a RR of 1.14 (95% CI 0.92 to 1.42), absolute difference 1% (95% CI ‐1% to 3%). Based on low‐quality evidence, there was no evidence of a clinically meaningful and statistically significant difference in the non‐TNF biologic + MTX versus MTX with a RR of 0.87 (95% CI 0.64 to 1.18), absolute difference ‐1% (95% CI ‐5% to 2%).
In standard meta‐analysis, based on low‐quality evidence, results were inconclusive for the risk of cancer for statistically significant or clinically meaningful difference for biologic + MTX versus MTX with a Peto's OR of 0.71 (95% CI 0.38 to 1.33) and an absolute difference of 0% (95% CI 0% to 0%). Results were also inconclusive for TNF biologic monotherapy versus MTX (there were no data for non‐TNF monotherapy). Results were similar in the NMA.
Number needed to treat for an additional beneficial outcome (NNTB) and number needed to treat for an additional harmful outcome (NNTH)
For ACR50, HAQ and remission, NNTB for biologics + MTX were 7, 4 and 5, respectively. NNTB ranged from 6 to 8 for ACR50 among TNF and non‐TNF biologic subgroups (both in combination with MTX). For HAQ, NNTB was 2 in the non‐TNF biologic (+ MTX) subgroup. NNTBs ranged from 6 to 7 among TNF and non‐TNF biologic subgroups for remission (both in combination with MTX). NNTBs for radiographic progression were not calculable for the direct comparisons but was 3 for the TNF biologic + MTX subgroup versus comparator in the NMA.
For the harms outcomes, only withdrawals due to adverse events provided an NNTH of 35 for the direct comparison for TNF biologic + MTX subgroup and 31 for the same subgroup in the NMA.
Since there were no statistically significant differences between TNF biologic monotherapy versus MTX (active comparator), NNTB and NNTH could not be calculated. All studies of biologic monotherapy were for TNF biologic monotherapy only, with none for non‐TNF biologic monotherapy.
Main analysis: comparison of the biologics with regard to benefit and harm
Primary/major benefit outcome: ACR50
Fourteen studies with 6153 participants reported ACR50. Of these, all studies included at least one arm with participants on a biologic with concomitant MTX. An example of a network diagram for MTX‐naive is shown in Figure 2 for ACR50.

Network diagram: ACR50 in people with rheumatoid arthritis who were MTX/other DMARD‐naive
Odds ratios using standard meta‐analyses
Biologic + MTX versus active comparator (mostly MTX) (14 studies)
Biologics + MTX were associated with a clinically meaningfully and statistically significantly higher odds of achieving an ACR50 response, OR 1.95 (95% CI 1.71 to 2.23), absolute difference of 16% (95% CI 13% to 20%) and NNTB = 7 (95% CI 6 to 8) with an I2 of 22% indicating heterogeneity that might not be important; (Figure 3) (moderate‐quality evidence).

ACR50: biologic (with and without concomitant MTX) versus comparator
Biologic without MTX versus active comparator (2 studies)
There was no evidence to indicate an effect of biologics without MTX compared to MTX, for achieving an ACR50 response, with an OR 0.92 (95% CI 0.61 to 1.38), absolute difference of ‐2% (95% CI ‐11% to 7%) with an I2 of 49% indicating moderate heterogeneity; (Figure 3) (moderate‐quality evidence).
Odds ratios by biologic type and dose using NMA
The overall rate of ACR50 by the type of biologic and the dose were as follows (14 studies, 6153 participants).
-
Type of biologic, TNF versus non‐TNF biologic:
-
biologic + MTX: compared to TNF biologic, non‐TNF biologic was not associated with any statistically significant or clinically meaningful difference in the odds of ACR50, OR: 0.84 (95% CrI 0.57 to 1.23);
-
biologic alone without MTX: no studies were available for analysis.
-
-
Type of biologic, etanercept versus TNF antibody biologic versus non‐TNF biologic:
-
biologic + MTX: compared to monoclonal TNF antibody biologic, neither non‐TNF biologic nor etanercept were associated with any statistically significant or clinically meaningful differences in ACR50 rates, OR: 0.86 (95% CrI 0.56 to 1.28) and OR: 1.27 (95% CrI 0.72 to 2.25), respectively;
-
biologic alone without MTX: no studies were available for analysis.
-
-
Biologic dose, SD versus LD versus HD biologic:
-
biologic + MTX: compared to SD biologic, HD and LD biologic were not associated with any statistically significant or clinically meaningful differences in the odds of ACR50 at OR: 1.00 (95% CrI 0.74 to 1.33) and OR: 0.80 (95% CrI 0.53 to 1.20), respectively; LD was not statistically significantly less likely than HD to be associated with ACR50, OR: 0.80 (95% CrI 0.50 to 1.33);
-
biologic alone without MTX: compared to SD biologic, HD biologic was associated with no statistically significant or clinically meaningful differences in odds of ACR50 at OR: 1.80 (95% CrI 0.98 to 3.30).
-
Main analyses using NMA
Fourteen RCTs (ten 2‐arm, three 3‐arm, and one 4‐arm trial) enrolling 6153 participants provided data for all dose analyses (Appendix 3). Five SD biologics + MTX (adalimumab, rituximab, infliximab, etanercept, abatacept intravenous) were superior to placebo + MTX for ACR50 rates, with OR ranging from 1.84 to 2.52; HD infliximab + MTX was also superior to placebo + MTX. Five biologics in SDs + MTX (adalimumab, rituximab, infliximab, etanercept, abatacept) were superior to SD adalimumab monotherapy for ACR50 with OR ranging 2.08 to 3.08; HD infliximab + MTX was associated with 2.69‐times odds compared to SD adalimumab monotherapy.
Subgroup analyses by RA disease duration (early versus established versus late RA)
Early RA (RA disease duration less than two years)
There were not enough data to perform NMA.
Established RA (disease duration 2 to 10 years)
Compared to placebo + MTX, SD adalimumab subcutaneous + MTX and SD etanercept + MTX, were associated with statistically significantly higher OR of ACR50 of 2.07 and 2.52, respectively. Compared to SD adalimumab subcutaneous, SD adalimumab subcutaneous + MTX and SD etanercept + MTX were associated with statistically significantly higher OR of ACR50: 2.58 and 3.13, respectively (3689 participants, 7 studies) (Appendix 4).
Late RA (disease duration more than 10 years)
There were not enough data to perform NMA.
Subgroup analyses by trial duration
Trial duration, six months or less
Compared to placebo + MTX, SD adalimumab subcutaneous + MTX was associated with 2.41‐times higher odds of ACR50 (2240 participants, 5 studies) (Appendix 5).
Trial duration, between six and 12 months
Compared to placebo + MTX, SD infliximab + MTX was associated with 1.94‐times higher odds of ACR50 (2106 participants, 5 studies) (Appendix 6).
Trial duration, between six and 12 months
Compared to placebo + MTX, SD adalimumab + MTX was associated with 1.78‐times higher odds of ACR50. Compared to SD adalimumab subcutaneous, SD adalimumab subcutaneous + MTX was associated with 2.40‐times higher OR of ACR50 (1695 participants, 3 studies) (Appendix 7).
Primary/major benefit outcome‐ HAQ
14 studies with 4,172 participants reported data on HAQ scores on a 0 to 3 scale. Of these, 13 studies included at least one arm with participants on a biologic with concomitant MTX and 1 study had only biologic without MTX).
Mean difference using standard meta‐analyses
Biologic + MTX versus active comparator
Compared to MTX, biologic + MTX use was associated with a statistically significant mean difference (MD) in HAQ scores ‐0.10 (95% CI‐0.16 to ‐0.04, absolute difference ‐3.3% (95% CI ‐5.3% to ‐1.3%), NNTB = 4 (95% CI 2 to 15) with I2 = 94%) indicating considerable heterogeneity and the difference may not be clinically meaningful; (Figure 4) (moderate‐quality evidence). When we excluded three studies contributing to high heterogeneity (Durez 2007; St Clair 2004; Tak 2012), biologic + MTX use was associated with a statistically significant and potentially clinically meaningful mean difference in HAQ scores ‐0.20 versus comparator (mostly MTX) (95% CI‐0.25, ‐0.15), I2 = 17%, indicating heterogeneity that might not be important.
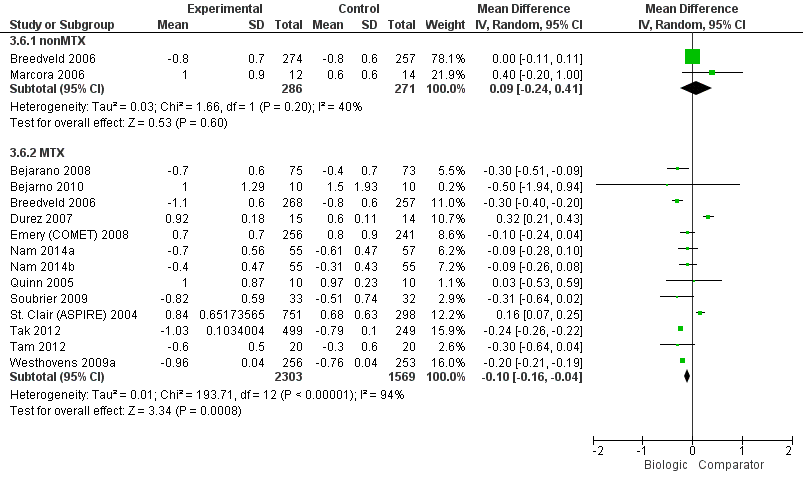
HAQ: biologic (with and without concomitant MTX) versus comparator
Biologic without MTX versus active comparator
Compared to MTX, biologics without MTX was not associated with evidence of any statistically significant mean difference in HAQ scores 0.09 (95% CI ‐0.24 to 0.41, absolute difference 3% (95% CI ‐8% to 13.7%), I2 = 40%) indicating moderate heterogeneity; this difference may not be clinically meaningful; (Figure 4) (moderate‐quality evidence).
Odds ratios by biologic type and dose using NMA
The overall HAQ scores by the type of biologic and the dose was as follows (4,172 participants, 14 studies).
-
Type of biologic, TNF versus non‐TNF biologic:
-
biologic + MTX: compared to TNF biologic, non‐TNF biologic did not show a significant or clinically meaningful difference in HAQ scores, MD: ‐0.14 (95% CrI ‐0.50 to 0.23);
-
biologic alone without MTX: there were no studies to perform this analysis.
-
-
Type of biologic, etanercept versus TNF antibody biologic versus non‐TNF biologic:
-
biologic + MTX: compared to monoclonal TNF antibody biologic, neither non‐TNF biologic nor etanercept were associated with any statistically significant or clinically meaningful differences in HAQ scores, MD: ‐0.13 (95% CrI ‐0.54 to 0.29) and MD: ‐0.01 (95% CrI ‐0.42 to 0.43), respectively. Compared to non‐TNF biologic, etanercept was not associated with a statistically significant or clinically meaningful difference in HAQ scores, MD: 0.13 (95% CrI ‐0.40 to 0.66).
-
biologic alone without MTX: Compared to monoclonal TNF antibody biologic, etanercept was not associated with a statistically significant or clinically meaningful difference in HAQ scores, MD: 0.30 (95% CrI ‐0.61 to 1.20).
-
-
Biologic dose, SD versus LD versus HD biologic:
-
biologic + MTX: compared to SD biologic, LD biologic was not associated with any statistically significant difference in HAQ scores, MD: ‐0.06 (95% CrI ‐0.45 to 0.33). HD biologic was not associated with any statistically significant or clinically meaningful difference in HAQ scores compared to SD biologic, MD: 0.20 (95% CrI ‐0.20 to 0.60) and LD biologic, MD: 0.26 (95% CrI ‐0.29 to 0.80).
-
biologic alone without MTX: There were no studies to perform this analysis.
-
Main analyses using NMA
Fourteen studies (eleven 2‐arm and three 3‐arm trials) with 4172 participants provided HAQ data in MTX‐naive participants (Appendix 8). Compared to MTX, SD adalimumab + MTX was associated with statistically significantly better HAQ score, the mean difference being ‐0.30 (95% CI ‐0.59 to ‐0.02), which was also clinically meaningful.
Subgroup analyses by RA disease duration (early versus established versus late RA)
Early RA (RA disease duration less than two years)
Four 2‐arm and two 3‐arm trials provided HAQ data. There were no statistically significant differences between various treatments (2,068 participants, 6 studies) (Appendix 9).
Established RA (disease duration 2 to 10 years)
Six 2‐arm and one 3‐arm trial provided HAQ data. There were no statistically significant differences between various treatments (2,078 participants, 7 studies) (Appendix 10).
Late RA (disease duration more than 10 years)
There were not enough data to perform NMA.
Subgroup analyses by trial duration
Trial duration, six months or less
All studies that provided HAQ data were two‐arm trials. There were no statistically significant differences between various treatments (243 participants, 4 studies) (Appendix 11).
Trial duration, between six and 12 months
Five 2‐arm and one 3‐arm trials provided HAQ data. There were no statistically significant differences between various treatments (2214 participants, 6 trials) (Appendix 12).
Trial duration, between six and 12 months
Two 2‐arm and two 3‐arm trials provided HAQ data. There were no statistically significant differences between various treatments (1715 participants, 4 studies) (Appendix 13).
Primary/major benefit outcome: Remission
Fifteen studies with 5561 participants reported data on remission (defined as DAS less than 1.6 or DAS28 less than 2.6). Of these, all studies included at least one arm with participants on a biologic with concomitant MTX.
Odds ratios using standard meta‐analysis
Biologic + MTX versus active comparator
The odds of remission with biologic + MTX was statistically significantly and clinically meaningfully higher, OR 2.23 (95% CI 1.82 to 2.73), absolute difference 15% (95% CI 11% to 19%), NNTB = 5 (95% CI 6 to 7); I2 of 41%, indicating moderate heterogeneity (Figure 5) (moderate‐quality evidence)

Remission: biologic (with and without concomitant MTX) versus comparator
Biologic without MTX versus active comparator
There was no evidence of a statistically significantly and clinically meaningfully difference, OR 1.12 (95% CI 0.08 to 1.57), absolute difference 2% (95% CI ‐3% to 8%), I2 of 0%, indicating heterogeneity that might not be important (Figure 5) (moderate‐quality evidence).
Odds ratios by biologic type and dose using NMA
The odds ratios (95% CrI) of remission by the type of biologic and the dose were as follows (5561 participants, 15 studies).
-
Type of biologic, TNF versus non‐TNF biologic:
-
biologic + MTX: compared to non‐TNF biologic + MTX, TNF biologic + MTX was not associated with any statistically significant or clinically meaningful difference in the odds of remission, OR: 1.30 (95% CrI 0.79 to 2.19);
-
biologic alone without MTX: there were no data to perform this analysis.
-
-
Type of biologic, etanercept versus TNF antibody biologic versus non‐TNF biologic:
-
biologic + MTX: compared to monoclonal antibody TNF biologic, monoclonal antibody TNF biologic + MTX was not associated with any statistically significant or clinically meaningful difference in the odds of remission, OR: 1.26 (95% CrI 0.76 to 2.15). There were no statistically significant or clinically meaningful differences between etanercept + MTX and monoclonal antibody TNF biologic + MTX, OR: 0.62 (95% CrI 0.24 to 1.67);
-
biologic alone without MTX: there were no data to perform this analysis.
-
-
Biologic dose, SD versus LD versus HD biologic:
-
biologic + MTX: compared to SD biologic monotherapy, HD biologic and LD biologic monotherapy were associated with no statistically significant or clinically meaningful difference in odds of remission, OR: 1.13 (95% CrI 0.68 to 1.78) and OR: 1.29 (95% CrI 0.69 to 2.50).
-
biologic alone without MTX: compared to SD biologic, HD biologic was associated with no statistically significant or clinically meaningful difference in odds of remission, OR: 1.72 (95% CrI 0.65 to 4.38).
-
Main analyses using NMA
Fifteen studies (eleven 2‐arm, three 3‐arm, and one 4‐arm trial) with 5561 participants provided remission data in MTX‐naive participants (Appendix 14). Compared to MTX, several biologics were associated with higher odds of disease remission:
-
SD infliximab + MTX, OR 1.82;
-
SD adalimumab + MTX, OR 2.55;
-
SD abatacept intravenous + MTX, OR 2.33;
-
SD golimumab subcutaneous + MTX, OR 2.69;
-
SD rituximab + MTX, OR 3.22;
-
LD rituximab + MTX, OR 3.55;
-
HD infliximab + MTX, OR 2.80.
Compared to SD abatacept subcutaneous, the following combinations with MTX were each associated with higher odds of RA disease remission:
-
SD adalimumab + MTX, OR 2.69;
-
SD golimumab, OR 2.85;
-
SD rituximab + MTX, OR 3.40;
-
LD rituximab + MTX, OR 3.75;
-
HD infliximab + MTX, OR 2.96.
Subgroup analyses by RA disease duration (early versus established versus late RA)
Early RA (RA disease duration less than two years)
There were five 2‐arm and three 3‐arm trials. Compared to MTX + placebo, SD rituximab + MTX and LD rituximab + MTX were associated with statistically significantly higher odds of remission, OR: 3.20 (95% CrI 1.24 to 8.66) and OR: 3.54 (95% CrI 1.35 to 9.45), respectively (2313 participants, 7 studies) (Appendix 15).
Established RA (disease duration 2 to 10 years)
There were six 2‐arm trials and one each of 3‐arm and 4‐arm trials. Compared to MTX + placebo, SD infliximab + MTX, SD adalimumab + MTX, SD abatacept + MTX and SD golimumab + MTX were associated with statistically significantly higher odds of remission, with ORs ranging from 2.32 to 7.01 (3248 participants, 8 studies) (Appendix 16).
Late RA (disease duration more than 10 years)
There were no studies for late RA.
Subgroup analyses by trial duration
Trial duration, six months or less
There were five 2‐arm trials and one 4‐arm trial. Compared to MTX + placebo, the following were associated with higher odds of remission: methylprednisolone + MTX, OR: 8.44; SD adalimumab + MTX, OR: 2.67; and SD golimumab + MTX, OR: 2.70 (2058 participants, 6 studies) (Appendix 17).
Trial duration, between six and 12 months
There were three 2‐arm trials and one 3‐arm trial. None of the comparisons were statistically significant (1697 participants, 4 studies) (Appendix 18).
Trial duration, between six and 12 months
There were three 2‐arm and two 3‐arm trials. Compared to MTX, SD rituximab + MTX and LD rituximab + MTX were associated with higher odds of remission, ORs ranging from 2.42 to 3.55. Compared to SD adalimumab, SD adalimumab + MTX and LD rituximab + MTX were associated with higher odds of remission, OR: 2.63 and 3.85, respectively (1806 participants, 5 studies) (Appendix 19).
Primary/major benefit outcome: Radiographic progression
Five studies with 2256 participants reported data on radiographic progression. Of these, all studies had at least one arm with participants on a biologic with concomitant MTX.
Odds ratios using standard meta‐analyses
Biologic + MTX versus active comparator
The use of biologic + MTX therapy was not statistically significantly associated with less radiographic progression compared to MTX with a mean difference of ‐2.56 (95% CI ‐6.03 to 0.92) Sharp or modified Sharp units (0 to 448 points), absolute difference ‐0.57% (95% CI ‐1.35% to 0.21%) (Figure 6) with a considerable degree of heterogeneity, with I2 of 97%.; this change was not clinically meaningful (low‐quality evidence).
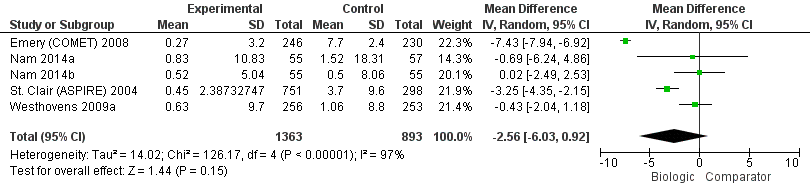
Radiographic progression: biologic (+MTX) versus comparator
Biologic without MTX versus active comparator
There were no studies of biologic therapy without MTX.
Odds ratios by biologic type and dose using NMA
The overall radiographic progression by the type of biologic and the dose was as follows (2256 participants, 5 studies).
-
Type of biologic, TNF versus non‐TNF biologic:
-
biologic + MTX: compared to TNF biologic + MTX, non‐TNF biologic + MTX was associated with no statistically significant or clinically meaningful difference in radiographic progression, MD: 3.32 (95% CrI ‐1.08 to 7.63);
-
biologic alone without MTX: there were no data to perform this analysis.
-
-
Type of biologic, etanercept versus TNF antibody biologic versus non‐TNF biologic:
-
biologic + MTX: compared to etanercept + MTX, monoclonal antibody + MTX or non‐TNF biologic + MTX were not associated with any statistically significant or clinically meaningful difference in radiographic progression, MD: 1.87 (95% CrI ‐2.34 to 6.05) and MD: 4.10 (95% CrI ‐0.64 to 8.68);
-
biologic alone without MTX: there were no data to perform this analysis.
-
-
Biologic dose, SD versus LD versus HD biologic:
-
biologic + MTX: compared to SD biologic + MTX, LD biologic + MTX, MD: ‐0.05 (95% CrI ‐3.34 to 3.20) was not associated with statistically significant or clinically meaningful difference in radiographic progression;
-
biologic alone without MTX: there were no data to perform this analysis.
-
Main analyses using NMA
None of the biologics were statistically significantly different from each other or DMARDs (Appendix 20).
Subgroup analyses by RA disease duration (early versus established versus late RA)
Early RA (RA disease duration less than two years)
There were not enough data to perform NMA.
Established RA (disease duration 2 to 10 years)
There were not enough data to perform NMA.
Late RA (disease duration more than 10 years)
There were not enough data to perform NMA.
Subgroup analyses by trial duration
Trial duration, six months or less
There were not enough data to perform NMA.
Trial duration, between six and 12 months
Three 2‐arm trials and one 3‐arm trials provided data. Compared to MTX + placebo, three treatments were associated with slower radiographic progression that was statistically significant with a mean difference of:
-
SD etanercept + MTX, MD: ‐5.50 (95% CrI ‐7.09 to ‐3.82);
-
SD infliximab + MTX, MD: ‐3.30 (95% CrI ‐5.46 to ‐1.15); and
-
HD infliximab + MTX, MD: ‐3.20 (95% CrI ‐5.35 to ‐1.06)
(2144 participants, 4 studies) (Appendix 21).
Trial duration, between six and 12 months
There were not enough data to perform NMA.
Primary/major harm outcome: Withdrawals due to adverse events
Fourteen studies with 6233 participants reported withdrawals due to adverse events (AE). Of these, all studies included at least one arm with participants on a biologic with concomitant MTX.
Odds ratios using standard meta‐analyses
Biologic + MTX versus active comparator
Results were inconclusive for a statistically significantly or clinically meaningfully difference in withdrawals due to AEs with biologic + MTX compared to MTX with an OR: 1.35 (95% CI 0.89 to 2.06; where the 95% confidence interval includes possibility of important harm), absolute difference 2% (95% CI 0% to 4%), I2 of 55%, representing moderate to substantial heterogeneity; Figure 7 (low‐quality evidence).
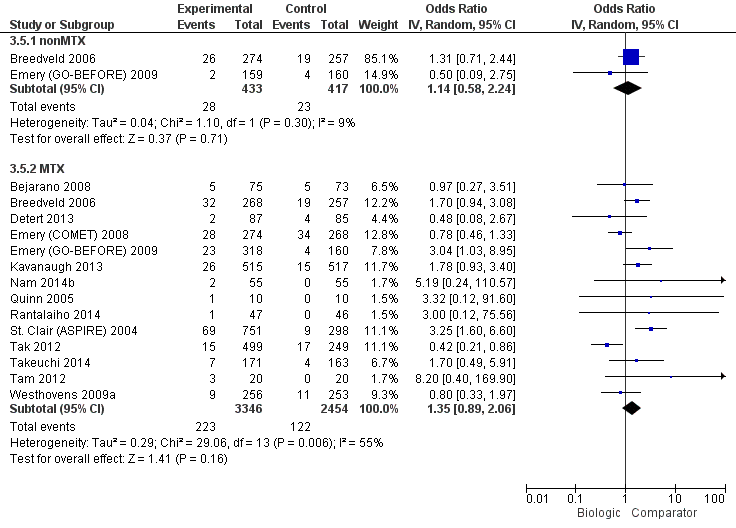
Withdrawals due to adverse events: biologic (with and without concomitant MTX) versus comparator
Biologic + MTX versus active comparator
Results were inconclusive for a statistically significantly and clinically meaningfully difference in withdrawals due to AEs in the biologic without MTX compared to MTX, OR: 1.14 (95% CI 0.58 to 2.24), absolute difference (95% CI 0% (‐4% to 4%), with a I2 of 9%, representing heterogeneity that might not be important. Figure 7 (low‐quality evidence).
Odds ratios by biologic type and dose using NMA
Overall withdrawals due to AEs differed by the type of biologic and the dose as follows (6233 participants, 14 trials).
-
Type of biologic, TNF versus non‐TNF biologic:
-
biologic + MTX: compared to TNF biologic, non‐TNF biologic showed clinically meaningfully and statistically significantly lower odds of withdrawals due to AEs, OR: 0.32 (95% CrI 0.12 to 0.80);
-
biologic alone without MTX: there were no studies to compare.
-
-
Type of biologic, etanercept versus TNF antibody biologic versus non‐TNF biologic:
-
biologic + MTX: compared to monoclonal antibodies against TNF, non‐TNF biologic was associated with clinically meaningful and statistically significantly lower odds of withdrawals due to AEs, OR: 0.27 (95% CrI 0.12 to 0.61), except for etanercept, OR: 0.44 (95% CrI 0.20 to 1.14). We also found compared to TNF biologic, non‐TNF biologic was not associated with any statistically significant or clinically meaningful difference in odds of withdrawals due to AEs, OR: 1.66 (95% CrI 0.60 to 5.02);
-
biologic alone without MTX: there were no studies to compare.
-
-
Biologic dose, SD versus LD versus HD biologic:
-
biologic + MTX: compared to SD biologic, odds of withdrawal due to AEs with HD or LD biologic were not statistically significantly or clinically meaningfully different from SD biologic (HD: OR: 1.41 (95% CrI 0.94 to 2.12), LD: OR: 0.56 (95% CrI 0.23 to 1.24) However, compared to HD biologic, LD biologic was associated with a statistically significant and clinically meaningful lower odds of withdrawals due to AEs, OR: 0.40 (95% CrI 0.15 to 0.97);
-
biologic alone without MTX: compared to HD biologic, LD biologic was associated with a statistically significant and clinically meaningful lower odds of withdrawals due to AEs, OR: 0.22 (95% CrI 0.03 to 0.92), although data for this analysis were sparse.
-
Main analyses using NMA
Compared to MTX, SD adalimumab + MTX, SD infliximab + MTX, HD golimumab + MTX, and HD infliximab + MTX, were associated with higher odds of withdrawals due to AEs, with ORs ranging 1.74 to 3.68. Compared to SD rituximab + MTX, HD golimumab + MTX and HD infliximab + MTX were associated with higher OR of 9.97 and 6.51. Compared to LD rituximab + MTX, HD golimumab + MTX and HD infliximab + MTX were associated with higher OR of 8.45 and 5.57. Compared to HD golimumab, HD golimumab + MTX was associated with higher odds, 8.13 (95% CrI 1.80 to 67.37) (6233 participants, 14 studies) (Appendix 22).
Subgroup analyses by RA disease duration (early versus established versus late RA)
Early RA (RA disease duration less than two years)
There were four 2‐arm, and two 3‐arm trials. Compared to MTX + placebo, both SD infliximab + MTX and HD infliximab + MTX were associated with higher odds of withdrawals due to AEs, OR: 3.34 and OR: 3.38, respectively. Compared to SD infliximab + MTX, SD rituximab + MTX and LD rituximab + MTX were associated with lower odds of withdrawals due to AEs, OR: 0.11 and OR: 0.13, respectively (2416 participants, 6 trials) (Appendix 23).
Established RA (disease duration 2 to 10 years)
There were four 2‐arm, one 3‐arm and one 4‐arm trials. HD golimumab subcutaneous was associated with statistically significantly higher odds of withdrawals due to AEs compared with MTX + placebo, OR: 3.78; SD etanercept + MTX, OR: 4.84; and HD golimumab subcutaneous, OR: 8.17 (3667 participants, 6 trials) (Appendix 24).
Late RA (disease duration more than 10 years)
There were not enough data to perform NMA.
Subgroup analyses by trial duration
Trial duration, six months or less
There were three 2‐arm trials and one 4‐arm trial. Compared to MTX + placebo, HD golimumab subcutaneous + MTX was associated with 3.71‐times higher odds of withdrawals due to AEs. Compared to HD golimumab subcutaneous monotherapy, HD golimumab subcutaneous + MTX was associated with 8.06‐times higher odds of withdrawals due to AEs (2175 participants, 4 trials) (Appendix 25).
Trial duration, between six and 12 months
There were four 2‐arm and two 3‐arm trials. Compared to MTX + placebo, both SD infliximab + MTX and HD infliximab + MTX were associated with higher odds of withdrawals due to AEs, OR: 3.32 and OR: 3.36, respectively (3029 participants, 6 trials) (Appendix 26).
Trial duration, between six and 12 months
There were no data.
Primary/major harm outcome: Serious adverse events
Twelve studies with 5169 participants reported serious adverse events (SAEs). Of these, all studies included at least one arm with participants on a biologic with concomitant MTX.
Odds ratios using standard meta‐analyses
Biologic + MTX versus active comparator
The use of biologic + MTX therapy was associated with no evidence of a statistically significant or clinically meaningful difference in the odds of SAEs versus MTX, OR: 1.06 (95% CI 0.86 to 1.31), absolute difference 1% (95% CI ‐1% to 3%), I2 of 8%, representing heterogeneity which might not be important (Figure 8) (moderate‐quality evidence).
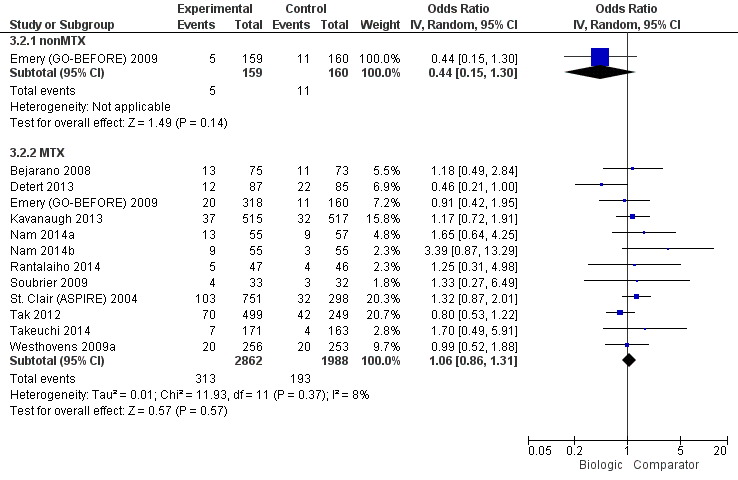
Serious adverse events: biologic (with and without concomitant MTX) versus comparator
Biologic without MTX versus active comparator
The use of biologic without MTX therapy was associated with no evidence of a statistically significant or clinically meaningful difference in the odds of SAEs versus MTX (based on one study), OR: 0.44 (95% CI 0.15 to 1.30) absolute difference ‐4% (95% CI ‐8% to 1%), with no I2, since data were derived from one study (low‐quality evidence).
Odds ratios by biologic type and dose using NMA
The overall SAEs differed by the type of biologic and the dose as follows (5009 participants, 12 studies).
-
Type of biologic, TNF versus non‐TNF biologic:
-
biologic + MTX: compared to TNF biologic, the odds of SAEs were not statistically significantly or clinically meaningfully different with non‐TNF biologic, OR: 0.73 (95% CrI 0.42 to 1.28);
-
biologic alone without MTX: there were no studies comparing biologic monotherapy regimens to each other.
-
-
Type of biologic, etanercept versus TNF antibody biologic versus non‐TNF biologic:
-
biologic + MTX: the odds of SAEs were not statistically significantly or clinically meaningfully different with the comparators as follows: non‐TNF biologic, OR: 0.77 (95% CrI 0.45 to 1.34) and etanercept, OR: 3.40 (95% CrI 0.82 to 18.68). Compared to MTX + non‐TNF biologic, MTX + TNF biologic was associated with statistically significantly higher odds of SAEs, OR: 4.41 (95% CrI 1.01 to 25.18), which may be clinically meaningful;
-
biologic alone without MTX: there were no studies comparing biologic monotherapies to each other.
-
-
biologic dose, SD versus LD versus HD biologic:
-
biologic + MTX: the odds of SAEs were not statistically significantly or clinically meaningfully different of the following compared to SD biologic as follows: HD biologic, OR: 1.02 (95% CrI 0.65 to 1.61); and LD biologic, OR: 0.94 (95% CrI 0.53 to 1.67);
-
biologic alone without MTX: there were no studies comparing biologic monotherapies to each other by dose.
-
Main analyses using NMA
Twelve RCTs (nine 2‐arm, two 3‐arm, and one 4‐arm trial) enrolling 5009 participants (Appendix 27) provided data for all dose analyses for SAEs. None of the biologics were significantly different from each other or MTX, except that HD golimumab was associated with lower odds of SAEs compared to SD etanercept + MTX.
Subgroup analyses by RA disease duration (early versus established versus late RA)
Early RA (RA disease duration less than two years)
There were five 2‐arm and two 3‐arm trials. There were no statistically significant differences between biologic and comparators or between biologic + MTX and comparators (MTX + placebo in most cases) (2618 participants, 7 studies) (Appendix 28).
Established RA (disease duration 2 to 10 years)
There were four 2‐arm and one 4‐arm trial. There were no statistically significant differences between biologic and comparators or between biologic + MTX and comparators (MTX + placebo in most cases) (2391 participants, 5 studies) (Appendix 29).
Late RA (disease duration more than 10 years)
There were no data to analyze.
Subgroup analyses by trial duration
Trial duration, six months or less
There were four 2‐arm and one 4‐arm trial. There were no statistically significant differences between biologic and comparators or between biologic + MTX and comparators (MTX + placebo in most cases) (2240 participants, 5 studies) (Appendix 30).
Trial duration, between six and 12 months
There were two 2‐arm and one 3‐arm trial. There were no statistically significant differences between biologic and comparators or between biologic + MTX and comparators (1668 participants, 3 studies) (Appendix 31).
Trial duration, between six and 12 months
There were two 2‐arm and one 3‐arm trial. There were no statistically significant differences (989 participants, 3 studies) (Appendix 32).
Primary/major harm outcome: Cancer
Eleven studies with 5044 participants reported cancer. Of these, all studies included at least one arm with participants on a biologic with concomitant MTX.
Odds ratios using standard meta‐analyses
Biologic + MTX versus active comparator
The use of biologic + MTX therapy was inconclusive for evidence of a statistically significant or clinically meaningful difference in the odds of cancer, compared to MTX, Peto OR: 0.71 (95% CI 0.38 to 1.33), absolute difference 0% (95% CI 0% to 0%) with an I2 of 0% representing no heterogeneity (Figure 9) (low‐quality evidence).

Cancer: biologic (with and without concomitant MTX) versus comparator
Biologic without MTX versus active comparator
The use of biologic without MTX therapy was inconclusive for evidence of a statistically significant or clinically meaningful difference in the odds of cancer, compared to MTX, Peto OR: 0.79 (95% CI 0.24 to 2.61), absolute difference 0% (95% CI ‐2% to 1%) with an I2 of 0%, representing no heterogeneity (Figure 9) (low‐quality evidence).
Odds ratios by biologic type and dose using NMA
The overall rate of cancer by the type of biologic and the dose were as follows (5044 participants, 11 studies).
-
Type of biologic, TNF versus non‐TNF biologic:
-
biologic + MTX: compared to TNF inhibitors, the odds of cancer with non‐TNF biologic were not statistically significantly or clinically meaningfully different, Peto OR: 0.80 (95% CrI 0.20 to 3.28);
-
biologic alone without MTX: no comparisons were available.
-
-
Type of biologic, etanercept versus TNF antibody biologic versus non‐TNF biologic:
-
biologic + MTX: compared to monoclonal TNF antibodies, the odds of cancer were not statistically significantly or clinically meaningfully different with etanercept, Peto OR: 1.43 (95% CrI 0.25 to 8.68) or non‐TNF biologic, Peto OR: 0.90 (95% CrI 0.20 to 4.33);
-
biologic alone without MTX: no comparisons were available.
-
-
Biologic dose, SD versus LD versus HD biologic:
-
biologic + MTX: compared to SD biologic + MTX, the odds of cancer were not statistically significantly or clinically meaningfully different with LD biologic + MTX, Peto OR: 1.50 (95% CrI 0.42 to 5.07). No comparisons were available for HD biologic + MTX versus SD biologic + MTX;
-
biologic alone without MTX: compared to SD biologic, the odds of cancer were not statistically significantly or clinically meaningfully different with HD biologic, Peto OR: 0.41 (95% CrI 0.01 to 6.10). No comparisons were available for LD biologic versus SD biologic.
-
Main analyses using NMA
Eleven RCTs (eight 2‐arm and three 3‐arm trials) enrolling 5044 participants (Appendix 33): we found no statistically significant differences comparing various biologics to MTX or to each other.
Subgroup analyses by RA disease duration (early versus established versus late RA)
Early RA (RA disease duration less than two years)
There were not enough data to perform NMA.
Established RA (disease duration 2 to 10 years)
No statistically significant differences in cancer rates were noted between treatments.
Late RA (disease duration more than 10 years)
There were not enough data to perform NMA.
Subgroup analyses by trial duration
Trial duration, six months or less
No statistically significant differences in cancer rates were noted between treatments (2081 participants, 5 studies (four 2‐arm and one 3‐arm trial)) (Appendix 35).
Trial duration, between six and 12 months
There were not enough data to perform NMA.
Trial duration, more than 12 months
There were not enough data to perform NMA.
Summary of safety warnings from regulatory agencies
Evidence from RCTs is limited in informing participants and physicians about uncommon or rare adverse events. In Appendix 36, we summarize warnings from the FDA, EMA and Health Canada, the regulatory agencies in the USA, Europe and Canada, respectively.
Discussion
Summary of main results
ACR50
In standard meta‐analysis, based on moderate‐quality evidence, biologic use + MTX was associated with a statistically significant and clinically meaningful higher odds of ACR50 compared to MTX with an odds ratio of 1.95 (95% CI 1.71 to 2.23) or a RR of 1.40 (95% CI 1.30 to 1.49), absolute difference 16% (95% CI 13% to 20%) and NNTB = 7 (95% CI 6 to 8). TNF biologic monotherapy did not show a clinically meaningful or statistically significant difference from MTX (there were no data for non‐TNF monotherapy). Results were similar in the NMA.
In standard meta‐analysis, based on high‐quality evidence, biologic + MTX was also associated with statistically significant and clinically meaningful higher odds of ACR50 compared to the comparator in both TNF biologic and non‐TNF biologic subgroups with RR of 1.44 (95% CI 1.34 to 1.54) and 1.27 (95% CI 1.14 to 1.42) and absolute difference 17% (95% CI 13% to 21%) and 13% (95% CI 7% to 19%), and NNTB = 6 (95% CI 5 to 8) and = 8 (95% CI 6 to 14), respectively. Results were similar for the NMA.
In subgroup analyses using the NMA, with respect to the type of biologics and biologics by dose, TNF biologics did not show evidence of a statistically significant or clinically meaningful difference from non‐TNF biologics and similar results were seen when comparing biologics doses.
Function assessed by HAQ
In standard meta‐analysis, there was moderate‐quality evidence that biologics use + MTX was associated with statistically significant HAQ score improvement with a mean difference of ‐0.10 (95% CI ‐0.16 to ‐0.04) and an absolute difference of ‐3.3% (95% CI ‐5.3% to ‐1.3%) when compared to MTX, but the difference did not seem to be clinically meaningful. TNF biologic monotherapy did not show a statistically significant or clinically meaningful difference from MTX (there were no data for non‐TNF monotherapy). Results were similar in the NMA.
In standard meta‐analysis, based on low‐quality evidence, compared to MTX, TNF biologic + MTX was associated with lower HAQ scores with better HAQ score improvement with mean difference of ‐0.09 (95% CI ‐0.26 to 0.07), which was neither statistically significant nor clinically meaningful. Based on moderate‐quality evidence, non‐TNF biologic + MTX was associated with better HAQ scores with statistically significant and clinically meaningful HAQ score improvement with a mean difference of ‐0.22 (95% CI ‐0.26 to ‐0.18) and an absolute difference of ‐7.3% (95% CI ‐8.7% to ‐6%) compared to MTX. Results did not show evidence of a clinically meaningful or statistically significant difference in TNF biologic monotherapy versus MTX.
In NMA, none of the subgroups (TNF or non‐TNF biologic) showed statistically significant or clinically meaningful differences. We noted no evidence of clinically meaningful and statistically significant differences in HAQ scores by the type of biologic (TNF versus non‐TNF biologics or receptor versus antibody TNF biologic) or in biologic‐dose analysis.
Remission
In standard meta‐analysis, based on moderate‐quality evidence, biologic use + MTX was associated with a statistically significant and clinically meaningful higher odds of remission compared to MTX, with OR of 2.23 (95% CI 1.82 to 2.73) or a RR of 1.62 (95% CI 1.33 to 1.98), absolute difference 15% (95% CI 11% to 19%) and NNTB = 5 (95% CI 6 to 7). TNF biologic monotherapy did not show evidence of a statistically significant or clinically meaningful difference from MTX (there were no data for non‐TNF monotherapy). Results were similar in the NMA.
In standard meta‐analysis, based on moderate‐quality evidence, TNF biologic + MTX showed a statistically significant and clinically meaningful higher rate of remission with risk ratio of 1.55 (95% CI 1.22 to 1.96) and absolute difference 14% (95% CI 9% to 19%) and NNTB = 7 (95% CI 5 to 10), as did non‐TNF biologic + MTX with RR 2.10 (95% CI 1.45 to 3.04), absolute difference 19% (95% CI 15% to 24%) and NNTB = 6 (95% CI 4 to 9). Results were similar in the NMA.
In subgroup analyses using the NMA, there was no evidence of statistically significant or clinically meaningful differences among biologic groups or in biologic‐dose analysis.
Radiographic progression
In standard meta‐analysis, based on low‐quality evidence, biologic use + MTX showed a non‐statistically significant difference in radiographic progression versus MTX with a mean difference of ‐2.56 (95% CI ‐6.03 to 0.92) and absolute difference ‐0.57% (95% CI ‐1.35% to 0.21%) on a scale of 0 to 448 points; this difference does not seem to be clinically meaningful. There were no data for TNF‐biologic or non‐TNF biologic monotherapy.
In standard meta‐analysis, based on low‐quality evidence, TNF biologic + MTX showed a non‐statistically significant improvement in radiographic progression versus MTX with mean difference of ‐3.18 (95% CI ‐6.80 to 0.43), absolute difference ‐0.71% (95% CI ‐1.52% to 959%). In NMA, this comparison was statistically significant with a mean difference of ‐3.73 (95% CrI ‐5.78 to ‐1.62), absolute difference ‐0.83% (95% CI ‐1.29% to ‐0.36%) and NNTB = 3 (95%CI, 3 to 7), but the clinical significance of this difference was unclear. Non‐TNF biologic + MTX showed a much lower non‐statistically significant improvement with a mean difference of ‐0.43 (95% CI ‐2.04 to 1.18), absolute difference ‐0.22% (95% CI ‐0.46% to 0.26%), which was also not significantly different in the NMA.
In subgroup NMA, no evidence of clinically meaningful or statistically significant differences were noted by the type of biologic (TNF versus non‐TNF biologic), receptor versus antibody TNF biologic, or biologic dose (SD versus HD versus LD).
Withdrawals due to adverse events
In standard meta‐analysis, based on low‐quality evidence, results were inconclusive for biologic use + MTX for any clinically meaningful or statistically significant difference in withdrawal due to adverse events rates compared to MTX, since the 95% CI included the possibility of important harm with an OR of 1.35 (95% CI 0.89 to 2.06) or a RR of 1.32 (95% CI 0.89 to 1.97) and absolute difference of 2% (95% CI 0% to 4%). Results were inconclusive for TNF biologic monotherapy versus MTX (there were no data for non‐TNF monotherapy). Results were similar in the NMA.
In standard meta‐analysis, based on moderate‐quality evidence, there was a clinically meaningful and statistically significant increase in withdrawals due to adverse events in TNF biologic + MTX versus MTX with a RR of 1.60 (95% CI 1.10 to 2.32), absolute difference 3% (95% CI 1% to 4%) and NNTH = 35 (95% CI 17 to 183). Based on low‐quality evidence, there was no evidence of a clinically meaningful and statistically significant difference in this outcome among the non‐TNF biologic + MTX versus MTX, RR of 0.56 (95% CI 0.31 to 1.01), absolute difference ‐2% (95% CI ‐5% to 1%). Results were similar in the NMA.
In subgroup analyses using the NMA, compared to TNF biologic, non‐TNF biologic showed a clinically meaningful and statistically significant lower odds ratio of withdrawals due to adverse events, OR 0.32 (95% CrI 0.12 to 0.80). Compared to HD biologic with concomitant MTX, LD biologic with concomitant MTX was associated with statistically significantly lower withdrawals due to adverse events, OR: 0.40 (95% CrI 0.15 to 0.97), which also seemed to be clinically meaningful.
Serious adverse events (SAEs)
In standard meta‐analysis, based on moderate‐quality evidence, the odds of SAEs did not show evidence of a statistically significant or clinically meaningful difference in participants comparing biologics + MTX to MTX alone; OR was 1.06 (95% CI 0.86 to 1.31), RR was 1.05 (95% CI 0.87 to 1.26) and absolute difference of 1% (95% CI ‐1% to 3%). Based on low‐quality evidence, TNF biologic monotherapy did not show evidence of a clinically meaningful or statistically significant difference from MTX (there were no data for non‐TNF monotherapy). Results were similar in the NMA.
In standard meta‐analysis, based on moderate‐quality evidence, there was no evidence of a statistically significant or clinically meaningful difference in the TNF biologic + MTX versus MTX with a RR of 1.14 (95% CI 0.92 to 1.42), absolute difference 1% (95% CI ‐1% to 3%). Based on low‐quality evidence, there was no evidence of a clinically meaningful and statistically significant difference in the non‐TNF biologic + MTX versus MTX with a RR of 0.87 (95% CI 0.64 to 1.18), absolute difference ‐1% (95% CI ‐5% to 2%).
In subgroup NMA, in one comparison TNF biologic + MTX was associated with statistically significantly higher odds of SAEs compared to non‐TNF biologic + MTX, with OR of 4.41 (95% CrI 1.01 to 25.18), which may be clinically meaningful. Other subgroup comparisons did not show evidence of a clinically meaningful or statistically significant difference.
Cancer
In standard meta‐analysis, based on low‐quality evidence, results were inconclusive for the risk of cancer for statistically significant or clinically meaningful difference for biologic + MTX versus MTX with a Peto's OR of 0.71 (95% CI 0.38 to 1.33) and an absolute difference of 0% (95% CI 0% to 0%). Results were also inconclusive for TNF biologic monotherapy versus MTX (there were no data for non‐TNF monotherapy). Results were similar in the NMA.
In subgroup NMA, no evidence of clinically meaningful or statistically significant differences were noted by the type of biologic (TNF versus non‐TNF biologic; receptor versus antibody TNF biologic), biologic dose (SD versus HD versus LD), RA disease duration or trial duration.
Overall completeness and applicability of evidence
ACR50 and withdrawals due to adverse events were reported by almost all of the studies included in this overview and NMA, and data from several studies were available for many other outcomes. Some important outcomes, including radiographic scores and cancer, were reported either by few RCTs (e.g. radiographic scores) or had a low event rate (e.g. cancer), or both, which limited our ability to draw firm conclusions about them for biologics overall and to compare them between biologics. The evidence report is up to date and current, with this 2015 update. Due to the rarity of trials with direct comparisons, this study provides comparisons of biologics to MTX and indirect comparisons of biologics to each other.
Quality of the evidence
For the 2015 update, the quality of included trials was reasonably good. However poor reporting of the conduct of the included trials was a major issue as all were described as double‐blind randomized but less than 50% reported adequate sequence generation, allocation concealment and blinding. Forty‐two percent reported adequate sequence generation, 37% of trials were judged to be at low risk for allocation concealment, 42% trials were judged at low risk of performance bias (blinding), 47% at low risk of detection bias (blinding), 53% trials had low risk of attrition bias and 89% trials had low risk of major baseline imbalance. Selective reporting bias could not be assessed since for several trials, we could not find published protocols.
The overall quality of the direct evidence for most outcomes (ACR50, HAQ, remission, serious adverse events) was downgraded to moderate due to inconsistency of effect. Direct evidence was low quality for radiographic outcomes, withdrawals due to adverse events and cancer, due to imprecision or indirectness or serious imprecision. The quality of evidence from the NMA for all outcomes was low to moderate quality due to imprecision and indirectness. We did not detect publication bias. Wide credible intervals were only found in some subgroup analyses.
Potential biases in the overview process
Our review has several limitations. Lack of reporting of many important outcomes from RCTs or few events (radiographic scores, cancer, etc.), or both, limited our ability to analyze and compare these outcomes between biologics and comparators and between biologics (TNF versus non‐TNF biologic; by dose etc.).
With the introduction of multiple biologics, whose benefits have yet to be compared to one another, it is unclear whether one or more biologics might be more beneficial or safer, or better tailored to different subgroups of participants suffering from RA. To our knowledge there are only few head‐to‐head comparisons of benefit and safety of various biologics in people with RA. Gabay 2013; Schiff 2008a; and Weinblatt 2013 are the most well‐known trials. We included direct comparator studies in our analyses; however, the majority of the studies compared biologic to MTX and two trials to MTX with methylprednisolone. In the absence of such direct comparisons, NMA results that incorporate indirect comparisons can provide useful information although still need to be interpreted with caution.
Indirect comparisons (incorporated into NMA estimates) have several limitations. RCTs differ in patient population characteristics, most prominently in prior failed therapy, biologic dose, concomitant use of DMARDs, mean RA disease duration, and trial duration. To overcome this limitation, we analyzed in the categories of previous DMARD history (MTX‐naive, MTX‐experienced, DMARD‐experienced and TNF‐experienced), biologic dose (SD, HD, LD), and concomitant MTX (yes/no). We observed several novel findings when these analyses were performed, which make results of this NMA and overview comprehensive. We also performed a‐priori‐specified subgroup analyses by the duration of RA (early, established, late) and duration of the trial (less than six, 6 to 12 and more than 12 months) as a surrogate of biologic exposure. These analyses also provide interesting results in specific subpopulations of people with RA. However, subgroup analyses are subject to low power and type II error, that is, missing significant results, by chance, due to lower number of studies and participants. Therefore, these results must be interpreted with caution.
Additionally, some studies presented data on safety for all doses of the biologic together, not just the recommended dose and in some cases presented data for the entire study duration, including the open‐label phase. This limited our ability to get the data for the randomized phase or by dose.
One must be careful in interpreting the odds ratios that may look slightly different from each other numerically, but not statistically. It is important to consider the 95% confidence intervals while interpreting these numbers. Due to a large number of comparisons and challenge interpreting these tables, we summarized all statistically significant odds ratios, to the extent possible, in the main text. This should make it easier for readers to interpret the results.
There is also possibility of type‐I error, due to multiple comparisons and up to five differences per 100 comparisons may be due to chance. However, given the limited data for most outcomes, short trial duration and rarity of harms outcomes, our main concern with most of these analyses is type‐II error, that is, missing an important difference due to small number of events, not type‐I error.
Two abstractors abstracted all data independently for this updated 2015 version and the original 2009 version. This we believe minimizes errors in data abstractions, and biases due to this error. Abstract and titles were also reviewed in duplicate independently, to avoid errors, as part of systematic review.
Agreements and disagreements with other studies or reviews
Our NMA and overview was performed using a comprehensive strategy, accounting for many potential factors that differ between trials and trial arms. Therefore, direct comparison of results to most published NMAs is not possible, particularly those that have not stratified participants by these important characteristics.
In general, many results agree with several similar analyses in the past. However, since our review has several more studies than included in the previous reviews/overviews, some estimates differ, as expected. Additionally, our review includes all available studies for biologics, while most previous reviews have included anti‐TNF biologics with few exceptions, and many used RCT data from non‐standardized doses.
Thompson 2011 conducted a meta‐analysis of TNF biologics versus MTX in people with RA with early disease (not necessarily all MTX‐naive) and found that the risk of serious infections and cancer with TNF biologics were similar to MTX with an OR of 1.28 (95% CI 0.82 to 2.00) and 1.08 (95% CI 0.50 to 2.32), respectively. Similarly, we found no difference in rates of serious adverse events with biologics versus comparator (MTX/other DMARDs + placebo in most cases) with moderate quality of evidence, but results for the risk of cancer were inconclusive with low quality of evidence.
In a meta‐analysis of RCTs of anti‐TNF biologics in people with RA who were MTX‐naive (Alonso‐Ruiz 2008), the RR of achieving ACR20 and ACR50 for biologic monotherapy versus MTX was RR 1.6 (95% CI 1.4 to 1.7) and RR 1.0 (95% CI 0.9 to 1.1) versus comparator. The pattern of these risk ratios are very similar to those reported in our study, although with better power and more studies, we found that the rates of ACR50 were higher in people receiving biologics compared to MTX/other DMARDs with an OR of 1.85 (95% CrI 1.56 to 2.19) or a RR of 1.36 (95% CrI 1.25 to 1.48).
Several systematic reviews and NMAs could not be compared to our study due to significant differences in patient population, since they focused on MTX/other DMARD‐failure population and either did not include RCTs from MTX/other DMARD‐naive population, or when included, these constituted a small proportion of all RCTs (Bongartz 2006; Bongartz 2009; Donahue 2008; Gartlehner 2006; Lee 2008; Leombruno 2008; Nam 2010; Nixon 2007; Orme 2012). Desai 2012 studied treatment discontinuation, an outcome different than the outcome we included.
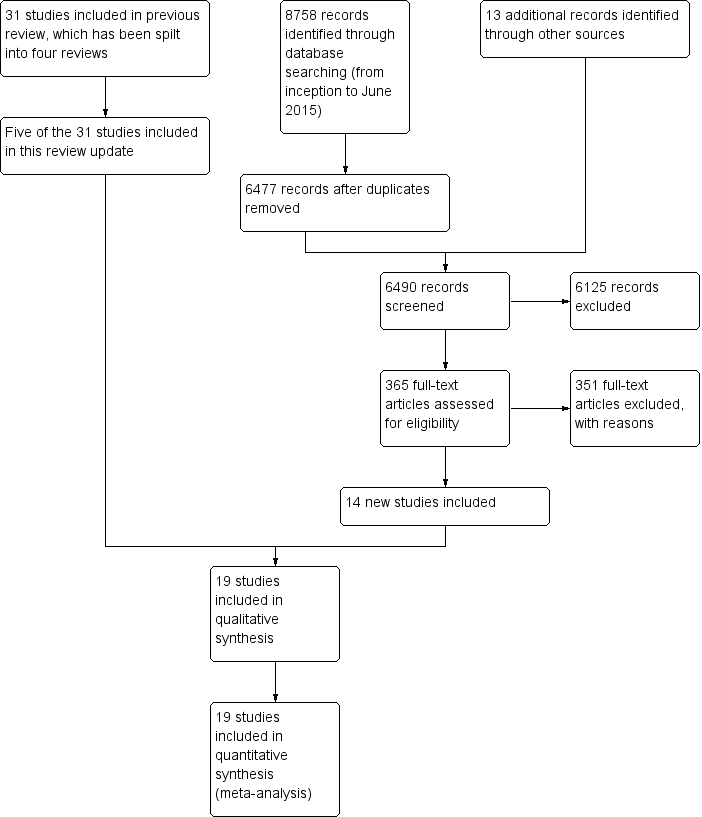
Study flow diagram

Network diagram: ACR50 in people with rheumatoid arthritis who were MTX/other DMARD‐naive
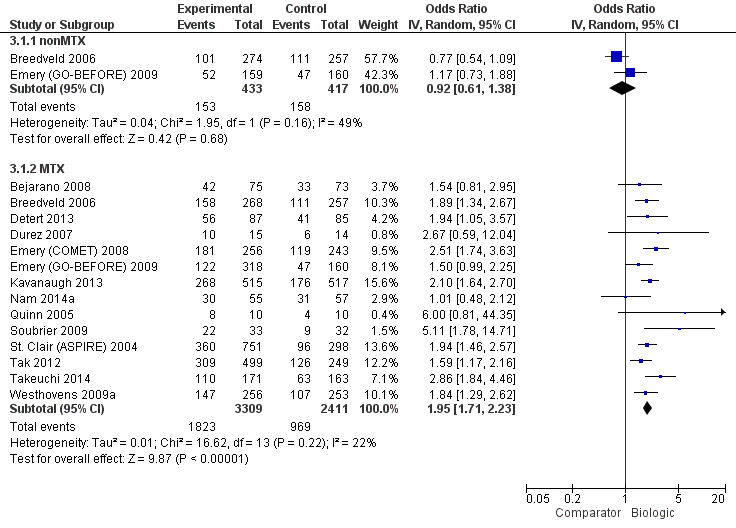
ACR50: biologic (with and without concomitant MTX) versus comparator

HAQ: biologic (with and without concomitant MTX) versus comparator
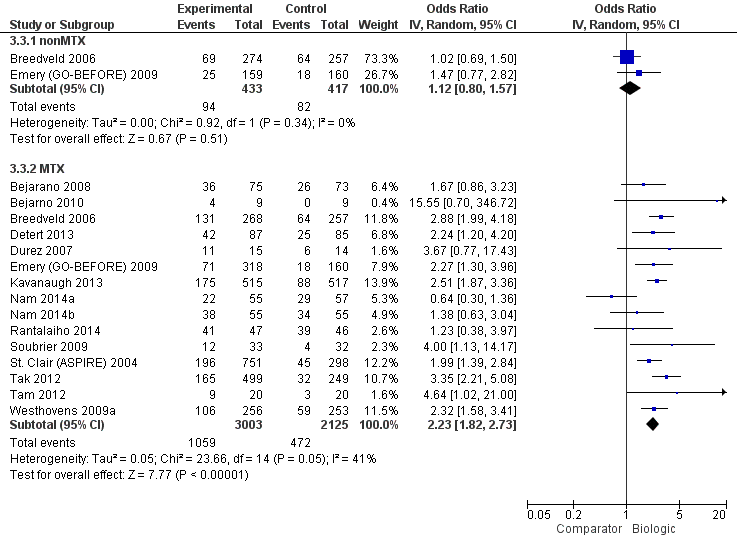
Remission: biologic (with and without concomitant MTX) versus comparator

Radiographic progression: biologic (+MTX) versus comparator

Withdrawals due to adverse events: biologic (with and without concomitant MTX) versus comparator

Serious adverse events: biologic (with and without concomitant MTX) versus comparator
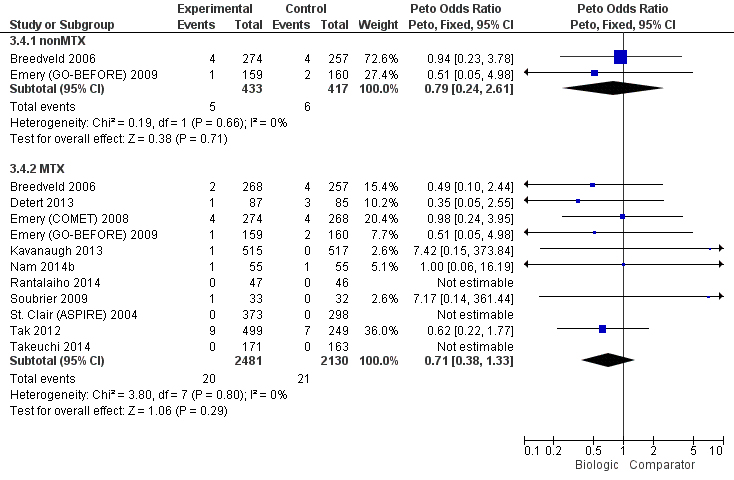
Cancer: biologic (with and without concomitant MTX) versus comparator
| Study name | Biologic(s) | Biologic dose(s) | Number of study arms | Non‐biologic comparator | Concomitant use of MTX | Trial duration | RA duration | Biologic‐naive | Total number of participants |
| Adalimumab | SD | 2 | MTX + PL | Yes | 13 months | Established | Yes | 148 | |
| Infliximab | SD | 2 | MTX + PL | Yes | 8 years | Established | No | 20 | |
| Adalimumab (+/‐ MTX) | SD | 3 | MTX + PL | Yes | 24 months | Established | Yes | 799 | |
| Adalimumab | SD | 2 | MTX + PL | Yes | 12 months | Early | Yes | 172 | |
| Infliximab | SD | 2 | MP + MTX | Yes | 12 months | Early | No | 29 | |
| Emery 2008 (COMET) | Etanercept | SD | 2 | MTX + PL | Yes | 12 months | Established | Yes | 542 |
| Emery 2009 (GO‐BEFORE) | Golilumab (+/‐ MTX) | SD, HD | 4 | MTX + PL | Yes | 12 months | Established | No | 637 |
| Kavanaugh 2013 (OPTIMA) | Adalimumab | SD | 2 | MTX + PL | Yes | 6 months | Established | No | 1032 |
| Etanercept | SD | 2 | MTX | No | 6 months | Unknown | Yes | 26 | |
| Infliximab | SD | 2 | MP + MTX | Yes | 6 months | Early | Yes | 112 | |
| Etanercept | SD | 2 | MTX + PL | Yes | 12 months | Early | Yes | 110 | |
| Infliximab | SD | 2 | MTX + PL | Yes | 12 months | Early | Yes | 20 | |
| Infliximab | SD | 2 | MTX + PL | Yes | 24 months | Early | Yes | 93 | |
| Adalimumab | SD | 2 | MTX + PL | Yes | 12 months | Established | No | 65 | |
| St Clair 2004 (ASPIRE) | Infliximab | SD, HD | 3 | MTX + PL | Yes | 12 months | Early | Yes | 1049 |
| Rituximab | SD, LD | 3 | MTX + PL | Yes | 24 months | Early | Yes | 748 | |
| Adalimumab | SD | 2 | MTX + PL | Yes | 6 months | Early | Yes | 334 | |
| Infliximab | SD | 2 | MTX | Yes | 12 months | Established | Yes | 40 | |
| Abatacept | SD | 2 | MTX + PL | Yes | 24 months | Established | No | 509 | |
| HD: high dose; LD: low dose; MTX: methotrexate; PL: placebo; SD = standard dose | |||||||||
| Comparison | Direct evidence | Network meta‐analysis | ||||||
| Outcome: ACR50 | No. of participants (studies) | RR (95% CI) | Absolute risk difference, NNTB | Quality of evidence (GRADE) | RR (95% CrI) | Absolute risk difference, NNTB | Quality of evidence (GRADE) | |
| Biologics + MTX | versus comparator | 5720 (14 studies) | 1.40 (1.30 to 1.49) | 16% (13% to 20%) NNTB = 7 (6 to 8) | ⊕⊕⊕⊖ moderate (downgraded for inconsistency)1 | n/a | ||
| TNF biologic alone (without MTX) | versus comparator | 850 (2 studies) | 0.94 (0.73 to 1.22) | ‐2% (‐11% to 7%) NNTB = n/a | ⊕⊕⊕⊖ moderate (downgraded for imprecision)2 | 1.00 (0.82 to 1.21) | 0% (‐8% to 9%) NNTB = n/a | ⊕⊕⊖⊖ low (downgraded for imprecision and indirectness)2,4 |
| TNF biologic + MTX | versus comparator | 4463 (12 studies) | 1.44 (1.34 to 1.54) | 17% (13% to 21%) NNTB = 6 (5 to 8) | ⊕⊕⊕⊕ high3 | 1.42 (1.30 to 1.54) | 18% (13% to 22%) NNTB = 6 (5 to 8) | ⊕⊕⊕⊖ moderate (downgraded for indirectness)4 |
| Non‐TNF biologic + MTX | versus comparator | 1257 (2 studies) | 1.27 (1.14 to 1.42) | 13% (7% to 19%) NNTB = 8 (6 to 14) | ⊕⊕⊕⊕ high3 | 1.31 (1.11 to 1.52) | 13% (5% to 22%) NNTB = 8 (5 to 22) | ⊕⊕⊕⊖ moderate (downgraded for indirectness)4 |
| Outcome: HAQ score 0‐3 (higher = worse): a measure of function | No. of participants (studies) | Direct evidence | Network meta‐analysis | |||||
| MD (95% CI) | Absolute risk difference, NNTB | Quality of evidence (GRADE) | MD (95% CrI) | Absolute risk difference, NNTB | Quality of evidence (GRADE) | |||
| Biologics + MTX | versus comparator | 3872 (13 studies) | ‐0.10 (‐0.16 to ‐0.04) | ‐3.3% (‐5.3% to ‐1.3%) NNTB = 4 (2 to 15) | ⊕⊕⊕⊖ moderate (downgraded for inconsistency)5 | n/a | ||
| TNF biologic alone (without MTX) | versus comparator | 557 (2 studies) | 0.09 (‐0.24 to 0.41) | 3% (‐8% to 13.7%) NNTB = n/a | ⊕⊕⊕⊖ moderate (downgraded for imprecision)2 | 0.17 (‐0.19 to 0.54) | 5.7% (‐6.3% to 18%) NNTB = n/a | ⊕⊕⊖⊖ low (downgraded for imprecision and indirectness)2,4 |
| TNF biologic + MTX | versus comparator | 2615 (11 studies) | ‐0.09 (‐0.26 to 0.07) | ‐3% (‐8.7% to 2.3%) NNTB = n/a | ⊕⊕⊖⊖ low (downgraded for imprecision and inconsistency)2,6 | ‐0.08 (‐0.25 to 0.07) | ‐2.7% (‐8.3% to 2.3%) NNTB = n/a | ⊕⊕⊖⊖ low (downgraded for imprecision and indirectness)2,4 |
| Non‐TNF biologic + MTX | versus comparator | 1257 (2 studies) | ‐0.22 (‐0.26 to ‐0.18) | ‐7.3% (‐8.7% to ‐6%) NNTB = 2 (2 to 3) | ⊕⊕⊕⊖ moderate (downgraded for inconsistency)7 | ‐0.22 (‐0.55 to 0.11) | ‐7.3% (‐18.3% to 3.7%) NNTB = n/a | ⊕⊕⊖⊖ low (downgraded for imprecision and indirectness)2,4 |
| Outcome: Remission (defined as DAS < 1.6 or DAS28 < 2.6) | No. of participants (studies) | Direct evidence | Network meta‐analysis | |||||
| RR (95% CI) | Absolute risk difference, NNTB | Quality of evidence (GRADE) | RR (95% CrI) | Absolute risk difference, NNTB | Quality of evidence (GRADE) | |||
| Biologics + MTX | versus comparator | 5128 (15 studies) | 1.62 (1.33 to 1.98) | 15% (11% to 19%) NNTB = 5 (6 to 7) | ⊕⊕⊕⊖ moderate (downgraded for inconsistency)8 | n/a | ||
| TNF biologic alone (without MTX) | versus comparator | 850 (2 studies) | 1.08 (0.83 to 1.41) | 2% (‐3% to 8%) NNTB = n/a | ⊕⊕⊕⊖ moderate (downgraded for imprecision)2 | 1.02 (0.74 to 1.39) | 1% (‐7% to 11%) NNTB = n/a | ⊕⊕⊖⊖ low (downgraded for imprecision and indirectness)2,4 |
| TNF biologic + MTX | versus comparator | 4463 (12 studies) | 1.55 (1.22 to 1.96) | 14% (9% to 19%) NNTB = 7 (5 to 10) | ⊕⊕⊕⊖ moderate (downgraded for inconsistency)9 | 1.62 (1.40 to 1.86) | 18% (12% to 23%) NNTB = 7 (5 to 10) | ⊕⊕⊕⊖ moderate (downgraded for indirectness)4 |
| Non‐TNF biologic + MTX | versus comparator | 1257 (2 studies) | 2.10 (1.45 to 3.04) | 19% (15% to 24%) NNTB = 6 (4 to 9) | ⊕⊕⊕⊖ moderate (downgraded for inconsistency)10 | 1.85 (1.46 to 2.28) | 24% (13% to 35%) NNTB = 6 (4 to 10) | ⊕⊕⊕⊖ moderate (downgraded for indirectness)4 |
| Outcome: Radiographic progression on Sharp/Van der Heijde modification (0‐448 points) | No. of participants (studies) | Direct evidence | Network meta‐analysis | |||||
| MD (95% CI) | Absolute risk difference, NNTB | Quality of evidence (GRADE) | MD (95% CrI) | Absolute risk difference, NNTB | Quality of evidence (GRADE) | |||
| Biologics + MTX | versus comparator | 2256 (5 studies) | ‐2.56 (‐6.03 to 0.92) | ‐0.57% (‐1.35% to 0.21%) NNTB = n/a | ⊕⊕⊖⊖ low (downgraded for imprecision and inconsistency)2,11 | n/a | ||
| TNF biologic + MTX | versus comparator | 1747 (4 studies) | ‐3.18 (‐6.80 to 0.43) | ‐0.71% (‐1.52% to 959.82%) NNTB = n/a | ⊕⊕⊖⊖ low (downgraded for imprecision and inconsistency)2,12 | ‐3.73 (‐5.78 to ‐1.62) | ‐0.83% (‐1.29% to ‐0.36%) NNTB = 3 (3 to 7) | ⊕⊕⊕⊖ moderate (downgraded for indirectness)4 |
| Non‐TNF biologic + MTX | versus comparator | 509 (1 study) | ‐0.43 (‐2.04 to 1.18) | ‐0.22% (‐0.46% to 0.26%) NNTB = n/a | ⊕⊕⊖⊖ low (downgraded for imprecision and inconsistency)2,11 | ‐0.42 (‐4.22 to 3.41) | ‐0.09% (‐0.94% to 0.76%) NNTB = n/a | ⊕⊕⊖⊖ low (downgraded for imprecision and indirectness)2,4 |
| Outcome: Withdrawals due to adverse events | No. of participants (studies) | Direct evidence | Network meta‐analysis | |||||
| RR (95% CI) | Absolute risk difference, NNTB | Quality of evidence (GRADE) | RR (95% CrI) | Absolute risk difference, NNTB | Quality of evidence (GRADE) | |||
| Biologics + MTX | versus comparator | 5800 (14 studies) | 1.32 (0.89 to 1.97) | 2% (0% to 4%) NNTH = n/a | ⊕⊕⊖⊖ low (downgraded for inconsistency and imprecision )1,2 | n/a | ||
| TNF biologic alone (without MTX) | versus comparator | 850 (2 studies) | 1.14 (0.62 to 2.10) | 0% (‐4% to 4%) NNTH = n/a | ⊕⊕⊖⊖ low (downgraded for serious imprecision)13 | 0.93 (0.41 to 1.90) | 0% (‐2% to 3%) NNTH = n/a | ⊕⊕⊖⊖ low (downgraded for imprecision and indirectness)2,4 |
| TNF biologic + MTX | versus comparator | 4543 (12 studies) | 1.60 (1.10 to 2.32) | 3% (1% to 4%) NNTH = 35 (17 to 183) | ⊕⊕⊕⊖ moderate (downgraded for imprecision)14 | 1.68 (1.16 to 2.56) | 3% (1% to 5%) NNTH = 31 (14 to 138) | ⊕⊕⊕⊖ moderate (downgraded for indirectness)4 |
| Non‐TNF biologic + MTX | versus comparator | 1257 (2 studies) | 0.56 (0.31 to 1.01) | ‐2% (‐5% to 1%) NNTH = n/a | ⊕⊕⊖⊖ low (downgraded for serious imprecision)13 | 0.56 (0.25 to 1.29) | ‐2% (‐3% to 1%) NNTH = n/a | ⊕⊕⊖⊖ low (downgraded for imprecision and indirectness)2,4 |
| Outcome: Serious adverse events | No. of participants (studies) | Direct evidence | Network meta‐analysis | |||||
| RR (95% CI) | Absolute risk difference, NNTB | Quality of evidence (GRADE) | RR (95% CrI) | Absolute risk difference, NNTB | Quality of evidence (GRADE) | |||
| Biologics + MTX | versus comparator | 4850 (12 studies) | 1.05 (0.87 to 1.26) | 1% (‐1% to 3%) NNTH = n/a | ⊕⊕⊕⊖ moderate (downgraded for imprecision)2 | n/a | ||
| TNF biologic alone (without MTX) | versus comparator | 319 (1 study) | 0.46 (0.16 to 1.29) | ‐4% (‐8% to 1%) NNTH = n/a | ⊕⊕⊖⊖ low (downgraded for serious imprecision)13 | 0.52 (0.16 to 1.30) | ‐5% (‐9% to 3%) NNTH = n/a | ⊕⊕⊖⊖ low (downgraded for imprecision and indirectness)2,4 |
| TNF biologic + MTX | versus comparator | 3593 (10 studies) | 1.14 (0.92 to 1.42) | 1% (‐1% to 3%) NNTH = n/a | ⊕⊕⊕⊖ moderate (downgraded for imprecision)2 | 1.16 (0.90 to 1.51) | 2% (‐1% to 4%) NNTH = n/a | ⊕⊕⊖⊖ low (downgraded for imprecision and indirectness)2,4 |
| Non‐TNF biologic + MTX | versus comparator | 1257 (2 studies) | 0.87 (0.64 to 1.18) | ‐1% (‐5% to 2%) NNTH = n/a | ⊕⊕⊖⊖ low (downgraded for serious imprecision)13 | 0.87 (0.57 to 1.34) | ‐1% (‐4% to 3%) NNTH = n/a | ⊕⊕⊖⊖ low (downgraded for imprecision and indirectness)2,4 |
| Outcome: Cancer (note: Peto OR used but can interpret as RR due to low event rate) | No. of participants (studies) | Direct evidence | Network meta‐analysis | |||||
| RR (95% CI) | Absolute risk difference, NNTB | Quality of evidence (GRADE) | RR (95% CrI) | Absolute risk difference, NNTB | Quality of evidence (GRADE) | |||
| Biologics + MTX | versus comparator | 4611 (11 studies) | 0.71 (0.38 to 1.33) | 0% (0% to 0%) NNTH = n/a | ⊕⊕⊖⊖ low (downgraded for serious imprecision)13 | n/a | ||
| TNF biologic alone (without MTX) | versus comparator | 850 (2 studies) | 0.79 (0.24 to 2.61) | 0% (‐2% to 1%) NNTH = n/a | ⊕⊕⊖⊖ low (downgraded for serious imprecision)13 | 0.94 (0.25 to 3.18) | 0% (‐1% to 2%) NNTH = n/a | ⊕⊕⊖⊖ low (downgraded for imprecision and indirectness)2,4 |
| TNF biologic + MTX | versus comparator | 3863 (10 studies) | 0.77 (0.35 to 1.69) | 0% (0% to 0%) NNTH = n/a | ⊕⊕⊖⊖ low (downgraded for serious imprecision)13 | 0.81 (0.36 to 1.73) | 0% (‐1% to 0%) NNTH = n/a | ⊕⊕⊖⊖ low (downgraded for imprecision and indirectness)2,4 |
| Non‐TNF biologic + MTX | versus comparator | 748 (1 study) | 0.62 (0.22 to 1.77) | 0% (‐3% to 1%) NNTH = n/a | ⊕⊕⊖⊖ low (downgraded for serious imprecision)13 | 0.64 (0.20 to 2.12) | 0% (‐1% to 1%) NNTH = n/a | ⊕⊕⊖⊖ low (downgraded for imprecision and indirectness)2,4 |
| Comparator = MTX and/or DMARD GRADE Working Group grades of evidence CI: confidence interval; CrI; credible interval; DAS: Disease Activity Score; DMARD: disease‐modifying anti‐rheumatic drug; MTX: methotrexate; n/a: not available; NNTB/NNTH: number needed to treat for an additional beneficial/harmful outcome; OR: odds ratio; RR: risk ratio; TNF: tumor necrosis factor 1Downgraded for inconsistency: I2= 51%. | ||||||||