| NSAID for cancer pain ‐ non‐controlled data |
| Patient or population: people with cancer pain Settings: inpatient or outpatient Intervention: any NSAID, and dose Comparison: no control ‐ cohort of treated participants |
| Participants with at least 30% or at least 50% reduction in pain | No data | No data | Very low | Limited data, several risks of bias |
| PGIC much or very much improved | No data | No data | Very low | Limited data, several risks of bias |
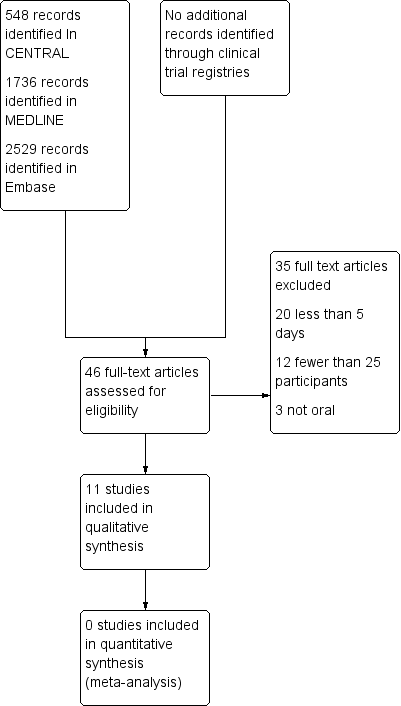
| Pain no worse than mild at one or two weeks (or equivalent) | Range of estimates from 260 in 1000 to 510 in 1000 | 4 studies 415 participants randomised | Very low | Limited data, several risks of bias |
| Serious adverse events | 2 serious adverse events reported | 11 studies 949 participants | Very low | Limited data, several risks of bias |
| Adverse events | Dry mouth 10% Loss of appetite 4% Somnolence 9% Dyspepsia 9% | Variously reported in studies | Very low | Limited data, several risks of bias |
| Withdrawals | All cause 23% Lack of efficacy 24% Adverse event 5% | Variously reported in studies | Very low | Limited data, several risks of bias |
| Death | 22 deaths, not clearly related to treatment | 11 studies 949 participants | Very low | Limited data, several risks of bias |
| Descriptors for levels of evidence (EPOC 2015):
High quality: This research provides a very good indication of the likely effect. The likelihood that the effect will be substantially different† is low.
Moderate quality: This research provides a good indication of the likely effect. The likelihood that the effect will be substantially different† is moderate.
Low quality: This research provides some indication of the likely effect. However, the likelihood that it will be substantially different† is high.
Very low quality: This research does not provide a reliable indication of the likely effect. The likelihood that the effect will be substantially different† is very high. † Substantially different: a large enough difference that it might affect a decision. |