Paracetamol (acetaminofeno) oral para el dolor por cáncer
Resumen
Antecedentes
El dolor es un síntoma común en los pacientes con cáncer, y un 30% a un 50% de todos los pacientes con cáncer experimentará dolor moderado a intenso, el cual puede presentar un impacto negativo importante sobre la calidad de vida. Los fármacos no opiáceos se usan con frecuencia para tratar el dolor por cáncer leve a moderado, y se recomiendan para esta finalidad en la escalera de tratamiento del dolor por cáncer de la OMS, ya sea solos o en combinación con opiáceos.
Una revisión Cochrane anterior que examinó la evidencia sobre los fármacos antiinflamatorios no esteroideos (AINE) o el paracetamol, solos o combinados con opiáceos, para el dolor por cáncer se retiró en 2015 debido a que estaba desactualizada; la fecha de la última búsqueda fue junio 2005. Esta revisión, y otra sobre AINE, actualizan la evidencia.
Objetivos
Evaluar la eficacia del paracetamol (acetaminofeno) oral para el dolor por cáncer en adultos y niños, y los eventos adversos informados durante su uso en los ensayos clínicos.
Métodos de búsqueda
Se hicieron búsquedas en el Registro Cochrane Central de Ensayos Controlados (Cochrane Central Register of Controlled Trials) (CENTRAL), MEDLINE y en Embase desde su inicio hasta marzo 2017, junto con listas de referencias de artículos recuperados y revisiones y en dos registros de estudios en línea.
Criterios de selección
Se incluyeron estudios aleatorios con doble cegamiento de cinco días de duración o más, que compararon paracetamol solo con placebo, o paracetamol más un opiáceo en comparación con la misma dosis del opiáceo solo, para el dolor por cáncer de cualquier intensidad. Se consideraron los estudios abiertos y simple ciego para la inclusión en la revisión. El tamaño mínimo de estudio fue de 25 participantes por brazo de tratamiento al momento de la asignación al azar inicial.
Obtención y análisis de los datos
Dos autores de la revisión, de forma independiente, buscaron los estudios, extrajeron los datos sobre la eficacia y los eventos adversos y examinaron la calidad de los estudios y el potencial sesgo. No se realizaron análisis agrupados. Se evaluó la calidad de la evidencia mediante GRADE y se creó una tabla de "Resumen de los hallazgos".
Resultados principales
Tres estudios en adultos cumplieron los criterios de inclusión, con una duración de hasta una semana; Inicialmente se asignaron 122 participantes al azar, y 95 finalizaron el tratamiento. No se encontraron estudios con niños. Un estudio fue de grupos paralelos y dos tuvieron un diseño cruzado. Los tres usaron paracetamol como complemento al tratamiento con opiáceos fuertes (mediana de dosis equivalentes de morfina por día de 60 mg, 70 mg y 225 mg; algunos pacientes tomaron varios cientos de mg de morfina oral equivalente por día). Otros fármacos sin paracetamol fueron antiinflamatorios no esteroideos (AINE), antidepresivos tricíclicos o neurolépticos. El riesgo de sesgo en todos los estudios fue alto por los datos de resultado incompletos y el tamaño pequeño; en ninguno fue claramente bajo el riesgo de sesgo.
Ninguno de los estudios informó los resultados primarios: pacientes con una reducción del dolor de al menos un 50% y un 30%, al inicio del estudio; pacientes con dolor no peor que leve al final del período de tratamiento; pacientes con una Patient Global Impression of Change (PGIC) de una mejoría grande o una mejoría muy grande (o una expresión equivalente). Los informes sobre el dolor no indicaron diferencias entre el paracetamol y el placebo cuando se los agregó a otro tratamiento. No hubo evidencia convincente de diferencias del paracetamol en comparación con el placebo en cuanto a la calidad de vida, el uso de medicación de rescate ni la satisfacción o preferencia del paciente. Las medidas de daño (eventos adversos graves, otros eventos adversos y retiro debido a falta de eficacia) se informaron de manera inconsistente y no aportaron ninguna evidencia clara de diferencias.
La evaluación GRADE de la calidad de la evidencia fue muy baja para todos los resultados, porque los estudios presentaban un alto riesgo de sesgo de varios tipos.
Conclusiones de los autores
No existe evidencia de alta calidad para apoyar ni refutar el uso de paracetamol solo o en combinación con opiáceos para los primeros dos pasos de la escalera de tres peldaños para el dolor por cáncer de la OMS. No puede precisarse si en los estudios disponibles se podría detectar algún beneficio adicional del paracetamol sobre la base de las dosis de opiáceos usadas.
PICO
Resumen en términos sencillos
Paracetamol para el dolor por cáncer
Conclusión
No hay evidencia que demuestre que el paracetamol es útil para el tratamiento de los pacientes con dolor por cáncer, solo ni combinado con un fármaco similar a la morfina. Tampoco hay evidencia para refutar que es útil. No hay estudios adecuados que evalúen el paracetamol para el tratamiento del dolor por cáncer.
Antecedentes
Un paciente de cada dos o tres con cáncer presentará dolor moderado o intenso. El dolor tiende a empeorar a medida que evoluciona el cáncer. En 1986 la Organización Mundial de la Salud recomendó la administración de fármacos similares a la morfina (opiáceos) para el dolor por cáncer moderado a intenso, y de fármacos no opiáceos como el paracetamol, solo para el dolor leve a moderado, o junto con opiáceos en pacientes con dolor moderado a intenso.
Características de los estudios
En esta revisión se examinó la evidencia sobre la efectividad del paracetamol (solo o con fármacos similares a la morfina) en adultos y niños con dolor por cáncer. También se buscó saber cuántos pacientes presentaron efectos secundarios, y su severidad, por ejemplo, si resultaron en la interrupción del tratamiento.
En marzo de 2017, se encontraron tres estudios con 122 participantes. Todos compararon paracetamol más opiáceo con la misma dosis del opiáceo solo. Los estudios eran pequeños y de calidad deficiente. Usaron diferentes diseños de estudio y diferentes formas de mostrar los resultados relacionados con el dolor. No se informaron los resultados de importancia para los pacientes con dolor por cáncer.
Hallazgos clave
No se halló evidencia de que la toma del paracetamol solo implique alguna diferencia con respecto a la intensidad del dolor. No se encontró ninguna evidencia de que la toma de paracetamol junto con un fármaco similar a la morfina fuera mejor que el fármaco similar a la morfina solo. El paracetamol no pareció mejorar la calidad de vida. No se pudieron obtener conclusiones sobre los efectos secundarios. No pudo establecerse ninguna conclusión debido a la cantidad de información y las diferencias en la forma en que se informaron los estudios.
Calidad de la evidencia
La calidad general de la evidencia fue muy baja. La evidencia de muy baja calidad significa que no existe mucha seguridad acerca del impacto del paracetamol solo para tratar el dolor por cáncer. Se desconoce si el uso de paracetamol solo o en combinación con un opiáceo como la codeína o la morfina es beneficioso.
Authors' conclusions
Summary of findings
| Paracetamol plus opioid compared with the same dose of opioid alone for cancer pain | ||||||
| Patient or population: people with cancer pain Settings: inpatient or outpatient Intervention: paracetamol plus opioid Comparison: same dose of opioid alone | ||||||
| Outcomes | Probable outcome with | Probable outcome with | RR | No of studies, participants | Quality of the evidence | Comments |
| Participants with at least 30% or at least 50% reduction in pain | No data | No data | N/A | Very low | Very low quality because no or inadequate data | |
| PGIC much or very much improved | No data | No data | N/A | Very low | Very low quality because no or inadequate data | |
| Mean pain intensity at end of study | No difference between treatment groups | 3 studies, 93 participants | Very low | Very low quality because no or inadequate data | ||
| Pain no worse than mild at one or two weeks (or equivalent) | No data | No data | N/A | Very low | Very low quality because no or inadequate data | |
| Mean quality of life or "well‐being" | No difference between treatment groups | N/A | 3 studies, 93 participants | Very low | Very low quality because no or inadequate data | |
| Participant preference | Better: 15/52 | Better: 9/52 (No different: 28/52) | Not calculated | 2 studies, 52 participants | Very low | Very low quality because no or inadequate data |
| Adverse events | No difference between groups for specific opioid‐related adverse events | N/A | 2 studies, 80 participants (maximum) | Very low | Very low quality because no or inadequate data | |
| Serious adverse events | None specifically reported. 1 death due to underlying disease ‐ treatment unclear | N/A | 3 studies, 93 participants | Very low | Very low quality because no or inadequate data | |
| CI: Confidence interval; RR: Risk Ratio | ||||||
| Descriptors for levels of evidence (EPOC 2015): † Substantially different: a large enough difference that it might affect a decision. | ||||||
Background
A previous Cochrane review that examined the evidence for nonsteroidal anti‐inflammatory drugs (NSAIDs) or paracetamol, alone or combined with opioids, for cancer pain was withdrawn in 2015 because it was out of date (McNicol 2015); the date of the last search was 2005.
This is one of three reviews on the efficacy and safety of oral non‐opioid medicines to treat cancer pain, in this case focusing on paracetamol in adults and children. Another review will examine oral NSAIDs in adults (Derry 2017). A separate review will examine the efficacy of NSAIDs for cancer pain in children (Cooper 2017).
Description of the condition
Cancer is estimated to cause over eight million deaths per annum ‐ approximately 13% of deaths worldwide (IARC 2012). Globally, 32 million people are living with cancer, and detailed information for individual countries is available on the WHO website for the International Agency for Research on Cancer (http://globocan.iarc.fr/Pages/fact_sheets_cancer.aspx). In the UK alone in 2014, there were around 350,000 new cases of cancer annually, with around 50% of people surviving for 10 years or more after diagnosis (Cancer Research UK 2016).
Cancer pain is perhaps one of the most feared symptoms associated with the disease. Pain may be the first symptom to cause someone to seek medical advice that leads to a diagnosis of cancer, and 30% to 50% of all people with cancer will experience moderate to severe pain (Portenoy 1999). Pain can occur at any time as the disease progresses, but the frequency and intensity of pain tends to increase as the cancer advances (Portenoy 1999; Van den Beuken‐van Everdingen 2016). For people with advanced cancer, some 75% to 90% will experience pain having a major impact on daily living (Wiffen 2016). Pain had a significant negative correlation with quality of life in people with cancer in China, Japan, and Palestine, for example (Deng 2012; Dreidi 2016; Mikan 2016). A recent systematic review has shown that approximately 40% of patients suffered pain after curative treatment, 55% during cancer treatment and 66% in advanced disease. Pain related to cancer is frequently described as distressing or intolerable by more than one‐third of patients (Breivik 2009; Van den Beuken‐van Everdingen 2016).
Cancer pain can be the result of the cancer itself, interventions to treat the cancer, and sometimes other underlying pains. Cancer‐related pain is a mosaic of different types of pain generated through different mechanisms. The biology of pain from bone metastasis may well differ from pain due to obstruction of a viscus (internal organ) or invasion of soft tissue, resulting in differences in responsiveness to analgesics that act via different mechanisms. Prevalence of pain is also linked to cancer type, with head and neck cancer showing the highest prevalence. Age also has an impact, with younger patients experiencing more pain (Prommer 2015). For this review, we will not consider postsurgical pain or specific neuropathic pain conditions.
The current World Health Organization (WHO) cancer pain ladder for adults recommends the use of non‐opioid analgesics, including paracetamol, as the first step on the ladder, with or without an adjuvant (WHO 2017). Non‐opioid analgesics are also to be used on the second and third steps, together with weak or strong opioids. The current National Institute for Health and Care Excellence (NICE) in the UK advises that non‐opioid analgesics alone be used for treating mild pain (0 to 3 on a 0 to 10 pain scale), together with a weak opioid such as codeine or tramadol for mild to moderate pain (3 to 6), and with a strong opioid such as morphine for severe pain (6 to 10) (NICE 2016). Some authorities have suggested that the second step on the ladder could be removed, and replaced with low doses of strong opioids such as morphine (Twycross 2014).
Children with cancer consider pain as the most prevalent symptom, usually resulting from treatment side effects or painful procedures (Twycross 2015). The amount and quality of research on pharmacological treatments for children tends to be poor (Mercadante 2014).
Description of the intervention
Paracetamol (acetaminophen) is available in a very large number of formulations and products with different names, including Panadol and Tylenol. Paracetamol plus codeine often comes with the generic name co‐codamol, and paracetamol plus dihydrocodeine as co‐dydramol. A listing of brand names by country is available but the list is too long to be given here (Drugs.com 2016). Worldwide paracetamol use is measured in thousands of tonnes annually, and questions have been asked about the benefits and risk of such extensive use (Moore 2016).
Paracetamol was first identified as the active metabolite of two older antipyretic drugs, acetanilide and phenacetin, in the late nineteenth century (Axelrod 2003). Since then, it has become one of the most popular antipyretic and analgesic drugs worldwide, and is often also used in combination with other drugs. It became available in the UK on prescription in 1956, and without prescription (over‐the‐counter) in 1963 (PIC 2015). Nonprescription medications are less expensive, more accessible, and have favourable safety profiles relative to many prescription treatments. There have been calls for the position of paracetamol as a widely‐available analgesic to be re‐evaluated, based on an assessment of evidence over the past 130 years (Brune 2015).
Despite a low incidence of adverse effects, paracetamol has a recognised potential for hepatotoxicity and is thought to be responsible for approximately half of all cases of liver failure in the UK (Hawton 2001), and about 40% in the USA (Norris 2008). One study, evaluating all cases of acute liver failure leading to registration for transplantation (ALFT) across seven European countries for a three‐year period, showed that paracetamol overdose was responsible for one‐sixth of cases of ALFT, though this varied considerably between each country (Gulmez 2015). Acute paracetamol hepatotoxicity at therapeutic doses has been judged to be extremely unlikely, despite reports of so‐called 'therapeutic misadventure' (Prescott 2000). However, it has been observed that non‐overdose ALFT is more likely to follow therapeutic‐dose paracetamol exposure than similar NSAID exposure (Gulmez 2013). Legislative changes have been introduced in the UK to restrict pack sizes and the maximum number of tablets permitted in nonprescription sales (CSM 1997), on the basis of evidence that poisoning is lower in countries that restrict availability (Gunnell 1997; Hawton 2001). The contribution of these changes, which were inconvenient and costly (particularly to people with chronic pain), to any observed reductions in incidence of liver failure or death, remains uncertain (Bateman 2014a; Bateman 2014b; Hawkins 2007; Hawton 2013). Changes have also been made in the USA, and professionals have been advised not to dispense prescription combination drugs with more than 325 mg paracetamol (FDA 2015).
There is a substantial public health impact of paracetamol toxicity. In the USA, incidence proportions peaked at age two years and ages 16 to 18 years (Altyar 2015). There have been concerns over the safety of paracetamol in people with compromised hepatic function (people with severe alcoholism, cirrhosis, or hepatitis), but these have not been substantiated (Dart 2000; PIC 2015).
The use of paracetamol during pregnancy has been questioned following reports that it is linked to behavioural problems and hyperkinetic disorders in children whose mothers took it during pregnancy (Liew 2014), and suggestions that it can interfere with sex hormones (Mazaud‐Guittot 2013).
In an analysis of single‐dose studies in migraine, there was no evidence that adverse events were more common with paracetamol 1000 mg than with placebo, and no serious adverse events occurred with paracetamol alone (Derry 2013).
Oral paracetamol has long been used as a first‐line analgesic for a variety of acute and chronic conditions. It has modest efficacy in acute pain and migraine (Derry 2013; Toms 2008), but some randomised trials, systematic reviews, and meta‐analyses have suggested that there is no good evidence for a clinically relevant benefit of paracetamol (as monotherapy) in many chronic pain conditions, such as osteoarthritis and back pain (Machado 2015; Moore 2014a; Williams 2014). There are few or no data for a range of other common painful conditions, including dysmenorrhoea and chronic neck pain. Moreover, accumulating evidence from observational studies indicates a considerable degree of paracetamol toxicity, especially at the upper end of standard analgesic doses (Roberts 2016).
How the intervention might work
The lack of significant anti‐inflammatory activity of paracetamol implies a mode of action distinct from that of NSAIDs; yet, despite years of use and research, the mechanisms of action of paracetamol are not fully understood. NSAIDs act by inhibiting the activity of cyclo‐oxygenase (COX), now recognised to consist of two isoforms (COX‐1 and COX‐2), which catalyse the production of prostaglandins responsible for pain and inflammation. Paracetamol has previously been shown to have no significant effects on COX‐1 or COX‐2 (Schwab 2003), but is now being considered as a selective COX‐2 inhibitor (Hinz 2008). Significant paracetamol‐induced inhibition of prostaglandin production has been demonstrated in tissues in the brain, spleen, and lung (Botting 2000; Flower 1972). A 'COX‐3 hypothesis', wherein the efficacy of paracetamol is attributed to its specific inhibition of a third COX isoform enzyme, COX‐3 (Botting 2000; Chandrasekharan 2002), now has little credibility, and a central mode action of paracetamol is thought to be likely (Graham 2005). Paracetamol metabolism is subject to genetic variation (Zhao 2011).
There is some experimental research in rats to suggest that paracetamol may have an effect in neuropathic pain via cannabinoid receptors (Curros‐Criado 2009; Dani 2007). One single case report suggested intravenous paracetamol was effective for phantom limb pain (Gulcu 2007).
Why it is important to do this review
A previous Cochrane review examined the evidence for NSAIDs or paracetamol, alone or combined with opioids, for cancer pain (McNicol 2015), with the last search date in 2005. There have been few subsequent systematic reviews of the evidence. Nabal found little evidence of efficacy for combinations with opioids (Nabal 2012). A review of paracetamol and NSAIDs concluded that while the role of these non‐opioid drugs remains controversial, the evidence for paracetamol alone was limited (Mercadante 2013).
The evidence of effectiveness of the WHO pain ladder for cancer has been examined several times in the past two decades. These studies reported varying degrees of success, typically between 20% and 100% of people with cancer pain achieving good relief (Azevedo São Leão Ferreira 2006; Carlson 2016; Jadad 1995), with some suggesting that as many as 50% of people with cancer pain are undertreated (Deandrea 2008).
In many countries, opioids are severely restricted, if available at all. This means that many people with cancer will have considerable pain and suffering unless non‐opioid analgesics can be used. This review was designed with the intention of informing policy makers such as the WHO on the possible utility of paracetamol to treat cancer‐related pain. It is hoped that the review will inform patients and carers on the value or otherwise of paracetamol in this context.
Other relevant Cochrane reviews include an assessment of codeine alone and with paracetamol (Straube 2014), and an evaluation of tramadol alone and with paracetamol (Wiffen 2017). For our purposes we wanted to assess any additional efficacy of paracetamol by comparing paracetamol plus opioid with the same dose of opioid alone, a different question to that addressed by those reviews. A number of other reviews have evaluated the evidence for opioids, including buprenorphine (Schmidt‐Hansen 2015a), transdermal fentanyl (Hadley 2013), hydromorphone (Bao 2016), morphine (Wiffen 2016), oxycodone (Schmidt‐Hansen 2015b), and tapentadol (Wiffen 2015).
The standards used to assess evidence in pain trials have changed substantially in recent years, with particular attention being paid to trial duration, withdrawals, and statistical imputation following withdrawal, all of which can substantially alter estimates of efficacy (Moore 2013b). The most important change is the move away from using mean pain scores, or mean change in pain scores, to the number of people who have a large decrease in pain (by at least 50%) (Dworkin 2008; Moore 2013a). Pain intensity reduction of 50% or more correlates with improvements in comorbid symptoms, function, and quality of life generally (Moore 2014). These standards are set out in the PaPaS author and referee guidance for pain studies of the Cochrane Pain, Palliative and Supportive Care Group (PaPaS 2012).
Three additional issues potentially affect how evidence is evaluated.
The first issue is study size and the overall amount of information available for analysis. There are issues over both random chance effects with small amounts of data, and potential bias in small studies, especially in pain (Dechartes 2013; Dechartres 2014; Fanelli 2017; Moore 1998; Nguyen 2017; Nüesch 2010; Thorlund 2011). Cochrane reviews have been criticised for perhaps overemphasising results of underpowered studies or analyses (AlBalawi 2013; Turner 2013). On the other hand, it may be unethical to ignore potentially important information from small studies or to randomise more participants if a meta‐analysis including small, existing studies provided conclusive evidence. In this review, we have therefore chosen to limit analyses to studies with a minimum of 25 participants randomised per treatment group, which we believe has not been done previously.
The second issue is that of study duration. Previous reviews have examined studies of any duration, even in some cases single‐dose studies, or studies lasting one day or less, often with intravenous or intramuscular formulations (McNicol 2015; Mercadante 2013). While short term studies and non‐oral formulations may have some relevance in some circumstances, they have little relevance to the vast majority of people with cancer pain who will be treated with oral paracetamol over weeks, months, or even years. We have therefore chosen to include only studies with five days' duration or longer.
The third issue is that of comparators. Many cancer pain studies involve direct comparisons of one or more formulations of the same drug, as particularly noted for oral morphine (Wiffen 2016). This type of design has limited importance in evaluating the analgesic contribution of a drug, if that is not already well‐established (McQuay 2005). For that reason, we have limited this review to the two comparators that speak to the efficacy of paracetamol in cancer pain, namely the comparison of paracetamol versus placebo, and paracetamol plus opioid versus the same dose of opioid alone. The latter comparison would be similar to methods used for determining dose‐response of analgesics in acute pain (McQuay 2007), or caffeine as an analgesic adjuvant in acute pain (Derry 2014).
Objectives
To assess the efficacy of oral paracetamol (acetaminophen) for cancer pain in adults and children, and the adverse events reported during its use in clinical trials.
Methods
Criteria for considering studies for this review
Types of studies
To be included, studies had to:
-
be randomised (described as 'randomised' anywhere in the manuscript);
-
ideally be double‐blind, but we would have included single‐blind or open studies because we expected there to be a limited literature on this important topic, and we desired to be as inclusive as possible;
-
include a minimum of 25 participants randomised per treatment arm; for cross‐over studies this meant a minimum of 25 participants at the initial randomisation.
-
have a study duration of at least five days of continuous treatment, with outcomes reported at the end of that period.
We excluded non‐randomised studies, studies of experimental pain, case reports and clinical observations. Studies had to be fully published or available as extended abstracts (e.g. from clinical trial websites); we excluded short (usually conference) abstracts as these are often unreliable (PaPaS 2012).
Types of participants
We included studies of adults with cancer pain of any intensity. We did not find any eligible studies in children. We did not consider postsurgical pain or specific neuropathic pain conditions.
Types of interventions
Orally administered paracetamol for cancer pain, where paracetamol alone was compared with placebo, or where paracetamol was combined with an opioid and compared with the same dose of opioid alone.
Types of outcome measures
Pain had to be measured using a validated assessment tool. For pain intensity, for example, this could be a 100 mm visual analogue scale (VAS) or 11‐point numerical rating scale (no pain to worst pain imaginable), or a four‐point categorical scale (none, mild, moderate, severe), and for pain relief, for example, this could be a 100 mm VAS (no relief to complete relief), or five‐point categorical scale (none, a little, some, a lot, complete or words to that effect). Measures of 30% or greater (moderate) and 50% or greater (substantial) reduction of pain over baseline are recommended outcomes for chronic pain studies from the Initiative on Methods, Measurement, and Pain Assessment in Clinical Trials (IMMPACT) (Dworkin 2008).
A 30% or greater reduction of pain from baseline corresponds to much or very much improved on Patient Global Impression of Change (PGIC), and 50% or greater reduction corresponds to very much or completely improved. We would also use results equivalent to no pain or mild pain, because these are also outcomes acceptable to people with various types of pain (Moore 2013a).
Primary outcomes
-
Number of participants with pain reduction of 50% or greater from baseline.
-
Number of participants with pain reduction of 30% or greater from baseline.
-
Number of participants with pain no worse than mild (Moore 2013a).
-
Number of participants with PGIC much improved or very much improved (or equivalent wording).
Secondary outcomes
-
Quality of life.
-
Use of rescue medication.
-
Participant satisfaction or preference.
-
Serious adverse events, including death.
-
Other adverse events, particularly reports of effects of treatment on somnolence, appetite, or thirst (Wiffen 2014).
-
Withdrawals due to lack of efficacy, adverse events, or any cause.
Search methods for identification of studies
Electronic searches
We searched the following databases without language or date restrictions.
-
The Cochrane Central Register of Controlled Trials (CENTRAL) (via CRSO) on 27 March 2017.
-
MEDLINE (via Ovid) from 1946 to 27 March 2017.
-
Embase (via Ovid) from 1974 to 27 March 2017.
We used a combination of MeSH (or equivalent) and text word terms and tailored search strategies to individual databases. The search strategies for CENTRAL, MEDLINE, and Embase are in Appendix 1, Appendix 2, and Appendix 3, respectively.
Searching other resources
We searched the metaRegister of controlled trials in ClinicalTrials.gov (www.clinicaltrials.gov) and the WHO International Clinical Trials Registry Platform (ICTRP) (http://apps.who.int/trialsearch/) for unpublished and ongoing trials. In addition, we checked reference lists of reviews and retrieved articles for additional studies and performed citation searches on key articles. We did not contact authors for additional information.
Data collection and analysis
Selection of studies
Two review authors (RAM, SD) independently read the abstract of each study identified by the search, eliminated studies that clearly did not satisfy inclusion criteria, and obtained full copies of the remaining studies. Two review authors (RAM, SD) then read these studies independently to select relevant studies for inclusion. In the event of disagreement, a third review author (PW) was available to adjudicate. We did not anonymise the studies before assessment. We have included a PRISMA flow chart in the review to show the status of identified studies as recommended in Section 11.2.1 of the Cochrane Handbook for Systematic Reviews of Interventions (Higgins 2011). We included studies in the review if they satisfied our inclusion criteria, irrespective of whether measured outcome data were reported in a 'usable' way.
Data extraction and management
Two review authors (RAM, SD) independently extracted data using a standard form and checked for agreement before entry into Review Manager (RevMan) (RevMan 2014). We included information about the number of participants treated and demographic details, type of cancer, drug and dosing regimen, study design (placebo or active control) and methods, study duration and follow‐up, analgesic outcome measures and results, withdrawals and adverse events. If necessary, we would have collated multiple reports of the same study, so that each study rather than each report was the unit of interest in the review. We collected characteristics of the included studies in sufficient detail to complete a Characteristics of included studies table.
Assessment of risk of bias in included studies
Two review authors (RAM, SD) independently assessed risk of bias for each study, using the criteria outlined in the Cochrane Handbook for Systematic Reviews of Interventions (Chapter 8, Higgins 2011) and adapted from those used by the Cochrane Pregnancy and Childbirth Group, with any disagreements resolved by discussion. We completed a 'Risk of bias' table for each included study using the 'Risk of bias' tool in RevMan (RevMan 2014).
We assessed the following for each study.
-
Random sequence generation (checking for possible selection bias). We assessed the method used to generate the allocation sequence as: low risk of bias (any truly random process, e.g. random number table; computer random number generator); unclear risk of bias (method used to generate sequence not clearly stated). We excluded studies using a non‐random process (e.g. odd or even date of birth; hospital or clinic record number).
-
Allocation concealment (checking for possible selection bias). The method used to conceal allocation to interventions prior to assignment determines whether intervention allocation could have been foreseen in advance of, or during, recruitment or changed after assignment. We assessed the methods as: low risk of bias (e.g. telephone or central randomisation; consecutively numbered sealed opaque envelopes); unclear risk of bias (method not clearly stated); high risk of bias, where study did not conceal allocation (e.g. open list).
-
Blinding of participants and personnel (checking for possible performance bias). We assessed the methods used to blind study participants and personnel from knowledge of which intervention a participant received. We assessed methods as: low risk of bias (study stated that it was blinded and described the method used to achieve blinding, such as identical tablets matched in appearance or smell, or a double‐dummy technique); unclear risk of bias (study stated that it was blinded but did not provide an adequate description of how it was achieved); high risk of bias (study participants or personnel, or both, not blinded).
-
Blinding of outcome assessment (checking for possible detection bias). We assessed the methods used to blind study participants and outcome assessors from knowledge of which intervention a participant received. We assessed the methods as: low risk of bias (study had a clear statement that outcome assessors were unaware of treatment allocation, and ideally described how this was achieved); unclear risk of bias (study stated that outcome assessors were blind to treatment allocation but lacked a clear statement on how it was achieved); high risk of bias (outcome assessment not blinded).
-
Incomplete outcome data (checking for possible attrition bias due to the amount, nature and handling of incomplete outcome data). We assessed the methods used to deal with incomplete data as: low risk (fewer than 10% of participants did not complete the study or used ‘baseline observation carried forward’ analysis, or both); unclear risk of bias (used 'last observation carried forward' analysis); high risk of bias (used 'completer' analysis).
-
Reporting bias due to selective outcome reporting (reporting bias). We checked if an a priori study protocol was available and if all outcomes of the study protocol were reported in the publications of the study. We assessed the methods used to deal with incomplete data as: low risk of reporting bias if the study protocol was available and all of the study’s prespecified (primary and secondary) outcomes that were of interest in the review were reported in the pre‐specified way, or if the study protocol was not available but it was clear that the published reports included all expected outcomes, including those that were pre‐specified (convincing text of this nature may be uncommon); high risk of reporting bias if not all of the study’s pre‐specified primary outcomes were reported; one or more primary outcomes was reported using measurements, analysis methods or subsets of the data (e.g. subscales) that were not pre‐specified; one or more reported primary outcomes were not pre‐specified (unless clear justification for their reporting was provided, such as an unexpected adverse effect); one or more outcomes of interest in the review were reported incompletely so that they could not be entered in a meta‐analysis; the study report did not include results for a key outcome that would be expected to have been reported for such a study; and unclear risk of bias risk of bias if insufficient information is available to permit judgement of ‘Low risk’ or ‘High risk’.
-
Size of study (checking for possible biases confounded by small size (Dechartes 2013; Dechartres 2014; Moore 1998; Nüesch 2010; Thorlund 2011)). We assessed studies as being at low risk of bias (200 participants or more per treatment arm); unclear risk of bias (50 to 199 participants per treatment arm); high risk of bias (fewer than 50 participants per treatment arm).
Measures of treatment effect
We planned to use dichotomous data to calculate risk difference (RD) or risk ratio (RR) with 95% confidence intervals (CIs) using a fixed‐effect model, and calculate numbers needed to treat for one additional beneficial outcome (NNT) as the reciprocal of the absolute risk reduction (McQuay 1998). For unwanted effects, the number needed to treat becomes the number needed to treat for one additional harmful outcome (NNH), and is calculated in the same manner.
We planned to use the following terms to describe adverse outcomes in terms of harm or prevention of harm.
-
When significantly fewer adverse outcomes occurred with paracetamol than with control (placebo or active control), we used the term number needed to treat to prevent one event (NNTp).
-
When significantly more adverse outcomes occurred with paracetamol compared with control (placebo or active control) we used the term number needed to treat for an additional harmful outcome or cause one event (NNH).
We did not plan to use continuous data for the primary outcome because it is inappropriate where there is an underlying skewed distribution, as is usually the case with analgesic response.
Unit of analysis issues
The unit of randomisation was the individual participant.
Dealing with missing data
We planned to use intention‐to‐treat (ITT) analyses: participants who were randomised, took the study medication, and gave a minimum of one post‐baseline assessment. We have reported per‐protocol data in the absence of ITT data.
Assessment of heterogeneity
We planned to assess statistical heterogeneity using L'Abbé plots, a visual method for assessing differences in results of individual studies (L'Abbé 1987), and by use of the I2 statistic. We anticipated that there could be an effect of differences between participants, environment (inpatient versus outpatient), and outcome measures. We planned to explore these with subgroup and sensitivity analyses where there were sufficient data, recognising the difficulties of assessing heterogeneity with small numbers of small studies (Gavaghan 2000; IntHout 2015). In the event, there were insufficient data to assess heterogeneity.
Assessment of reporting biases
We planned to use dichotomous data of known utility (Moore 2010a; Moore 2013a). The review would not depend on what additional information authors of the original studies chose to report or not.
We planned to undertake an assessment of publication bias if there were sufficient data for meta‐analysis, using a method designed to detect the amount of unpublished data with a null effect required to make any result clinically irrelevant (usually taken to mean an NNT of 10 or higher) (Moore 2008). In the event, there were insufficient data to assess publication bias.
Data synthesis
We planned to undertake a quantitative synthesis and present data in forest plots if there were sufficient data. In the event of substantial clinical heterogeneity, we would switch off the totals in the forest plots.
-
We would undertake a meta‐analysis only if participants, interventions, comparisons, and outcomes were judged to be sufficiently similar to ensure an answer that is clinically meaningful.
-
We would undertake a meta‐analysis only where there were data from at least two studies and 200 participants for analysis.
-
We planned to use RevMan for meta‐analysis (RevMan 2014) and Excel for NNT and NNH.
In the event, there were insufficient data for pooling of data for any outcome.
Quality of the evidence
We used the GRADE system to assess the quality of the evidence related to the key outcomes listed in Types of outcome measures, as appropriate (Appendix 4). Two review authors (RAM, SD) independently rated the evidence for each outcome.
We paid particular attention to inconsistency, where point estimates vary widely across studies or confidence intervals (CIs) of studies show minimal or no overlap (Guyatt 2011), and to the potential for publication bias, based on the amount of unpublished data required to make the result clinically irrelevant (Moore 2008).
Lastly, there may be circumstances where the overall rating for a particular outcome needs to be adjusted as recommended by GRADE guidelines (Guyatt 2013a). For example, if there are so few data that the results are highly susceptible to the random play of chance, or if a study uses last observation carried forward (LOCF) imputation in circumstances where there are substantial differences in adverse event withdrawals, one would have no confidence in the result, and would need to downgrade the quality of the evidence by three levels, to very low quality. In circumstances where there were no data reported for an outcome, we have reported the level of evidence as very low quality (Guyatt 2013b).
In addition, we are aware that many Cochrane reviews are based largely or wholly on small underpowered studies, and that there is a danger of drawing erroneous conclusions of evidence based on inadequate information (AlBalawi 2013; Brok 2009; Roberts 2015; Turner 2013).
'Summary of findings' table
We have included a 'Summary of findings' table as set out in the Pain, Palliative and Supportive Care Review Group author guide (PaPaS 2012) and recommended in Chapter 4.6.6 of the Cochrane Handbook for Systematic Reviews of Interventions (Higgins 2011). We present the main findings in a simple tabular format, to include key information concerning the quality of evidence, the magnitude of effect of the interventions examined, the sum of available data on the outcomes of at least 30% and at least 50% pain relief, PGIC much or very much improved, pain no worse than mild at one or two weeks, adverse events, and serious adverse events. In addition, we have also included other measures of efficacy or harm (mean pain intensity at end of study, quality of life or well‐being at end of treatment, and patient satisfaction or preference).
For the 'Summary of findings' table we used the following descriptors for levels of evidence (EPOC 2015).
High:
This research provides a very good indication of the likely effect. The likelihood that the effect will be substantially different† is low.
Moderate:
This research provides a good indication of the likely effect. The likelihood that the effect will be substantially different† is moderate.
Low:
This research provides some indication of the likely effect. However, the likelihood that it will be substantially different† is high.
Very low:
This research does not provide a reliable indication of the likely effect. The likelihood that the effect will be substantially different† is very high.
† Substantially different: a large enough difference that it might affect a decision.
Subgroup analysis and investigation of heterogeneity
We planned several possible subgroup analyses, depending on the availability of data.
-
Because we expected that many studies would have a cross‐over design that could impede meta‐analysis (Elbourne 2002), we planned to examine cross‐over and parallel‐group designs separately.
-
We planned to investigate whether subgroup analysis by dose of paracetamol (up to 2000 mg/day, 2001 mg/day to 4000 mg/day) was possible.
-
We planned to analyse separately studies with paracetamol alone, and paracetamol combined with opioid. We anticipated that these studies might also reflect different levels of initial pain intensity.
We planned no other subgroup analyses because the data were expected to be sparse, with small numbers of small trials. In the event, there were insufficient data for any subgroup analysis.
Sensitivity analysis
We did not plan any sensitivity analyses because the data were expected to be sparse, with small numbers of small trials.
Results
Description of studies
Results of the search
Searches identified 261 articles in CENTRAL, 326 articles in MEDLINE, 834 articles in Embase, and four additional study reports in clinical trial registries. After screening and assessment of relevant full texts, we included three studies and excluded six studies.
Two studies are awaiting classification. NCT00152854 has completed, but with only 12 participants and no study results posted; there were insufficient data to judge methodological criteria and it would probably be excluded because of its small size. We have been unable to obtain the full text of Pacilio 1989.
One study with an estimated enrolment of 140 participants is ongoing, with an expected completion date of April 2019 (NCT02706769). This double‐blind study appears to use a randomised withdrawal design, in which participants taking daily regular strong opioids plus 4 x 1000 mg paracetamol are randomised to continue with opioid plus paracetamol or opioids alone.
Figure 1 illustrates the flow of studies in the review.
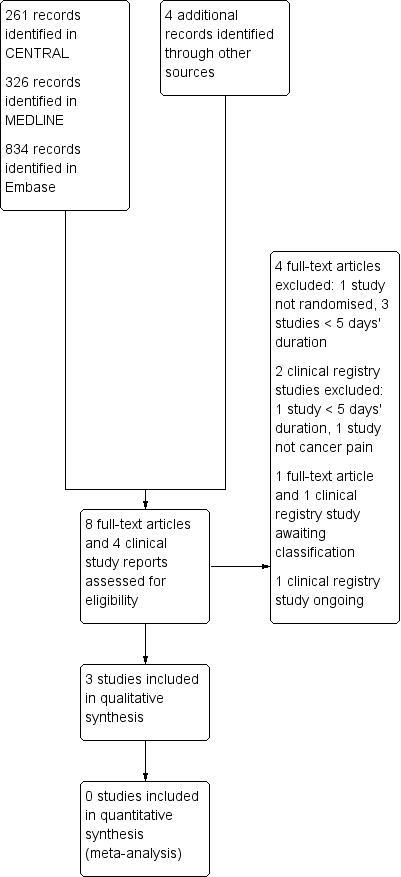
Study flow diagram.
Included studies
We included three studies (Axelsson 2003; Cubero 2010; Israel 2010), all of which were randomised, double‐blinded, and placebo‐controlled. They initially randomised 122 participants, of whom 95 completed the studies.
One study (Cubero 2010) used a parallel group design and had a treatment duration of one week. Two studies used a cross‐over design, with treatment periods of one week (Axelsson 2003) and five days (Israel 2010). Neither cross‐over study had a washout period, but Israel 2010 stated that data from only the last four days were used in analyses to avoid carryover effects. We used results from both parts of the cross‐over.
All studies used paracetamol as an add‐on to established treatment with strong opioids and other non‐paracetamol medication. Cubero 2010 switched participants abruptly ("stop/start") from stable doses of morphine to equivalent doses of methadone, with or without paracetamol. No studies tested paracetamol alone.
Each study included both male and female participants with various types of cancer; mainly colorectal, prostate, breast, and pancreas. The mean ages ranged from 56 to 72 years (range 19 to 86). In Axelsson 2003, participants had baseline pain intensity on opioid treatment of less than 4/10 (median 2 on scale 0 to 3); in Cubero 2010, participants had a median baseline pain intensity on treatment of 5/10 for the paracetamol arm and 3.5/10 for the placebo arm; in Israel 2010, participants had a baseline pain intensity of at least 2/10.
The median daily dose of oral morphine was 70 mg (range 20 mg to 440 mg) in Axelsson 2003, 60 mg (40 mg to 540 mg) in Cubero 2010, and 225 mg (200 mg to 900 mg, plus one participant taking 9000 mg) in Israel 2010.
Further details are in the Characteristics of included studies table.
Two studies are awaiting assessment. NCT00152854 was a randomised, double‐blind cross‐over study in which paracetamol or placebo was added to existing opioid therapy for periods of seven days. Participants were taking at least 60 mg morphine equivalents per day. The study has completed, but we were unable to find any results, other than only 12 participants completed. Pacilio 1989 compared paracetamol with flupirtine in cancer pain; no further details were available, and would probably not be included.
Excluded studies
We excluded six studies (ACTRN12610000893000; Axelsson 2008; Danninger 1993; JPRN‐UMIN000009292; Nickles 2016; Stockler 2004), because the treatment periods were less than five days or they were not randomised. Further details are in the Characteristics of excluded studies table.
Risk of bias in included studies
Risk of bias in individual studies is shown in Figure 2.
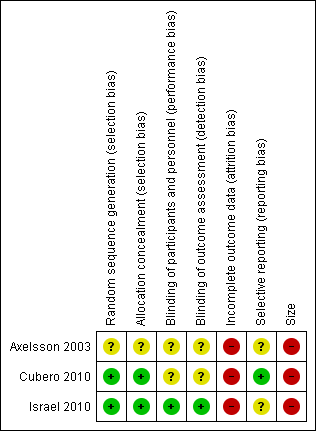
'Risk of bias' summary: review authors' judgements about each risk of bias item for each included study.
Allocation
All three studies were randomised, but one did not adequately describe the methods used to generate the random sequence or to conceal the allocation sequence (Axelsson 2003, reported as a letter).
Blinding
All three studies were double‐blind, but only one adequately described the method used to maintain the blinding (Israel 2010).
Incomplete outcome data
We judged all three studies at high risk of attrition bias because they had substantial attrition (> 10%) and analysed only the participants who completed the study.
Selective reporting
We judged one study to have low risk of bias because there was an on‐line protocol (Cubero 2010). The other two studies were at unclear risk of bias for selective reporting. We did not have access to protocols to check for missing outcomes, but all relevant outcomes specified in the publication were reported.
Other potential sources of bias
All three studies included fewer than 50 participants per treatment arm and we judged them at high risk of bias due to size.
Effects of interventions
See: Summary of findings for the main comparison
Efficacy
A summary of results for efficacy outcomes in individual studies is available in Appendix 5 and summary of findings Table for the main comparison.
Pain outcomes
No studies tested paracetamol alone.
None of the studies reported any of our primary outcomes: participants with pain reduction of at least 50%, and at least 30%, from baseline; participants with pain no worse than mild at the end of the treatment period; participants with PGIC of much improved or very much improved (or equivalent wording).
All studies (93 participants analysed) reported no difference between paracetamol plus opioid and placebo plus opioid for mean pain intensity measures at the end of the treatment period. Cubero 2010 also found no difference between treatment arms for time to return to baseline pain intensity following an abrupt switch from morphine to methadone, either with or without paracetamol.
We assessed this as very low‐quality evidence because of high risk of bias and small size.
Quality of life
Two studies (71 participants analysed) reported that there was no difference between participants treated with paracetamol and placebo for quality of life assessments at the end of the treatment period (Axelsson 2003; Cubero 2010). The other study (22 participants analysed) reported no difference in 'well‐being' between the interventions (Israel 2010).
We assessed this as very low‐quality evidence because of high risk of bias and small size.
Use of rescue medication
Israel 2010 reported no difference between paracetamol and placebo arms for use of rescue medication for episodes of breakthrough pain. Cubero 2010 used requirement for rescue medication to adjust the dose of methadone.
We assessed this as very low‐quality evidence because of high risk of bias and small size.
Participant satisfaction or preference
The two cross‐over studies reported that pain was better with paracetamol in 15/52 participants, better with placebo in 9/52 participants, and no different in 28/52 participants after five or seven days of treatment (Axelsson 2003; Israel 2010).
We assessed this as very low‐quality evidence because of high risk of bias and small size.
Harm
A summary of results for adverse outcomes in individual studies is available in Appendix 6.
Serious adverse events
None of the studies specifically reported any serious adverse events, but there was one death due to underlying disease in Cubero 2010. It was not clear which treatment the participant was receiving.
We assessed this as very low‐quality evidence because of high risk of bias and small size.
Other adverse events
Axelsson 2003 did not report on adverse events. Cubero 2010 reported no difference between groups for intensity of symptoms of constipation, xerostomia (dry mouth), nausea, vomiting, and somnolence. Israel 2010 found no difference between groups for intensity of nausea, drowsiness, unclear thinking, and constipation.
We assessed this as very low‐quality evidence because of high risk of bias and small size.
Withdrawal due to adverse events
None of the studies specifically reported on withdrawals due to adverse events.
We assessed this as very low‐quality evidence because of high risk of bias and small size.
Withdrawal due to lack of efficacy
Four participants in Cubero 2010 withdrew early due to intense pain following the switch from morphine to methadone, but there were no data for treatment arms with, and without paracetamol. One participant in Israel 2010 withdrew early because of 'unstable pain' while receiving paracetamol.
We assessed this as very low‐quality evidence because of high risk of bias and small size.
Discussion
Summary of main results
Few studies met the criteria for inclusion, particularly the nature of the efficacy results presented. Thus, the results of the studies available for paracetamol for cancer pain are insufficient to allow any conclusions to be drawn about its efficacy or harm in treating cancer pain. The evidence is insufficient to support or refute its use.
No studies were found for the use of paracetamol alone in mild or moderate cancer pain. No studies were found using paracetamol alone or in combination with an opioid in children.
The three available studies examined the use of paracetamol plus an opioid versus the opioid alone in studies where average pain scores were indicative of mild to moderate pain, with scores of between 2/10 and 5/10 on a 0 to 10 VAS scale. These showed no obvious additional benefit of paracetamol in terms of pain relief, quality of life, or participant satisfaction or preference. However, the median doses of daily morphine used were 60 mg, 70 mg, and 225 mg, with some individuals taking up to several hundred mg daily or more. In the circumstance, it may be argued that any additional analgesic effect of oral paracetamol would be difficult to detect.
Excluded studies were of short duration, not randomised, or type of pain was not cancer pain. We know of one study outside our scope that randomly compared non‐steroidal anti‐inflammatory drugs (NSAIDs), aspirin, and paracetamol, without placebo, in a cross‐over design for one week each, but in a small number (typically 15) of participants (Ventafridda 1990). The paracetamol dose was apparently 1500 mg daily, and it demonstrated less pain relief at that dose than NSAIDs or aspirin at the doses used.
Reviews of opioids for cancer pain have used a primary efficacy outcome of people with moderate or severe cancer pain reduced to mild pain or no pain within 14 days of starting treatment, and some have reported that as many as 96% can achieve this outcome where it is reported (Hadley 2013; Wiffen 2016). While this is a methodologically difficult outcome to evaluate in people with initial mild or moderate pain, it was one of the primary outcomes sought, but it was not reported in the three included studies.
Reporting of harms provided no useful information, and could not be expected to do so given the small size of the studies, individually and together.
Where there are small numbers of small studies, there is a situation where a positive bias in favour of a therapy might be found (Dechartes 2013; Dechartres 2014; Fanelli 2017; Nguyen 2017; Nüesch 2010) even by the random play of chance (Brok 2009; Moore 1998; Thorlund 2011), and overemphasising results of underpowered studies or analyses has been criticised (AlBalawi 2013; Roberts 2015; Turner 2013). Despite having only small studies in this review, no positive effect of paracetamol was evident.
The lack of evidence of effect of paracetamol for cancer pain is similar to the situation with musculoskeletal (Machado 2015; Saragiotto 2016), and neuropathic pain (Wiffen 2016), as well as a number of other chronic pain conditions (Moore 2016).
Overall completeness and applicability of evidence
This review highlights our lack of knowledge about the effectiveness of paracetamol for cancer pain. The WHO ladder recommends non‐opioid analgesics for mild to moderate pain in the first two steps of the WHO ladder (WHO 2017), and paracetamol in many countries is the mainstay of the first two steps.
No studies addressed the use of paracetamol alone (first step), and while the three included studies addressed paracetamol added to opioids, there was only low‐quality evidence for all outcomes. Only 122 participants were randomised in the three included studies, fewer than the 140 in an ongoing study that might be more instructive (NCT02706769), at least for the combination of paracetamol with strong opioids.
None of the studies reported on any of the primary outcomes of efficacy, which are known to be important to people with pain (Moore 2013a). None of the available evidence addresses other important outcomes, such as quality of life, reducing sweats, or improving sleep.
Quality of the evidence
Our GRADE judgement was very low quality for all outcomes. Very low quality means that this research does not provide a reliable indication of the likely effect. The likelihood that the effect will be substantially different is very high.
Studies were small in size and number. All were at high risk of bias for incomplete outcome data and size; no study was unequivocally at low risk of bias for all criteria.
Potential biases in the review process
We are unaware of any biases in the review process. A number of the authors prescribe or have prescribed paracetamol for cancer pain, or have been involved with its use in people with cancer pain.
Agreements and disagreements with other studies or reviews
Our findings are in broad agreement with a previous Cochrane review (McNicol 2015) and other reviews in adults (Mercadante 2013; Nabal 2012), and children (Mercadante 2014). In this review, we included only studies with a minimum treatment period of five days, excluding some studies of short duration in these earlier reviews, but allowing any pain relieving effects of paracetamol that might be seen in clinical practice to emerge.

Study flow diagram.

'Risk of bias' summary: review authors' judgements about each risk of bias item for each included study.
| Paracetamol plus opioid compared with the same dose of opioid alone for cancer pain | ||||||
| Patient or population: people with cancer pain Settings: inpatient or outpatient Intervention: paracetamol plus opioid Comparison: same dose of opioid alone | ||||||
| Outcomes | Probable outcome with | Probable outcome with | RR | No of studies, participants | Quality of the evidence | Comments |
| Participants with at least 30% or at least 50% reduction in pain | No data | No data | N/A | Very low | Very low quality because no or inadequate data | |
| PGIC much or very much improved | No data | No data | N/A | Very low | Very low quality because no or inadequate data | |
| Mean pain intensity at end of study | No difference between treatment groups | 3 studies, 93 participants | Very low | Very low quality because no or inadequate data | ||
| Pain no worse than mild at one or two weeks (or equivalent) | No data | No data | N/A | Very low | Very low quality because no or inadequate data | |
| Mean quality of life or "well‐being" | No difference between treatment groups | N/A | 3 studies, 93 participants | Very low | Very low quality because no or inadequate data | |
| Participant preference | Better: 15/52 | Better: 9/52 (No different: 28/52) | Not calculated | 2 studies, 52 participants | Very low | Very low quality because no or inadequate data |
| Adverse events | No difference between groups for specific opioid‐related adverse events | N/A | 2 studies, 80 participants (maximum) | Very low | Very low quality because no or inadequate data | |
| Serious adverse events | None specifically reported. 1 death due to underlying disease ‐ treatment unclear | N/A | 3 studies, 93 participants | Very low | Very low quality because no or inadequate data | |
| CI: Confidence interval; RR: Risk Ratio | ||||||
| Descriptors for levels of evidence (EPOC 2015): † Substantially different: a large enough difference that it might affect a decision. | ||||||