Ecografía del primer trimestre sola o en combinación con pruebas séricas del primer trimestre para la detección del síndrome de Down
Resumen
Antecedentes
El síndrome de Down ocurre cuando una persona tiene tres copias, en lugar de dos, del cromosoma 21; o del área específica del cromosoma 21 que causa el síndrome de Down. Es la causa congénita más frecuente de discapacidad mental y también da lugar a numerosos problemas metabólicos y estructurales. Puede ser potencialmente mortal o provocar importantes problemas de salud, aunque algunos individuos solamente tienen problemas leves y pueden llevar una vida relativamente normal. Es probable que tener un niño con síndrome de Down repercuta de manera significativa sobre la vida familiar.
El cribado no invasivo basado en el análisis bioquímico del suero o la orina de la madre, o las mediciones de ecografía fetal, permiten calcular el riesgo de que un embarazo sea afectado, y aportan información para guiar las decisiones acerca de un examen definitivo.
Antes de aceptar las pruebas de detección, los padres necesitan contar con toda la información acerca de los posibles riesgos, efectos beneficiosos y consecuencias de éstas. Lo anterior incluye elecciones posteriores de pruebas adicionales a las que pueden enfrentarse y las implicaciones de las pruebas de detección con resultados falsos positivos y falsos negativos (es decir, pruebas de diagnóstico invasivas, y la posibilidad de aborto de un feto que puede ser cromosómicamente normal). Las decisiones que pueden enfrentar los padres que esperan un niño generan inevitablemente un nivel alto de ansiedad en todos los estadios del proceso de cribado, y los resultados del cribado se pueden asociar con considerable morbilidad física y psicológica. Ninguna prueba de detección puede predecir la gravedad de los problemas que tendrá un paciente con síndrome de Down.
Objetivos
Calcular y comparar la exactitud de los marcadores ecográficos del primer trimestre solos y en combinación con las pruebas séricas del primer trimestre para la detección del síndrome de Down.
Métodos de búsqueda
Se realizaron extensas búsquedas en la literatura incluyendo MEDLINE (1980 hasta 25 agosto 2011), Embase (1980 hasta 25 agosto 2011), BIOSIS vía EDINA (1985 hasta 25 agosto 2011), CINAHL vía OVID (1982 hasta 25 agosto 2011), y en la Database of Abstracts of Reviews of Effects (the Cochrane Library 2011, número 7). Se verificaron las listas de referencias y artículos de revisión publicados para obtener estudios adicionales potencialmente relevantes.
Criterios de selección
Estudios que evaluaran los exámenes de cribado ecográfico del primer trimestre, solos o en combinación con las pruebas séricas del primer trimestre (hasta las 14 semanas de gestación), para el síndrome de Down, en comparación con un estándar de referencia: la comprobación cromosómica o el examen macroscópico posnatal.
Obtención y análisis de los datos
Los datos se extrajeron como resultados negativos o positivos de las pruebas para embarazos con y sin síndrome de Down, lo cual permitió la estimación de las tasas de detección (sensibilidad) y las tasas de falsos positivos (1‐especificidad). La evaluación de la calidad se realizó según los criterios QUADAS. Se utilizaron los métodos jerárquicos metanalíticos de resumen de ROC para analizar el rendimiento de las pruebas y comparar la exactitud de las pruebas. Se realizó el análisis de los estudios que permitieron la comparación directa entre las pruebas. El impacto de la edad materna en el rendimiento de las pruebas se investigó en análisis de subgrupos.
Resultados principales
Se incluyeron 126 estudios (152 publicaciones) con 1 604 040 fetos (incluidos 8454 casos de síndrome de Down). Por lo general, los estudios fueron de buena calidad, aunque fue frecuente la verificación diferencial con pruebas invasivas de los embarazos con alto riesgo solamente. Se evaluaron 60 combinaciones de exámenes a partir de las combinaciones de 11 marcadores ecográficos diferentes (translucencia nucal [TN], hueso nasal, Doppler del ductus venoso, longitud del maxilar, frecuencia cardíaca fetal, arteria subclavia derecha aberrante, ángulo frontomaxilar facial, apertura mitral, regurgitación tricuspídea, flujo en la válvula tricúspide y ángulo ilíaco de 90 grados); 12 pruebas séricas (inhibina A, alfafetoproteína [AFP], gonadotrofina coriónica humana beta libre [ßhCG], hCG total, proteína plasmática A asociada al embarazo [PAPP‐A], estriol no conjugado [uE3], desintegrina y metaloproteinasa 12 [ADAM 12], factor de crecimiento placentario [PlGF], somatotropina placentaria [PGH], antígeno trofoblástico invasivo [ITA] [sinónimo de hCG hiperglicosilada], proteína ligadora de la somatotropina [GHBP] y proteína placentaria 13 [PP13]); y la edad materna. Los marcadores séricos evaluados con mayor frecuencia en combinación con los marcadores ecográficos fueron PAPP‐A y ßhCG libre.
Las comparaciones de los 10 exámenes evaluados con mayor frecuencia mostraron que la estrategia combinada de TN, PAPP‐A, ßhCG libre y la edad materna superó ampliamente a los marcadores ecográficos solos (con o sin la edad materna) excepto el hueso nasal, y se detectaron cerca de nueve de cada 10 embarazos con síndrome de Down a una tasa falsa positiva (TFP) de 5%. En las comparaciones directas e indirectas, la combinación de TN, PAPP‐A, ßhCG libre y edad materna mostró una exactitud diagnóstica superior que la combinación TN y edad materna (P < 0,0001). Sobre la base de la comparación indirecta de los estudios disponibles para los dos exámenes, la sensibilidad (intervalo de confianza del 95%) calculada a una TFP de 5% para la estrategia combinada de la edad materna, ßhCG libre, PAPP‐A y TN (69 estudios; 1 173 853 fetos, incluidos 6010 con síndrome de Down) fue de 87% (86 a 89) y para la TN y la edad materna (50 estudios; 530 874 fetos con 2701 embarazos con síndrome de Down) fue de 71% (66 a 75). Las combinaciones de TN con otros marcadores ecográficos, PAPP‐A y ßhCG libre se evaluaron en uno o dos estudios y mostraron una sensibilidad de más de 90% y una especificidad de más de 95%.
Las poblaciones de alto riesgo (definida antes del cribado, principalmente debido a una edad materna avanzada de al menos 35 años, o embarazo previos afectados por el síndrome de Down) mostraron menos tasas de detección comparadas con las poblaciones cribadas rutinariamente a una TFP de 5%. Las mujeres que tuvieron abortos espontáneos en el grupo con 35 años o más tuvieron mayores probabilidades de que se les ofreciera una prueba invasiva para verificar un resultado negativo del cribado, mientras que a las de menos de 35 años generalmente no se les ofreció una prueba invasiva por un resultado negativo del cribado. Por lo tanto, la pérdida del embarazo en las mujeres menores de 35 años de edad da lugar a una verificación insuficiente de los resultados del cribado, lo que provoca la pérdida potencial de una proporción de embarazos afectados e influye en la sensibilidad de la prueba. Por el contrario, para la estrategia TN, PAPP‐A, ßhCG libre y edad materna, las tasas de detección y de falsos positivos aumentó con la edad materna en los cinco estudios que aportaron datos por separado para el subconjunto de pacientes de 35 años de edad o más.
Conclusiones de los autores
Las estrategias que combinan los marcadores ecográficos con los séricos, especialmente PAPP‐A y ßhCG libre y la edad materna fueron significativamente mejores que las que comprendían a los marcadores ecográficos solos (con o sin edad materna) excepto el hueso nasal. Detectan cerca de nueve de cada 10 embarazos afectados con síndrome de Down, para una TFP fija del 5%. Aunque la ausencia del hueso nasal parecía tener una exactitud diagnóstica alta, sólo se detectaron cinco de cada 10 embarazos afectados con síndrome de Down a una TFP de 1%.
Resumen en términos sencillos
Pruebas de detección para el síndrome de Down en las primeras 24 semanas de embarazo
Antecedentes
El síndrome de Down (también conocido como Trisomía 21) es un trastorno genético incurable que causa problemas de salud físicos y mentales significativos, así como discapacidades. Sin embargo, hay una variación amplia en cómo el síndrome de Down afecta a los pacientes. Algunos individuos tienen una afectación grave, aunque otros tienen problemas leves y pueden llevar una vida relativamente normal. No hay una manera de predecir en qué magnitud se verá afectado un niño.
A los padres que esperan un niño se les ofrece la opción de realizar exámenes para el síndrome de Down durante el embarazo y ayudarlos a tomar decisiones. Si una madre está embarazada de un niño con síndrome de Down, entonces debe tomar la decisión de interrumpir o continuar el embarazo. La información les ofrece a los padres la oportunidad de hacer planes para la vida con un niño con síndrome de Down.
Las pruebas más exactas para detectar el síndrome de Down incluyen la obtención de líquido de alrededor del feto (amniocentesis) o del tejido de la placenta (toma de muestras de las vellosidades coriónicas [MVC]) para los cromosomas anormales asociados con el síndrome Down. Ambas pruebas incluyen insertar agujas a través del abdomen de la madre y se sabe que aumentan el riesgo de aborto espontáneo. Por lo tanto, las pruebas no son apropiadas para ofrecerlas a todas las embarazadas. En su lugar, se utilizan pruebas que miden los marcadores en la sangre o la orina de la madre o ecografías del feto para las pruebas de detección. Estas pruebas de detección no son perfectas, pueden omitir casos de síndrome de Down y también aportar resultados de pruebas de "alto riesgo" a varias mujeres cuyos niños no están afectados por el síndrome de Down. De este modo, los embarazos identificados como de "alto riesgo" con estas pruebas de cribado requieren exámenes adicionales mediante amniocentesis (desde la semana 15 de gestación) o CVS (desde la semana 10 + 0 a 13 + 6 de gestación) para confirmar el diagnóstico de síndrome de Down.
Lo realizado
El objetivo de esta revisión fue determinar cuáles de las pruebas de detección con ecografía del primer trimestre, con o sin prueba sérica del primer trimestre, realizadas durante las primeras 14 semanas de embarazo son las más exactas para predecir el riesgo de que un feto esté afectado por el síndrome de Down. Se consideraron 11 marcadores ecográficos diferentes y 12 marcadores séricos diferentes que pueden utilizarse solos, en cocientes o en combinación, tomados antes de las 14 semanas de gestación, lo que creó 60 pruebas de detección para el síndrome de Down. Se hallaron 126 estudios, con 1 604 040 fetos (incluidos 8454 fetos afectados por el síndrome de Down).
Datos encontrados
Para las 14 primeras semanas de embarazo, la evidencia apoya el uso del examen ecográfico del primer trimestre en combinación con dos marcadores séricos (sangre) (en particular, la proteína plasmática A asociada al embarazo [PAPP‐A] y la gonadotrofina coriónica humana beta libre [ßhCG]) y la edad materna, para el cribado del síndrome de Down. En general, estas pruebas son mejores que los marcadores ecográficos solos. Detectan nueve de cada 10 embarazos afectados por el síndrome de Down. De las pacientes sometidas al examen, 5% tendrá un resultado de alto riesgo; sin embargo, la mayoría de estos embarazos no se verán afectados por el síndrome de Down.
Otra información importante a considerar
La ecografía no causa ningún efecto adverso para la paciente; los análisis de sangre pueden causar malestar, equimosis y, rara vez, infección. Sin embargo, algunas mujeres que tienen un resultado de la prueba de detección de "alto riesgo" y que son sometidas a amniocentesis o a MVC presentan un riesgo de aborto de un feto no afectado por el síndrome de Down. Los padres deberán comparar este riesgo al decidir si realizar una amniocentesis o una MVC después de un resultado de las pruebas de detección de "alto riesgo".
Authors' conclusions
Summary of findings
| Review question | What is the accuracy of ultrasound based markers alone and in combination with maternal age and/or first trimester serum markers for screening for Down's syndrome? | |||||
| Population | Pregnant women at less than 14 weeks' gestation confirmed by ultrasound, who had not undergone previous testing for Down’s syndrome. Some studies were undertaken in women identified to be at high risk based on maternal age. | |||||
| Settings | All settings. | |||||
| Numbers of studies, pregnancies and Down's syndrome cases | 126 studies (reported in 152 publications) involving 1,604,040 fetuses of which 8454 were Down's syndrome cases | |||||
| Index tests | Risk scores computed using maternal age and first trimester ultrasound and serum markers for ultrasound markers ‐ NT, nasal bone, ductus venosus Doppler, maxillary bone length, fetal heart rate, aberrant right subclavian artery, frontomaxillary facial angle, presence of mitral gap, tricuspid regurgitation, tricuspid blood flow and iliac angle 90 degrees ‐ and serum markers ‐ inhibin A, AFP, free ßhCG, total hCG, PAPP‐A, uE3, ADAM 12, PlGF, PGH, ITA (h‐hCG), GHBP and PP13. | |||||
| Reference standards | Chromosomal verification (amniocentesis and CVS undertaken during pregnancy, and postnatal karyotyping) and postnatal macroscopic inspection. | |||||
| Study limitations | 116 studies only used selective chromosomal verification during pregnancy, and were at risk of under‐ascertainment of Down's syndrome cases due to pregnancy loss between administering the serum test and the reference standard. | |||||
| Test strategy | Studies | Women (Down's cases) | Sensitivity (95% CI) | Specificity (95% CI)* | Consequences in a hypothetical cohort of 10,000 pregnant women assuming Down’s syndrome affects approximately one in 800 live‐born babies | |
| Missed cases | False positives | |||||
| Nasal bone | 11 | 48,279 (290) | 49 (34, 64) | 99 (99, 100) | 7 | 100 |
| NT | 13 | 90,978 (593) | 70 (61, 78) | 95 | 4 | 500 |
| NT and maternal age | 50 | 530,874 (2701) | 71 (66, 75) | 95 | 4 | 500 |
| Nasal bone and maternal age | 4 | 25,303 (165) | 68 (28, 92) | 95 | 4 | 500 |
| Ductus and maternal age | 5 | 5331 (165) | 68 (49, 83) | 95 | 4 | 500 |
| NT, nasal bone and maternal age | 5 | 29,699 (221) | 78 (55, 91) | 95 | 3 | 500 |
| NT, free ßhCG and maternal age | 5 | 10,795 (421) | 77 (72, 82) | 95 | 3 | 500 |
| NT, PAPP‐A and maternal age | 5 | 9814 (372) | 81 (75, 86) | 95 | 3 | 500 |
| NT, PAPP‐A, free ßhCG and maternal age | 69 | 1,173,853 (6010) | 87 (86, 89) | 95 | 2 | 500 |
| NT, PAPP‐A, free ßhCG, ADAM 12 and maternal age | 4 | 2571 (256) | 82 (75, 87) | 95 | 3 | 500 |
| *We estimated sensitivity (with a 95% confidence interval) at a 5% false positive rate from the summary ROC curve obtained for each test except nasal bone. For nasal bone, the pooled specificity is reported because the cut‐point was absence or presence of nasal bone, and all studies reported false positive rates below 5% so estimation of sensitivity at a fixed 5% FPR was not appropriate. | ||||||
| Test strategy | Studies | Women (Down's cases) | Sensitivity* (95% CI) | Specificity* (95% CI) | Threshold |
| Without maternal age | |||||
| Ultrasound markers alone | |||||
| Aberrant right subclavian artery | 1 | 425 (51) | 8 (2, 19) | 99 (98, 100) | Feature |
| Frontomaxillary facial angle | 1 | 242 (22) | 18 (5, 40) | 98 (95, 99) | > 95th percentile |
| Presence of mitral gap | 1 | 217 (20) | 20 (6, 44) | 87 (81, 91) | Feature |
| Maxillary bone length | 1 | 927 (88) | 24 (15, 34) | 95 (93, 96) | 5th centile |
| Tricuspid regurgitation | 1 | 312 (20) | 50 (27, 73) | 98 (96, 99) | Feature |
| Iliac angle 90 degrees | 1 | 2032 (52) | 60 (45, 73) | 98 (97, 98) | Feature |
| Ductus venosus a‐wave reversed | 1 | 378 (72) | 68 (56, 79) | 70 (64, 75) | Feature |
| Ductus venosus pulsivity index | 1 | 378 (72) | 81 (70, 89) | 58 (52, 63) | > 95th percentile |
| NT and nasal bone | 1 | 486 (38) | 89 (75, 97) | 93 (91, 95) | Absent nasal bone and NT ≥ 95th centile |
| Ultrasound and double serum markers | |||||
| NT, free ßhCG and PAPP‐A | 1 | 6508 (40) | 90 (76, 97) | 95 (95, 96) | First trimester incidence rate 63.3% |
| With maternal age | |||||
| Ultrasound markers alone | |||||
| NT‐adjusted risk > 1:300 and abnormal ductus venosus flow and absent nasal bones | 1 | 544 (47) | 21 (11, 36) | 100 (99, 100) | 1:300 risk |
| NT and ductus | 3 | 23,697 (177) | 76 to 93 | 73 to 99 | 5% FPR, 1:250 risk, feature |
| NT and tricuspid blood flow | 1 | 19,736 (122) | 85 (78, 91) | 97 (97, 98) | 1:100 risk |
| Ultrasound and single serum markers | |||||
| NT and inhibin A | 2 | 1150 (97) | 61 to 75 | 95 to 96 | 5% FPR, 1:250 risk |
| NT and AFP | 1 | 1110 (85) | 61 (50, 72) | 95 (94, 96) | 5% FPR |
| NT and total hCG | 1 | 1110 (85) | 61 (50, 72) | 95 (94, 96) | 5% FPR |
| NT and ITA | 1 | 278 (54) | 80 (66, 89) | 95 (91, 98) | 5% FPR |
| Ultrasound and double serum markers | |||||
| NT, AFP and free ßhCG | 2 | 2766 (90) | 66 to 100 | 93 to 95 | 5% FPR, 1:250 risk |
| NT, PAPP‐A and inhibin A | 2 | 1150 (97) | 80 to 83 | 95 to 96 | 5% FPR, 1:250 risk |
| NT, total hCG and inhibin A | 1 | 1110 (85) | 62 (51, 73) | 95 (94, 96) | 5% FPR |
| NT, free ßhCG and inhibin A | 1 | 1110 (85) | 66 (55, 76) | 95 (94, 96) | 5% FPR |
| NT, free ßhCG and ADAM 12 | 1 | 351 (31) | 68 (49, 83) | 95 (92, 97) | 5% FPR |
| NT, PAPP‐A and uE3 | 1 | 576 (24) | 79 (58, 93) | 95 (93, 97) | 5% FPR |
| NT, total hCG and PAPP‐A | 1 | 1110 (85) | 80 (70, 88) | 95 (94, 96) | 5% FPR |
| NT, AFP and PAPP‐A | 1 | 1110 (85) | 80 (70, 88) | 95 (94, 96) | 5% FPR |
| NT, PAPP‐A and ITA | 2 | 11,053 (77) | 83 (73, 90) | 95 | 5% FPR |
| NT, PAPP‐A and ADAM 12 | 2 | 1042 (77) | 83 (73, 90) | 95 | 5% FPR |
| Free ßhCG and PAPP‐A, if risk between 1:42 and 1:1000 (intermediate risk), NToffered, final composite risk !:250 | 1 | 10,189 (44) | 89 (75, 96) | 94 (94, 95) | 1:250 risk |
| NT, ductus, free ßhCG and PAPP‐A | 3 | 30,061 (212) | 83 to 96 | 97 to 99 | 1:100 risk, 1:250 risk |
| NT, nasal bone, free ßhCG and PAPP‐A | 3 | 41,842 (271) | 89 to 94 | 95 to 98 | 5% FPR, 1:100 risk, 1:300 risk |
| NT, PAPP‐A, free ßhCG and ductus venosus pulsivity index | 1 | 7,250 (66) | 89 (79, 96) | 95 (94, 95) | 5% FPR |
| NT, tricuspid blood flow, free ßhCG and PAPP‐A | 1 | 19,736 (122) | 91 (84, 95) | 97 (97, 98) | 1:100 risk |
| NT, fetal heart rate, free ßhCG and PAPP‐A | 2 | 76,385 (517) | 92 (89, 94) | 95 | 5% FPR |
| NT, fetal heart rate, nasal bone, free ßhCG and PAPP‐A | 1 | 19,736 (122) | 95 (90, 98) | 96 (95, 96) | 1:200 risk |
| NT, fetal heart rate, tricuspid blood flow, free ßhCG and PAPP‐A | 1 | 19,736 (122) | 96 (91, 99) | 95 (95, 95) | 5% FPR |
| NT, fetal heart rate, ductus, free ßhCG and PAPP‐A | 1 | 19,614 (122) | 97 (92, 99) | 95 (95, 95) | 5% FPR |
| Ultrasound and triple serum markers | |||||
| NT, AFP, free ßhCG and PAPP‐A | 3 | 6789 (135) | 73 to 84 | 95 | 5% FPR, 1:250 risk |
| NT, PAPP‐A, free ßhCG and PP13 | 1 | 998 (151) | 77 (69, 83) | 95 (93, 96) | 5% FPR |
| NT, PAPP‐A, free ßhCG and total hCG | 1 | 998 (151) | 77 (69, 83) | 95 (93, 96) | 5% FPR |
| NT, total hCG, inhibin A and PAPP‐A | 1 | 1110 (85) | 81 (71, 89) | 95 (94, 96) | 5% FPR |
| NT, free ßhCG, inhibin A and PAPP‐A | 1 | 1110 (85) | 84 (74, 91) | 95 (94, 96) | 5% FPR |
| NT, PAPP‐A, free ßhCG and PGH | 1 | 335 (74) | 86 (77, 93) | 95 (92, 97) | 5% FPR |
| NT, PAPP‐A, free ßhCG and PIGF | 2 | 1443 (221) | 88 (70, 95) | 95 | 5% FPR |
| NT, PAPP‐A, free ßhCG and GHBP | 1 | 335 (74) | 91 (81, 96) | 95 (92, 97) | 5% FPR |
| Ultrasound and quadruple serum markers | |||||
| NT, PAPP‐A, free ßhCG, ADAM 12 and PlGF | 1 | 998 (151) | 79 (72, 86) | 95 (93, 96) | 5% FPR |
| Ultrasound and quintuple serum markers | |||||
| NT, PAPP‐A, free ßhCG, ADAM 12, total hCG and PlGF | 1 | 998 (151) | 79 (72, 86) | 95 (93, 96) | 5% FPR |
| NT, total hCG, inhibin A, PAPP‐A, AFP and uE3 | 1 | 1110 (85) | 84 (74, 91) | 95 (94, 96) | 5% FPR |
| NT, free ßhCG, inhibin A, PAPP‐A, AFP and uE3 | 1 | 1110 (85) | 86 (77, 92) | 95 (94, 96) | 5% FPR |
| Ultrasound and sextuple serum markers | |||||
| NT, PAPP‐A, free ßhCG, ADAM 12, total hCG, PlGF and PP13 | 1 | 998 (151) | 80 (73, 86) | 95 (93, 96) | 5% FPR |
| *Tests evaluated by at least one study are presented in the table. Where there were two studies at the same threshold, estimates of summary sensitivity and summary specificity were obtained by using univariate fixed‐effect logistic regression models to pool sensitivities and specificities separately. If the threshold used was a 5% FPR, then only the sensitivities were pooled. The range of sensitivities and specificities are presented where meta‐analysis was not performed because there were only two or three studies and no common threshold. | |||||
Background
This is one of a series of reviews on antenatal screening for Down's syndrome following a generic protocol (Alldred 2010) ‐ see Published notes for more details.
Target condition being diagnosed
Down’s syndrome
Down’s syndrome affects approximately one in 800 live‐born babies (Cuckle 1987). It results from a person having three, rather than two, copies of chromosome 21 — or the specific area of chromosome 21 implicated in causing Down's syndrome — as a result of trisomy or translocation. If not all cells are affected, the pattern is described as 'mosaic'. Down’s syndrome can cause a wide range of physical and mental problems. It is the commonest cause of mental disability, and is also associated with a number of congenital malformations, notably affecting the heart. There is also an increased risk of cancers such as leukaemia, and numerous metabolic problems including diabetes and thyroid disease. Some of these problems may be life‐threatening, or lead to considerable ill health, while some individuals with Down’s syndrome have only mild problems and can lead a relatively normal life.
There is no cure for Down’s syndrome, and antenatal diagnosis allows for preparation for the birth and subsequent care of a baby with Down’s syndrome, or for the offer of a termination of pregnancy. Having a baby with Down’s syndrome is likely to have a significant impact on family and social life, relationships and parents’ work. Special provisions may need to be made for education and care of the child, as well as accommodating the possibility of periods of hospitalisation.
Definitive invasive tests (amniocentesis and chorionic villus sampling (CVS)) exist that allow the diagnosis of Down's syndrome before birth but carry a risk of miscarriage. No test can predict the severity of problems a person with Down’s syndrome will have. Non‐invasive screening tests based on biochemical analysis of maternal serum or urine, or fetal ultrasound measurements, allow an estimate of the risk of a pregnancy being affected and provide parents with information to enable them to make choices about definitive testing. Such screening tests are used during the first and second trimester of pregnancy.
Screening tests for Down's syndrome
Initially, screening was determined solely by using maternal age to classify a pregnancy as high or low risk for trisomy 21, as it was known that older women had a higher chance of carrying a baby with Down’s syndrome (Penrose 1933).
Further advances in screening were made in the early 1980s, when Merkatz and colleagues investigated the possibility that low maternal serum alpha‐fetoprotein (AFP), obtained from maternal blood in the second trimester of pregnancy could be associated with chromosomal abnormalities in the fetus. Their retrospective case‐control study showed a statistically significant relationship between fetal trisomy, such as Down’s syndrome, and lowered maternal serum AFP (Merkatz 1984). This was further explored by Cuckle and colleagues in a larger retrospective trial using data collected as part of a neural tube defect (NTD) screening project (Cuckle 1984). This work was followed by calculation of risk estimates using maternal serum AFP values and maternal age, which ultimately led to the introduction of the two screening parameters in combination (Alfirevic 2004).
In 1987, in a small case‐control study of women carrying fetuses with known chromosomal abnormalities, Bogart and colleagues investigated maternal serum levels of human chorionic gonadotrophin (hCG) as a possible screening tool for chromosomal abnormalities in the second trimester (Bogart 1987). This followed the observations that low hCG levels were associated with miscarriages, which are commonly associated with fetal chromosomal abnormalities. They concluded that high hCG levels were associated with Down’s syndrome and because hCG levels plateau at 18 to 24 weeks, that this would be the most appropriate time for screening. Later work suggested that the ß subunit of hCG was a more effective marker than total hCG (Macri 1990; Macri 1993).
Second trimester unconjugated oestriol (uE3), produced by the fetal adrenals and the placenta, was also evaluated as a potential screening marker. In another retrospective case‐control study, uE3 was shown to be lower in Down’s syndrome pregnancies compared with unaffected pregnancies. When used in combination with AFP and maternal age, it appeared to identify more pregnancies affected by Down’s syndrome than AFP and age alone (Canick 1988). Further work suggested that all three serum markers (AFP, hCG and uE3) showed even higher detection rates when combined with maternal age (Wald 1988a; Wald 1988b) and appeared to be a cost‐effective screening strategy (Wald 1992a).
Two other serum markers, produced by the placenta, have been linked with Down’s syndrome, namely pregnancy‐associated plasma protein A or PAPP‐A, and Inhibin A. PAPP‐A has been shown to be reduced in the first trimester of Down’s syndrome pregnancies, with its most marked reduction in the early first trimester (Bersinger 1995). Inhibin A is high in the second trimester in pregnancies affected by Down’s syndrome (Cuckle 1995; Wallace 1995). There are some issues concerning the biological stability and hence reliability of this marker, and the effect this will have on individual risk.
In addition to serum and ultrasound markers for Down’s syndrome, work has been carried out looking at urinary markers. These markers include invasive trophoblast antigen, ß‐core fragment, free ßhCG and total hCG (Cole 1999). There is controversy about their value (Wald 2003a.
Screening and parental choice
Antenatal screening is used for several reasons (Alfirevic 2004), but the most important is to enable parental choice regarding pregnancy management and outcome. Before a woman and her partner opt to have a screening test, they need to be fully informed about the risks, benefits and possible consequences of such a test. This includes the choices they may have to face should the result show that the woman has a high risk of carrying a baby with Down’s syndrome and implications of both false positive and false negative screening tests. They need to be informed of the risk of a miscarriage due to invasive diagnostic testing, and the possibility that a miscarried fetus may be chromosomally normal. If, following invasive diagnostic testing, the fetus is shown to have Down’s syndrome, further decisions need to be made about continuation or termination of the pregnancy, the possibility of adoption and finally, preparation for parenthood. Equally, if a woman has a test that shows she is at a low risk of carrying a fetus with Down’s syndrome, it does not necessarily mean that the baby will be born with a normal chromosomal make up. This possibility can only be excluded by an invasive diagnostic test (Alfirevic 2003). The decisions that may be faced by expectant parents inevitably engender a high level of anxiety at all stages of the screening process, and the outcomes of screening can be associated with considerable physical and psychological morbidity. No screening test can predict the severity of problems a person with Down's syndrome will have.
Index test(s)
This review examined ultrasound and serum screening tests used in the first trimester of pregnancy (up to 14 weeks' gestation). The tests included the following individual ultrasound markers: nuchal translucency (NT), nasal bone, ductus venosus Doppler, maxillary bone length, fetal heart rate, aberrant right subclavian artery, frontomaxillary facial angle, presence of mitral gap, tricuspid regurgitation, tricuspid blood flow and iliac angle 90 degrees; and the following individual serum markers: inhibin A, AFP, free ßhCG, total hCG, pregnancy‐associated plasma protein A (PAPP‐A), uE3, a disintegrin and metalloprotease 12 (ADAM 12), placental growth factor (PlGF), placental growth hormone (PGH) invasive trophoblast antigen (ITA) (synonymous with hyperglycosylated hCG), growth hormone binding protein (GHBP) and placental protein 13 (PP13).
These markers can be used individually, in combination with age, and can also be used in combination with each other. The risks are calculated by comparing a woman's test result for each marker with values for an unaffected population, and multiplying this with her age‐related risk. Where several markers are combined, risks are computed using risk equations (often implemented in commercial software) that take into account the correlational relationships between the different markers and marker distributions in affected and unaffected populations.
Alternative test(s)
Down’s syndrome can be detected during pregnancy with invasive diagnostic tests such as amniocentesis or CVS, with or without prior screening. These tests are considered to be reference tests rather than index or screening tests. The ability to determine fetal chromosomal make up (also known as a karyotype) from amniotic fluid samples was demonstrated in 1966 by Steele and Breg (Steele 1966), and the first antenatal diagnosis of Down’s syndrome was made in 1968 (Valenti 1968). Amniocentesis is an invasive procedure which involves taking a small sample of the amniotic fluid (liquor) surrounding the baby, using a needle which goes through the abdominal wall into the uterus, and is usually performed after 15 weeks' gestation. Chorionic villus sampling involves taking a sample of the placental tissue using a needle which goes through the abdominal wall and uterus or a cannula through the cervix. It is usually performed between 10 and 13 weeks' gestation. Amniocentesis and CVS are both methods of obtaining fetal chromosome material, which are then used to diagnose Down’s syndrome. Both tests use ultrasound scans to guide placement of the needle. Amniocentesis carries a risk of miscarriage in the order of 1%; transabdominal CVS may carry a similar risk (Alfirevic 2003). A more recent systematic review suggests that the procedure‐related risk of pregnancy loss is lower than this (Akolekar 2015).
Recent developments in the use of cell‐free fetal DNA detection in maternal serum are paving the way for non‐invasive diagnosis of Down's syndrome and other trisomies, however these tests were not used as reference standards in any of the studies examined for this review, and were not included in the search strategy, which preceded their widespread introduction. A systematic review conducted by another group is currently in preparation, examining this newer screening technology ( Badeau 2015).
There are many different screening tests which are available and offered which are the subject of additional Cochrane reviews and there are other reviews looking at this area. Tests being assessed in the other Cochrane reviews include first trimester serum tests (Alldred 2015); urine tests (Alldred 2015a); second trimester serum markers (Alldred 2012); and tests that combine markers from the first trimester with markers from the second trimester (in press). Second trimester ultrasound markers have been assessed in a previous systematic review (Smith‐Bindman 2001).
Rationale
This is one of a suite of Cochrane reviews, the aim of which is to identify all screening tests for Down's syndrome used in clinical practice, or evaluated in the research setting, in order to try to identify the most accurate test(s) available, and to provide clinicians, policy‐makers and women with robust and balanced evidence on which to base decisions about interpreting test results and implementing screening policies to triage the use of invasive diagnostic testing. The full set of reviews is described in the generic protocol (Alldred 2010).
The topic has been split into several different reviews to allow for greater ease of reading and greater accessibility of data, and also to allow the reader to focus on separate groups of tests, for example, first trimester serum tests alone, first trimester ultrasound alone, first trimester serum and ultrasound, second trimester serum alone, first and second trimester serum, combinations of serum and ultrasound markers and urine markers alone. An overview review will compare the best tests, focusing on commonly used strategies, from each of these groups to provide comparative results between the best tests in the different categories. This review is written with the global perspective in mind, rather than to conform with any specific local or national policy, as not all tests will be available in all areas where screening for Down's syndrome is carried out.
A systematic review of second trimester ultrasound markers in the detection of Down’s syndrome fetuses was published in 2001 which concluded that nuchal fold thickening may be useful in detecting Down’s syndrome, but that it was not sensitive enough to use as a screening test. The review concluded that the other second trimester ultrasound markers did not usefully distinguish between Down’s syndrome and pregnancies without Down’s syndrome (Smith‐Bindman 2001). There has yet to be a systematic review and meta‐analysis of the observed data on serum, urine and first trimester ultrasound markers, in order to draw rigorous and robust conclusions about the diagnostic accuracy of available Down’s syndrome screening tests.
Objectives
The aim of this review was to estimate and compare the accuracy of first trimester ultrasound with and without serum markers for the detection of Down’s syndrome in the antenatal period, both as individual markers and as combinations of markers. Accuracy is described by the proportion of fetuses with Down’s syndrome detected by screening before birth (sensitivity or detection rate) and the proportion with a low‐risk screening test result (negative) from amongst babies born without Down's syndrome. We grouped our analyses to focus on investigating the value of adding increasing numbers of markers (comparing single, dual, triple, quadruple, quintuple and sextuple tests).
Investigation of sources of heterogeneity
We had planned to investigate whether a uniform screening test is suitable for all women, or whether different screening methods are more applicable to different groups, defined by advanced maternal age, ethnic groups and aspects of the pregnancy and medical history such as multiple (multifetal) pregnancy, diabetes and family history of Down's syndrome. We also planned to examine whether there was evidence of overestimation of test accuracy in studies evaluating risk equations in the derivation sample rather than in a separate validation sample.
Methods
Criteria for considering studies for this review
Types of studies
We included studies in which all women from a given population had one or more index test(s) compared to a reference standard. Both consecutive series and diagnostic case‐control study designs were included. Randomised trials where individuals were randomised to different screening strategies and all verified using a reference standard were also eligible for inclusion. Studies in which test strategies were compared head‐to‐head either in the same women, or between randomised groups were identified for inclusion in separate comparisons of test strategies. Studies were excluded if they included less than five Down's syndrome cases, or more than 20% of participants were not followed up.
Participants
Pregnant women at less than 14 weeks' gestation confirmed by ultrasound, who had not undergone previous testing for Down’s syndrome in their pregnancy were eligible. Studies were included if the pregnant women were unselected, or if they represented groups with increased risk of Down’s syndrome, or difficulty with conventional screening tests including maternal age greater than 35 years old, multifetal pregnancy, diabetes mellitus and a family history of Down’s syndrome.
Index tests
Improved diagnostic performance can be obtained by using several tests in combination, such as maternal age and serum marker combinations, or combinations of maternal age, serum markers and sonographic measurements. We examined individual first trimester ultrasound markers or combinations of these markers with one or more first trimester serum tests, with and without adjustment for maternal age.
The following ultrasound markers were examined: NT, nasal bone, ductus venosus Doppler, maxillary bone length, fetal heart rate, aberrant right subclavian artery, frontomaxillary facial angle, presence of mitral gap, tricuspid regurgitation, tricuspid blood flow and iliac angle 90 degrees.
The serum markers examined in different combinations with ultrasound markers were inhibin A, AFP, free ßhCG, total hCG, PAPP‐A, uE3, ADAM 12, PlGF, PGH, ITA (h‐hCG), GHBP and PP13.
We examined comparisons of ultrasound markers in isolation and in various combinations with or without serum markers. The combinations included one or two ultrasound markers with single (one marker), double (two markers), triple (three markers), quadruple (four markers), quintuple and sextuple (six markers) serum markers, with or without adjustment for maternal age.
Where tests were used in combinations, we examined the performance of test combinations according to predicted probabilities computed using risk equations and dichotomised into high risk and low risk at some standard high‐risk value. Risk equations are often coded into software to produce 'risk score' computations, which provide an individual's predicted probability of Down’s syndrome.
Target conditions
Down's syndrome in the fetus due to trisomy, translocation or mosaicism.
Reference standards
We considered several reference standards, involving chromosomal verification and postnatal macroscopic inspection.
Amniocentesis and chorionic villus sampling (CVS) are invasive chromosomal verification tests undertaken during pregnancy. They are highly accurate, but the process carries a 1% miscarriage rate, and therefore they are only used in pregnancies considered to be at high risk of Down's syndrome, or on the mother's request. All other types of testing (postnatal examination, postnatal karyotyping, birth registers and Down’s syndrome registers) are based on information available at the end of pregnancy. The greatest concern is not their accuracy, but the loss of the pregnancy to miscarriage between the urine test and the reference standard. Miscarriage with cytogenetic testing of the fetus is included in the reference standard where available. We anticipated that older studies, and studies undertaken in older women are more likely to have used invasive chromosomal verification tests in all women.
Studies undertaken in younger women and more recent studies were likely to use differential verification as they often only used prenatal karyotypic testing on fetuses considered screen positive/high risk according to the screening test; the reference standard for most unaffected infants being observing a phenotypically normal baby. Although the accuracy of this combined reference standard is considered high, it is methodologically a weaker approach as pregnancies that miscarry between the index test and birth are likely to be lost from the analysis, and miscarriage is more likely to occur in Down's than normal pregnancies. We investigated the impact of the likely missing false negative results in sensitivity analyses.
Search methods for identification of studies
Electronic searches
We applied a sensitive search strategy to search the following databases using the search strategies listed in Appendix 1. We used one generic search to identify studies for all reviews in this series.
We searched the following databases
-
MEDLINE via OVID (1980 to 25 August 2011)
-
Embase via Dialog Datastar (1980 to 25 August 2011)
-
BIOSIS via EDINA (1985 to 25 August 2011)
-
CINAHL via OVID (1982 to 25 August 2011)
-
The Database of Abstracts of Reviews of Effects (the Cochrane Library 2011, Issue 7)
-
MEDION (25 August 2011)
-
The Database of Systematic Reviews and Meta‐Analyses in Laboratory Medicine (www.ifcc.org/) (25 August 2011)
-
The National Research Register (archived 2007)
-
Health Services Research Projects in Progress database (HSRPROJ) (25 August 2011)
The search strategy combined three sets of search terms (seeAppendix 1). The first set was made up of named tests, general terms used for screening/diagnostic tests and statistical terms. Note that the statistical terms were used to increase sensitivity and were not used as a methodological filter to increase specificity. The second set was made up of terms that encompass Down's syndrome, and the third set made up of terms to limit the testing to pregnant women. All terms within each set were combined with the Boolean operator OR and then the three sets were combined using AND. The terms used were a combination of subject headings and free‐text terms. The search strategy was adapted to suit each database searched.
We attempted to identify cumulative papers that reported data from the same data set, and contacted authors to obtain clarification of the overlap between data presented in these papers, in order to prevent data from the same women being analysed more than once.
Searching other resources
In addition, we examined references cited in studies identified as being potentially relevant, and those cited by previous reviews. We contacted authors of studies where further information was required. We did not apply a diagnostic test filter, and we did not apply language restrictions to the search.
We carried out forward citation searching of relevant items, using the search strategy in ISI citation indices, Google Scholar and Pubmed ‘related articles’.
Data collection and analysis
Selection of studies
Two review authors screened the titles and abstracts (where available) of all studies identified by the search strategy. Full‐text versions of studies identified as being potentially relevant were obtained and independently assessed by two review authors for inclusion, using a study eligibility screening pro forma according to the pre‐specified inclusion criteria. Any disagreement between the two review authors was settled by consensus, or where necessary, by a third party.
Data extraction and management
A data extraction form was developed and piloted using a subset of 20 identified studies (from all identified studies in this suite of reviews). Two review authors independently extracted data, and where disagreement or uncertainty existed, a third review author validated the information extracted.
Data on each marker were extracted as binary test positive/test negative results for Down's and non‐Down's pregnancies, with a high‐risk result ‐ as defined by each individual study ‐ being regarded as test positive (suggestive or diagnostic of Down's syndrome), and a low‐risk result being regarded as test negative (suggestive of absence of Down's Syndrome). Where results were reported at several thresholds, we extracted data at each threshold.
We noted those in special groups that posed either increased risk of Down’s syndrome or difficulty with conventional screening tests including maternal age greater than 35 years old, multifetal pregnancy, diabetes mellitus and family history of Down’s syndrome.
Assessment of methodological quality
We used a modified version of the QUADAS tool (Whiting 2003), a quality assessment tool for use in systematic reviews of diagnostic accuracy studies, to assess the methodological quality of included studies. We anticipated that a key methodological issue would be the potential for bias arising from the differential use of invasive testing and follow‐up for the reference standard according to index test results, bias arising due to higher loss to miscarriage in false negatives than true negatives. We chose to code this issue as originating from differential verification in the QUADAS tool: we are aware that it could also be coded under delay in obtaining the reference standard, and reporting of withdrawals. We omitted the QUADAS item assessing quality according to length of time between index and reference tests, as Down's syndrome is either present or absent rather than a condition that evolves and resolves, and disregarding the differential reference standard issue, thus any length of delay is acceptable. Two review authors assessed each included study separately. Any disagreement between the two review authors was settled by consensus, or where necessary, by a third party. Each item in the QUADAS tool was marked as ‘yes’, ‘no’ or ‘unclear’, and scores were summarised graphically. We did not use a summary quality score.
QUADAS criteria included the following 10 questions.
-
Was the spectrum of women representative of the women who will receive the test in practice? (Criteria met if the sample was selected from a wide range of childbearing ages, or selected from a specified ‘high‐risk’ group such as over 35s, family history of Down’s syndrome, multifetal pregnancy or diabetes mellitus, provided all affected and unaffected fetuses included that could be tested at the time point when the screening test would be applied; criteria not met if the sample taken from a select or unrepresentative group of women (i.e. private practice), was an atypical screening population or recruited at a later time point when selection could be affected by selective fetal loss.)
-
Is the reference standard likely to correctly classify the target condition? (Amniocentesis, chorionic villus sampling, postnatal karyotyping, miscarriage with cytogenetic testing of the fetus, a phenotypically normal baby or birth registers are all regarded as meeting this criteria.)
-
Did the whole sample or a random selection of the sample receive verification using a reference standard of diagnosis?
-
Did women receive the same reference standard regardless of the index test result?
-
Was the reference standard independent of the index test result (i.e. the index test did not form part of the reference standard)?
-
Were the index test results interpreted without knowledge of the results of the reference standard?
-
Were the reference standard results interpreted without knowledge of the results of the index test?
-
Were the same clinical data (i.e. maternal age and weight, ethnic origin, gestational age) available when test results were interpreted as would be available when the test is used in practice?
-
Were uninterpretable/intermediate test results reported?
-
Were withdrawals from the study explained?
Statistical analysis and data synthesis
We initially examined each test or test strategy at each of the common risk thresholds used to define test positivity by plotting estimates of sensitivity and specificity from each study on forest plots and in receiver operating characteristic (ROC) space. Test strategies were selected for further investigation if they were evaluated in four or more studies or, if there were three or fewer studies, but the individual study results indicated performance likely to be superior to a sensitivity of 70% and specificity of 90%.
Estimation of average sensitivity and specificity
The analysis for each test strategy was undertaken first restricting to studies which reported a common threshold to estimate average sensitivity and specificity for each test at each threshold. Although data on all thresholds were extracted, we present only key common thresholds (historically reported in literature based on age‐related risk) close to risks of 1:384, 1:250 and the 5% false positive rate (FPR), unless other thresholds were more commonly reported. Where combinations of tests were used in a risk score, we extracted the result for the test combination using the risk score and not the individual components that made up the test.
Meta‐analyses were undertaken using hierarchical summary ROC (HSROC) models, which included estimation of random‐effects in accuracy and threshold parameters when there were four or more studies. When there was an insufficient number of studies to reliably estimate all the parameters in the HSROC model, univariate random‐effects logistic regression models were used to obtain pooled estimates of sensitivity and specificity. It is common in this field for studies to report sensitivity for a fixed specificity (usually a 5% FPR). This removes the requirement to account for the correlation between sensitivity and specificity across studies by using a bivariate model since all specificities are the same value. Thus, at a fixed specificity value, the summary estimate of sensitivity was obtained using a univariate random‐effects logistic regression model. This model was further simplified to a fixed‐effect model when there were only two or three studies and heterogeneity was not observed on the SROC plot. All analyses were undertaken using the NLMIXED procedure in SAS (version 9.2; SAS Institute, Cary, NC) and the xtmelogit command in Stata version 11.2 (Stata‐Corp, College Station, TX, USA).
Comparisons between tests
Comparisons between tests were first made utilising all available studies, selecting one threshold for each test from each study to estimate a SROC curve without restricting to a common threshold. The threshold for each test was chosen from each study according to the following order of preference: a) the risk threshold closest to one in 250; b) a multiples of the median (MoM) or presence/absence threshold; c) the performance closest to a 5% FPR or 95th percentile. The 5% FPR was chosen as a cut‐off point as this is the cut‐off most commonly reported in the literature. The analysis that used all available studies was performed by including the most evaluated or best performing test strategies in a single HSROC model. The model included two indicator terms for each test to allow for differences in accuracy and threshold. As there were very few studies for each test, a symmetric summary ROC curve was assumed. In addition, because the analysis failed to converge, we assumed fixed‐effect for the threshold and accuracy parameters. An estimate of the sensitivity of each test for a 5% FPR was derived from the SROC curve, and associated confidence intervals were obtained using the delta method.
Direct comparisons between tests were based on results of very few studies, and were analysed using a simplified HSROC model with fixed‐effect and symmetrical underlying SROC curves because the number of studies was insufficient to estimate between study heterogeneity in accuracy and threshold or asymmetry in the shape of the SROC curves. A separate model was used to make each pair‐wise comparison. Comparisons between tests were assessed by using likelihood ratio tests to test if the differences in accuracy were statistically significant or not. The differences were expressed as ratios of diagnostic odds ratios and were reported with 95% confidence intervals. As studies rarely report data cross‐classified by both tests for Down's and normal pregnancies, the analytical method did not take full account of the pairing of test results, but the restriction to direct head‐to‐head comparisons should have removed the potential confounding of test comparisons with other features of the studies. The strength of evidence for differences in performance of test strategies relied on evidence from both the direct and indirect comparisons.
Investigations of heterogeneity
If there were 10 or more studies available for a test, we had planned to investigate heterogeneity by adding covariate terms to the HSROC model (meta‐regression) to assess the effect of each factor stated in the Investigation of sources of heterogeneity section on accuracy and threshold.
Sensitivity analyses
Mothers with pregnancies identified as high risk for Down's syndrome by ultrasound and serum testing were often offered immediate definitive testing by amniocentesis, whereas those considered low risk were assessed for Down's syndrome by inspection at birth. Such delayed and differential verification will introduce bias most likely through there being greater loss to miscarriage in the Down's syndrome pregnancies that were not detected by the ultrasound and serum testing (the false negative diagnoses). Testing and detection of miscarriages is impractical in many situations, and no clear data are available on the magnitude of these miscarriage rates.
To account for potential bias introduced by such a mechanism, where possible, we performed sensitivity analyses by increasing the number of false negatives in studies where delayed verification in test negatives occurred (Mol 1999). We increased the number of false negatives in such studies by a multiplicative factor that we applied incrementally from 10% to 50%. The final value of 50% assumes the true number of false negatives is 1.5 times the observed number of false negatives, implying the observed number of false negatives.is 67% (i.e. 1/1.5) of the true number and the fetal loss rate is 33%. Since no increments were added to the number of true negatives, this represents a scenario where a third more pregnancies affected by Down’s syndrome is likely to miscarry compared to those unaffected by Down's syndrome. This is thought to be higher than the likely value.
We intended to conduct these sensitivity analyses on analyses investigating the effect of maternal age on test sensitivity. However, due to limited data, we performed the sensitivity analyses when comparing high‐risk populations with routine screening populations. This comparison was considered a proxy for the effect of maternal age because the main indication for referral for invasive testing was often increased risk due to advanced maternal age.
Results
Results of the search
After the results from each bibliographic database were combined and duplicates were removed, the search for the whole suite of reviews identified a total of 15,394 papers. After screening out obviously inappropriate papers based on their title and abstract, 1145 papers remained and we obtained full‐text copies for formal assessment of eligibility. From these, a total of 269 papers were deemed eligible and were included in the suite of reviews. A total of 126 studies (reported in 152 publications) were included in this review of first trimester ultrasound alone or in combination with first trimester serum screening. Since women with multifetal pregnancies were included in six of the 126 studies, where a study included multifetal pregnancies, we report fetuses rather than women or pregnancies. The review involved 1,604,040 fetuses including 8454 Down's syndrome cases.
A total of 60 different test strategies were evaluated in the 126 studies. These tests were formed from combinations of different ultrasound markers, serum tests and maternal age. The 11 individual ultrasound markers were nuchal translucency (NT), nasal bone, ductus venosus Doppler (ductus venosus a‐wave reversed, ductus venosus pulsivity index), maxillary bone length, fetal heart rate, aberrant right subclavian artery, frontomaxillary facial angle, presence of mitral gap, tricuspid regurgitation, tricuspid blood flow and iliac angle 90 degrees. The 12 individual serum markers were inhibin A, alpha‐fetoprotein (AFP), free beta human chorionic gonadotrophin (ßhCG), total hCG, pregnancy‐associated plasma protein A (PAPP‐A), unconjugated oestriol (uE3), disintegrin and metalloprotease 12 (ADAM 12), placental growth factor (PlGF), placental growth hormone (PGH), invasive trophoblast antigen (ITA) (h‐hCG), growth hormone binding protein (GHBP), and placental protein 13 (PP13). The strategies evaluated, with or without maternal age, included 13 single ultrasound markers; five combinations of two or more ultrasound markers; six ultrasound and single serum marker combinations; 22 ultrasound and double serum marker combinations; nine ultrasound and triple serum marker combinations; one ultrasound and quadruple serum marker combination; three ultrasound and quintuple serum marker combinations; and one ultrasound and sextuple serum marker combination. Seventy‐eight of the 126 studies only evaluated the performance of a single first trimester ultrasound or ultrasound and serum test or test strategy; 27 studies evaluated two tests, 10 evaluated three tests, four evaluated four tests, four evaluated five tests, one evaluated eight tests (Koster 2011), one evaluated 11 tests (Kagan 2010), and one evaluated 19 tests (Wald 2003).
The following test combinations were evaluated by four or more studies.
Ultrasound and triple serum markers
-
NT, PAPP‐A, free ßhCG, ADAM 12 and maternal age (four studies; 2571 women, including 256 Down's syndrome pregnancies)
Ultrasound and double serum markers
-
NT, PAPP‐A, free ßhCG and maternal age (69 studies; 1,173,853 fetuses, including 6010 Down's syndrome cases)
Ultrasound and single serum markers
-
NT, free ßhCG and maternal age (five studies; 10,795 women, including 421 Down's syndrome pregnancies)
-
NT, PAPP‐A and maternal age (five studies; 9,814 women including 372 Down's syndrome pregnancies)
Ultrasound markers alone
-
NT, nasal bone and maternal age (five studies, 29,699 women, including 221 Down's syndrome pregnancies)
-
NT and maternal age (50 studies; 530,874 fetuses including 2701 Down's syndrome cases)
-
Nasal bone and maternal age (four studies; 25,303 women, including 165 Down's syndrome pregnancies)
-
Ductus and maternal age (five studies; 5,331 women including 165 Down's syndrome pregnancies)
-
Nasal bone (11 studies; 48,279 fetuses including 290 Down's syndrome cases)
-
NT (13 studies; 90,978 fetuses, including 593 Down's syndrome cases)
Of the remaining test combinations, four were evaluated in three studies, six were evaluated in two studies and the remaining 40 in single studies only.
Methodological quality of included studies
The studies were judged to be of high methodological quality in most categories (Figure 1) and details are provided in the Characteristics of included studies. The spectrum of participants was judged to be representative in all study cohorts. The reference standard used was judged unclear in three studies (Hafner 1998; Krantz 2000; Orlandi 1997) and unacceptable in one study (Noble 1995). Due to the nature of testing for Down's syndrome screening and the potential side effects of invasive testing, differential verification is almost universal in the general screening population, as most women whose screening test result is defined as low risk (negative) will have their screening test verified at birth, rather than by invasive diagnosis in the antenatal period. Partial verification was avoided in 81 study cohorts (64%) and differential verification was avoided in 15 study cohorts (12%). Both differential and partial verification was avoided in 14 study cohorts (Biagiotti 1998; Borenstein 2008; Christiansen 2005; Cicero 2004a; De Graaf 1999; Hewitt 1996; Maiz 2007; Matias 1998; Matias 2001; Mavrides 2002; Molina 2010 high risk; Otaño 2002; Pajkrt 1998a; Prefumo 2005 ). Of the 14 study cohorts, the populations in 13 were high‐risk referral for invasive testing (prior to screening being undertaken), while one (Christiansen 2005) obtained maternal serum samples through screening programmes for syphilis and Down's syndrome. Reference standard results were unblinded in 124 study cohorts and unclear in three study cohorts. In contrast, index test results were blinded in 113 study cohorts and unclear in 14. It would be difficult to blind clinicians performing invasive diagnostic tests (reference standards) to the index test result, unless all women received the same reference standard, which would not be appropriate in most scenarios. Any biases secondary to a lack of clinician blinding are likely to be minimal.

Methodological quality graph: review authors' judgements about each methodological quality item presented as percentages across all included studies.
Most studies seemed to indicate 100% follow‐up, however there will inevitably be losses to follow‐up due to women moving out of area, for example. Studies sometimes accounted for these and it is unlikely that there were enough losses to follow‐up to have introduced significant bias. There was likely under‐ascertainment of miscarriage, and very few papers accounted for miscarriage or performed tissue karyotyping in pregnancies resulting in miscarriage. Some studies attempted to adjust for predicted miscarriage rate and the incidence of Down's syndrome in this specific population, but most did not. We have not attempted to adjust for expected miscarriage rate in this review. There is a higher natural miscarriage rate in the first trimester, however this will be uniform across studies and therefore unlikely to introduce significant bias.
Some studies which provided estimates of risk using multivariable equations used the same data set to evaluate performance of the risk equation as was used to derive the equation. This is often thought to lead to over‐estimation of test performance.
Findings
The results for the 10 most evaluated test strategies are presented in summary of findings Table 1. Additional information and results at specific thresholds are provided below.
1) NT, PAPP‐A, free ßhCG and maternal age (Figure 2)
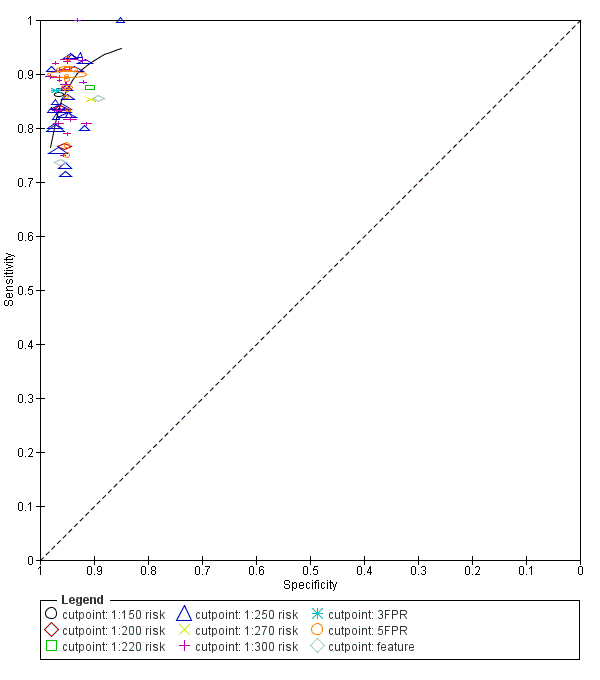
Study estimates of sensitivity and specificity with a summary ROC curve for the NT, PAPP‐A, free ßhCG and maternal age test combination at different cut‐points. Each symbol represents a pair of sensitivity and specificity at one cut‐point from each study.
This was the most evaluated test strategy and accounted for most (73%) of the fetuses in this systematic review. The test was evaluated by 69 studies and involved 1,173,853 fetuses (including 6010 Down's syndrome cases). Six studies (Cowans 2009; Ekelund 2008; Kagan 2010; Merz 2011; Nicolaides 2005; Wright 2010) contributed more than half the total number of fetuses affected by Down’s syndrome (3057); the largest study (Wright 2010) included 223,361 women in whom 886 pregnancies were affected by Down’s syndrome. Across the 69 studies, data were presented at 10 cut‐points (1% false positive rate (FPR), 3% FPR, 4.5% FPR, 5% FPR, 1:150 risk, 1:200 risk, 1:220 risk, 1:250 risk, 1:270 risk and 1:300 risk). At a cut‐point of 5% FPR (24 studies, 391,874 fetuses including 2521 fetuses affected by Down’s syndrome), the estimated sensitivity was 87% (95% CI 84 to 89); at a cut‐point of 1:250 risk (25 studies; 174,712 fetuses including 1032 fetuses affected by Down’s syndrome), the estimated sensitivity was 85% (95% CI 81 to 87) and the specificity was 95% (95% CI 95 to 96).
2) NT, PAPP‐A, free ßhCG, ADAM 12 and maternal age
This combination of NT, triple serum markers and maternal age was evaluated by four studies (Christiansen 2010; Koster 2011; Spencer 2008; Torring 2010) and included 2571 women (256 pregnancies were affected by Down’s syndrome). Studies presented data for cut‐points of 5% FPR (Christiansen 2010; Koster 2011; Spencer 2008; Torring 2010) and 1;250 risk (Christiansen 2010; Torring 2010). At a cut‐point of 5% FPR (four studies, 2571 women), the estimated sensitivity was 85% (95% confidence interval (CI) 75 to 91); at a cut‐point of 1:250 risk (two studies; 1222 women in whom 74 pregnancies were affected by Down’s syndrome), the estimated sensitivity was 86% (95% CI 77 to 93) and the specificity was 97% (95% CI 96 to 98).
3) NT, PAPP‐A and maternal age
This test strategy was evaluated by five studies (Biagiotti 1998; Habayeb 2010; Krantz 2000; Spencer 1999; Wald 2003) and involved 9814 women (including 372 Down's syndrome pregnancies). Data were presented at cut‐points of 5% FPR (Biagiotti 1998; Spencer 1999; Wald 2003), 1:100 risk (Habayeb 2010) and 1:185 risk (Krantz 2000). Habayeb 2010 estimated a sensitivity of 67% (95% CI 35 to 90) and specificity of 98% (95% CI 97 to 98) at a cut‐point of 1:100 risk based on 1507 women in whom 12 pregnancies were affected by Down’s syndrome. At a cut‐point of 1:185 risk, Krantz 2000 estimated a sensitivity of 82% (95% CI 65 to 93) and specificity of 95% (95% CI 94 to 96) based on 5809 women in whom 33 pregnancies were affected by Down’s syndrome. For the three studies (2498 women in whom 327 pregnancies were affected by Down’s syndrome) that reported a 5% FPR, the estimated sensitivity was 80% (95% CI 75 to 84).
4) NT, nasal bone and maternal age
This combination of two ultrasound markers and maternal age was evaluated by five studies (Has 2008; Kagan 2010; Prefumo 2005; Prefumo 2006; Sepulveda 2007) and involved 29,699 women (including 221 Down's syndrome pregnancies). Data were presented at cut‐points of 1:100 risk (Kagan 2010) and 1:300 risk (Has 2008; Prefumo 2005; Prefumo 2006; Sepulveda 2007). Kagan 2010 estimated a sensitivity of 83% (95% CI 75 to 89) and specificity of 97% (95% CI 97 to 97) based on 19,736 women in whom 122 pregnancies were affected by Down’s syndrome. At a cut‐point of 1:300 risk (four studies; 9963 women in whom 99 pregnancies were affected by Down’s syndrome), the estimated sensitivity was 61% (95% CI 22 to 89) and the specificity was 97% (95% CI 90 to 99).
5) NT, free ßhCG and maternal age
Results for this combination of NT, a single serum marker and maternal age were obtained from five studies (Biagiotti 1998; Krantz 2000; Noble 1995; Spencer 1999; Wald 2003) involving 10,975 women in whom 421 were affected by Down's syndrome pregnancies. Data were presented at cut‐points of 5% FPR (Biagiotti 1998; Noble 1995; Spencer 1999; Wald 2003) and 1:240 risk (Krantz 2000). At a cut‐point of 5% FPR (four studies; 4986 women in whom 388 pregnancies were affected by Down’s syndrome), the estimated sensitivity was 77% (95% CI 68 to 84). At a cut‐point of 1:240 risk, Krantz 2000 estimated a sensitivity of 79% (95% CI 61 to 91) and specificity of 95% (95% CI 94 to 96) based on 5799 women in whom 33 pregnancies were affected by Down’s syndrome.
6) NT and maternal age (Figure 3)

Study estimates of sensitivity and specificity with a summary ROC curve for NT and maternal age across different cut‐points. Each symbol represents a pair of sensitivity and specificity at one cut‐point from each study.
This ultrasound marker was evaluated in 50 studies that included 530,874 fetuses including 2701 fetuses affected by Down's syndrome. Seven studies (Bestwick 2010; Gasiorek‐Wiens 2001; Kagan 2010; O'Leary 2006; Snijders 1998; Wald 2003; Wright 2008) each included over 20,000 fetuses and contributed over half the data (296,481 fetuses including 1444 Down's syndrome cases); Snijders 1998 was the largest study (95,802 fetuses). The 50 studies reported diagnostic accuracy at five different cut‐points (1% FPR, 3% FPR, 5% FPR, 1:250 risk and 1:300 risk). At a cut‐point of 5% FPR (22 studies; 288,853 fetuses including 1784 Down's syndrome cases), the estimated sensitivity was 71% (95% CI 67 to 75); at a cut‐point of 1:250 risk, the estimated sensitivity was 72% (95% CI 62 to 80) and specificity was 94% (95% CI 90 to 96) based on 10 studies of 79,412 fetuses including 247 affected by Down’s syndrome.
7) NT (Figure 4)
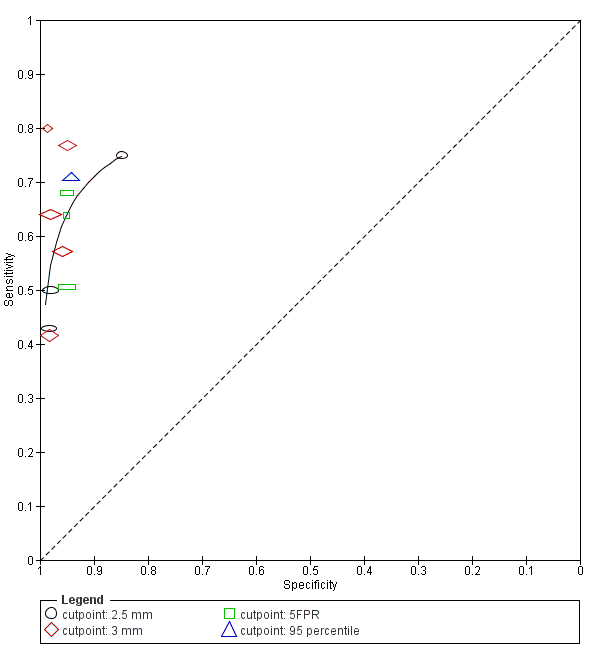
Study estimates of sensitivity and specificity with a summary ROC curve for NT. Each symbol represents a pair of sensitivity and specificity at one cut‐point from each study.
Thirteen studies (Acacio 2001; Babbur 2005; Bestwick 2010; Hafner 1998; Hewitt 1996; Kim 2006; Marsis 2004; Michailidis 2001; Nicolaides 1992; Pajkrt 1998a; Schuchter 2002; Spencer 1999; Wald 2003) evaluated NT in 90,978 fetuses including 593 affected by Down's syndrome. Of the 13 studies, two studies (Bestwick 2010; Wald 2003) had a sample size of more than 20,000 and contributed 69% (62,729 fetuses) of the data. Data were presented at cut‐points of 2.5 mm (Acacio 2001; Hafner 1998; Kim 2006; Schuchter 2002), 3 mm (Babbur 2005; Hewitt 1996; Kim 2006; Marsis 2004; Nicolaides 1992; Pajkrt 1998a), 5% FPR (Bestwick 2010; Spencer 1999; Wald 2003) and 99th centile (Michailidis 2001). At a 5% FPR, the estimated sensitivity from the three studies was 62% (95% CI 54 to 69), based on 63,885 fetuses including 401 affected by Down's syndrome. At the 2.5 mm cut‐point, the estimated sensitivity from the four studies was 61% (95% CI 42 to 77) and the specificity was 96% (95% CI 90 to 98) based on 64 affected cases and a total of 11,835 fetuses. For the 3 mm cut‐point, the estimated sensitivity from the six studies was 58% (95% CI 48 to 68) and the specificity was 97% (95% CI 96 to 98) based on 136 cases and a total of 10,381 fetuses.
8) Nasal bone and maternal age
Nasal bone adjusted for maternal age was evaluated in four studies (Monni 2005; Prefumo 2005; Prefumo 2006; Viora 2003) involving 25,303 women and included 165 Down's syndrome pregnancies.Monni 2005 accounted for 66% (16,641 women) of the data. The estimated summary sensitivity was 49% (95% CI 37 to 60) and the summary specificity was 98% (95% CI 95 to 99).
9) Ductus and maternal age
Five studies (Borrell 2005; Matias 2001; Mavrides 2002; Molina 2010 high risk; Prefumo 2005) evaluated this single ultrasound marker in 5,331 women including 165 Down's syndrome pregnancies. Borrell 2005 contributed 70% (3731 women) of the data. Data were presented at 5% FPR (Borrell 2005; Mavrides 2002), 1:250 risk (Borrell 2005), or fetuses were categorised as negative or positive for Down's syndrome based on normal or abnormal ductus venous flow (Matias 2001; Mavrides 2002; Prefumo 2005). At a 5% FPR, the estimated sensitivity from the two studies was 67% (95% CI 54 to 78) based on 3965 women in whom 55 were affected by Down's syndrome pregnancies.
10) Nasal bone
Results for this single marker were obtained from 11 studies (Cicero 2006; Has 2008; Leung 2009; Malone 2004; Molina 2010 high risk; Moon 2007; Orlandi 2003; Orlandi 2005; Otaño 2002; Ramos‐Corpas 2006; Sepulveda 2007) involving 48,279 fetuses including 290 affected by Down's syndrome. Cicero 2006 was the largest study (20,418 women including 140 affected cases), accounting for 42% of the data. The estimated summary sensitivity was 49% (95% CI 34 to 64) and the summary specificity was 99% (95% CI 99 to 100).
11) Other test strategies
The results for the remaining test strategies are presented in summary of findings Table 2. Of the 50 test strategies evaluated in fewer than four studies, 33 test strategies showed estimated sensitivities of at least 70% and estimated specificities of 90%; none of the eight single tests without maternal age achieved this level of test performance. The following seven test strategies evaluated in one or two studies showed sensitivities of more than 90% and specificities of more than 95%.
-
NT, free ßhCG and PAPP‐A evaluated in a single study (Hormansdorfer 2011) estimated a sensitivity of 90% (95% CI 76 to 97%) and specificity of 95% (95% CI 95 to 96) at a first trimester incidence rate of 63.3%.
-
NT, PAPP‐A, free ßhCG, GHBP and maternal age evaluated in a single study (Christiansen 2009) estimated a sensitivity of 91% (95% CI 81 to 96) at a cut‐point of 5% FPR.
-
NT, tricuspid blood flow, free ßhCG, PAPP‐A and maternal age evaluated in a single study (Kagan 2010) estimated a sensitivity of 91% (95% CI 84 to 95) and specificity of 97% (95% CI 97 to 98) at a cut‐point of 1:100 risk.
-
NT, fetal heart rate, free ßhCG, PAPP‐A and maternal age evaluated in two studies (Kagan 2010; Maiz 2009) estimated a sensitivity of 92% (95% CI 89 to 94) at a cut‐point of 5% FPR.
-
NT, fetal heart rate, nasal bone, free ßhCG, PAPP‐A and maternal age evaluated in a single study (Kagan 2010) estimated a sensitivity of 95% (95% CI 90 to 98) and specificity of 96% (95% CI 95 to 96) at a cut‐point of 1:200 risk.
-
NT, fetal heart rate, tricuspid blood flow, free ßhCG, PAPP‐A and maternal age evaluated in a single study (Kagan 2010) estimated a sensitivity of 96% (95% CI 91 to 99) at a cut‐point of 5% FPR.
-
NT, fetal heart rate, ductus, free ßhCG, PAPP‐A and maternal age evaluated in a single study (Maiz 2009) estimated a sensitivity of 97% (95% CI 92 to 99) at a cut‐point of 5% FPR.
Comparative analysis of the 10 selected test strategies
For each test we obtained the detection rate (sensitivity) for a fixed false positive rate (FPR) (1‐specificity), a metric which is commonly used in Down’s syndrome screening to describe test performance. We chose to estimate detection rates at a 5% FPR in common with much of the literature. However, because the 5% FPR was not within the range of the data for the nasal bone marker (the specificities were between 97% and 100%), we did not compute the detection rate at a 5% FPR for this test; the summary sensitivity was 49% (95% CI 34 to 64) and the summary specificity was 99% (95% CI 99 to 100). Figure 5 shows point estimates of the detection rate (and their 95% CIs) at a 5% FPR based on all available data for the remaining nine test strategies; the test strategies are ordered according to decreasing detection rates. The plot shows that for the combined NT, PAPP‐A, free ßhCG and maternal age test strategy, the estimated detection rate was 87% (95% CI 86 to 89) based on data from 69 studies with 6010 affected cases out of a total of 1,173,853 participants. The four single ultrasound markers (NT and maternal age; NT; nasal bone and maternal age; and ductus and maternal age) showed the worst performance, whereas, the three test strategies containing PAPP‐A showed the highest performance with detection rates above 80%. However, it should be noted that the confidence intervals around the estimates generally overlap though the confidence interval for the combined NT, PAPP‐A, free ßhCG and maternal age test strategy is very narrow and not overlapped by five of the other test strategies.

Detection rates (% sensitivity) at a 5% false positive rate for nine of the most evaluated first trimester ultrasound markers alone or in combination with first trimester serum tests. A = NT, PAPP‐A, free ßhCG and maternal age; B = NT, PAPP‐A, free ßhCG, ADAM 12 and maternal age; C = NT, PAPP‐A and maternal age; D = NT, nasal bone and maternal age; E= NT, free ßhCG and maternal age; F= NT and maternal age; G = NT; H = Nasal bone and maternal age; and I = Ductus and maternal age.
Each square represents the summary sensitivity for a test strategy at a 5% false positive rate. The size of each square is proportional to the number of Down's cases. The estimates are shown with 95% confidence intervals. The test strategies are ordered on the plot according to decreasing detection rate. For each test strategy, the number of included studies, Down's syndrome cases and pregnancies are shown on the horizontal axis.
The strength of evidence for differences in the diagnostic performance of the 10 test strategies relied on evidence from both direct and indirect comparisons. Table 1 shows pair‐wise direct comparisons (head‐to‐head), where studies were available. Such comparisons are regarded as providing the strongest evidence as differences between tests are unconfounded by study characteristics. The table shows the number of studies (K), the ratios of diagnostic odds ratios (DORs) with 95% CIs and P values for each test comparison. The diagnostic accuracy of NT (with or without maternal age) alone tended to be inferior unlike when combined with serum tests (PAPP‐A and free ßhCG). However, all comparisons in this table, except for the combined NT, PAPP‐A, free ßhCG and maternal age versus NT and maternal age test comparison (25 studies), were based on five or fewer studies and so are unlikely to be powered to detect differences in accuracy.
| Ratio of DORs (95% CI); P value (Studies) | Nasal bone | NT | Nasal bone and age | Ductus and age | NT and age | NT, nasal bone and age | NT, free ßhCG and age | NT, PAPP‐A and age | NT, PAPP‐A, free ßhCG and age |
| NT | – | ||||||||
| Nasal bone and age | – | – | |||||||
| Ductus and age | 1.19 (0.12, 11.4); P = 0.84 (K = 1) | – | 0.85 (0.21, 3.41); P = 0.76 (K = 1) | ||||||
| NT and age | 0.62 (0.13, 2.93); P = 0.50 (K = 2) | 1.25 (0.90, 1.74); P = 0.17 (K = 3) | 0.84 (0.48, 1.49); P = 0.52 (K = 3) | 1.07 (0.51, 2.23); P = 0.85 (K = 3) | |||||
| NT, nasal bone and age | 0.61 (0.12, 3.10); P = 0.50 (K = 2) | – | 4.01 (1.51, 10.6); P = 0.01 (K = 2) | 0.95 (0.23, 3.97); P = 0.93 (K = 1) | 1.05 (0.70, 1.56); P = 0.82 (K = 5) | ||||
| NT, free ßhCG and age | – | 2.15 (1.33, 3.50); P = 0.007 (K = 2) | – | – | 1.47 (1.00, 2.15); P = 0.05 (K = 4) | – | |||
| NT, PAPP‐A and age | – | 2.86 (1.73, 4.73); P = 0.001 (K = 2) | – | – | 1.88 (1.27, 2.78); P = 0.004 (K = 4) | – | 1.28 (0.84, 1.93); P = 0.23 (K = 4) | ||
| NT, PAPP‐A, free ßhCG and age | 3.83 (0.89, 16.4); P = 0.07 (K = 2) | 4.35 (2.00, 9.46); P = 0.015 (K = 4) | – | 3.00 (0.42, 21.2); P = 0.19 (K = 1) | 3.19 (2.19, 4.66); P < 0.0001 (K = 25) | 1.23 (0.63, 2.40); P = 0.50 (K = 2) | 2.06 (1.31, 3.22); P = 0.004 (K = 4) | 1.61 (1.02, 2.55); P = 0.043 (K = 4) | |
| NT, PAPP‐A, free ßhCG, ADAM 12 and age | – | – | – | – | – | – | – | – | 0.87 (0.49, 1.52); P = 0.60 (K = 4) |
– Indicates pairs of tests where there were no head‐to head comparisons of the two tests in a study. Direct comparisons were made using only data from studies that compared each pair of tests in the same population. Ratio of diagnostic odds ratios (DORs) were computed by division of the DOR for the test in the row by the DOR for the test in the column. If the ratio of DORs is greater than one, then the diagnostic accuracy of the test in the row is higher than that of the test in the column; if the ratio is less than one, the diagnostic accuracy of the test in the column is higher than that of the test in the row.
Table 2 shows the same comparisons made using all available data. Results are generally in agreement with the direct comparisons, and in addition, showed some statistically significance differences (P < 0.05) suggesting that nasal bone outperformed other ultrasound markers and had similar accuracy with strategies comprising NT and serum markers. Nasal bone was the best performing ultrasound marker (DOR (95% CI): 132 (71 to 245)), and the combined NT, PAPP‐A, free ßhCG and maternal age test strategy was the best performing ultrasound and serum test combination (DOR (95% CI): 133 (114 to 155)). Both tests had a much higher diagnostic accuracy than the other tests, and the difference in accuracy was statistically significant in several comparisons especially when compared with single ultrasound markers with or without maternal age. The difference in accuracy between the nasal bone marker and test strategies that included at least one serum test was statistically significant (P = 0.04) for only the comparison with the combined NT, free ßhCG and maternal age test strategy. There were no statistically significant differences in accuracy between combinations that included nasal bone and NT with or without maternal age, and test strategies that included both NT and one or more serum markers. However, these comparisons are potentially confounded by differences between the studies.
| Ratio of DORs (95% CI); P value | Nasal bone | NT | Nasal bone and age | Ductus and age | NT and age | NT, nasal bone and age | NT, free ßhCG and age | NT, PAPP‐A and age | NT, PAPP‐A, free ßhCG and age | |
| DOR (95% CI) Studies | 132 (71, 245) K = 11 | 45 (31, 67) K = 13 | 40 (7, 224) K = 4 | 41 (18, 92) K = 5 | 46 (37, 57) K = 50 | 66 (24, 180) K = 5 | 65 (51, 84) K = 5 | 80 (59, 109) K = 5 | 133 (114, 155) K = 69 | |
| NT | 45 (31, 67) K = 13 | 0.34 (0.16, 0.71); P = 0.006 | ||||||||
| Nasal bone and age | 40 (7, 224) K = 4 | 0.31 (0.05, 1.90); P = 0.18 | 0.90 (0.16, 5.05); P = 0.89 | |||||||
| Ductus and age | 41 (18, 92) K = 5 | 0.31 (0.11, 0.87); P = 0.03 | 0.90 (0.37, 2.20); P = 0.80 | 1.00 (0.11, 9.34); P = 1.00 | ||||||
| NT and age | 46 (37, 57) K = 50 | 0.35 (0.19, 0.66); P = 0.002 | 1.02 (0.66, 1.58); P = 0.92 | 1.14 (0.23, 5.61); P = 0.87 | 1.14 (0.52, 2.49); P = 0.74 | |||||
| NT, nasal bone and age | 66 (24, 180) K = 5 | 0.50 (0.14, 1.81); P = 0.26 | 1.47 (0.47, 4.58); P = 0.48 | 1.64 (0.12, 21.5); P = 0.62 | 1.64 (0.33, 8.08); P = 0.46 | 1.43 (0.52, 3.98); P = 0.48 | ||||
| NT, free ßhCG and age | 65 (51, 84) K = 5 | 0.49 (0.25, 0.98); P = 0.04 | 1.44 (0.89, 2.34); P = 0.12 | 1.61 (0.26, 10.1); P = 0.56 | 1.61 (0.65, 3.99); P = 0.26 | 1.41 (1.02, 1.96); P = 0.04 | 0.98 (0.30, 3.19); P = 0.98 | |||
| NT, PAPP‐A and age | 80 (59, 109) K = 5 | 0.61 (0.29, 1.25); P = 0.16 | 1.77 (1.05, 3.00); P = 0.04 | 1.98 (0.30, 13.1); P = 0.42 | 1.98 (0.76, 5.15); P = 0.14 | 1.73 (1.19, 2.53); P = 0.005 | 1.21 (0.35, 4.13); P = 0.73 | 1.23 (0.74, 2.05); P = 0.35 | ||
| NT, PAPP‐A, free ßhCG and age | 133 (114, 155) K = 69 | 1.00 (0.55, 1.84); P = 1.00 | 2.93 (1.96, 4.40); P < 0.0001 | 3.27 (0.68, 15.8); P = 0.14 | 3.27 (1.53, 7.00); P = 0.003 | 2.87 (2.21, 3.72); P < 0.0001 | 2.00 (0.73, 5.45); P = 0.17 | 2.03 (1.52, 2.72) P < 0.0001 | 1.65 (1.17, 2.34) P = 0.005 | |
| NT, PAPP‐A, free ßhCG, ADAM 12 and age | 85 (58, 124) K = 4 | 0.64 (0.30, 1.37); P = 0.23 | 1.88 (1.07, 3.32); P = 0.03 | 2.10 (0.31, 14.1); P = 0.39 | 2.10 (0.78, 5.63); P = 0.12 | 1.84 (1.19, 2.84); P = 0.007 | 1.28 (0.37, 4.47); P = 0.65 | 1.30 (0.81, 2.09) P = 0.26 | 1.06 (0.61, 1.86) P = 0.81 | 0.64 (0.43, 0.96) P = 0.03 |
Indirect comparisons were made using all available data for each pair of tests. Ratios of diagnostic odds ratios (DORs) were computed by division of the DOR for the test in the row by the DOR for the test in the column. If the ratio of DORs is greater than one, then the diagnostic accuracy of the test in the row is higher than that of the test in the column; if the ratio is less than one, the diagnostic accuracy of the test in the column is higher than that of the test in the row.
Investigation of heterogeneity and sensitivity analyses
We explored the effect of advanced maternal age (< 35 years versus ≥ 35 years) on test performance. However, we were unable to use meta‐regression to formally investigate the effect of advanced maternal age due to limited data. Of the 126 included studies, 13 did not report maternal age. The available data for all studies are summarised in Table 3 which also shows the four test combinations (NT, PAPP‐A, free ßhCG and maternal age; NT and maternal age; nasal bone alone; and NT alone) that included 10 or more studies. Two studies included only pregnant women with maternal age of 35 years or more; one study (Centini 2005) evaluated the NT, PAPP‐A, free ßhCG and maternal age test combination and the other study (Marsis 2004) evaluated NT. Across the four tests there were 12 studies of women considered high‐risk referrals; one of the studies (Centini 2005), included only pregnant women ≥ 35 years old. The main indication for referral for invasive testing was often increased risk due to advanced maternal age and so we compared high‐risk populations with routine screening populations. The analysis was not performed for nasal bone because only two of the 11 studies were conducted in high‐risk populations. The results of the investigation for the remaining three tests together with the sensitivity analyses inflating the false negatives from 10% to 50% in studies where delayed verification in test negatives occurred are shown in Table 4.
| Study | NT, PAPP‐A, free ßhCG and age | Nasal bone | NT and age | NT | Maternal age (range) in years | Reference standard | Population | Study design | Study location |
| X | Mean 35.8 (21‐45) | CVS biopsy, amniocentesis or blood or placenta used for fetal karyotyping | High‐risk referral for invasive testing | Retrospective study of patient notes | South America | ||||
| X | Mean 30.1, all < 38, 86% < 35, 14% ≥ 35 | Prenatal karyotype conducted (in 7.6% of patients) depending on presence of risk > 125, high maternal age, parental anxiety, history of chromosomal defects or parental translocation or abnormal second trimester scan age | Routine screening | Prospective consecutive series | France | ||||
| X | Median 37 (19‐46) | Invasive testing offered to women with NT > 3 mm or risk > 1:250 as defined by combined NT and serum results (CVS from 11 weeks, amniocentesis from 15 weeks). Rapid in situ hybridisation test in patients with risk > 1:30. No details given of any follow‐up to birth | Women requesting screening (self‐paying service) and women attending on account of previous pregnancy history of fetal abnormality | Prospective cohort | UK | ||||
| X | Mean 34.9 for screen positives, 30.5 for screen negatives | Karyotyping or follow‐up to birth | Routine screening | Cohort | Australia | ||||
| Mean 36.4 (15‐46) for Down's cases, 29.8 (15‐49) for unaffected pregnancies | Amniocentesis or CVS (85% of women) or follow‐up to birth | High‐risk referral for invasive testing | Cohort | Budapest | |||||
| X | Mean 32 (16‐46), 8.3% > 35 | Amniocentesis due to maternal age > 38 years (6.1% or women). Karyotyping encouraged for women with positive result on one or more index test. No details of reference standard for index test negative women | Routine screening | Prospective cohort | France | ||||
| X | X | X | Median 39 for Down's cases, 34 for unaffected pregnancies | Karyotyping or follow‐up to birth | Routine screening | Retrospective cohort | UK | ||
| X | X | Unclear (maybe all ≥ 38) | Amniocentesis or CVS | High‐risk referral for invasive testing | Case control | Italy | |||
| Median 35 (17‐49) | CVS | High‐risk referral for invasive testing | Prospective cohort | UK | |||||
| X | X | Not reported | CVS (high‐risk women) or follow‐up to birth | Routine screening | Retrospective cohort | Spain | |||
| X | Mean 32 | Karyotyping or follow‐up to birth | Routine screening and high‐risk referral | Prospective cohort | Spain | ||||
| X | Median 31 (14‐47), 20% ≥ 35 | Karyotyping or follow‐up to birth | Routine screening | Retrospective cohort | Australia | ||||
| X | Median 28 (13‐46), 19.4% ≥ 35 | Antenatal karyotyping (5.9% of pregnancies: 62% of high‐risk, 29% of medium‐risk and 3% of the low‐risk women). Follow‐up to birth (85.3% of women) | Routine screening | Prospective cohort | Brazil | ||||
| X | ≥ 35 (35‐44) | Amniocentesis in women high risk on screening (16.2%). Follow‐up at birth in women who were low risk on screening | High‐risk patients undergoing routine screening | Retrospective cohort | Italy | ||||
| X | Median 33 (IQR 31‐36), 36.2% ≥ 35 | Karyotyping or follow‐up to birth in 96.1% of patients | Routine screening | Prospective consecutive cohort | USA | ||||
| Median 30 (20‐44) for Down's cases, 32 (19‐40) for controls | Karyotyping or follow‐up to birth | Routine screening | Case control | China | |||||
| X | Not reported | Karyotyping | Screening programmes for syphilis and Down's syndrome | Case control | Denmark | ||||
| X | Median 37.5 for Down's cases, 36.4 for controls | Karyotyping or follow‐up to birth | Routine screening | Case control | Denmark | ||||
| X | Median 36 (25‐44) for Down's cases, 29 (17‐45) for controls | Karyotyping or follow‐up to birth | Routine screening | Case control | Denmark | ||||
| Median 37 (16‐48) | CVS | High‐risk referral for invasive testing | Prospective cohort | USA | |||||
| X | Median 35 (18‐50) | CVS or amniocentesis (in high risk women) or follow‐up to birth | Routine screening | Prospective cohort | UK | ||||
| Cocciolone 2008 (first trimester screening cohort) | X | Median 31.3 | Karyotyping or follow‐up to birth | Routine screening | Cohort | Australia | |||
| X | Mean 38 (16‐49) for Down's cases, 29 (13‐56) for unaffected pregnancies | Karyotyping or follow‐up to birth | Routine screening | Cohort | UK | ||||
| X | Mean 37.0 (IQR 32.9‐40.5) for Down's cases, 32.4 (IQR 29.0‐35.9) for controls | Karyotyping or follow‐up to birth | Routine screening | Case control | UK | ||||
| X | X | Median 29.9, 15.4% ≥ 35 | CVS (offered where women had high NT measurements), amniocentesis or follow‐up to birth | Routine screening | Prospective cohort | UK | |||
| X | X | Not reported | CVS and amniocentesis | High‐risk referral for invasive testing | Case control | Netherlands | |||
| X | Not reported | Karyotyping or follow‐up to birth | Routine screening | Cohort | Denmark | ||||
| X | Median 33 (15‐49), 36.1% > 35 | CVS, amniocentesis or follow‐up to birth | Routine screening | Prospective cohort | Germany, Switzerland and Austria | ||||
| X | Median 35.1 (13.2‐46.7) | Karyotyping or follow‐up to birth | Routine screening | Cohort | Germany | ||||
| X | 49% ≤ 35, 51% ≥ 36 | Invasive testing or follow‐up to birth | Routine screening | Retrospective cohort | Netherlands | ||||
| X | X | Not reported | CVS, amniocentesis or follow‐up to birth | Routine screening | Prospective cohort | Belgium | |||
| Median 35.4 (18‐49) | Karyotyping or follow‐up to birth | Routine screening | Cohort | UK | |||||
| X | Mean 30.7, 21.2% ≥ 35 | CVS, amniocentesis or follow‐up to birth | Routine screening | Prospective cohort | Australia | ||||
| X | Median 28 (15‐49) 6.9% ≥ 35 | Amniocentesis or CVS in patients with previous Down’s pregnancy, > 35 years or with a positive biochemical test result. Other women underwent scan at 22 weeks and, if NT >2.5 mm special examination directed to examination of fetal heart. Follow‐up to birth | Routine screening | Prospective cohort | Austria | ||||
| X | X | X | Median 28.3 (17‐45) | Karyotyping or follow‐up to birth | Routine screening | Cohort | Turkey | ||
| X | Median 37 (21‐48) | CVS | High‐risk referral for invasive testing | Prospective cohort | Australia | ||||
| X | Mean 31.1 (16‐46), 22% ≥ 35 | Karyotyping or follow‐up to birth | Routine screening | Prospective cohort | Germany | ||||
| X | Median 30 (15‐47), mean 29.8 (SD 3.3) | Karyotyping or follow‐up to birth | Routine screening | Cohort | Taiwan | ||||
| X | Mean 33 (16‐51), 18.5% ≥ 37 | Karyotyping or follow‐up to birth | Routine screening | Retrospective cohort | Australia | ||||
| Jaques 2010 FTS (first trimester screening) | X | Mean 16.3% ≥ 37 | Karyotyping or follow‐up to birth | Routine screening | Retrospective cohort | Australia | |||
| X | X | Mean 35.4 (14.1‐52.2) | Karyotyping or follow‐up to birth | Routine screening | Prospective cohort | UK | |||
| X | Mean 29.9 (SD 3.3) | Amniocentesis or CVS in patients considered high risk (NT > 2.5, aged > 35 years, positive biochemical test result, history or chromosomal abnormality, fetal structural abnormality at ultrasound or other reason). Follow‐up to birth | Routine screening | Retrospective cohort | South Korea | ||||
| X | Median 37 (IQR 36‐39) | Karyotyping or follow‐up to birth | Routine screening | Case control | Netherlands | ||||
| Kozlowski 2007 GC (Gynaecologists' practices) | X | X | Median 32 (15‐48), 26.4% ≥ 35 | Karyotyping or follow‐up to birth | Routine screening | Cohort | Germany | ||
| Kozlowski 2007 PC (Prenatal centre) | X | X | Median 34 (14‐46), 43.2% ≥ 35 | Karyotyping or follow‐up to birth | Routine screening | Cohort | Germany | ||
| X | X | 34.7% ≥ 35 | Not reported | Routine screening | Prospective cohort | USA | |||
| X | 51% ≥ 35 | Karyotyping or follow‐up to birth | Routine screening | Prospective cohort | Sweden | ||||
| X | Not reported | Karyotyping or follow‐up to birth | Routine screening | Case control | Netherlands | ||||
| X | Mean 30.5 (19% ≥ 35) for unaffected pregnancies | Women considered high risk offered CVS (0.7%) or amniocentesis (11.8%). | Routine screening | Prospective cohort | Hong Kong | ||||
| X | X | Median 32 (IQR 30‐35), 27.4% ≥ 35 | Amniocentesis or follow‐up to birth | Routine screening | Prospective cohort | China | |||
| X | Not reported | Karyotyping or follow‐up to birth | Routine screening | Retrospective cohort | UK | ||||
| Median 35 (17‐49) | CVS | High‐risk referral for invasive testing | Prospective cohort | UK | |||||
| Median 34.5 (14.1‐50.1) | Karyotyping or follow‐up to birth | Routine screening | Prospective cohort | UK | |||||
| X | Mean 30.1 (16‐47), 22.1% ≥ 35 | Amniocentesis (in women considered high risk, n = 510) or follow‐up to birth | Routine screening | Prospective cohort | USA | ||||
| X | 21.6% ≥ 35 | Amniocentesis offered to women with positive results from any screening test. Follow‐up to birth | Routine screening | Prospective cohort | USA | ||||
| X | Median 31.3 (18‐45), 19.7% ≥ 35 | Karyotyping or follow‐up to birth | Routine screening | Retrospective cohort | Italy | ||||
| X | Mean 37.8 (35‐43) | Amniocentesis (unclear in which patients this was conducted) or follow‐up to birth | Screening of patients ≥ 35 years of age | Prospective cohort | Indonesia | ||||
| X | X | Mean 38.5 (SD 4.0) for Down's cases, 35.5 (SD 4.0) for controls | Not reported | Routine screening | Case control | Sweden | |||
| Median 35 (17‐46) | Fetal karyotyping. In cases where NT above 95th percentile or abnormal ductus venousus flow, follow‐up scan conducted at 14‐16 weeks | High‐risk referral for invasive testing | Prospective cohort | UK and Portugal | |||||
| Median 35 (17‐46) | Fetal karyotyping. In cases where NT above 95th percentile or abnormal ductus venousus flow, follow‐up scan conducted at 14‐16 weeks | High‐risk referral for invasive testing | Prospective cohort | Portugal | |||||
| X | Median 35 (15‐42) | CVS or follow‐up | High‐risk referral for invasive testing | Prospective cohort | UK | ||||
| Maxwell 2011 FTS (first trimester screening cohort) | X | Median 31 (14‐48), 24.3% ≥ 35 | Karyotyping or follow‐up to birth | Routine screening | Prospective cohort | Australia | |||
| Mean 33.7 (SD 4.9) for Down's cases, 30.3 (SD 4.5) for controls | Amniocentesis (recommended for women with higher risk on first or second trimester testing) or follow‐up to birth | Routine screening | Case control | Israel | |||||
| X | X | Not reported | Karyotyping or follow‐up to birth | Routine screening | Case control | USA | |||
| X | Not reported | Karyotyping or follow‐up to birth | Routine screening | Retrospective cohort | Germany | ||||
| X | Mean 30.1 (13‐50), 21.1% ≥ 35, 11.9% ≥ 37 | Karyotyping in women considered at risk due to index test results, age or family history or those with considerable anxiety (632 women, 8.5%) or follow‐up to birth | Routine screening | Prospective cohort | UK | ||||
| Molina 2010 high risk (High‐risk cohort) | X | Mean 32.7 (16.7‐47.5) | CVS | High‐risk referral for invasive testing | Cohort | Spain | |||
| Molina 2010 screening (Screening cohort) | X | Not reported | Karyotyping or follow‐up to birth | Routine screening | Cohort | Spain | |||
| X | Median 32 (14‐49) | Karyotyping or follow‐up to birth | Routine screening | Prospective cohort | Italy | ||||
| X | Mean 31.1 (14‐49), 25.9% ≥35 | Invasive testing offered to women considered high risk from screening results or follow‐up to birth | Routine screening | Prospective cohort | Spain | ||||
| X | Mean 35.5 (SD 4.8) for Down's cases, 31.7 (SD 3.4) for unaffected pregnancies | Karyotyping or follow‐up to birth | Routine screening | Prospective cohort | Korea | ||||
| X | X | Not reported | Invasive testing (offered to women with high NT measurement) or follow‐up to birth | Routine screening | Retrospective cohort | France | |||
| X | Median 38 (22‐47) | Fetal karyotyping by amniocentesis (52%) or CVS (48%) | High‐risk referral for invasive testing | Prospective cohort | UK | ||||
| X | Median 31 (13‐49) | Amniocentesis or CVS (patients considered high risk based on screening). First trimester presence/absence of nasal bone, presence/absence of tricuspid regurgitation or normal/abnormal Doppler studies (patients of intermediate risk on first trimester screening and did not undergo CVS or amniocentesis. With the addition of information from these tests, if adjusted risk was high, CVS was performed). Follow‐up to birth | Routine screening | Prospective cohort | UK | ||||
| X | X | 17.5% ≥ 35 | Invasive testing (patients considered high risk based on NT screening) or follow‐up to birth. | Routine screening | Prospective cohort | Finland | |||
| Median 34 (15‐47), 47% ≥ 35 | Karyotyping performed (27% of women) due to increased NT (14%), advanced maternal age (10%), previous chromosomally abnormal child (0.5%) or parental anxiety (2%). | Routine screening in a high risk population | Prospective cohort | UK | |||||
| X | Median 32 | CVS, amniocentesis or neonatal karyotyping or follow‐up to birth | Routine screening | Prospective cohort | Australia | ||||
| X | X | Median 31 (14‐47), 20% ≥ 35 | CVS or amniocentesis (women assessed to be high risk on screening) or follow‐up to birth | Routine screening | Prospective cohort | Australia | |||
| Okun 2008 FTS (first trimester screening cohort) | X | Mean 34 | Karyotyping or follow‐up to birth | Routine screening | Prospective cohort | Canada | |||
| X | X | Range 15 to 46, 35% ≥ 35 | Not reported | Routine screening | Prospective cohort | Italy | |||
| X | Median 31.7 (SD 4.0) for Down's cases, 36.5 (SD 4.1) for unaffected pregnancies | CVS or amniocentesis (women considered high risk on screening on the basis of NT and biochemical results, but not on nasal bone screening, or if requested due to age or anxiety) or follow‐up to birth | Routine screening (2 centres) or in referred patients (1 centre) | Prospective cohort | Italy and Netherlands | ||||
| X | Median 30.5 (SD 8.2) | Not reported | Routine screening | Retrospective cohort | Italy | ||||
| X | Median 36 (19‐44) | CVS | High‐risk referral for invasive testing | Prospective cohort | Argentina | ||||
| X | Mean 31.4 (SD 5.7), 24% ≥ 35 | Prenatal karyotyping offered to patients considered high risk or maternal anxiety (conducted in 24%) or follow‐up to birth | Routine screening | Prospective cohort | Netherlands | ||||
| X | Mean 37.6 (22‐46) | Prenatal karyotyping | High‐risk referral for invasive testing | Consecutive cohort | Netherlands | ||||
| Palomaki 2007 FTS (first trimester screening cohort) | Mean 32.3 (SD 4.6) | Karyotyping or follow‐up to birth | Routine screening | Prospective cohort | Canada | ||||
| X | Median 33.0 (IQR 31.0‐36.0) | CVS or amniocentesis. Cytogenetic testing in cases of miscarriage. Follow‐up to birth. | Routine screening | Retrospective cohort | USA | ||||
| X | Median 37 (19‐46) | CVS | High‐risk referral for invasive testing | Prospective cohort | UK | ||||
| X | Mean 31.4 (14.5‐50.2) | Karyotyping or follow‐up to birth | Routine screening | Prospective cohort | UK | ||||
| X | Mean 30.1 (15‐46) (SD 5.37), 18% ≥ 35 | Invasive testing offered to patients considered high risk at screening (> 1:300) or follow‐up to birth | Routine screening | Prospective cohort | Spain | ||||
| X | 29.5, 17.7% ≥35 | Karyotyping or follow‐up to birth | Routine screening | Prospective cohort | Finland | ||||
| X | Median 30.5 (18‐37) | Amniocentesis offered to patients with NT >3mm or serum marker risk was > 1:250, or follow‐up to birth | Routine screening | Prospective cohort | France | ||||
| X | Mean 30.9 (SD 4.5) | Karyotyping or follow‐up to birth | Routine screening | Prospective cohort | Canada | ||||
| X | X | Median 33.1, 30.1% ≥ 35 | Karyotyping or follow‐up to birth | Routine screening | Prospective cohort | China | |||
| X | Median 30.7 (18.0‐46.3) | Karyotyping or follow‐up to birth | Routine screening | Prospective cohort | France | ||||
| X | X | Mean 30.6 (14‐46) | Karyotyping or follow‐up to birth | Routine screening | Retrospective cohort | Spain | |||
| X | Mean 28 (SD 5) | Invasive testing (women with high risk on screening) or follow‐up to birth | Routine screening | Prospective cohort | UK | ||||
| X | X | 31.0% ≥35 | Karyotyping or follow‐up to birth | Routine screening | Prospective cohort | Germany | |||
| X | Median 36.5 (18‐47) | Invasive testing or follow‐up to birth | Routine screening | Retrospective cohort | Netherlands | ||||
| X | Mean 28 (15‐46), 10.7% ≥ 35 | CVS (offered to patients with first trimester NT > 3.5 mm), amniocentesis (offered to patients with first trimester NT 2.5‐3.4 mm, high risk on second trimester serum testing (> 1:250) and those > 35 years) or follow‐up to birth | Routine screening | Retrospective cohort | Austria | ||||
| X | X | 13% > 35 | CVS and amniocentesis (offered to patients with increased risk (> 1:400) at first trimester screening. CVS recommended when NT > 3.5 or when women did not want to wait until the 15th week for amniocentesis), or follow‐up to birth | Routine screening | Prospective cohort | Austria | |||
| X | Mean 29.4 (16‐47) | Invasive testing (women considered high risk on screening) or follow‐up to birth | Routine screening | Prospective consecutive cohort | UK | ||||
| X | X | Median 32 (15‐44), 29% ≥ 35 | Invasive testing or follow‐up to birth | Routine screening | Prospective cohort | Australia | |||
| X | X | Median 33 (14‐47), 35.4% ≥ 35 | CVS, amniocentesis, cordocentesis or follow‐up to birth | Routine screening | Prospective cohort | Chile | |||
| X | Median 31 (14‐49) | CVS and amniocentesis (9.6% of women) or follow‐up to birth | Routine screening | Prospective cohort | UK | ||||
| X | Median 34 (23‐44) for Down's cases; mean 30.4 (16‐45), 16.5% ≥ 35 for unaffected pregnancies | Karyotyping or follow‐up to birth | Routine screening | Retrospective cohort | Denmark | ||||
| X | X | X | Median 38 (19‐46) for Down's cases, 36 (15‐47) for controls | Invasive testing (high‐risk women) or follow‐up to birth | Routine screening | Case control | UK | ||
| Median 36 (20‐44) for Down's cases, 30 (16‐41) for controls | Not reported | Routine screening | Case control | UK | |||||
| X | Median 35.8 for Down's cases, 29.3 for controls | Karyotyping or follow‐up to birth | Routine screening | Case control | Denmark | ||||
| X | Median 32 (14‐45), 27% ≥ 35 | Invasive testing offered to women with screening risk of > 1:250 or follow‐up to birth | Routine screening | Prospective cohort | UK | ||||
| X | Median 28.6 (15‐42) | Karyotyping or follow‐up to birth | Routine screening | Cohort | Slovenia | ||||
| X | Median 29 (16‐48), 7.8% ≥ 37 | CVS or amniocentesis or follow‐up to birth. Unclear reference standard in cases of intrauterine death, miscarriages and terminations. | Routine screening | Prospective cohort | Greece | ||||
| X | Mean 29 (15‐45) | CVS (offered to patients considered high risk on screening) or follow‐up to birth | Routine screening | Prospective cohort | UK | ||||
| Mean 34.5 (19‐45) | Karyotyping or follow‐up to birth | Routine screening | Prospective cohort | Netherlands | |||||
| X | Mean 35 for Down's cases, 31 for controls | Karyotyping or follow‐up to birth | Routine screening | Case control | Denmark | ||||
| X | Median 33.1, 36.9% ≥ 35 | Karyotyping or follow‐up to birth | Routine screening | Retrospective cohort | UK | ||||
| X | Mean 29.6, 18.6% ≥ 35 | Karyotyping or follow‐up to birth | Routine screening | Retrospective cohort | Finland | ||||
| Median 32 (18‐47) | CVS or follow‐up to birth | Routine screening | Prospective cohort | Italy | |||||
| X | X | X | Not reported | Invasive testing (following second trimester screening) or follow‐up to birth | Routine screening | Case control | UK and Austria | ||
| X | X | Mean 35 (SD 4.6), 50% ≥ 35 | Invasive testing. Miscarriage with cytogenetic testing. Follow‐up to birth | Routine screening | Prospective cohort | USA | |||
| X | Mean 36.7 (SD 3.2) | Karyotyping or follow‐up to birth | Routine screening | Retrospective cohort | USA | ||||
| X | X | Mean 29, 10.8% ≥ 35 | Invasive testing (in cases of increased risk) or follow‐up to birth | Referrals for screening | Prospective cohort | Denmark | |||
| X | Median 34.9 (15‐48) | Karyotyping or follow‐up to birth | Routine screening | Cohort | Netherlands | ||||
| X | Median 35.2 (16‐52) | Karyotyping or follow‐up to birth | Routine screening | Cohort | UK | ||||
| X | Median 31.9 (IQR 27.7‐35.8) | Karyotyping or follow‐up to birth | Routine screening | Cohort | UK, Denmark and Cyprus | ||||
| X | Median 33 (14‐48) | Amniocentesis, CVS or follow‐up to birth | Routine screening | Prospective cohort | Italy |
*The study provided data for the subset of women with maternal age of 35 or more.
X indicates that the test was evaluated in the study.
CVS = chorionic villus sampling; IQR = interquartile range; SD = standard deviation.
| Correction made for missing false negatives in studies with delayed verification of test negatives | NT | NT and maternal age | NT, PAPP‐A, free ßhCG and maternal age | ||||||
| Ratio of DORs (95% CI); P value | Sensitivity at 5% FPR (95% CI) (studies) | Ratio of DORs (95% CI); P value | Sensitivity at 5% FPR (95% CI) (studies) | Ratio of DORs (95% CI); P value | Sensitivity at 5% FPR (95% CI) (studies) | ||||
| Screening (n = 9) | High risk (n = 4) | Screening (n = 46) | High risk (n = 4) | Screening (n = 66) | High risk (n =3) | ||||
| No FN correction | 0.68 (0.26, 1.77); P = 0.40 | 73 (62, 81) | 64 (45, 80) | 0.34 (0.17, 0.69); P = 0.003 | 72 (68, 76) | 47 (31, 63) | 0.41 (0.16, 1.00); P = 0.05 | 88 (86, 89) | 74 (54, 88) |
| FN increased +10% | 0.69 (0.27, 1.78); P = 0.40 | 70 (59, 79) | 62 (42, 78) | 0.40 (0.20, 0.82); P = 0.01 | 69 (64, 73) | 47 (31, 64) | 0.48 (0.19, 1.20); P = 0.11 | 86 (84, 87) | 74 (53, 88) |
| FN increased +20% | 0.74 (0.29, 1.92); P = 0.50 | 69 (57, 78) | 62 (42, 78) | 0.43 (0.21, 0.89); P = 0.02 | 67 (63, 71) | 47 (31, 64) | 0.51 (0.20, 1.28); P = 0.15 | 85 (83, 87) | 74 (54, 88) |
| FN increased +30% | 0.81 (0.31, 2.09); P = 0.63 | 67 (55, 76) | 62 (42, 78) | 0.46 (0.22, 0.97); P = 0.04 | 66 (61, 70) | 47 (30, 64) | 0.55 (0.22, 1.38); P = 0.20 | 84 (82, 86) | 74 (54, 88) |
| FN increased +40% | 0.76 (0.29, 2.02); P = 0.55 | 66 (53, 76) | 59 (39, 77) | 0.50 (0.24, 1.02); P = 0.06 | 64 (60, 68) | 47 (31, 64) | 0.59 (0.24, 1.48); P = 0.26 | 83 (81, 85) | 74 (54, 88) |
| FN increased +50% | 0.81 (0.30, 2.15): P = 0.65 | 64 (52, 75) | 59 (39, 77) | 0.52 (0.25, 1.08); P = 0.08 | 63 (58, 67) | 47 (30, 64) | 0.62 (0.25, 1.56); P = 0.31 | 82 (80, 84) | 74 (54, 88) |
DOR = diagnostic odds ratio
Delayed verification was not common in high‐risk referral studies as women tended to be offered invasive testing on the basis of the increased risk, and the corrections to the false negatives made very little or no difference to the estimates of sensitivity. However, in screening populations the correction reduced sensitivity, and consequently reduced the apparent relationship between type of population and test performance, observed through the ratio of DORs approaching one. Up to an increase of 40% in the false negatives, the difference in sensitivity between high risk and screening populations for the NT and maternal age test strategy remained statistically significant; the magnitude of the difference dropping from 25% to 17%. However, it should be noted that there were few high‐risk referral studies for each of the three tests and the results should be interpreted with caution.
In six studies (Hadlow 2005; Hafner 1998; Krantz 2000; Marchini 2010; Schielen 2006; Wapner 2003), we were able to extract data for the subset of women ≥ 35 years old (≥ 36 years for Schielen 2006). The five NT, PAPP‐A, free ßhCG and maternal age test combination studies all showed higher sensitivity and higher FPR for the ≥ 35 years subgroup compared to the < 35 years subgroup as shown on the forest plot (Figure 6) and summary ROC plot (Figure 7). We did not formally compare the two age groups in a meta‐analysis because the younger age group had very few cases, thresholds were mixed and there were few studies.

Forest plot of the NT, PAPP‐A, free ßhCG and maternal age test strategy by maternal age group (< 35 years versus ≥ 35 years).
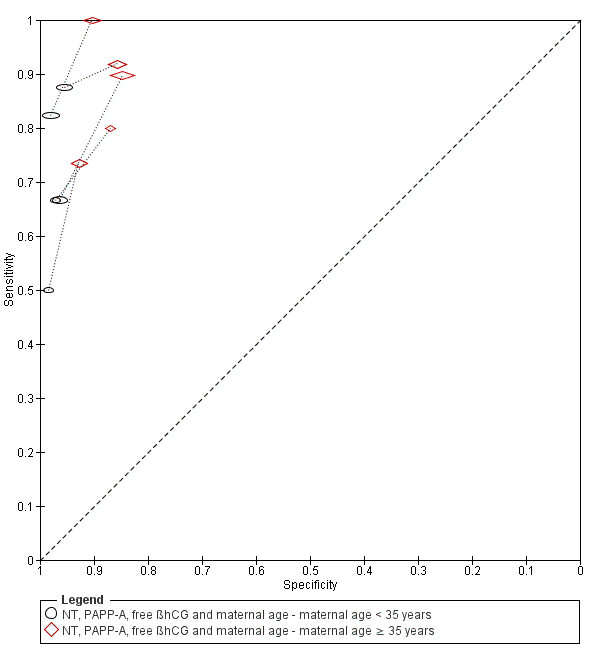
Summary ROC plot of the NT, PAPP‐A, free ßhCG and maternal age test strategy by maternal age group (< 35 years versus ≥ 35 years).
Women with multifetal pregnancies were included in six studies (Chasen 2003; Hewitt 1996; Leung 2009; Marchini 2010; Moon 2007; O'Callaghan 2000). Hewitt 1996 evaluated NT alone. Chasen 2003 and O'Callaghan 2000 evaluated the combination of NT and maternal age. Both Leung 2009 and Moon 2007 evaluated nasal bone. Leung 2009 and Marchini 2010 both evaluated the combination of NT, PAPP‐A, free βhCG and maternal age. We excluded both studies in a sensitivity analysis to determine the effect on our estimates of test accuracy, due to the potential effect of multifetal pregnancy on serum marker levels. Our findings were unchanged.
Discussion
Summary of main results
We found a large number of studies evaluating first trimester Down’s syndrome ultrasound markers with or without first trimester serum screening tests. Few studies compared two or more test strategies in the same population; the majority of studies only evaluated a single test strategy. However, the comparison between NT and the combined NT, PAPP‐A, free ßhCG test strategy, both with maternal age, was evaluated in 25 studies. Few studies were available to assess the performance of test strategies involving newer serum markers such as ADAM 12. A summary of results for the 10 most commonly evaluated test strategies is given in summary of findings Table 1, and the remaining 50 test strategies are given in summary of findings Table 2.
Four key findings were noted.
-
The combined test comprised of NT, PAPP‐A, free βhCG and maternal age appears to have significantly better test accuracy than the tests comprised of NT and maternal age with or without either PAPP‐A or free βhCG. This combined test detects around nine out of every 10 Down's affected pregnancies for a fixed 5% false positive rate (FPR). By comparison, the tests comprised of NT and maternal age and either PAPP‐A or free βhCG, and NT alone or with maternal age detects between seven and eight out of every 10 Down's affected pregnancies for a fixed 5% FPR.
-
While the test combinations that include nasal bone showed good detection rates when combined with PAPP‐A and free βhCG, the evidence was limited (three studies) and the variation in threshold precluded meta‐analysis.
-
The evidence for combining NT with higher numbers of serum markers showed similar detection rates to combinations of NT and double or triple serum markers that include PAPP‐A, but were based on data from only one or two studies. Therefore further evaluation of these tests is needed. Furthermore, there were combinations of NT and other ultrasound markers with serum markers that showed superior detection rates to combinations of NT with standard double markers commonly used in clinical practice, which may warrant further study.
-
Detection rates were lower in high‐risk pregnancies (mainly due to advanced maternal age) compared to routine screening populations. Evidence was available for three tests at a fixed 5% FPR and showed reductions in detection rates of between 5% and 25%. Part of this effect may be explained by studies in routine screening populations missing false negative cases lost through increased miscarriage in Down’s pregnancies, but this does not fully explain the effect. We were unable to draw any conclusions as to why this may be the case, especially since the analyses were based on few high‐risk referral studies. This finding also contradicts the observation we made in five studies where data were available to compare the performance of the NT, PAPP‐A, free βhCG and maternal age test strategy between women younger than 35 years and those 35 years or more within the same study. In these studies, the ≥ 35 years age group showed higher detection rates and FPRs compared to the group less than 35 years old. It should be noted that very few cases contributed to the analysis of the younger age group.
Strengths and weaknesses of the review
This review is the first comprehensive review of first trimester ultrasound and serum screening. We examined papers from around the world (32 countries), covering a wide cross‐section of women in varying populations. We contacted authors to verify data where necessary to give as complete a picture as possible while trying to avoid replication of data.
There were a number of factors that made meta‐analysis of the data difficult, which we tried to adapt for in order to allow for comparability of data presented in different studies.
-
There were many different cut‐points used to define pregnancies as high or low risk for Down's syndrome. This means that direct comparison is more difficult than if all studies used the same cut‐point to dichotomise their populations. This is less of an issue for first trimester serum screening, compared to second trimester serum screening, as the majority of authors chose a cut‐point of 5% FPR.
-
There were many different risk equations and software applications in use for combination of multiple markers, which were often not described in the papers. This means that risks may be calculated by different formulae and they may not be directly comparable for this reason. It is possible that this is responsible for unexplained heterogeneity in results.
-
Different laboratories and clinics run different assays and use different machines and methods. This may influence raw results and subsequent risk calculations. Many laboratories have a quality assessment or audit trail, however, this may not necessarily be standard across the board. For example, how many assays are run, how often medians are calculated and adjusted for a given population and how quickly samples are tested from initially being taken.
-
Few studies made direct comparisons between tests, making it difficult to detect if a real difference exists between tests (i.e. how different tests perform in the same population). There were differences in populations, with assay medians being affected, for example, by race. It is not certain whether it is appropriate to make comparisons between populations that are inherently different.
-
We were unable to perform all the investigations of heterogeneity that we had originally intended to because the data simply were not available. The vast majority of papers looking at pregnancies conceived by IVF, affected by diabetes, multiple gestation or a family history of Down's syndrome involved unaffected pregnancies only.
In addition, the search for this review was last updated in August 2011, and it is possible that new studies may have been published which have not been included. Since the search was completed we have kept a watching brief on outputs and are not aware of any studies with substantial sample sizes which could substantially affect the findings.
Applicability of findings to the review question
Potentially, when planning screening policy or a clinical screening programme, clinicians and policy makers need to make decisions about a finite number of tests or type of tests that can be offered. These policies are often driven by both the needs of a specific population and by financial resources. Economic analysis was considered to be outside of the scope of this review. Many of the tests examined as part of this review are already commercially available and in use in the clinical setting. The studies were carried out on populations of typical pregnant women and therefore, the results should be considered comparable with most pregnant populations encountered in every day clinical practice.
We were unable to extract information about harms of testing, information about miscarriage rates and uptake of definitive testing as the data were not available the majority of the time. While it is unlikely that major differences between the tests evaluated here exist in terms of direct harms of testing, as they are all based on ultrasound, with or without a blood sample, differences in accuracy may lead to differences in the use of definitive testing and its consequent adverse outcomes.
In some countries with a defined screening policy (i.e. the UK), first trimester serum screening plays a major role, usually in combination with first trimester ultrasound scanning. In others however, there may only be a limited range of tests or markers available—often second trimester markers, rather than first trimester markers. The results of this review should be interpreted and applied in the context of test availability and local restrictions, populations or policies.
Methodological quality graph: review authors' judgements about each methodological quality item presented as percentages across all included studies.
Study estimates of sensitivity and specificity with a summary ROC curve for the NT, PAPP‐A, free ßhCG and maternal age test combination at different cut‐points. Each symbol represents a pair of sensitivity and specificity at one cut‐point from each study.
Study estimates of sensitivity and specificity with a summary ROC curve for NT and maternal age across different cut‐points. Each symbol represents a pair of sensitivity and specificity at one cut‐point from each study.
Study estimates of sensitivity and specificity with a summary ROC curve for NT. Each symbol represents a pair of sensitivity and specificity at one cut‐point from each study.
Detection rates (% sensitivity) at a 5% false positive rate for nine of the most evaluated first trimester ultrasound markers alone or in combination with first trimester serum tests. A = NT, PAPP‐A, free ßhCG and maternal age; B = NT, PAPP‐A, free ßhCG, ADAM 12 and maternal age; C = NT, PAPP‐A and maternal age; D = NT, nasal bone and maternal age; E= NT, free ßhCG and maternal age; F= NT and maternal age; G = NT; H = Nasal bone and maternal age; and I = Ductus and maternal age.
Each square represents the summary sensitivity for a test strategy at a 5% false positive rate. The size of each square is proportional to the number of Down's cases. The estimates are shown with 95% confidence intervals. The test strategies are ordered on the plot according to decreasing detection rate. For each test strategy, the number of included studies, Down's syndrome cases and pregnancies are shown on the horizontal axis.
Forest plot of the NT, PAPP‐A, free ßhCG and maternal age test strategy by maternal age group (< 35 years versus ≥ 35 years).
Summary ROC plot of the NT, PAPP‐A, free ßhCG and maternal age test strategy by maternal age group (< 35 years versus ≥ 35 years).

Aberrant right subclavian artery.
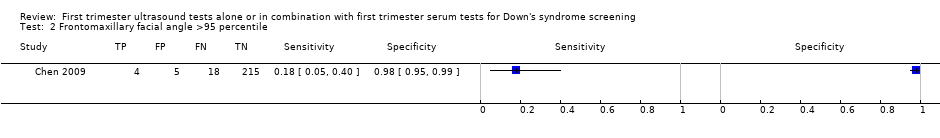
Frontomaxillary facial angle >95 percentile.
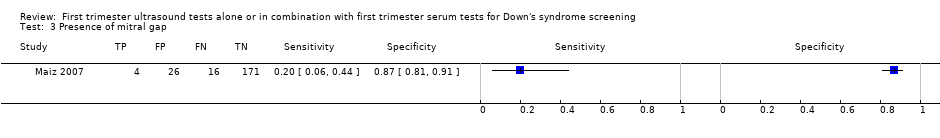
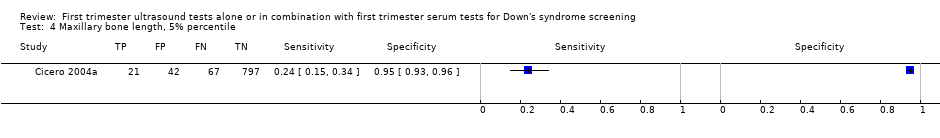
Maxillary bone length, 5% percentile.


Ductus venosus a‐wave reversed.
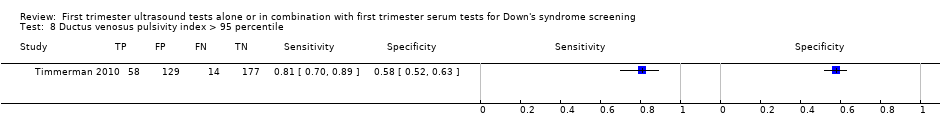
Ductus venosus pulsivity index > 95 percentile.
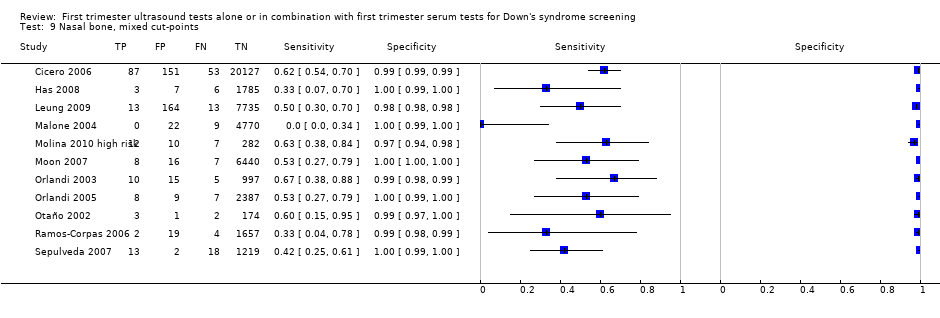
Nasal bone, mixed cut‐points.
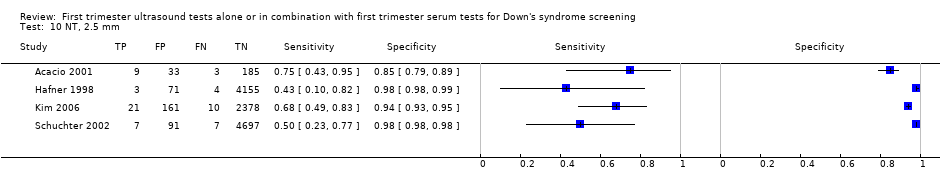

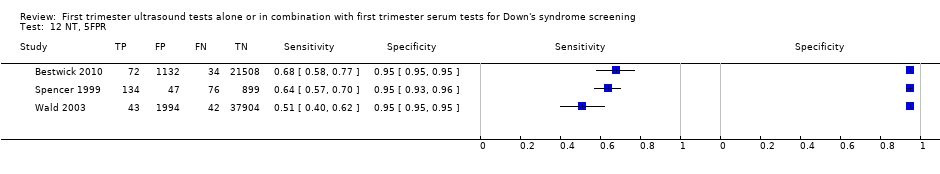


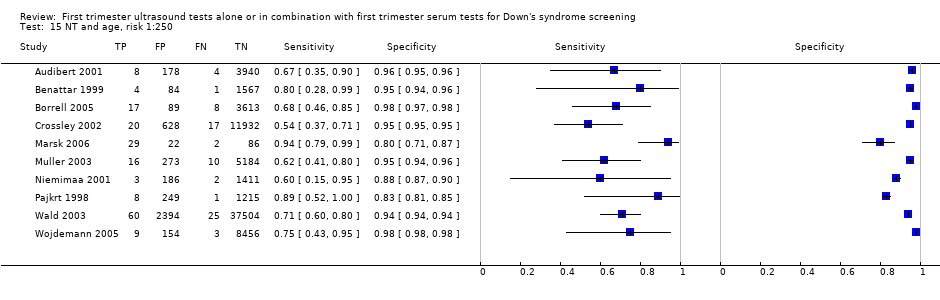
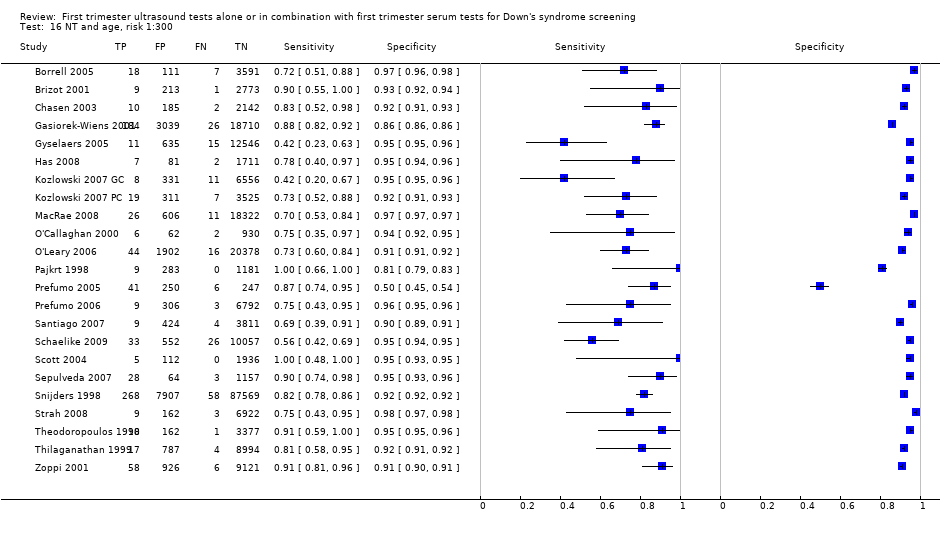

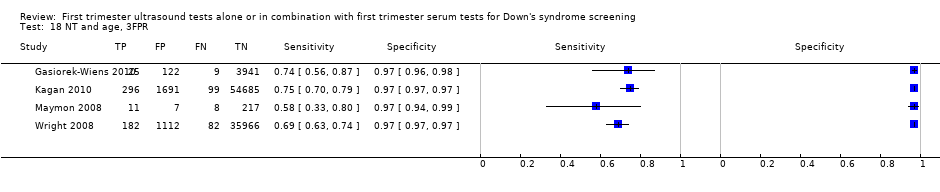
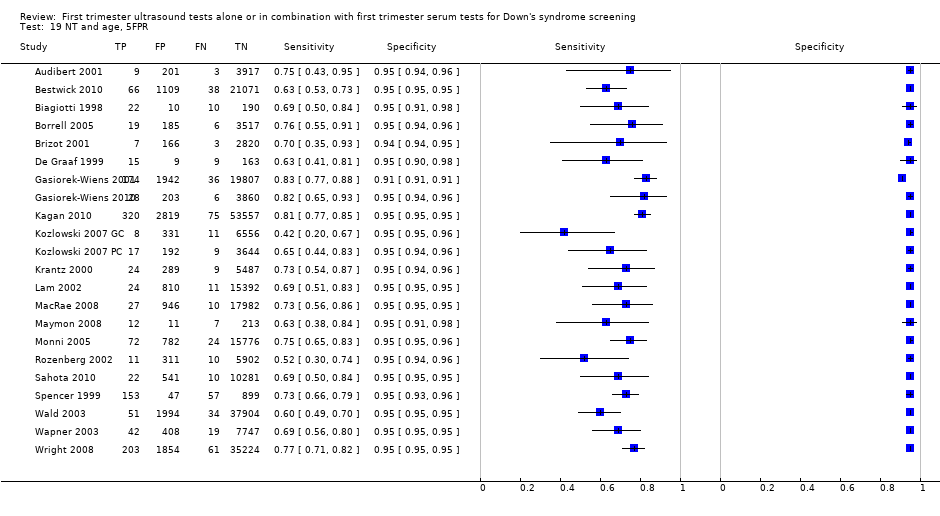
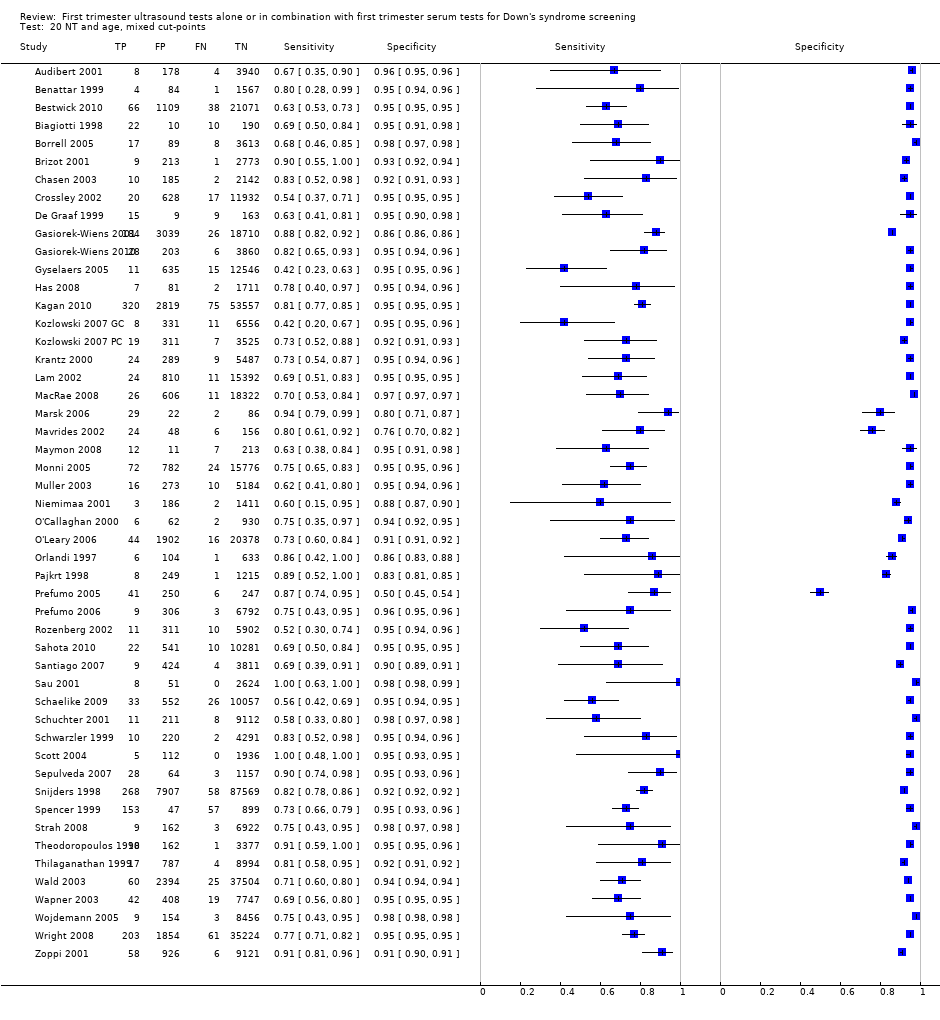
NT and age, mixed cut‐points.

NT and nasal bone, Absent NB + NT ≥ 95th centile.
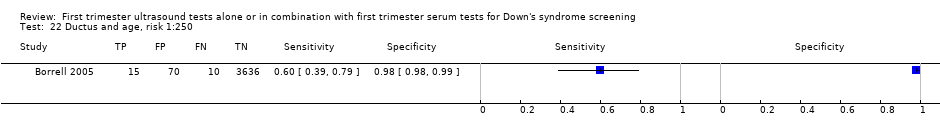
Ductus and age, risk 1:250.


Ductus and age, mixed cut‐points.

Ductus, NT and age, risk 1:100.
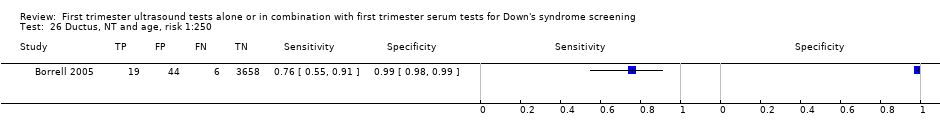
Ductus, NT and age, risk 1:250.


Ductus, NT and age, mixed cut‐points.

Age and nasal bone, mixed cut‐points.
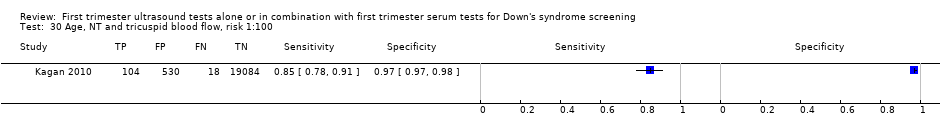
Age, NT and tricuspid blood flow, risk 1:100.
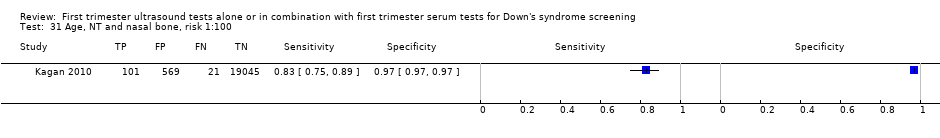
Age, NT and nasal bone, risk 1:100.

Age, NT and nasal bone, risk 1:300.

Age, NT and nasal bone, mixed cut‐points.

Age, NT, nasal bone and ductus, risk NT>1:300 AND abnormal DV flow AND absent NB.

Age, NT, nasal bone, free ßhCG and PAPP‐A, 1st trimester, 5FPR.

Age, NT, nasal bone, free ßhCG and PAPP‐A, 1st trimester, mixed cut‐points.
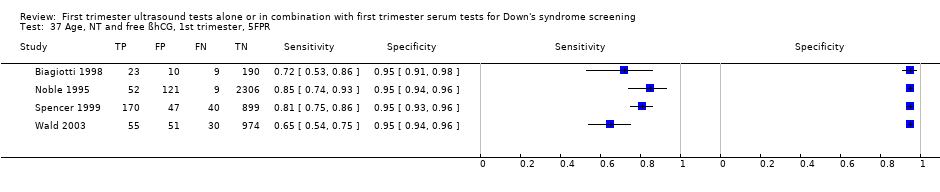
Age, NT and free ßhCG, 1st trimester, 5FPR.
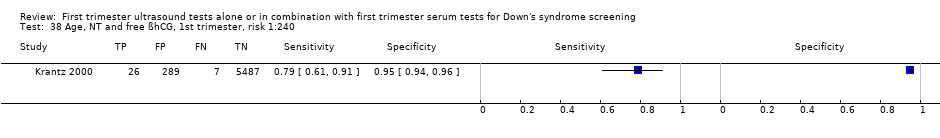
Age, NT and free ßhCG, 1st trimester, risk 1:240.

Age, NT and free ßhCG, 1st trimester, mixed cut‐points.

Age, NT and PAPP‐A, 1st trimester, risk 1:100.
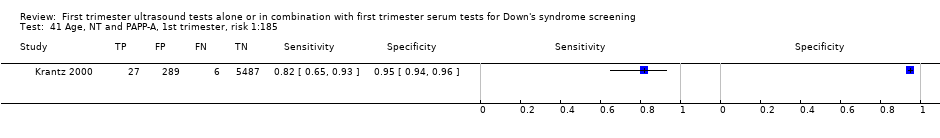
Age, NT and PAPP‐A, 1st trimester, risk 1:185.

Age, NT and PAPP‐A, 1st trimester, 5FPR.

Age, NT and PAPP‐A, 1st trimester, mixed cut‐points.

Age, NT and total hCG, 1st trimester, 5FPR.
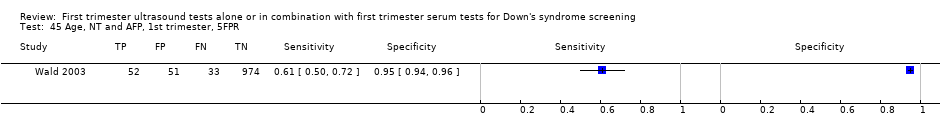
Age, NT and AFP, 1st trimester, 5FPR.

Age, NT and ITA, 1st trimester, 5FPR.

Age, NT and inhibin, 1st trimester, risk 1:100.

Age, NT and inhibin, 1st trimester, risk 1:250.

Age, NT and inhibin, 1st trimester, risk 1:400.
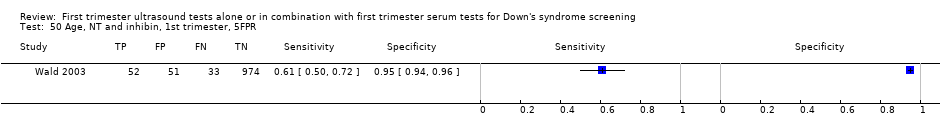
Age, NT and inhibin, 1st trimester, 5FPR.
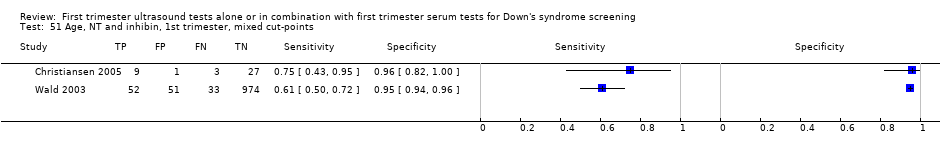
Age, NT and inhibin, 1st trimester, mixed cut‐points.

Age, NT, PAPP‐A and free ßhCG, 1st trimester, risk 1:100.
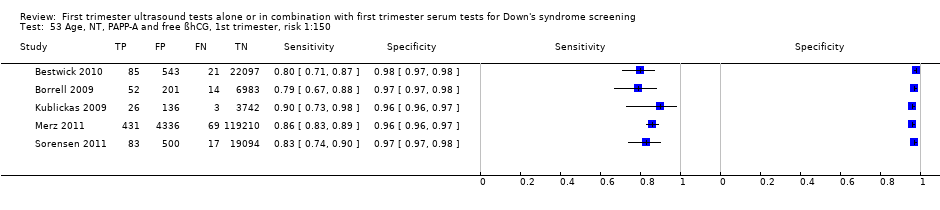
Age, NT, PAPP‐A and free ßhCG, 1st trimester, risk 1:150.

Age, NT, PAPP‐A and free ßhCG, 1st trimester, risk 1:200.
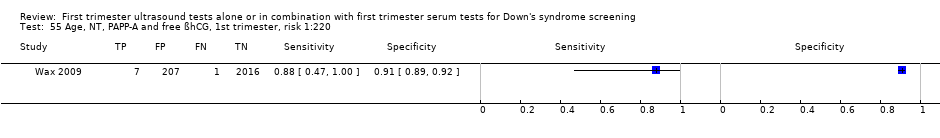
Age, NT, PAPP‐A and free ßhCG, 1st trimester, risk 1:220.

Age, NT, PAPP‐A and free ßhCG, 1st trimester, risk 1:250.

Age, NT, PAPP‐A and free ßhCG, 1st trimester, risk 1:300.
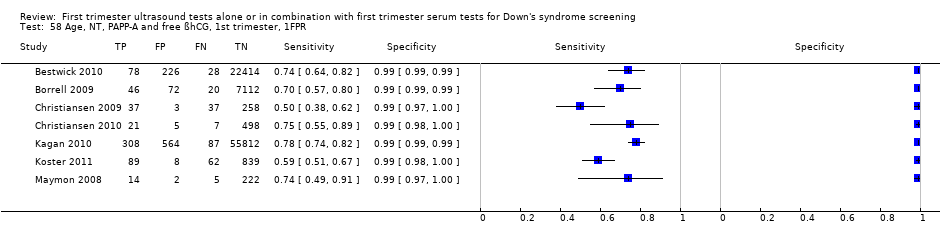
Age, NT, PAPP‐A and free ßhCG, 1st trimester, 1FPR.

Age, NT, PAPP‐A and free ßhCG, 1st trimester, 3FPR.
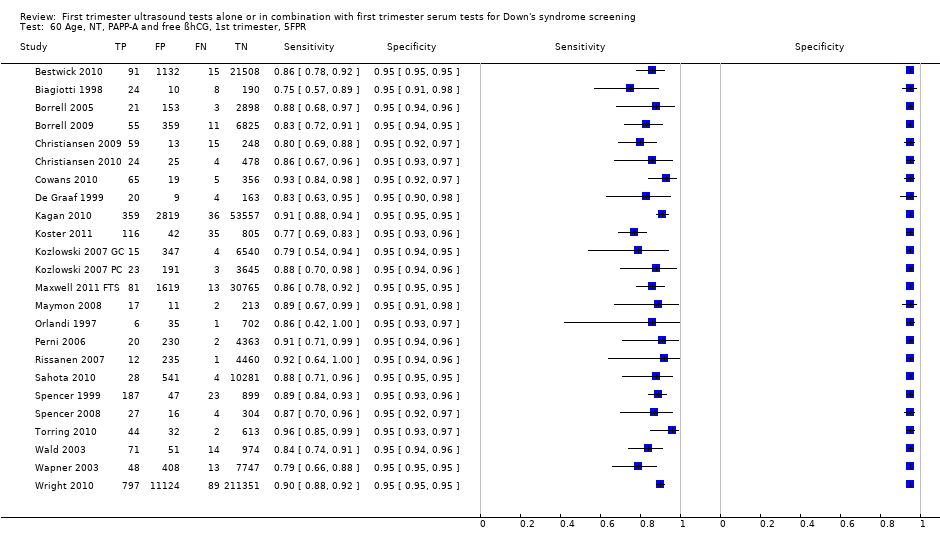
Age, NT, PAPP‐A and free ßhCG, 1st trimester, 5FPR.

Age, NT, PAPP‐A and free ßhCG, 1st trimester, mixed cut‐points.
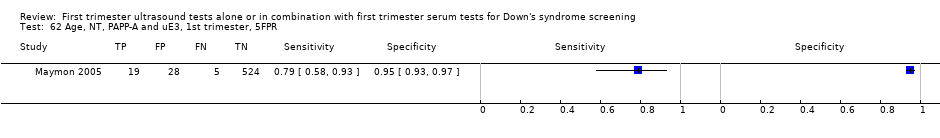
Age, NT, PAPP‐A and uE3, 1st trimester, 5FPR.
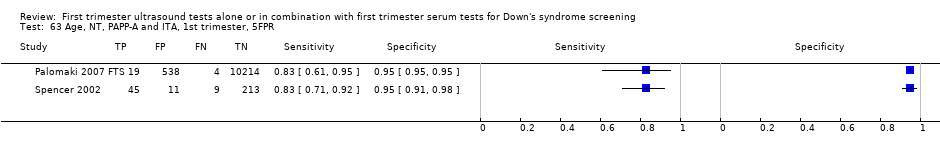
Age, NT, PAPP‐A and ITA, 1st trimester, 5FPR.

Age, NT, PAPP‐A and inhibin, 1st trimester, risk 1:100.
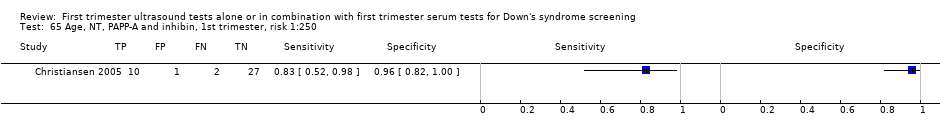
Age, NT, PAPP‐A and inhibin, 1st trimester, risk 1:250.

Age, NT, PAPP‐A and inhibin, 1st trimester, risk 1:400.

Age, NT, PAPP‐A and inhibin, 1st trimester, 5FPR.

Age, NT, PAPP‐A and inhibin, 1st trimester, mixed cut‐points.
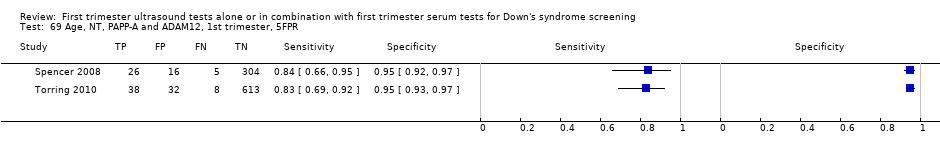
Age, NT, PAPP‐A and ADAM12, 1st trimester, 5FPR.

Age, NT, PAPP‐A and ADAM12, 1st trimester, risk 1:250.

Age, NT, free ßhCG and ADAM12, 1st trimester, 5FPR.

Age, NT, AFP and free ßhCG, 1st trimester, risk 1:250.
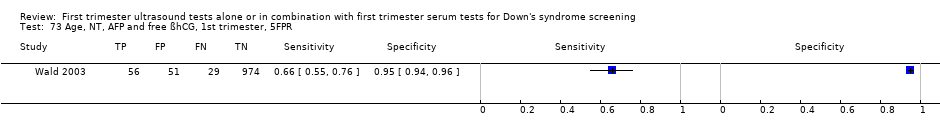
Age, NT, AFP and free ßhCG, 1st trimester, 5FPR.

Age, NT, AFP and free ßhCG, 1st trimester, mixed cut‐points.

Age, NT, AFP and PAPP‐A, 1st trimester, 5FPR.
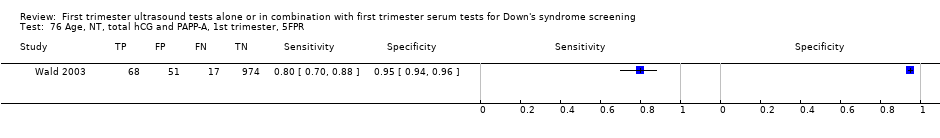
Age, NT, total hCG and PAPP‐A, 1st trimester, 5FPR.

Age, NT, total hCG and inhibin, 1st trimester, 5FPR.

Age, NT, free ßhCG and inhibin, 1st trimester, 5FPR.
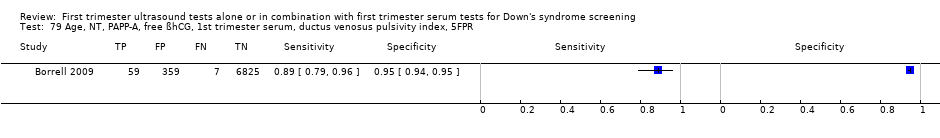
Age, NT, PAPP‐A, free ßhCG, 1st trimester serum, ductus venosus pulsivity index, 5FPR.

Age, free ßhCG and PAPP‐A, if risk 1:42‐1:1000, NT, final 1:250 risk.

Age, NT, ductus, free ßhCG and PAPP‐A, 1st trimester, risk 1:100.

Age, NT, ductus, free ßhCG and PAPP‐A, 1st trimester, risk 1:250.

Age, NT, ductus, free ßhCG and PAPP‐A, 1st trimester, 5FPR.

Age, NT, ductus, free ßhCG and PAPP‐A, 1st trimester, mixed cut‐points.
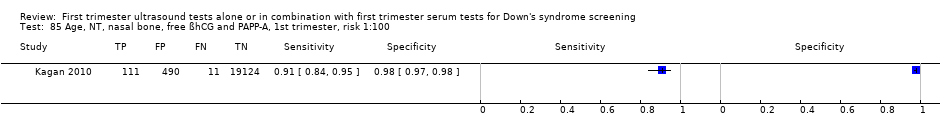
Age, NT, nasal bone, free ßhCG and PAPP‐A, 1st trimester, risk 1:100.

Age, NT, nasal bone, free ßhCG and PAPP‐A, 1st trimester, risk 1:300.

Age, NT, tricuspid blood flow, free ßhCG and PAPP‐A, 1st trimester, risk 1:100.

Age, NT, fetal heart rate, free ßhCG and PAPP‐A, 1st trimester, 5FPR.

Age, NT, fetal heart rate, nasal bone, free ßhCG and PAPP‐A, 1st trimester, risk 1:200.

age, NT, fetal heart rate, ductus, free ßhCG and PAPP‐A, 1st trimester, 5FPR.

Age, NT, fetal heart rate, tricuspid blood flow, free ßhCG and PAPP‐A,1st trimester, 5FPR.

Age, NT, AFP, free ßhCG and PAPP‐A, 1st trimester, risk 1:250.
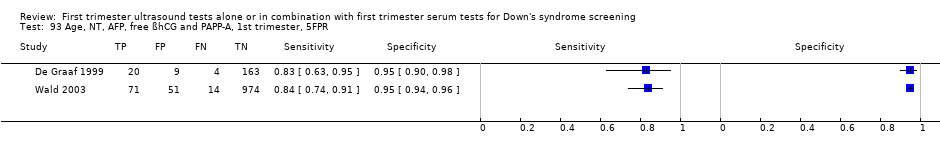
Age, NT, AFP, free ßhCG and PAPP‐A, 1st trimester, 5FPR.

Age, NT, AFP, free ßhCG and PAPP‐A, 1st trimester, mixed cut‐points.

Age, NT, total hCG, inhibin and PAPP‐A, 1st trimester, 5FPR.

Age, NT, PAPP‐A, free ßhCG and PGH, 1st trimester, 5FPR.

Age, NT, PAPP‐A, free ßhCG and GHBP, 1st trimester, 5FPR.

Age, NT, PAPP‐A, free ßhCG and PIGF, 1st trimester, 5FPR.
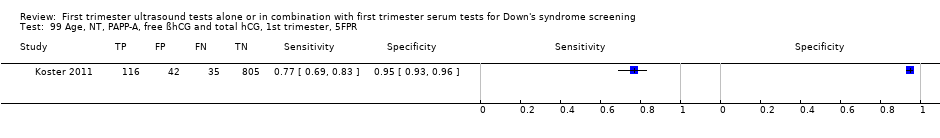
Age, NT, PAPP‐A, free ßhCG and total hCG, 1st trimester, 5FPR.

Age, NT, PAPP‐A, free ßhCG and PP13, 1st trimester, 5FPR.

Age, NT, PAPP‐A, free ßhCG and ADAM12, 1st trimester, 5FPR.
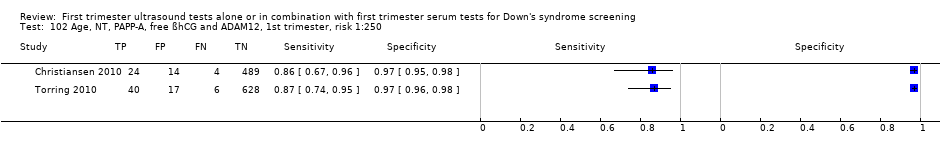
Age, NT, PAPP‐A, free ßhCG and ADAM12, 1st trimester, risk 1:250.
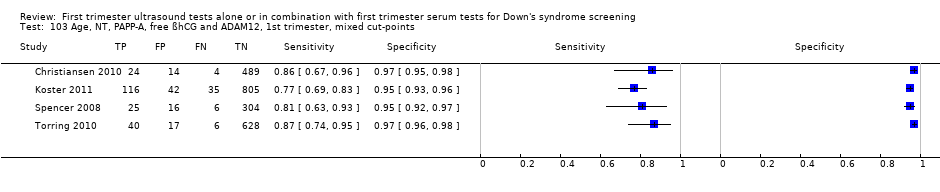
Age, NT, PAPP‐A, free ßhCG and ADAM12, 1st trimester, mixed cut‐points.
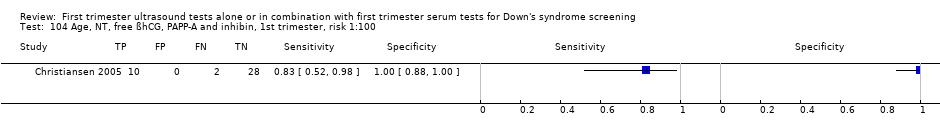
Age, NT, free ßhCG, PAPP‐A and inhibin, 1st trimester, risk 1:100.

Age, NT, free ßhCG, PAPP‐A and inhibin, 1st trimester, risk 1:250.
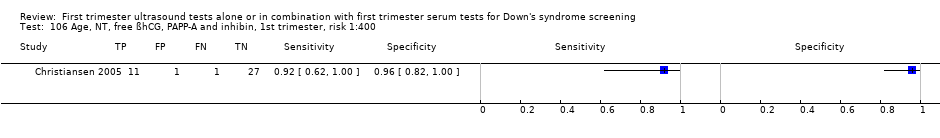
Age, NT, free ßhCG, PAPP‐A and inhibin, 1st trimester, risk 1:400.
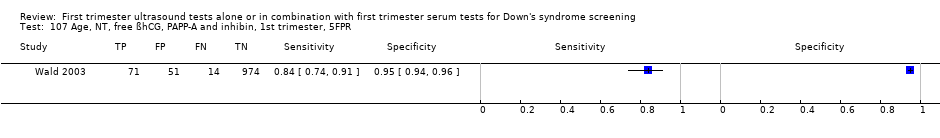
Age, NT, free ßhCG, PAPP‐A and inhibin, 1st trimester, 5FPR.

Age, NT, PAPP‐A, free ßhCG, ADAM12 and PlGH, 1st trimester, 5FPR.

Age, NT, total hCG, inhibin, PAPP‐A, AFP and uE3, 1st trimester, 5FPR.

Age, NT, free ßhCG, inhibin, PAPP‐A, AFP and uE3,1st trimester, 5FPR.

Age, NT, PAPP‐A, free ßhCG, ADAM12, total hCG and PlGF, 1st trimester, 5FPR.

Age, NT, PAPP‐A, free ßhCG, ADAM12, total hCG, PlGF and PP13, 1st trimester, 5FPR.
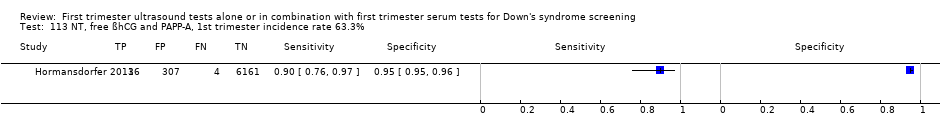
NT, free ßhCG and PAPP‐A, 1st trimester incidence rate 63.3%.
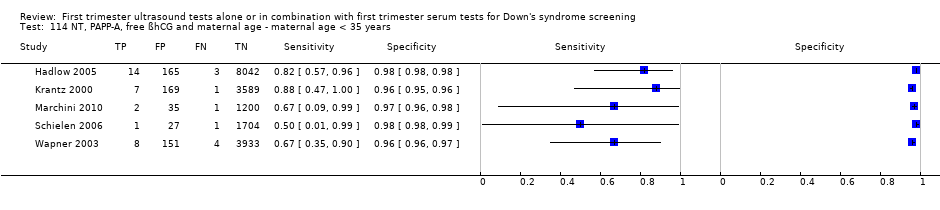
NT, PAPP‐A, free ßhCG and maternal age ‐ maternal age < 35 years.

NT, PAPP‐A, free ßhCG and maternal age ‐ maternal age ≥ 35 years.
| Review question | What is the accuracy of ultrasound based markers alone and in combination with maternal age and/or first trimester serum markers for screening for Down's syndrome? | |||||
| Population | Pregnant women at less than 14 weeks' gestation confirmed by ultrasound, who had not undergone previous testing for Down’s syndrome. Some studies were undertaken in women identified to be at high risk based on maternal age. | |||||
| Settings | All settings. | |||||
| Numbers of studies, pregnancies and Down's syndrome cases | 126 studies (reported in 152 publications) involving 1,604,040 fetuses of which 8454 were Down's syndrome cases | |||||
| Index tests | Risk scores computed using maternal age and first trimester ultrasound and serum markers for ultrasound markers ‐ NT, nasal bone, ductus venosus Doppler, maxillary bone length, fetal heart rate, aberrant right subclavian artery, frontomaxillary facial angle, presence of mitral gap, tricuspid regurgitation, tricuspid blood flow and iliac angle 90 degrees ‐ and serum markers ‐ inhibin A, AFP, free ßhCG, total hCG, PAPP‐A, uE3, ADAM 12, PlGF, PGH, ITA (h‐hCG), GHBP and PP13. | |||||
| Reference standards | Chromosomal verification (amniocentesis and CVS undertaken during pregnancy, and postnatal karyotyping) and postnatal macroscopic inspection. | |||||
| Study limitations | 116 studies only used selective chromosomal verification during pregnancy, and were at risk of under‐ascertainment of Down's syndrome cases due to pregnancy loss between administering the serum test and the reference standard. | |||||
| Test strategy | Studies | Women (Down's cases) | Sensitivity (95% CI) | Specificity (95% CI)* | Consequences in a hypothetical cohort of 10,000 pregnant women assuming Down’s syndrome affects approximately one in 800 live‐born babies | |
| Missed cases | False positives | |||||
| Nasal bone | 11 | 48,279 (290) | 49 (34, 64) | 99 (99, 100) | 7 | 100 |
| NT | 13 | 90,978 (593) | 70 (61, 78) | 95 | 4 | 500 |
| NT and maternal age | 50 | 530,874 (2701) | 71 (66, 75) | 95 | 4 | 500 |
| Nasal bone and maternal age | 4 | 25,303 (165) | 68 (28, 92) | 95 | 4 | 500 |
| Ductus and maternal age | 5 | 5331 (165) | 68 (49, 83) | 95 | 4 | 500 |
| NT, nasal bone and maternal age | 5 | 29,699 (221) | 78 (55, 91) | 95 | 3 | 500 |
| NT, free ßhCG and maternal age | 5 | 10,795 (421) | 77 (72, 82) | 95 | 3 | 500 |
| NT, PAPP‐A and maternal age | 5 | 9814 (372) | 81 (75, 86) | 95 | 3 | 500 |
| NT, PAPP‐A, free ßhCG and maternal age | 69 | 1,173,853 (6010) | 87 (86, 89) | 95 | 2 | 500 |
| NT, PAPP‐A, free ßhCG, ADAM 12 and maternal age | 4 | 2571 (256) | 82 (75, 87) | 95 | 3 | 500 |
| *We estimated sensitivity (with a 95% confidence interval) at a 5% false positive rate from the summary ROC curve obtained for each test except nasal bone. For nasal bone, the pooled specificity is reported because the cut‐point was absence or presence of nasal bone, and all studies reported false positive rates below 5% so estimation of sensitivity at a fixed 5% FPR was not appropriate. | ||||||
| Test strategy | Studies | Women (Down's cases) | Sensitivity* (95% CI) | Specificity* (95% CI) | Threshold |
| Without maternal age | |||||
| Ultrasound markers alone | |||||
| Aberrant right subclavian artery | 1 | 425 (51) | 8 (2, 19) | 99 (98, 100) | Feature |
| Frontomaxillary facial angle | 1 | 242 (22) | 18 (5, 40) | 98 (95, 99) | > 95th percentile |
| Presence of mitral gap | 1 | 217 (20) | 20 (6, 44) | 87 (81, 91) | Feature |
| Maxillary bone length | 1 | 927 (88) | 24 (15, 34) | 95 (93, 96) | 5th centile |
| Tricuspid regurgitation | 1 | 312 (20) | 50 (27, 73) | 98 (96, 99) | Feature |
| Iliac angle 90 degrees | 1 | 2032 (52) | 60 (45, 73) | 98 (97, 98) | Feature |
| Ductus venosus a‐wave reversed | 1 | 378 (72) | 68 (56, 79) | 70 (64, 75) | Feature |
| Ductus venosus pulsivity index | 1 | 378 (72) | 81 (70, 89) | 58 (52, 63) | > 95th percentile |
| NT and nasal bone | 1 | 486 (38) | 89 (75, 97) | 93 (91, 95) | Absent nasal bone and NT ≥ 95th centile |
| Ultrasound and double serum markers | |||||
| NT, free ßhCG and PAPP‐A | 1 | 6508 (40) | 90 (76, 97) | 95 (95, 96) | First trimester incidence rate 63.3% |
| With maternal age | |||||
| Ultrasound markers alone | |||||
| NT‐adjusted risk > 1:300 and abnormal ductus venosus flow and absent nasal bones | 1 | 544 (47) | 21 (11, 36) | 100 (99, 100) | 1:300 risk |
| NT and ductus | 3 | 23,697 (177) | 76 to 93 | 73 to 99 | 5% FPR, 1:250 risk, feature |
| NT and tricuspid blood flow | 1 | 19,736 (122) | 85 (78, 91) | 97 (97, 98) | 1:100 risk |
| Ultrasound and single serum markers | |||||
| NT and inhibin A | 2 | 1150 (97) | 61 to 75 | 95 to 96 | 5% FPR, 1:250 risk |
| NT and AFP | 1 | 1110 (85) | 61 (50, 72) | 95 (94, 96) | 5% FPR |
| NT and total hCG | 1 | 1110 (85) | 61 (50, 72) | 95 (94, 96) | 5% FPR |
| NT and ITA | 1 | 278 (54) | 80 (66, 89) | 95 (91, 98) | 5% FPR |
| Ultrasound and double serum markers | |||||
| NT, AFP and free ßhCG | 2 | 2766 (90) | 66 to 100 | 93 to 95 | 5% FPR, 1:250 risk |
| NT, PAPP‐A and inhibin A | 2 | 1150 (97) | 80 to 83 | 95 to 96 | 5% FPR, 1:250 risk |
| NT, total hCG and inhibin A | 1 | 1110 (85) | 62 (51, 73) | 95 (94, 96) | 5% FPR |
| NT, free ßhCG and inhibin A | 1 | 1110 (85) | 66 (55, 76) | 95 (94, 96) | 5% FPR |
| NT, free ßhCG and ADAM 12 | 1 | 351 (31) | 68 (49, 83) | 95 (92, 97) | 5% FPR |
| NT, PAPP‐A and uE3 | 1 | 576 (24) | 79 (58, 93) | 95 (93, 97) | 5% FPR |
| NT, total hCG and PAPP‐A | 1 | 1110 (85) | 80 (70, 88) | 95 (94, 96) | 5% FPR |
| NT, AFP and PAPP‐A | 1 | 1110 (85) | 80 (70, 88) | 95 (94, 96) | 5% FPR |
| NT, PAPP‐A and ITA | 2 | 11,053 (77) | 83 (73, 90) | 95 | 5% FPR |
| NT, PAPP‐A and ADAM 12 | 2 | 1042 (77) | 83 (73, 90) | 95 | 5% FPR |
| Free ßhCG and PAPP‐A, if risk between 1:42 and 1:1000 (intermediate risk), NToffered, final composite risk !:250 | 1 | 10,189 (44) | 89 (75, 96) | 94 (94, 95) | 1:250 risk |
| NT, ductus, free ßhCG and PAPP‐A | 3 | 30,061 (212) | 83 to 96 | 97 to 99 | 1:100 risk, 1:250 risk |
| NT, nasal bone, free ßhCG and PAPP‐A | 3 | 41,842 (271) | 89 to 94 | 95 to 98 | 5% FPR, 1:100 risk, 1:300 risk |
| NT, PAPP‐A, free ßhCG and ductus venosus pulsivity index | 1 | 7,250 (66) | 89 (79, 96) | 95 (94, 95) | 5% FPR |
| NT, tricuspid blood flow, free ßhCG and PAPP‐A | 1 | 19,736 (122) | 91 (84, 95) | 97 (97, 98) | 1:100 risk |
| NT, fetal heart rate, free ßhCG and PAPP‐A | 2 | 76,385 (517) | 92 (89, 94) | 95 | 5% FPR |
| NT, fetal heart rate, nasal bone, free ßhCG and PAPP‐A | 1 | 19,736 (122) | 95 (90, 98) | 96 (95, 96) | 1:200 risk |
| NT, fetal heart rate, tricuspid blood flow, free ßhCG and PAPP‐A | 1 | 19,736 (122) | 96 (91, 99) | 95 (95, 95) | 5% FPR |
| NT, fetal heart rate, ductus, free ßhCG and PAPP‐A | 1 | 19,614 (122) | 97 (92, 99) | 95 (95, 95) | 5% FPR |
| Ultrasound and triple serum markers | |||||
| NT, AFP, free ßhCG and PAPP‐A | 3 | 6789 (135) | 73 to 84 | 95 | 5% FPR, 1:250 risk |
| NT, PAPP‐A, free ßhCG and PP13 | 1 | 998 (151) | 77 (69, 83) | 95 (93, 96) | 5% FPR |
| NT, PAPP‐A, free ßhCG and total hCG | 1 | 998 (151) | 77 (69, 83) | 95 (93, 96) | 5% FPR |
| NT, total hCG, inhibin A and PAPP‐A | 1 | 1110 (85) | 81 (71, 89) | 95 (94, 96) | 5% FPR |
| NT, free ßhCG, inhibin A and PAPP‐A | 1 | 1110 (85) | 84 (74, 91) | 95 (94, 96) | 5% FPR |
| NT, PAPP‐A, free ßhCG and PGH | 1 | 335 (74) | 86 (77, 93) | 95 (92, 97) | 5% FPR |
| NT, PAPP‐A, free ßhCG and PIGF | 2 | 1443 (221) | 88 (70, 95) | 95 | 5% FPR |
| NT, PAPP‐A, free ßhCG and GHBP | 1 | 335 (74) | 91 (81, 96) | 95 (92, 97) | 5% FPR |
| Ultrasound and quadruple serum markers | |||||
| NT, PAPP‐A, free ßhCG, ADAM 12 and PlGF | 1 | 998 (151) | 79 (72, 86) | 95 (93, 96) | 5% FPR |
| Ultrasound and quintuple serum markers | |||||
| NT, PAPP‐A, free ßhCG, ADAM 12, total hCG and PlGF | 1 | 998 (151) | 79 (72, 86) | 95 (93, 96) | 5% FPR |
| NT, total hCG, inhibin A, PAPP‐A, AFP and uE3 | 1 | 1110 (85) | 84 (74, 91) | 95 (94, 96) | 5% FPR |
| NT, free ßhCG, inhibin A, PAPP‐A, AFP and uE3 | 1 | 1110 (85) | 86 (77, 92) | 95 (94, 96) | 5% FPR |
| Ultrasound and sextuple serum markers | |||||
| NT, PAPP‐A, free ßhCG, ADAM 12, total hCG, PlGF and PP13 | 1 | 998 (151) | 80 (73, 86) | 95 (93, 96) | 5% FPR |
| *Tests evaluated by at least one study are presented in the table. Where there were two studies at the same threshold, estimates of summary sensitivity and summary specificity were obtained by using univariate fixed‐effect logistic regression models to pool sensitivities and specificities separately. If the threshold used was a 5% FPR, then only the sensitivities were pooled. The range of sensitivities and specificities are presented where meta‐analysis was not performed because there were only two or three studies and no common threshold. | |||||
| Ratio of DORs (95% CI); P value (Studies) | Nasal bone | NT | Nasal bone and age | Ductus and age | NT and age | NT, nasal bone and age | NT, free ßhCG and age | NT, PAPP‐A and age | NT, PAPP‐A, free ßhCG and age |
| NT | – | ||||||||
| Nasal bone and age | – | – | |||||||
| Ductus and age | 1.19 (0.12, 11.4); P = 0.84 (K = 1) | – | 0.85 (0.21, 3.41); P = 0.76 (K = 1) | ||||||
| NT and age | 0.62 (0.13, 2.93); P = 0.50 (K = 2) | 1.25 (0.90, 1.74); P = 0.17 (K = 3) | 0.84 (0.48, 1.49); P = 0.52 (K = 3) | 1.07 (0.51, 2.23); P = 0.85 (K = 3) | |||||
| NT, nasal bone and age | 0.61 (0.12, 3.10); P = 0.50 (K = 2) | – | 4.01 (1.51, 10.6); P = 0.01 (K = 2) | 0.95 (0.23, 3.97); P = 0.93 (K = 1) | 1.05 (0.70, 1.56); P = 0.82 (K = 5) | ||||
| NT, free ßhCG and age | – | 2.15 (1.33, 3.50); P = 0.007 (K = 2) | – | – | 1.47 (1.00, 2.15); P = 0.05 (K = 4) | – | |||
| NT, PAPP‐A and age | – | 2.86 (1.73, 4.73); P = 0.001 (K = 2) | – | – | 1.88 (1.27, 2.78); P = 0.004 (K = 4) | – | 1.28 (0.84, 1.93); P = 0.23 (K = 4) | ||
| NT, PAPP‐A, free ßhCG and age | 3.83 (0.89, 16.4); P = 0.07 (K = 2) | 4.35 (2.00, 9.46); P = 0.015 (K = 4) | – | 3.00 (0.42, 21.2); P = 0.19 (K = 1) | 3.19 (2.19, 4.66); P < 0.0001 (K = 25) | 1.23 (0.63, 2.40); P = 0.50 (K = 2) | 2.06 (1.31, 3.22); P = 0.004 (K = 4) | 1.61 (1.02, 2.55); P = 0.043 (K = 4) | |
| NT, PAPP‐A, free ßhCG, ADAM 12 and age | – | – | – | – | – | – | – | – | 0.87 (0.49, 1.52); P = 0.60 (K = 4) |
| – Indicates pairs of tests where there were no head‐to head comparisons of the two tests in a study. Direct comparisons were made using only data from studies that compared each pair of tests in the same population. Ratio of diagnostic odds ratios (DORs) were computed by division of the DOR for the test in the row by the DOR for the test in the column. If the ratio of DORs is greater than one, then the diagnostic accuracy of the test in the row is higher than that of the test in the column; if the ratio is less than one, the diagnostic accuracy of the test in the column is higher than that of the test in the row. | |||||||||
| Ratio of DORs (95% CI); P value | Nasal bone | NT | Nasal bone and age | Ductus and age | NT and age | NT, nasal bone and age | NT, free ßhCG and age | NT, PAPP‐A and age | NT, PAPP‐A, free ßhCG and age | |
| DOR (95% CI) Studies | 132 (71, 245) K = 11 | 45 (31, 67) K = 13 | 40 (7, 224) K = 4 | 41 (18, 92) K = 5 | 46 (37, 57) K = 50 | 66 (24, 180) K = 5 | 65 (51, 84) K = 5 | 80 (59, 109) K = 5 | 133 (114, 155) K = 69 | |
| NT | 45 (31, 67) K = 13 | 0.34 (0.16, 0.71); P = 0.006 | ||||||||
| Nasal bone and age | 40 (7, 224) K = 4 | 0.31 (0.05, 1.90); P = 0.18 | 0.90 (0.16, 5.05); P = 0.89 | |||||||
| Ductus and age | 41 (18, 92) K = 5 | 0.31 (0.11, 0.87); P = 0.03 | 0.90 (0.37, 2.20); P = 0.80 | 1.00 (0.11, 9.34); P = 1.00 | ||||||
| NT and age | 46 (37, 57) K = 50 | 0.35 (0.19, 0.66); P = 0.002 | 1.02 (0.66, 1.58); P = 0.92 | 1.14 (0.23, 5.61); P = 0.87 | 1.14 (0.52, 2.49); P = 0.74 | |||||
| NT, nasal bone and age | 66 (24, 180) K = 5 | 0.50 (0.14, 1.81); P = 0.26 | 1.47 (0.47, 4.58); P = 0.48 | 1.64 (0.12, 21.5); P = 0.62 | 1.64 (0.33, 8.08); P = 0.46 | 1.43 (0.52, 3.98); P = 0.48 | ||||
| NT, free ßhCG and age | 65 (51, 84) K = 5 | 0.49 (0.25, 0.98); P = 0.04 | 1.44 (0.89, 2.34); P = 0.12 | 1.61 (0.26, 10.1); P = 0.56 | 1.61 (0.65, 3.99); P = 0.26 | 1.41 (1.02, 1.96); P = 0.04 | 0.98 (0.30, 3.19); P = 0.98 | |||
| NT, PAPP‐A and age | 80 (59, 109) K = 5 | 0.61 (0.29, 1.25); P = 0.16 | 1.77 (1.05, 3.00); P = 0.04 | 1.98 (0.30, 13.1); P = 0.42 | 1.98 (0.76, 5.15); P = 0.14 | 1.73 (1.19, 2.53); P = 0.005 | 1.21 (0.35, 4.13); P = 0.73 | 1.23 (0.74, 2.05); P = 0.35 | ||
| NT, PAPP‐A, free ßhCG and age | 133 (114, 155) K = 69 | 1.00 (0.55, 1.84); P = 1.00 | 2.93 (1.96, 4.40); P < 0.0001 | 3.27 (0.68, 15.8); P = 0.14 | 3.27 (1.53, 7.00); P = 0.003 | 2.87 (2.21, 3.72); P < 0.0001 | 2.00 (0.73, 5.45); P = 0.17 | 2.03 (1.52, 2.72) P < 0.0001 | 1.65 (1.17, 2.34) P = 0.005 | |
| NT, PAPP‐A, free ßhCG, ADAM 12 and age | 85 (58, 124) K = 4 | 0.64 (0.30, 1.37); P = 0.23 | 1.88 (1.07, 3.32); P = 0.03 | 2.10 (0.31, 14.1); P = 0.39 | 2.10 (0.78, 5.63); P = 0.12 | 1.84 (1.19, 2.84); P = 0.007 | 1.28 (0.37, 4.47); P = 0.65 | 1.30 (0.81, 2.09) P = 0.26 | 1.06 (0.61, 1.86) P = 0.81 | 0.64 (0.43, 0.96) P = 0.03 |
| Indirect comparisons were made using all available data for each pair of tests. Ratios of diagnostic odds ratios (DORs) were computed by division of the DOR for the test in the row by the DOR for the test in the column. If the ratio of DORs is greater than one, then the diagnostic accuracy of the test in the row is higher than that of the test in the column; if the ratio is less than one, the diagnostic accuracy of the test in the column is higher than that of the test in the row. | ||||||||||
| Study | NT, PAPP‐A, free ßhCG and age | Nasal bone | NT and age | NT | Maternal age (range) in years | Reference standard | Population | Study design | Study location |
| X | Mean 35.8 (21‐45) | CVS biopsy, amniocentesis or blood or placenta used for fetal karyotyping | High‐risk referral for invasive testing | Retrospective study of patient notes | South America | ||||
| X | Mean 30.1, all < 38, 86% < 35, 14% ≥ 35 | Prenatal karyotype conducted (in 7.6% of patients) depending on presence of risk > 125, high maternal age, parental anxiety, history of chromosomal defects or parental translocation or abnormal second trimester scan age | Routine screening | Prospective consecutive series | France | ||||
| X | Median 37 (19‐46) | Invasive testing offered to women with NT > 3 mm or risk > 1:250 as defined by combined NT and serum results (CVS from 11 weeks, amniocentesis from 15 weeks). Rapid in situ hybridisation test in patients with risk > 1:30. No details given of any follow‐up to birth | Women requesting screening (self‐paying service) and women attending on account of previous pregnancy history of fetal abnormality | Prospective cohort | UK | ||||
| X | Mean 34.9 for screen positives, 30.5 for screen negatives | Karyotyping or follow‐up to birth | Routine screening | Cohort | Australia | ||||
| Mean 36.4 (15‐46) for Down's cases, 29.8 (15‐49) for unaffected pregnancies | Amniocentesis or CVS (85% of women) or follow‐up to birth | High‐risk referral for invasive testing | Cohort | Budapest | |||||
| X | Mean 32 (16‐46), 8.3% > 35 | Amniocentesis due to maternal age > 38 years (6.1% or women). Karyotyping encouraged for women with positive result on one or more index test. No details of reference standard for index test negative women | Routine screening | Prospective cohort | France | ||||
| X | X | X | Median 39 for Down's cases, 34 for unaffected pregnancies | Karyotyping or follow‐up to birth | Routine screening | Retrospective cohort | UK | ||
| X | X | Unclear (maybe all ≥ 38) | Amniocentesis or CVS | High‐risk referral for invasive testing | Case control | Italy | |||
| Median 35 (17‐49) | CVS | High‐risk referral for invasive testing | Prospective cohort | UK | |||||
| X | X | Not reported | CVS (high‐risk women) or follow‐up to birth | Routine screening | Retrospective cohort | Spain | |||
| X | Mean 32 | Karyotyping or follow‐up to birth | Routine screening and high‐risk referral | Prospective cohort | Spain | ||||
| X | Median 31 (14‐47), 20% ≥ 35 | Karyotyping or follow‐up to birth | Routine screening | Retrospective cohort | Australia | ||||
| X | Median 28 (13‐46), 19.4% ≥ 35 | Antenatal karyotyping (5.9% of pregnancies: 62% of high‐risk, 29% of medium‐risk and 3% of the low‐risk women). Follow‐up to birth (85.3% of women) | Routine screening | Prospective cohort | Brazil | ||||
| X | ≥ 35 (35‐44) | Amniocentesis in women high risk on screening (16.2%). Follow‐up at birth in women who were low risk on screening | High‐risk patients undergoing routine screening | Retrospective cohort | Italy | ||||
| X | Median 33 (IQR 31‐36), 36.2% ≥ 35 | Karyotyping or follow‐up to birth in 96.1% of patients | Routine screening | Prospective consecutive cohort | USA | ||||
| Median 30 (20‐44) for Down's cases, 32 (19‐40) for controls | Karyotyping or follow‐up to birth | Routine screening | Case control | China | |||||
| X | Not reported | Karyotyping | Screening programmes for syphilis and Down's syndrome | Case control | Denmark | ||||
| X | Median 37.5 for Down's cases, 36.4 for controls | Karyotyping or follow‐up to birth | Routine screening | Case control | Denmark | ||||
| X | Median 36 (25‐44) for Down's cases, 29 (17‐45) for controls | Karyotyping or follow‐up to birth | Routine screening | Case control | Denmark | ||||
| Median 37 (16‐48) | CVS | High‐risk referral for invasive testing | Prospective cohort | USA | |||||
| X | Median 35 (18‐50) | CVS or amniocentesis (in high risk women) or follow‐up to birth | Routine screening | Prospective cohort | UK | ||||
| Cocciolone 2008 (first trimester screening cohort) | X | Median 31.3 | Karyotyping or follow‐up to birth | Routine screening | Cohort | Australia | |||
| X | Mean 38 (16‐49) for Down's cases, 29 (13‐56) for unaffected pregnancies | Karyotyping or follow‐up to birth | Routine screening | Cohort | UK | ||||
| X | Mean 37.0 (IQR 32.9‐40.5) for Down's cases, 32.4 (IQR 29.0‐35.9) for controls | Karyotyping or follow‐up to birth | Routine screening | Case control | UK | ||||
| X | X | Median 29.9, 15.4% ≥ 35 | CVS (offered where women had high NT measurements), amniocentesis or follow‐up to birth | Routine screening | Prospective cohort | UK | |||
| X | X | Not reported | CVS and amniocentesis | High‐risk referral for invasive testing | Case control | Netherlands | |||
| X | Not reported | Karyotyping or follow‐up to birth | Routine screening | Cohort | Denmark | ||||
| X | Median 33 (15‐49), 36.1% > 35 | CVS, amniocentesis or follow‐up to birth | Routine screening | Prospective cohort | Germany, Switzerland and Austria | ||||
| X | Median 35.1 (13.2‐46.7) | Karyotyping or follow‐up to birth | Routine screening | Cohort | Germany | ||||
| X | 49% ≤ 35, 51% ≥ 36 | Invasive testing or follow‐up to birth | Routine screening | Retrospective cohort | Netherlands | ||||
| X | X | Not reported | CVS, amniocentesis or follow‐up to birth | Routine screening | Prospective cohort | Belgium | |||
| Median 35.4 (18‐49) | Karyotyping or follow‐up to birth | Routine screening | Cohort | UK | |||||
| X | Mean 30.7, 21.2% ≥ 35 | CVS, amniocentesis or follow‐up to birth | Routine screening | Prospective cohort | Australia | ||||
| X | Median 28 (15‐49) 6.9% ≥ 35 | Amniocentesis or CVS in patients with previous Down’s pregnancy, > 35 years or with a positive biochemical test result. Other women underwent scan at 22 weeks and, if NT >2.5 mm special examination directed to examination of fetal heart. Follow‐up to birth | Routine screening | Prospective cohort | Austria | ||||
| X | X | X | Median 28.3 (17‐45) | Karyotyping or follow‐up to birth | Routine screening | Cohort | Turkey | ||
| X | Median 37 (21‐48) | CVS | High‐risk referral for invasive testing | Prospective cohort | Australia | ||||
| X | Mean 31.1 (16‐46), 22% ≥ 35 | Karyotyping or follow‐up to birth | Routine screening | Prospective cohort | Germany | ||||
| X | Median 30 (15‐47), mean 29.8 (SD 3.3) | Karyotyping or follow‐up to birth | Routine screening | Cohort | Taiwan | ||||
| X | Mean 33 (16‐51), 18.5% ≥ 37 | Karyotyping or follow‐up to birth | Routine screening | Retrospective cohort | Australia | ||||
| Jaques 2010 FTS (first trimester screening) | X | Mean 16.3% ≥ 37 | Karyotyping or follow‐up to birth | Routine screening | Retrospective cohort | Australia | |||
| X | X | Mean 35.4 (14.1‐52.2) | Karyotyping or follow‐up to birth | Routine screening | Prospective cohort | UK | |||
| X | Mean 29.9 (SD 3.3) | Amniocentesis or CVS in patients considered high risk (NT > 2.5, aged > 35 years, positive biochemical test result, history or chromosomal abnormality, fetal structural abnormality at ultrasound or other reason). Follow‐up to birth | Routine screening | Retrospective cohort | South Korea | ||||
| X | Median 37 (IQR 36‐39) | Karyotyping or follow‐up to birth | Routine screening | Case control | Netherlands | ||||
| Kozlowski 2007 GC (Gynaecologists' practices) | X | X | Median 32 (15‐48), 26.4% ≥ 35 | Karyotyping or follow‐up to birth | Routine screening | Cohort | Germany | ||
| Kozlowski 2007 PC (Prenatal centre) | X | X | Median 34 (14‐46), 43.2% ≥ 35 | Karyotyping or follow‐up to birth | Routine screening | Cohort | Germany | ||
| X | X | 34.7% ≥ 35 | Not reported | Routine screening | Prospective cohort | USA | |||
| X | 51% ≥ 35 | Karyotyping or follow‐up to birth | Routine screening | Prospective cohort | Sweden | ||||
| X | Not reported | Karyotyping or follow‐up to birth | Routine screening | Case control | Netherlands | ||||
| X | Mean 30.5 (19% ≥ 35) for unaffected pregnancies | Women considered high risk offered CVS (0.7%) or amniocentesis (11.8%). | Routine screening | Prospective cohort | Hong Kong | ||||
| X | X | Median 32 (IQR 30‐35), 27.4% ≥ 35 | Amniocentesis or follow‐up to birth | Routine screening | Prospective cohort | China | |||
| X | Not reported | Karyotyping or follow‐up to birth | Routine screening | Retrospective cohort | UK | ||||
| Median 35 (17‐49) | CVS | High‐risk referral for invasive testing | Prospective cohort | UK | |||||
| Median 34.5 (14.1‐50.1) | Karyotyping or follow‐up to birth | Routine screening | Prospective cohort | UK | |||||
| X | Mean 30.1 (16‐47), 22.1% ≥ 35 | Amniocentesis (in women considered high risk, n = 510) or follow‐up to birth | Routine screening | Prospective cohort | USA | ||||
| X | 21.6% ≥ 35 | Amniocentesis offered to women with positive results from any screening test. Follow‐up to birth | Routine screening | Prospective cohort | USA | ||||
| X | Median 31.3 (18‐45), 19.7% ≥ 35 | Karyotyping or follow‐up to birth | Routine screening | Retrospective cohort | Italy | ||||
| X | Mean 37.8 (35‐43) | Amniocentesis (unclear in which patients this was conducted) or follow‐up to birth | Screening of patients ≥ 35 years of age | Prospective cohort | Indonesia | ||||
| X | X | Mean 38.5 (SD 4.0) for Down's cases, 35.5 (SD 4.0) for controls | Not reported | Routine screening | Case control | Sweden | |||
| Median 35 (17‐46) | Fetal karyotyping. In cases where NT above 95th percentile or abnormal ductus venousus flow, follow‐up scan conducted at 14‐16 weeks | High‐risk referral for invasive testing | Prospective cohort | UK and Portugal | |||||
| Median 35 (17‐46) | Fetal karyotyping. In cases where NT above 95th percentile or abnormal ductus venousus flow, follow‐up scan conducted at 14‐16 weeks | High‐risk referral for invasive testing | Prospective cohort | Portugal | |||||
| X | Median 35 (15‐42) | CVS or follow‐up | High‐risk referral for invasive testing | Prospective cohort | UK | ||||
| Maxwell 2011 FTS (first trimester screening cohort) | X | Median 31 (14‐48), 24.3% ≥ 35 | Karyotyping or follow‐up to birth | Routine screening | Prospective cohort | Australia | |||
| Mean 33.7 (SD 4.9) for Down's cases, 30.3 (SD 4.5) for controls | Amniocentesis (recommended for women with higher risk on first or second trimester testing) or follow‐up to birth | Routine screening | Case control | Israel | |||||
| X | X | Not reported | Karyotyping or follow‐up to birth | Routine screening | Case control | USA | |||
| X | Not reported | Karyotyping or follow‐up to birth | Routine screening | Retrospective cohort | Germany | ||||
| X | Mean 30.1 (13‐50), 21.1% ≥ 35, 11.9% ≥ 37 | Karyotyping in women considered at risk due to index test results, age or family history or those with considerable anxiety (632 women, 8.5%) or follow‐up to birth | Routine screening | Prospective cohort | UK | ||||
| Molina 2010 high risk (High‐risk cohort) | X | Mean 32.7 (16.7‐47.5) | CVS | High‐risk referral for invasive testing | Cohort | Spain | |||
| Molina 2010 screening (Screening cohort) | X | Not reported | Karyotyping or follow‐up to birth | Routine screening | Cohort | Spain | |||
| X | Median 32 (14‐49) | Karyotyping or follow‐up to birth | Routine screening | Prospective cohort | Italy | ||||
| X | Mean 31.1 (14‐49), 25.9% ≥35 | Invasive testing offered to women considered high risk from screening results or follow‐up to birth | Routine screening | Prospective cohort | Spain | ||||
| X | Mean 35.5 (SD 4.8) for Down's cases, 31.7 (SD 3.4) for unaffected pregnancies | Karyotyping or follow‐up to birth | Routine screening | Prospective cohort | Korea | ||||
| X | X | Not reported | Invasive testing (offered to women with high NT measurement) or follow‐up to birth | Routine screening | Retrospective cohort | France | |||
| X | Median 38 (22‐47) | Fetal karyotyping by amniocentesis (52%) or CVS (48%) | High‐risk referral for invasive testing | Prospective cohort | UK | ||||
| X | Median 31 (13‐49) | Amniocentesis or CVS (patients considered high risk based on screening). First trimester presence/absence of nasal bone, presence/absence of tricuspid regurgitation or normal/abnormal Doppler studies (patients of intermediate risk on first trimester screening and did not undergo CVS or amniocentesis. With the addition of information from these tests, if adjusted risk was high, CVS was performed). Follow‐up to birth | Routine screening | Prospective cohort | UK | ||||
| X | X | 17.5% ≥ 35 | Invasive testing (patients considered high risk based on NT screening) or follow‐up to birth. | Routine screening | Prospective cohort | Finland | |||
| Median 34 (15‐47), 47% ≥ 35 | Karyotyping performed (27% of women) due to increased NT (14%), advanced maternal age (10%), previous chromosomally abnormal child (0.5%) or parental anxiety (2%). | Routine screening in a high risk population | Prospective cohort | UK | |||||
| X | Median 32 | CVS, amniocentesis or neonatal karyotyping or follow‐up to birth | Routine screening | Prospective cohort | Australia | ||||
| X | X | Median 31 (14‐47), 20% ≥ 35 | CVS or amniocentesis (women assessed to be high risk on screening) or follow‐up to birth | Routine screening | Prospective cohort | Australia | |||
| Okun 2008 FTS (first trimester screening cohort) | X | Mean 34 | Karyotyping or follow‐up to birth | Routine screening | Prospective cohort | Canada | |||
| X | X | Range 15 to 46, 35% ≥ 35 | Not reported | Routine screening | Prospective cohort | Italy | |||
| X | Median 31.7 (SD 4.0) for Down's cases, 36.5 (SD 4.1) for unaffected pregnancies | CVS or amniocentesis (women considered high risk on screening on the basis of NT and biochemical results, but not on nasal bone screening, or if requested due to age or anxiety) or follow‐up to birth | Routine screening (2 centres) or in referred patients (1 centre) | Prospective cohort | Italy and Netherlands | ||||
| X | Median 30.5 (SD 8.2) | Not reported | Routine screening | Retrospective cohort | Italy | ||||
| X | Median 36 (19‐44) | CVS | High‐risk referral for invasive testing | Prospective cohort | Argentina | ||||
| X | Mean 31.4 (SD 5.7), 24% ≥ 35 | Prenatal karyotyping offered to patients considered high risk or maternal anxiety (conducted in 24%) or follow‐up to birth | Routine screening | Prospective cohort | Netherlands | ||||
| X | Mean 37.6 (22‐46) | Prenatal karyotyping | High‐risk referral for invasive testing | Consecutive cohort | Netherlands | ||||
| Palomaki 2007 FTS (first trimester screening cohort) | Mean 32.3 (SD 4.6) | Karyotyping or follow‐up to birth | Routine screening | Prospective cohort | Canada | ||||
| X | Median 33.0 (IQR 31.0‐36.0) | CVS or amniocentesis. Cytogenetic testing in cases of miscarriage. Follow‐up to birth. | Routine screening | Retrospective cohort | USA | ||||
| X | Median 37 (19‐46) | CVS | High‐risk referral for invasive testing | Prospective cohort | UK | ||||
| X | Mean 31.4 (14.5‐50.2) | Karyotyping or follow‐up to birth | Routine screening | Prospective cohort | UK | ||||
| X | Mean 30.1 (15‐46) (SD 5.37), 18% ≥ 35 | Invasive testing offered to patients considered high risk at screening (> 1:300) or follow‐up to birth | Routine screening | Prospective cohort | Spain | ||||
| X | 29.5, 17.7% ≥35 | Karyotyping or follow‐up to birth | Routine screening | Prospective cohort | Finland | ||||
| X | Median 30.5 (18‐37) | Amniocentesis offered to patients with NT >3mm or serum marker risk was > 1:250, or follow‐up to birth | Routine screening | Prospective cohort | France | ||||
| X | Mean 30.9 (SD 4.5) | Karyotyping or follow‐up to birth | Routine screening | Prospective cohort | Canada | ||||
| X | X | Median 33.1, 30.1% ≥ 35 | Karyotyping or follow‐up to birth | Routine screening | Prospective cohort | China | |||
| X | Median 30.7 (18.0‐46.3) | Karyotyping or follow‐up to birth | Routine screening | Prospective cohort | France | ||||
| X | X | Mean 30.6 (14‐46) | Karyotyping or follow‐up to birth | Routine screening | Retrospective cohort | Spain | |||
| X | Mean 28 (SD 5) | Invasive testing (women with high risk on screening) or follow‐up to birth | Routine screening | Prospective cohort | UK | ||||
| X | X | 31.0% ≥35 | Karyotyping or follow‐up to birth | Routine screening | Prospective cohort | Germany | |||
| X | Median 36.5 (18‐47) | Invasive testing or follow‐up to birth | Routine screening | Retrospective cohort | Netherlands | ||||
| X | Mean 28 (15‐46), 10.7% ≥ 35 | CVS (offered to patients with first trimester NT > 3.5 mm), amniocentesis (offered to patients with first trimester NT 2.5‐3.4 mm, high risk on second trimester serum testing (> 1:250) and those > 35 years) or follow‐up to birth | Routine screening | Retrospective cohort | Austria | ||||
| X | X | 13% > 35 | CVS and amniocentesis (offered to patients with increased risk (> 1:400) at first trimester screening. CVS recommended when NT > 3.5 or when women did not want to wait until the 15th week for amniocentesis), or follow‐up to birth | Routine screening | Prospective cohort | Austria | |||
| X | Mean 29.4 (16‐47) | Invasive testing (women considered high risk on screening) or follow‐up to birth | Routine screening | Prospective consecutive cohort | UK | ||||
| X | X | Median 32 (15‐44), 29% ≥ 35 | Invasive testing or follow‐up to birth | Routine screening | Prospective cohort | Australia | |||
| X | X | Median 33 (14‐47), 35.4% ≥ 35 | CVS, amniocentesis, cordocentesis or follow‐up to birth | Routine screening | Prospective cohort | Chile | |||
| X | Median 31 (14‐49) | CVS and amniocentesis (9.6% of women) or follow‐up to birth | Routine screening | Prospective cohort | UK | ||||
| X | Median 34 (23‐44) for Down's cases; mean 30.4 (16‐45), 16.5% ≥ 35 for unaffected pregnancies | Karyotyping or follow‐up to birth | Routine screening | Retrospective cohort | Denmark | ||||
| X | X | X | Median 38 (19‐46) for Down's cases, 36 (15‐47) for controls | Invasive testing (high‐risk women) or follow‐up to birth | Routine screening | Case control | UK | ||
| Median 36 (20‐44) for Down's cases, 30 (16‐41) for controls | Not reported | Routine screening | Case control | UK | |||||
| X | Median 35.8 for Down's cases, 29.3 for controls | Karyotyping or follow‐up to birth | Routine screening | Case control | Denmark | ||||
| X | Median 32 (14‐45), 27% ≥ 35 | Invasive testing offered to women with screening risk of > 1:250 or follow‐up to birth | Routine screening | Prospective cohort | UK | ||||
| X | Median 28.6 (15‐42) | Karyotyping or follow‐up to birth | Routine screening | Cohort | Slovenia | ||||
| X | Median 29 (16‐48), 7.8% ≥ 37 | CVS or amniocentesis or follow‐up to birth. Unclear reference standard in cases of intrauterine death, miscarriages and terminations. | Routine screening | Prospective cohort | Greece | ||||
| X | Mean 29 (15‐45) | CVS (offered to patients considered high risk on screening) or follow‐up to birth | Routine screening | Prospective cohort | UK | ||||
| Mean 34.5 (19‐45) | Karyotyping or follow‐up to birth | Routine screening | Prospective cohort | Netherlands | |||||
| X | Mean 35 for Down's cases, 31 for controls | Karyotyping or follow‐up to birth | Routine screening | Case control | Denmark | ||||
| X | Median 33.1, 36.9% ≥ 35 | Karyotyping or follow‐up to birth | Routine screening | Retrospective cohort | UK | ||||
| X | Mean 29.6, 18.6% ≥ 35 | Karyotyping or follow‐up to birth | Routine screening | Retrospective cohort | Finland | ||||
| Median 32 (18‐47) | CVS or follow‐up to birth | Routine screening | Prospective cohort | Italy | |||||
| X | X | X | Not reported | Invasive testing (following second trimester screening) or follow‐up to birth | Routine screening | Case control | UK and Austria | ||
| X | X | Mean 35 (SD 4.6), 50% ≥ 35 | Invasive testing. Miscarriage with cytogenetic testing. Follow‐up to birth | Routine screening | Prospective cohort | USA | |||
| X | Mean 36.7 (SD 3.2) | Karyotyping or follow‐up to birth | Routine screening | Retrospective cohort | USA | ||||
| X | X | Mean 29, 10.8% ≥ 35 | Invasive testing (in cases of increased risk) or follow‐up to birth | Referrals for screening | Prospective cohort | Denmark | |||
| X | Median 34.9 (15‐48) | Karyotyping or follow‐up to birth | Routine screening | Cohort | Netherlands | ||||
| X | Median 35.2 (16‐52) | Karyotyping or follow‐up to birth | Routine screening | Cohort | UK | ||||
| X | Median 31.9 (IQR 27.7‐35.8) | Karyotyping or follow‐up to birth | Routine screening | Cohort | UK, Denmark and Cyprus | ||||
| X | Median 33 (14‐48) | Amniocentesis, CVS or follow‐up to birth | Routine screening | Prospective cohort | Italy | ||||
| *The study provided data for the subset of women with maternal age of 35 or more. X indicates that the test was evaluated in the study. CVS = chorionic villus sampling; IQR = interquartile range; SD = standard deviation. | |||||||||
| Correction made for missing false negatives in studies with delayed verification of test negatives | NT | NT and maternal age | NT, PAPP‐A, free ßhCG and maternal age | ||||||
| Ratio of DORs (95% CI); P value | Sensitivity at 5% FPR (95% CI) (studies) | Ratio of DORs (95% CI); P value | Sensitivity at 5% FPR (95% CI) (studies) | Ratio of DORs (95% CI); P value | Sensitivity at 5% FPR (95% CI) (studies) | ||||
| Screening (n = 9) | High risk (n = 4) | Screening (n = 46) | High risk (n = 4) | Screening (n = 66) | High risk (n =3) | ||||
| No FN correction | 0.68 (0.26, 1.77); P = 0.40 | 73 (62, 81) | 64 (45, 80) | 0.34 (0.17, 0.69); P = 0.003 | 72 (68, 76) | 47 (31, 63) | 0.41 (0.16, 1.00); P = 0.05 | 88 (86, 89) | 74 (54, 88) |
| FN increased +10% | 0.69 (0.27, 1.78); P = 0.40 | 70 (59, 79) | 62 (42, 78) | 0.40 (0.20, 0.82); P = 0.01 | 69 (64, 73) | 47 (31, 64) | 0.48 (0.19, 1.20); P = 0.11 | 86 (84, 87) | 74 (53, 88) |
| FN increased +20% | 0.74 (0.29, 1.92); P = 0.50 | 69 (57, 78) | 62 (42, 78) | 0.43 (0.21, 0.89); P = 0.02 | 67 (63, 71) | 47 (31, 64) | 0.51 (0.20, 1.28); P = 0.15 | 85 (83, 87) | 74 (54, 88) |
| FN increased +30% | 0.81 (0.31, 2.09); P = 0.63 | 67 (55, 76) | 62 (42, 78) | 0.46 (0.22, 0.97); P = 0.04 | 66 (61, 70) | 47 (30, 64) | 0.55 (0.22, 1.38); P = 0.20 | 84 (82, 86) | 74 (54, 88) |
| FN increased +40% | 0.76 (0.29, 2.02); P = 0.55 | 66 (53, 76) | 59 (39, 77) | 0.50 (0.24, 1.02); P = 0.06 | 64 (60, 68) | 47 (31, 64) | 0.59 (0.24, 1.48); P = 0.26 | 83 (81, 85) | 74 (54, 88) |
| FN increased +50% | 0.81 (0.30, 2.15): P = 0.65 | 64 (52, 75) | 59 (39, 77) | 0.52 (0.25, 1.08); P = 0.08 | 63 (58, 67) | 47 (30, 64) | 0.62 (0.25, 1.56); P = 0.31 | 82 (80, 84) | 74 (54, 88) |
| DOR = diagnostic odds ratio | |||||||||
| Test | No. of studies | No. of participants |
| 1 Aberrant right subclavian artery Show forest plot | 1 | 425 |
| 2 Frontomaxillary facial angle >95 percentile Show forest plot | 1 | 242 |
| 3 Presence of mitral gap Show forest plot | 1 | 217 |
| 4 Maxillary bone length, 5% percentile Show forest plot | 1 | 927 |
| 5 Tricuspid regurgitation Show forest plot | 1 | 312 |
| 6 Iliac angle 90 degrees Show forest plot | 1 | 2032 |
| 7 Ductus venosus a‐wave reversed Show forest plot | 1 | 378 |
| 8 Ductus venosus pulsivity index > 95 percentile Show forest plot | 1 | 378 |
| 9 Nasal bone, mixed cut‐points Show forest plot | 11 | 48279 |
| 10 NT, 2.5 mm Show forest plot | 4 | 11835 |
| 11 NT, 3 mm Show forest plot | 6 | 10381 |
| 12 NT, 5FPR Show forest plot | 3 | 63885 |
| 13 NT, mixed cut‐points Show forest plot | 13 | 90978 |
| 14 NT and age, risk 1:100 Show forest plot | 1 | 10668 |
| 15 NT and age, risk 1:250 Show forest plot | 10 | 79412 |
| 16 NT and age, risk 1:300 Show forest plot | 23 | 252811 |
| 17 NT and age, 1FPR Show forest plot | 4 | 98453 |
| 18 NT and age, 3FPR Show forest plot | 4 | 98453 |
| 19 NT and age, 5FPR Show forest plot | 22 | 288853 |
| 20 NT and age, mixed cut‐points Show forest plot | 50 | 530874 |
| 21 NT and nasal bone, Absent NB + NT ≥ 95th centile Show forest plot | 1 | 486 |
| 22 Ductus and age, risk 1:250 Show forest plot | 1 | 3731 |
| 23 Ductus and age, 5FPR Show forest plot | 2 | 3965 |
| 24 Ductus and age, mixed cut‐points Show forest plot | 5 | 5331 |
| 25 Ductus, NT and age, risk 1:100 Show forest plot | 1 | 19736 |
| 26 Ductus, NT and age, risk 1:250 Show forest plot | 1 | 3727 |
| 27 Ductus, NT and age, 5FPR Show forest plot | 2 | 3961 |
| 28 Ductus, NT and age, mixed cut‐points Show forest plot | 3 | 23697 |
| 29 Age and nasal bone, mixed cut‐points Show forest plot | 4 | 25303 |
| 30 Age, NT and tricuspid blood flow, risk 1:100 Show forest plot | 1 | 19736 |
| 31 Age, NT and nasal bone, risk 1:100 Show forest plot | 1 | 19736 |
| 32 Age, NT and nasal bone, risk 1:300 Show forest plot | 4 | 9963 |
| 33 Age, NT and nasal bone, mixed cut‐points Show forest plot | 5 | 29699 |
| 34 Age, NT, nasal bone and ductus, risk NT>1:300 AND abnormal DV flow AND absent NB Show forest plot | 1 | 544 |
| 35 Age, NT, nasal bone, free ßhCG and PAPP‐A, 1st trimester, 5FPR Show forest plot | 1 | 20305 |
| 36 Age, NT, nasal bone, free ßhCG and PAPP‐A, 1st trimester, mixed cut‐points Show forest plot | 3 | 41842 |
| 37 Age, NT and free ßhCG, 1st trimester, 5FPR Show forest plot | 4 | 4986 |
| 38 Age, NT and free ßhCG, 1st trimester, risk 1:240 Show forest plot | 1 | 5809 |
| 39 Age, NT and free ßhCG, 1st trimester, mixed cut‐points Show forest plot | 5 | 10795 |
| 40 Age, NT and PAPP‐A, 1st trimester, risk 1:100 Show forest plot | 1 | 1507 |
| 41 Age, NT and PAPP‐A, 1st trimester, risk 1:185 Show forest plot | 1 | 5809 |
| 42 Age, NT and PAPP‐A, 1st trimester, 5FPR Show forest plot | 3 | 2498 |
| 43 Age, NT and PAPP‐A, 1st trimester, mixed cut‐points Show forest plot | 5 | 9814 |
| 44 Age, NT and total hCG, 1st trimester, 5FPR Show forest plot | 1 | 1110 |
| 45 Age, NT and AFP, 1st trimester, 5FPR Show forest plot | 1 | 1110 |
| 46 Age, NT and ITA, 1st trimester, 5FPR Show forest plot | 1 | 278 |
| 47 Age, NT and inhibin, 1st trimester, risk 1:100 Show forest plot | 1 | 40 |
| 48 Age, NT and inhibin, 1st trimester, risk 1:250 Show forest plot | 1 | 40 |
| 49 Age, NT and inhibin, 1st trimester, risk 1:400 Show forest plot | 1 | 40 |
| 50 Age, NT and inhibin, 1st trimester, 5FPR Show forest plot | 1 | 1110 |
| 51 Age, NT and inhibin, 1st trimester, mixed cut‐points Show forest plot | 2 | 1150 |
| 52 Age, NT, PAPP‐A and free ßhCG, 1st trimester, risk 1:100 Show forest plot | 10 | 102332 |
| 53 Age, NT, PAPP‐A and free ßhCG, 1st trimester, risk 1:150 Show forest plot | 5 | 177643 |
| 54 Age, NT, PAPP‐A and free ßhCG, 1st trimester, risk 1:200 Show forest plot | 8 | 135768 |
| 55 Age, NT, PAPP‐A and free ßhCG, 1st trimester, risk 1:220 Show forest plot | 1 | 2231 |
| 56 Age, NT, PAPP‐A and free ßhCG, 1st trimester, risk 1:250 Show forest plot | 25 | 174712 |
| 57 Age, NT, PAPP‐A and free ßhCG, 1st trimester, risk 1:300 Show forest plot | 29 | 544681 |
| 58 Age, NT, PAPP‐A and free ßhCG, 1st trimester, 1FPR Show forest plot | 7 | 88874 |
| 59 Age, NT, PAPP‐A and free ßhCG, 1st trimester, 3FPR Show forest plot | 9 | 312680 |
| 60 Age, NT, PAPP‐A and free ßhCG, 1st trimester, 5FPR Show forest plot | 24 | 391874 |
| 61 Age, NT, PAPP‐A and free ßhCG, 1st trimester, mixed cut‐points Show forest plot | 69 | 1173853 |
| 62 Age, NT, PAPP‐A and uE3, 1st trimester, 5FPR Show forest plot | 1 | 576 |
| 63 Age, NT, PAPP‐A and ITA, 1st trimester, 5FPR Show forest plot | 2 | 11053 |
| 64 Age, NT, PAPP‐A and inhibin, 1st trimester, risk 1:100 Show forest plot | 1 | 40 |
| 65 Age, NT, PAPP‐A and inhibin, 1st trimester, risk 1:250 Show forest plot | 1 | 40 |
| 66 Age, NT, PAPP‐A and inhibin, 1st trimester, risk 1:400 Show forest plot | 1 | 40 |
| 67 Age, NT, PAPP‐A and inhibin, 1st trimester, 5FPR Show forest plot | 1 | 1110 |
| 68 Age, NT, PAPP‐A and inhibin, 1st trimester, mixed cut‐points Show forest plot | 2 | 1150 |
| 69 Age, NT, PAPP‐A and ADAM12, 1st trimester, 5FPR Show forest plot | 2 | 1042 |
| 70 Age, NT, PAPP‐A and ADAM12, 1st trimester, risk 1:250 Show forest plot | 1 | 691 |
| 71 Age, NT, free ßhCG and ADAM12, 1st trimester, 5FPR Show forest plot | 1 | 351 |
| 72 Age, NT, AFP and free ßhCG, 1st trimester, risk 1:250 Show forest plot | 1 | 1656 |
| 73 Age, NT, AFP and free ßhCG, 1st trimester, 5FPR Show forest plot | 1 | 1110 |
| 74 Age, NT, AFP and free ßhCG, 1st trimester, mixed cut‐points Show forest plot | 2 | 2766 |
| 75 Age, NT, AFP and PAPP‐A, 1st trimester, 5FPR Show forest plot | 1 | 1110 |
| 76 Age, NT, total hCG and PAPP‐A, 1st trimester, 5FPR Show forest plot | 1 | 1110 |
| 77 Age, NT, total hCG and inhibin, 1st trimester, 5FPR Show forest plot | 1 | 1110 |
| 78 Age, NT, free ßhCG and inhibin, 1st trimester, 5FPR Show forest plot | 1 | 1110 |
| 79 Age, NT, PAPP‐A, free ßhCG, 1st trimester serum, ductus venosus pulsivity index, 5FPR Show forest plot | 1 | 7250 |
| 80 Age, free ßhCG and PAPP‐A, if risk 1:42‐1:1000, NT, final 1:250 risk Show forest plot | 1 | 10189 |
| 81 Age, NT, ductus, free ßhCG and PAPP‐A, 1st trimester, risk 1:100 Show forest plot | 2 | 26986 |
| 82 Age, NT, ductus, free ßhCG and PAPP‐A, 1st trimester, risk 1:250 Show forest plot | 2 | 10325 |
| 83 Age, NT, ductus, free ßhCG and PAPP‐A, 1st trimester, 5FPR Show forest plot | 2 | 10325 |
| 84 Age, NT, ductus, free ßhCG and PAPP‐A, 1st trimester, mixed cut‐points Show forest plot | 3 | 30061 |
| 85 Age, NT, nasal bone, free ßhCG and PAPP‐A, 1st trimester, risk 1:100 Show forest plot | 1 | 19736 |
| 86 Age, NT, nasal bone, free ßhCG and PAPP‐A, 1st trimester, risk 1:300 Show forest plot | 1 | 1801 |
| 87 Age, NT, tricuspid blood flow, free ßhCG and PAPP‐A, 1st trimester, risk 1:100 Show forest plot | 1 | 19736 |
| 88 Age, NT, fetal heart rate, free ßhCG and PAPP‐A, 1st trimester, 5FPR Show forest plot | 2 | 76385 |
| 89 Age, NT, fetal heart rate, nasal bone, free ßhCG and PAPP‐A, 1st trimester, risk 1:200 Show forest plot | 1 | 19736 |
| 90 age, NT, fetal heart rate, ductus, free ßhCG and PAPP‐A, 1st trimester, 5FPR Show forest plot | 1 | 19614 |
| 91 Age, NT, fetal heart rate, tricuspid blood flow, free ßhCG and PAPP‐A,1st trimester, 5FPR Show forest plot | 1 | 19736 |
| 92 Age, NT, AFP, free ßhCG and PAPP‐A, 1st trimester, risk 1:250 Show forest plot | 1 | 5483 |
| 93 Age, NT, AFP, free ßhCG and PAPP‐A, 1st trimester, 5FPR Show forest plot | 2 | 1306 |
| 94 Age, NT, AFP, free ßhCG and PAPP‐A, 1st trimester, mixed cut‐points Show forest plot | 3 | 6789 |
| 95 Age, NT, total hCG, inhibin and PAPP‐A, 1st trimester, 5FPR Show forest plot | 1 | 1110 |
| 96 Age, NT, PAPP‐A, free ßhCG and PGH, 1st trimester, 5FPR Show forest plot | 1 | 335 |
| 97 Age, NT, PAPP‐A, free ßhCG and GHBP, 1st trimester, 5FPR Show forest plot | 1 | 335 |
| 98 Age, NT, PAPP‐A, free ßhCG and PIGF, 1st trimester, 5FPR Show forest plot | 2 | 1443 |
| 99 Age, NT, PAPP‐A, free ßhCG and total hCG, 1st trimester, 5FPR Show forest plot | 1 | 998 |
| 100 Age, NT, PAPP‐A, free ßhCG and PP13, 1st trimester, 5FPR Show forest plot | 1 | 998 |
| 101 Age, NT, PAPP‐A, free ßhCG and ADAM12, 1st trimester, 5FPR Show forest plot | 4 | 2571 |
| 102 Age, NT, PAPP‐A, free ßhCG and ADAM12, 1st trimester, risk 1:250 Show forest plot | 2 | 1222 |
| 103 Age, NT, PAPP‐A, free ßhCG and ADAM12, 1st trimester, mixed cut‐points Show forest plot | 4 | 2571 |
| 104 Age, NT, free ßhCG, PAPP‐A and inhibin, 1st trimester, risk 1:100 Show forest plot | 1 | 40 |
| 105 Age, NT, free ßhCG, PAPP‐A and inhibin, 1st trimester, risk 1:250 Show forest plot | 1 | 40 |
| 106 Age, NT, free ßhCG, PAPP‐A and inhibin, 1st trimester, risk 1:400 Show forest plot | 1 | 40 |
| 107 Age, NT, free ßhCG, PAPP‐A and inhibin, 1st trimester, 5FPR Show forest plot | 1 | 1110 |
| 108 Age, NT, PAPP‐A, free ßhCG, ADAM12 and PlGH, 1st trimester, 5FPR Show forest plot | 1 | 998 |
| 109 Age, NT, total hCG, inhibin, PAPP‐A, AFP and uE3, 1st trimester, 5FPR Show forest plot | 1 | 1110 |
| 110 Age, NT, free ßhCG, inhibin, PAPP‐A, AFP and uE3,1st trimester, 5FPR Show forest plot | 1 | 1110 |
| 111 Age, NT, PAPP‐A, free ßhCG, ADAM12, total hCG and PlGF, 1st trimester, 5FPR Show forest plot | 1 | 998 |
| 112 Age, NT, PAPP‐A, free ßhCG, ADAM12, total hCG, PlGF and PP13, 1st trimester, 5FPR Show forest plot | 1 | 998 |
| 113 NT, free ßhCG and PAPP‐A, 1st trimester incidence rate 63.3% Show forest plot | 1 | 6508 |
| 114 NT, PAPP‐A, free ßhCG and maternal age ‐ maternal age < 35 years Show forest plot | 5 | 19057 |
| 115 NT, PAPP‐A, free ßhCG and maternal age ‐ maternal age ≥ 35 years Show forest plot | 5 | 10980 |