Programas de cribado odontológico en escuelas para la salud bucodental
Información
- DOI:
- https://doi.org/10.1002/14651858.CD012595.pub2Copiar DOI

- Base de datos:
-
- Cochrane Database of Systematic Reviews
- Versión publicada:
-
- 21 diciembre 2017see what's new
- Tipo:
-
- Intervention
- Etapa:
-
- Review
- Grupo Editorial Cochrane:
-
Grupo Cochrane de Salud oral
- Copyright:
-
- Copyright © 2017 The Cochrane Collaboration. Published by John Wiley & Sons, Ltd.
Cifras del artículo
Altmetric:
Citado por:
Autores
Contributions of authors
Ankita Arora: drafting the protocol, screening trials, data extraction, assessment of risk of bias and entering data into RevMan 5, selection of trials, drafting the final review and updating the review.
Shivi Khattri: undertaking searches, selecting trials, data extraction and entering data into RevMan 5, drafting the final review and updating the review.
Noorliza Mastura Ismail: screening articles, selecting trials, drafting the final review and updating the review.
Sumanth Kumbargere Nagraj: selecting the trials, data analysis, assessment of risk of bias, drafting the final review and updating the review.
Eachempati Prashanti: drafting the protocol, drafting the final review, updating the review and acting as arbiter.
Sources of support
Internal sources
-
Melaka Manipal Medical College, Manipal University, Melaka Campus, Malaysia.
Library support and providing training in Cochrane Systematic Reviews
-
Cochrane South Asia Centre, CMC, Vellore, India.
Methodological and statistical support was provided in this Cochrane systematic review.
External sources
-
National Institute for Health Research (NIHR), UK.
This review was supported by the NIHR, via Cochrane Infrastructure funding to Cochrane Oral Health. The views and opinions expressed herein are those of the review authors and do not necessarily reflect those of the Systematic Reviews Programme, the NIHR, the NHS or the Department of Health.
-
Cochrane Oral Health Global Alliance, Other.
The production of Cochrane Oral Health reviews has been supported financially by our Global Alliance since 2011 (oralhealth.cochrane.org/partnerships‐alliances). Contributors over the past year have been the American Association of Public Health Dentistry, USA; the British Association for the Study of Community Dentistry, UK; the British Society of Paediatric Dentistry, UK; the Canadian Dental Hygienists Association, Canada; the Centre for Dental Education and Research at All India Institute of Medical Sciences, India; the National Center for Dental Hygiene Research & Practice, USA; New York University College of Dentistry, USA; and NHS Education for Scotland, UK; Swiss Society of Endodontology, Switzerland.
Declarations of interest
Ankita Arora: no interests to declare
Shivi Khattri: no interests to declare
Noorliza Mastura Ismail: no interests to declare
Sumanth Kumbargere Nagraj: no interests to declare
Eachempati Prashanti: no interests to declare
Acknowledgements
The authors thank Ms Laura MacDonald, Managing Editor; Ms Anne Littlewood, Information Specialist; Ms Janet Lear, Administrator; and Ms Jo Weldon, Research Co‐ordinator, all from Cochrane Oral Health. We acknowledge input from Cochrane Oral Health editors Anne‐Marie Glenny, Paul Brocklehurst and May Wong. We thank our external referees Lucy Burbridge and Ayesha Masood, and copy editor Jason Elliot‐Smith. We are grateful to Ms.Shazana Binti Mohd Selva, Chief Librarian, Melaka Manipal Medical College; Professor Dr. Abdul Rashid Haji Ismail, Dean, Faculty of Dentistry; and Professor Adinegara Lutfi Abas, HoD ‒ Community Medicine, Melaka Manipal Medical College for their kind support all through the review preparation. We acknowledge all the suggestions and help from Professor Prathap Tharyan, Mr Richard Kirubakaran and Mr Jabez Paul from CMC Vellore, Cochrane South Asia Centre, during the review preparation. We express our gratitude to Ms Anette Blumle, Cochrane Deutschland, for the translation help. We sincerely thank authors Easter Joury, King's College London Dental Institute, and Suchitra Nelson, Case Western Reserve University, Ohio, who responded to our queries.
Version history
| Published | Title | Stage | Authors | Version |
| 2022 Jul 27 | School dental screening programmes for oral health | Review | Ankita Arora, Sumanth Kumbargere Nagraj, Shivi Khattri, Noorliza Mastura Ismail, Prashanti Eachempati | |
| 2019 Aug 08 | School dental screening programmes for oral health | Review | Ankita Arora, Shivi Khattri, Noorliza Mastura Ismail, Sumanth Kumbargere Nagraj, Prashanti Eachempati | |
| 2017 Dec 21 | School dental screening programmes for oral health | Review | Ankita Arora, Shivi Khattri, Noorliza Mastura Ismail, Sumanth Kumbargere Nagraj, Eachempati Prashanti | |
| 2017 Mar 09 | School dental screening programmes for oral health | Protocol | Ankita Arora, Shivi Khattri, Noorliza Mastura Ismail, Kumbargere N Sumanth, Eachempati Prashanti | |
Differences between protocol and review
We would have assessed reporting bias as planned if there were more than 10 studies included in a meta‐analysis.
In the case of dropouts, we intended to use the data as reported by the paper and deal with it in the 'Risk of bias' assessment. However, in the outcome 'Dental attendance', dropout was considered as a part of the outcome (not attending the dentist) and hence we redefined the term 'dropout' in this review.
We planned subgroup analysis on the basis of age group, targeted or universal screening, post‐screening treatment set‐up and treatment charges. However, we performed subgroup analyses on the basis of cluster versus parallel group study design because of substantial heterogeneity.
Keywords
MeSH
Medical Subject Headings (MeSH) Keywords
Medical Subject Headings Check Words
Child; Humans;
PICO

A schema of school dental screening process

Study flow diagram

Risk of bias graph: review authors' judgements about each risk of bias item presented as percentages across all included studies

Risk of bias summary: review authors' judgements about each risk of bias item for each included study

Forest plot of comparison: 1 Traditional screening versus no screening, outcome: 1.1 Dental attendance

Comparison 1 Traditional screening versus no screening, Outcome 1 Dental attendance.

Comparison 2 Criteria‐based screening versus no screening, Outcome 1 Dental attendance.
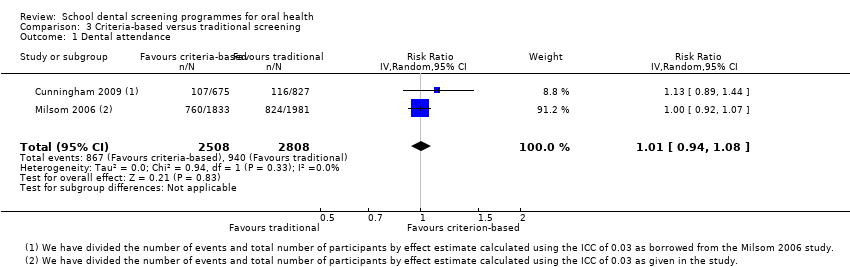
Comparison 3 Criteria‐based versus traditional screening, Outcome 1 Dental attendance.

Comparison 4 Criteria‐based screening with specific referral versus criteria‐based screening with non‐specific referral, Outcome 1 Dental attendance.

Comparison 5 Traditional screening with motivation versus traditional screening alone, Outcome 1 Dental attendance.
| Traditional screening compared to no screening for increasing dental attendance | |||||||
| Population: increasing dental attendance | |||||||
| Outcomes | Relative effect | Anticipated absolute effects* (95% CI) | Number of participants (studies) | Certainty of the evidence | What happens | ||
| Without no screening | With traditional screening | Difference | |||||
| Dental attendance Follow‐up: 3 to 4 months | Data not pooled | 6281 | ⊕⊝⊝⊝ | There was substantial heterogeneity, in part due to study design (3 cluster RCTs and 1 individual‐level RCT). Due to the inconsistency, we downgraded the evidence to 'very low certainty' and are unable to draw conclusions about this comparison. | |||
| *The risk in the intervention group (and its 95% CI) is based on the assumed risk in the comparison group and the relative effect of the intervention (and its 95% CI). | |||||||
| GRADE Working Group grades of evidence | |||||||
| 1Praveen 2014 and Zarod 1992 trials have unclear selection bias, performance and detection bias. Downgraded by two levels 2 High heterogeneity (I2 = 91%). Downgraded by one level | |||||||
| Criteria‐based screening compared to no screening for increasing dental attendance | |||||||
| Population: school children | |||||||
| Outcomes | Relative effect | Anticipated absolute effects* (95% CI) | Number of participants (studies) | Certainty of the evidence | Comment | ||
| With no screening | With criteria‐based screening | Difference | |||||
| Dental attendance Follow‐up: 3 to 4 months | RR 1.07 | 33.1% | 35.5% | 2.3% more | 4980 | ⊕⊕⊝⊝ | There is 7% relative increase in the dental attendance in criteria‐based screening group compared to no screening with 95% CI ranging from 1% decrease to 16% increase. |
| *The risk in the intervention group (and its 95% confidence interval) is based on the assumed risk in the comparison group and the relative effect of the intervention (and its 95% CI). | |||||||
| GRADE Working Group grades of evidence | |||||||
| 1Cunningham 2009 trial has wide CI ranging from no effect to favourable effect and ICC is borrowed from Milsom 2006 trial. Downgraded by 2 levels | |||||||
| Criteria‐based screening compared to traditional screening for increasing dental attendance | ||||||
| Population: school children | ||||||
| Outcomes | Anticipated absolute effects* (95% CI) | Relative effect | Number of participants | Certainty of the evidence | Comments | |
| Risk with traditional screening | Risk with criteria‐based screening | |||||
| Dental attendance | 335 per 1000 | 338 per 1000 | RR 1.01 | 5316 | ⊕⊝⊝⊝ | There is 1% relative increase in the dental attendance in criteria‐based screening compared to traditional screening with 95% CI ranging from 6% decrease to 8% increase in the attendance |
| *The risk in the intervention group (and its 95% confidence interval) is based on the assumed risk in the comparison group and the relative effect of the intervention (and its 95% CI). | ||||||
| GRADE Working Group grades of evidence | ||||||
| 1 Results of both the trials are ranging from favouring traditional screening to no effect. Downgraded by two levels. 2 Wide 95% CI in Cunningham 2009 trial crossing the line of no effect. Downgraded by one level | ||||||
| Criteria‐based screening with specific referral compared to criteria‐based screening with non‐specific referral for increasing dental attendance | |||||||
| Population: school children | |||||||
| Outcomes | Relative effect | Anticipated absolute effects* (95% CI) | Number of participants (studies) | Certainty of the evidence | Comment | ||
| With criteria‐based screening with non‐specific referral | With criteria‐based screening with specific referral | Difference | |||||
| Dental attendance at general dentist Follow‐up: mean 8 months | RR 1.39 | 49.0% | 68.1% | 19.1% more | 201 | ⊕⊕⊝⊝ | There is 39% relative increase in the attendance to general dentist in the specific referral group compared to non‐specific group, with 95% CI ranging from 9% to 77% increase in attendance. |
| Dental attendance at orthodontist Follow‐up: mean 8 months | RR 1.90 | 19.4% | 36.8% | 17.4% more | 201 | ⊕⊕⊝⊝ | There is 90% relative increase in the attendance to orthodontist in the specific referral group compared to the non‐specific group with 95% CI ranging from 18% to 206% increase in attendance. |
| *The risk in the intervention group (and its 95% confidence interval) is based on the assumed risk in the comparison group and the relative effect of the intervention (and its 95% CI). | |||||||
| GRADE Working Group grades of evidence | |||||||
| 1Burden 1994 is a single study of secondary school children (11 to 12 years) at unclear risk of selection bias. Downgraded by two levels | |||||||
| Traditional screening with motivation compared to traditional screening for increasing dental attendance | |||||||
| Patient or population: school children | |||||||
| Outcomes | Relative effect | Anticipated absolute effects* (95% CI) | Number of participants (studies) | Certainty of the evidence | What happens | ||
| Without traditional screening with motivation | With traditional screening with motivation | Difference | |||||
| Dental attendance Follow‐up: mean 3 months | RR 3.08 | 10.0% | 30.9% | 20.9% more | 2486 | ⊕⊕⊝⊝ | There is 208% relative increase in the attendance of the motivation group compared to control group with 95% CI ranging from 157% to 271% increase in attendance. |
| *The risk in the intervention group (and its 95% confidence interval) is based on the assumed risk in the comparison group and the relative effect of the intervention (and its 95% CI). | |||||||
| GRADE Working Group grades of evidence | |||||||
| 1 Hebbal 2005 trial has unclear risk of selection bias and high risk of performance bias. Downgraded by two levels | |||||||
| Data values for total number and events to be divided by effect estimate across all studies Effect estimate: 1 + (M − 1)ICC M = average cluster size ICC = 0.03 (borrowed from Milsom 2006) | Total number of participants (original) | Total number of participants (adjusted) | Events ‒ original children attending dental office) | Events ‒ adjusted (children attending dental office) |
| 1 + (15 − 1).03 = 1.42 Control arm Traditional arm Criteria‐based arm | 819 1175 958 | 577 827 675 | 129 165 151 | 91 116 107 |
| 1 + (42 − 1).03 = 2.23 Control arm Traditional arm Criteria‐based arm | 4226 4418 4087 | 1895 1981 1833 | 1624 1838 1695 | 728 824 760 |
| 1 + (8 − 1).03 = 1.21 Control arm Intervention arm | 300 300 | 248 248 | 80 54 | 67 45 |
| Outcome or subgroup title | No. of studies | No. of participants | Statistical method | Effect size |
| 1 Dental attendance Show forest plot | 4 | Risk Ratio (IV, Random, 95% CI) | Subtotals only | |
| 1.1 Cluster RCT with ICC 0.03 | 3 | 5776 | Risk Ratio (IV, Random, 95% CI) | 1.10 [0.89, 1.35] |
| 1.2 Individual‐level RCT | 1 | 505 | Risk Ratio (IV, Random, 95% CI) | 1.74 [1.47, 2.05] |
| Outcome or subgroup title | No. of studies | No. of participants | Statistical method | Effect size |
| 1 Dental attendance Show forest plot | 2 | 4980 | Risk Ratio (IV, Random, 95% CI) | 1.07 [0.99, 1.16] |
| Outcome or subgroup title | No. of studies | No. of participants | Statistical method | Effect size |
| 1 Dental attendance Show forest plot | 2 | 5316 | Risk Ratio (IV, Random, 95% CI) | 1.01 [0.94, 1.08] |
| Outcome or subgroup title | No. of studies | No. of participants | Statistical method | Effect size |
| 1 Dental attendance Show forest plot | 1 | 402 | Risk Ratio (IV, Random, 95% CI) | 1.52 [1.15, 2.00] |
| 1.1 Attending general dentist | 1 | 201 | Risk Ratio (IV, Random, 95% CI) | 1.39 [1.09, 1.77] |
| 1.2 Attending orthodontist | 1 | 201 | Risk Ratio (IV, Random, 95% CI) | 1.90 [1.18, 3.06] |
| Outcome or subgroup title | No. of studies | No. of participants | Statistical method | Effect size |
| 1 Dental attendance Show forest plot | 1 | 2486 | Risk Ratio (IV, Random, 95% CI) | 3.08 [2.57, 3.71] |