Ensayos de comparación directa de antibióticos para la bronquiectasia
Appendices
Appendix 1. Sources and search methods for the Cochrane Airways Trials Register
Electronic searches: core databases
| Database | Search frequency |
| CENTRAL (the Cochrane Library) | Monthly |
| MEDLINE (Ovid) | Weekly |
| Embase (Ovid) | Weekly |
| PsycINFO (Ovid) | Monthly |
| CINAHL (EBSCO) | Monthly |
| AMED (EBSCO) | Monthly |
Handsearches: core respiratory conference abstracts
| Conference | Years searched |
| American Academy of Allergy, Asthma and Immunology (AAAAI) | 2001 onwards |
| American Thoracic Society (ATS) | 2001 onwards |
| Asia Pacific Society of Respirology (APSR) | 2004 onwards |
| British Thoracic Society Winter Meeting (BTS) | 2000 onwards |
| Chest Meeting | 2003 onwards |
| European Respiratory Society (ERS) | 1992, 1994, 2000 onwards |
| International Primary Care Respiratory Group Congress (IPCRG) | 2002 onwards |
| Thoracic Society of Australia and New Zealand (TSANZ) | 1999 onwards |
MEDLINE search strategy used to identify trials for the Cochrane Airways Trials Register
Bronchiectasis search
1. exp Bronchiectasis/
2. bronchiect$.mp.
3. bronchoect$.mp.
4. kartagener$.mp.
5. (ciliary adj3 dyskinesia).mp.
6. (bronchial$ adj3 dilat$).mp.
7. or/1‐6
Filter to identify RCTs
1. exp "clinical trial [publication type]"/
2. (randomized or randomised).ab,ti.
3. placebo.ab,ti.
4. dt.fs.
5. randomly.ab,ti.
6. trial.ab,ti.
7. groups.ab,ti.
8. or/1‐7
9. Animals/
10. Humans/
11. 9 not (9 and 10)
12. 8 not 11
The MEDLINE strategy and RCT filter are adapted to identify trials in other electronic databases.
Appendix 2. Search strategy to identify relevant trials from the Cochrane Airways Trials Register
#1 BRONCH:MISC1
#2 MeSH DESCRIPTOR Bronchiectasis Explode All
#3 bronchiect*
#4 #1 or #2 or #3
#5 MeSH DESCRIPTOR Anti‐Bacterial Agents Explode 1
#6 antibiotic* or anti‐biotic*
#7 anti‐bacteri* or antibacteri*
#8 *cillin
#9 *mycin or micin*
#10 *oxacin
#11 *tetracycline
#12 macrolide*
#13 quinolone*
#14 trimethoprim
#15 ceph*
#16 sulpha*
#17 #5 or #6 or #7 or #8 or #9 or #10 or #11 or #12 or #13 or #14 or #15 or #16
#18 #4 and #17
[In search line #1, MISC1 denotes the field in the record where the reference has been coded for condition, in this case, bronchiectasis]

Study flow diagram.

Risk of bias summary: review authors' judgements about each risk of bias item for each included study.

Comparison 1 Fluoroquinolones versus β‐lactam (amoxicillin), Outcome 1 Response rate ‐ treatment failure.
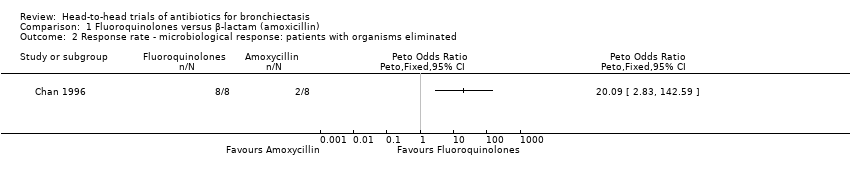
Comparison 1 Fluoroquinolones versus β‐lactam (amoxicillin), Outcome 2 Response rate ‐ microbiological response: patients with organisms eliminated.

Comparison 1 Fluoroquinolones versus β‐lactam (amoxicillin), Outcome 3 Response rate ‐ improvement in sputum purulence (excellent).
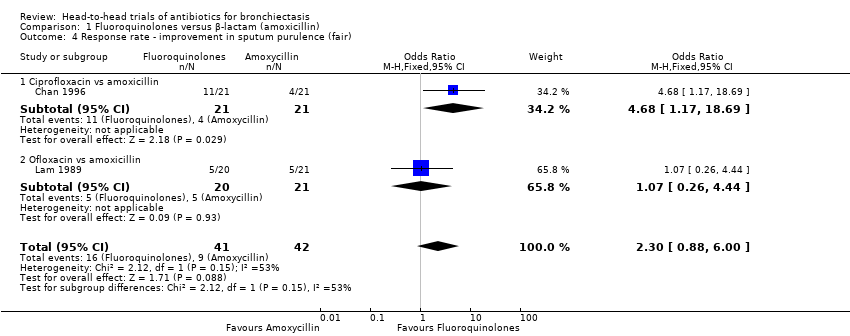
Comparison 1 Fluoroquinolones versus β‐lactam (amoxicillin), Outcome 4 Response rate ‐ improvement in sputum purulence (fair).

Comparison 1 Fluoroquinolones versus β‐lactam (amoxicillin), Outcome 5 Response rate ‐ relapse of sputum purulence at 3‐month follow‐up.
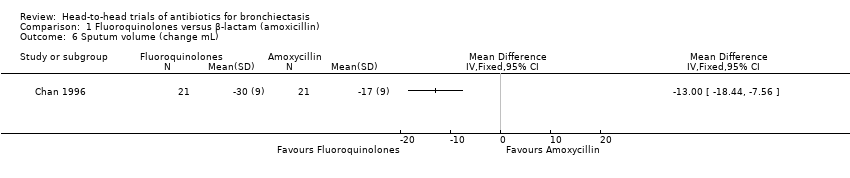
Comparison 1 Fluoroquinolones versus β‐lactam (amoxicillin), Outcome 6 Sputum volume (change mL).
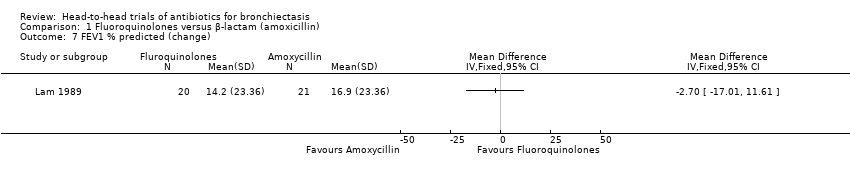
Comparison 1 Fluoroquinolones versus β‐lactam (amoxicillin), Outcome 7 FEV1 % predicted (change).
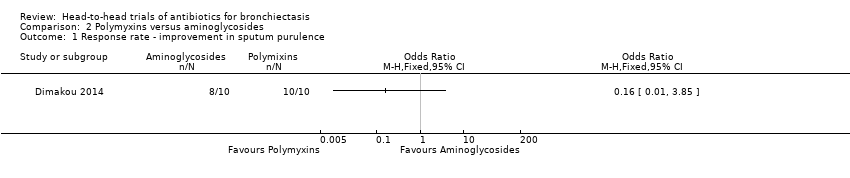
Comparison 2 Polymyxins versus aminoglycosides, Outcome 1 Response rate ‐ improvement in sputum purulence.
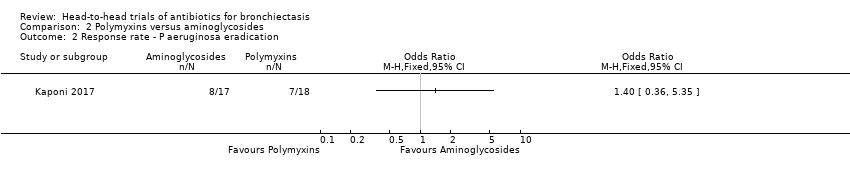
Comparison 2 Polymyxins versus aminoglycosides, Outcome 2 Response rate ‐ P aeruginosa eradication.

Comparison 2 Polymyxins versus aminoglycosides, Outcome 3 Sputum purulence ‐ improvement in score at 3 months.

Comparison 2 Polymyxins versus aminoglycosides, Outcome 4 Adverse events.
| Fluoroquinolones compared to amoxicillin for bronchiectasis: short‐term studies (< 4 weeks) | ||||||
| Patient or population: adults aged 18 years and above with diagnosis of non‐cystic fibrosis bronchiectasis | ||||||
| Outcomes | Anticipated absolute effects* (95% CI) | Relative effect | № of participants | Quality of the evidence | Comments | |
| Risk with amoxicillin | Risk with fluoroquinolones | |||||
| Exacerbations | ‐ | ‐ | Not estimable | ‐ | ‐ | Outcome not reported in included studies |
| Serious adverse events | 0 per 1000 | 0 per 1000 | Not estimable | 83 (2 RCTs) | ⊕⊕⊝⊝ | Evidence graded on the overall quality of the study |
| Response rate ‐ treatment failure | 429 per 1000 | 50 per 1000 | OR 0.07 | 83 | ⊕⊕⊝⊝ | |
| Response rate ‐ microbiological response | 2 out of 8 participants responded. | 8 out of 8 participants responded. | Peto OR 20.09 (2.83 to 142.59) | 16 | ⊕⊕⊝⊝ | Small single study. Peto OR used owing to 100% response in intervention arm |
| Response rate ‐ improvement in sputum purulence (excellent) | 357 per 1000 | 566 per 1000 | OR 2.35 | 83 | ⊕⊝⊝⊝ | |
| Deaths | 0 per 1000 | 0 per 1000 | Not estimable | 83 (2 RCTs) | ⊕⊕⊝⊝ | No deaths reported. Evidence graded on the overall quality of the study |
| Quality of life | ‐ | ‐ | Not estimable | ‐ | ‐ | Outcome not reported in included studies |
| *The risk in the intervention group (and its 95% confidence interval) is based on the assumed risk in the comparison group and the relative effect of the intervention (and its 95% CI). | ||||||
| GRADE Working Group grades of evidence. | ||||||
| aOne point deducted in relation to design and implementation of available studies suggesting likelihood of bias (unclear generation of randomisation sequence, potential selective reporting bias, and risk of other bias in Lam 1989). bOne point deducted for imprecision (small sample size and few events). cOne point deducted for imprecision (wide confidence interval). | ||||||
| Polymyxins compared to aminoglycosides for bronchiectasis: long‐term studies (≥ 4 weeks) | ||||||
| Patient or population: adults aged 18 years and above with diagnosis of bronchiectasis | ||||||
| Outcomes | Anticipated absolute effects* (95% CI) | Relative effect | № of participants | Quality of the evidence | Comments | |
| Risk with aminoglycosides | Risk with polymyxins | |||||
| Exacerbation | ‐ | ‐ | Not estimable | ‐ | ‐ | Outcome not reported in included studies |
| Serious adverse events | 0 per 1000 | 0 per 1000 | Not estimable | 20 (1 RCT) | ⊕⊝⊝⊝ | Evidence graded on the overall quality of the study |
| Response rate ‐ improvement in sputum purulence | 800 per 1000 | 390 per 1000 (38 to 939) | OR 0.16 (0.01 to 3.85) | 20 | ⊕⊝⊝⊝ | Definition of improvement not reported |
| Response rate ‐ P aeruginosa eradication | 471 per 1000 | 554 per 1000 (242 to 826) | OR 1.40 (0.36 to 5.35) | 35 (1 RCT) | ⊕⊝⊝⊝ | Head‐to‐head comparison not reported directly |
| Deaths | 0 per 1000 | 0 per 1000 | Not estimable | 20 | ⊕⊝⊝⊝ | No deaths reported. Evidence graded on the overall quality of the study |
| Quality of life | ‐ | ‐ | Not estimable | ‐ | ‐ | Outcome not reported in included studies |
| *The risk in the intervention group (and its 95% confidence interval) is based on the assumed risk in the comparison group and the relative effect of the intervention (and its 95% CI). | ||||||
| GRADE Working Group grades of evidence. | ||||||
| aOne point deducted in relation to design and implementation of available studies suggesting likelihood of bias (all study methods unclear). bOne point deducted for indirectness (no direct head‐to‐head comparisons). cOne point deducted for imprecision (small sample size and few events). dOne point deducted for imprecision (wide confidence intervals). | ||||||
| Study | Adults/ Children (N) | Arm 1 | Arm 2 | Arm 3 | Duration | ||||||
| Antibiotic (N) | Dose/ Frequency | Mode of delivery | Antibiotic (N) | Dose/ Frequency | Mode of delivery | Comparison (N) | Dose/ Frequency | Mode of delivery | |||
| Fluoroquinolones vs β‐lactams (amoxicillin) | |||||||||||
| Adults (42) | Ciprofloxacin (plus amoxicillin placebo) (21) | 500 mg 3 times daily | Oral | Amoxicillin (plus ciprofloxacin placebo) (21) | 1000 mg 3 times daily | Oral | ‐ | ‐ | ‐ | 7 days | |
| Adults (41) | Ofloxacin (plus amoxicillin placebo) (20) | 200 mg 3 times daily | Oral | Amoxicillin (plus (21) | 1000 mg 3 times daily | Oral | ‐ | ‐ | ‐ | 10 days | |
| Aminoglycosides vs polymyxins | |||||||||||
| Adults (29) | Tobramycin (10) | 300 mg twice daily | Inhalation by nebuliser | 1 MU colistimethate sodium (10) | 300 mg twice daily | Inhalation by nebuliser | Saline solution (9) | 4 mL of 0.9% solution | Inhalation by nebuliser | 4 weeks | |
| Adults (52) | Tobramycin (17) | 300 mg twice daily | Inhalation by nebuliser | 1 MU colistimethate sodium (18) | 300 mg twice daily | Inhalation by nebuliser | Saline solution (17) | 4 mL of 0.9% solution | Inhalation by nebuliser | 3 months | |
| N: number of participants. | |||||||||||
| Outcome or subgroup title | No. of studies | No. of participants | Statistical method | Effect size |
| 1 Response rate ‐ treatment failure Show forest plot | 2 | 83 | Odds Ratio (M‐H, Fixed, 95% CI) | 0.07 [0.01, 0.32] |
| 1.1 Ciprofloxacin | 1 | 42 | Odds Ratio (M‐H, Fixed, 95% CI) | 0.06 [0.01, 0.49] |
| 1.2 Ofloxacin | 1 | 41 | Odds Ratio (M‐H, Fixed, 95% CI) | 0.09 [0.01, 0.77] |
| 2 Response rate ‐ microbiological response: patients with organisms eliminated Show forest plot | 1 | Peto Odds Ratio (Peto, Fixed, 95% CI) | Totals not selected | |
| 3 Response rate ‐ improvement in sputum purulence (excellent) Show forest plot | 2 | 83 | Odds Ratio (M‐H, Fixed, 95% CI) | 2.35 [0.96, 5.72] |
| 3.1 Ciprofloxacin vs amoxicillin | 1 | 42 | Odds Ratio (M‐H, Fixed, 95% CI) | 1.5 [0.43, 5.25] |
| 3.2 Ofloxacin vs amoxicillin | 1 | 41 | Odds Ratio (M‐H, Fixed, 95% CI) | 3.79 [1.03, 13.91] |
| 4 Response rate ‐ improvement in sputum purulence (fair) Show forest plot | 2 | 83 | Odds Ratio (M‐H, Fixed, 95% CI) | 2.30 [0.88, 6.00] |
| 4.1 Ciprofloxacin vs amoxicillin | 1 | 42 | Odds Ratio (M‐H, Fixed, 95% CI) | 4.68 [1.17, 18.69] |
| 4.2 Ofloxacin vs amoxicillin | 1 | 41 | Odds Ratio (M‐H, Fixed, 95% CI) | 1.07 [0.26, 4.44] |
| 5 Response rate ‐ relapse of sputum purulence at 3‐month follow‐up Show forest plot | 1 | Odds Ratio (M‐H, Fixed, 95% CI) | Totals not selected | |
| 6 Sputum volume (change mL) Show forest plot | 1 | Mean Difference (IV, Fixed, 95% CI) | Totals not selected | |
| 7 FEV1 % predicted (change) Show forest plot | 1 | Mean Difference (IV, Fixed, 95% CI) | Totals not selected | |
| Outcome or subgroup title | No. of studies | No. of participants | Statistical method | Effect size |
| 1 Response rate ‐ improvement in sputum purulence Show forest plot | 1 | Odds Ratio (M‐H, Fixed, 95% CI) | Totals not selected | |
| 2 Response rate ‐ P aeruginosa eradication Show forest plot | 1 | Odds Ratio (M‐H, Fixed, 95% CI) | Totals not selected | |
| 3 Sputum purulence ‐ improvement in score at 3 months Show forest plot | 1 | Mean Difference (IV, Fixed, 95% CI) | Totals not selected | |
| 4 Adverse events Show forest plot | 1 | Odds Ratio (M‐H, Fixed, 95% CI) | Totals not selected | |