Inibidores da renina versus inibidores da enzima de conversão da angiotensina (ACE) para hipertensão primária
Abstract
Background
Renin inhibitors (RIs) reduce blood pressure more than placebo, with the magnitude of this effect thought to be similar to that for angiotensin converting enzyme (ACE) inhibitors. However, a drug's efficacy in lowering blood pressure cannot be considered as a definitive indicator of its effectiveness in reducing mortality and morbidity. The effectiveness and safety of RIs compared to ACE inhibitors in treating hypertension is unknown.
Objectives
To evaluate the benefits and harms of renin inhibitors compared to ACE inhibitors in people with primary hypertension.
Search methods
The Cochrane Hypertension Group Information Specialist searched the following databases for randomized controlled trials up to August 2020: the Cochrane Hypertension Specialized Register, the Cochrane Central Register of Controlled Trials (CENTRAL), MEDLINE (from 1946), Embase (from 1974), the World Health Organization International Clinical Trials Registry Platform, and ClinicalTrials.gov. We also contacted authors of relevant papers about further published and unpublished work. The searches had no language restrictions.
Selection criteria
We included randomized, active‐controlled, double‐blinded studies (RCTs) with at least four weeks follow‐up in people with primary hypertension, which compared renin inhibitors with ACE inhibitors and reported morbidity, mortality, adverse events or blood pressure outcomes. We excluded people with proven secondary hypertension.
Data collection and analysis
Two review authors independently selected the included trials, evaluated the risks of bias and entered the data for analysis.
Main results
We include 11 RCTs involving 13,627 participants, with a mean baseline age from 51.5 to 74.2 years. Follow‐up duration ranged from four weeks to 36.6 months.
There was no difference between RIs and ACE inhibitors for the outcomes: all‐cause mortality: risk ratio (RR) 1.05, 95% confidence interval (CI) 0.93 to 1.18; 5 RCTs, 5962 participants; low‐certainty evidence; total myocardial infarction: RR 0.86, 95% CI 0.22 to 3.39; 2 RCTs, 957 participants; very low‐certainty evidence; adverse events: RR 0.98, 95% CI 0.93 to 1.03; 10 RTCs, 6007 participants; moderate‐certainty evidence; serious adverse events: RR 1.21, 95% CI 0.89 to 1.64; 10 RTCs, 6007 participants; low‐certainty evidence; and withdrawal due to adverse effects: RR 0.85, 95% CI 0.68 to 1.06; 10 RTCs, 6008 participants; low‐certainty evidence. No data were available for total cardiovascular events, heart failure, stroke, end‐stage renal disease or change in heart rate. Low‐certainty evidence suggested that RIs reduced systolic blood pressure: mean difference (MD) −1.72, 95% CI −2.47 to −0.97; 9 RCTs, 5001 participants; and diastolic blood pressure: MD −1.18, 95% CI −1.65 to −0.72; 9 RCTs, 5001 participants, to a greater extent than ACE inhibitors, but we judged this to be more likely due to bias than a true effect.
Authors' conclusions
For the treatment of hypertension, we have low certainty that renin inhibitors (RI) and angiotensin converting enzyme (ACE) inhibitors do not differ for all‐cause mortality and myocardial infarction. We have low to moderate certainty that they do not differ for adverse events. Small reductions in blood pressure with renin inhibitors compared to ACE inhibitors are of low certainty. More independent, large, long‐term trials are needed to compare RIs with ACE inhibitors, particularly assessing morbidity and mortality outcomes, but also on blood pressure‐lowering effect.
PICO
Resumo para leigos
Como os inibidores da renina (IR) se comparam aos inibidores da enzima conversora da angiotensina (ACE) para o tratamento da hipertensão
Pergunta da revisão
Determinamos como os inibidores da renina (RIs) se comparam aos inibidores da enzima conversora da angiotensina (ACE) no tratamento da hipertensão.
Introdução
A hipertensão é um desafio de saúde pública mundial associado a altos níveis de ocorrência e riscos de doenças circulatórias e renais. Os IR foram introduzidos no uso clínico para hipertensão em 2007. Os inibidores da ECA são amplamente prescritos para hipertensão. No entanto, a eficácia e segurança comparativas de IR e inibidores da ECA não são conhecidas.
Período de pesquisa
Procuramos por evidência até agosto de 2020.
Características do estudo
Incluímos estudos randomizados, com controle ativo e duplamente cegos (RCTs) para esta revisão. Incluímos 11 RCTs envolvendo 13.627 participantes, com idade média de 51 a 74 anos. A duração do seguimento variou entre quatro semanas e 36 meses.
Principais resultados e certeza das evidências
Evidências de baixa certeza não mostraram diferença entre IR e inibidores da ECA para morte por qualquer causa, para ataques cardíacos, para efeitos adversos graves ou para abandonar o estudo por causa de efeitos adversos. Evidências de baixa certeza sugeriram que os IR reduzem a pressão arterial mais do que os inibidores da ECA, mas isso pode ter sido resultante a um viés no desenho e na condução dos estudos. São necessários mais ensaios clínicos randomizados independentes para avaliar doenças e mortes e para ver se a diferença na redução da pressão arterial é real.
Authors' conclusions
Summary of findings
| Renin inhibitors compared to ACE inhibitors for primary hypertension | |||||
| Patient or population: people with primary hypertension | |||||
| Outcomes | № of participants | Certainty of the evidence | Relative effect | Anticipated absolute effects* (95% CI) | |
|---|---|---|---|---|---|
| Risk with ACE inhibitors | Risk difference with Renin inhibitors | ||||
| All‐cause mortality | 5962 | ⊕⊕⊝⊝ | RR 1.05 | Study population | |
| 131 per 1000 | 7 more per 1,000 | ||||
| Fatal or non‐fatal myocardial infarction | 957 | ⊕⊝⊝⊝ | RR 0.86 | Study population | |
| 7 per 1000 | 1 fewer per 1000 | ||||
| Adverse events | 6007 | ⊕⊕⊕⊝ | RR 0.98 | Study population | |
| 489 per 1000 | 10 fewer per 1000 | ||||
| Fatal or non‐fatal serious adverse events | 6007 | ⊕⊕⊝⊝ | RR 1.21 | Study population | |
| 27 per 1000 | 6 more per 1000 | ||||
| Withdrawal due to adverse effects (WDAE) | 6008 | ⊕⊕⊝⊝ | RR 0.85 | Study population | |
| 60 per 1000 | 9 fewer per 1000 | ||||
| SBP | 5001 | ⊕⊕⊝⊝ | ‐ | ‐ | MD 1.72 mm Hg lower |
| DBP | 5001 | ⊕⊕⊝⊝ | ‐ | ‐ | MD 1.18 lower |
| *The risk in the intervention group (and its 95% confidence interval) is based on the assumed risk in the comparison group and the relative effect of the intervention (and its 95% CI). | |||||
| GRADE Working Group grades of evidence | |||||
| aDowngraded due to high risk of source of funding bias. | |||||
Background
Description of the condition
Hypertension is an important worldwide public‐health challenge associated with high frequency and concomitant risks of cardiovascular and kidney disease. An estimated 29.8% of the world's adult population had hypertension in 2010 (Mills 2015). Despite considerable improvement in raising awareness, treatment and control of hypertension, undiagnosed and uncontrolled hypertension among minority groups remains a challenge (Egan 2014).
Description of the intervention
Orally‐active renin inhibitors (RIs) were developed in the 1980s, and one such drug, aliskiren, was introduced into clinical use for treatment of hypertension in 2007 (Musini 2017). Angiotensin converting enzyme (ACE) inhibitors are widely prescribed for the treatment of primary hypertension (Wang 2014).
How the intervention might work
Excessive activation of the renin‐angiotensin system (RAS) has long been known to be associated with the pathophysiology of hypertension (Ferrario 1990). ACE inhibitors and RIs inhibit the RAS but have different sites of action; ACE inhibitors inhibit the conversion of angiotensin I to angiotensin II, while the RIs block enzymatic action of renin, the conversion of angiotensinogen to angiotensin I.
Although pharmacologic manipulation of the RAS with ACE inhibitors has proven effective in the treatment of hypertension and related end‐organ damage, it provides only partial protection from disease progression (Ennezat 2000). This might be attributable to the limitations of ACE inhibitors. Possible mechanisms for the limitations include firstly, interruption of negative feedback of renin release and a compensatory increase in renin and angiotensin I levels, which can overcome ACE inhibition; or secondly, the production of angiotensin II by non‐ACE pathways (Epstein 2012). ACE inhibitors also potentiate bradykinin levels, which are associated with cough and angioneurotic edema (Nussberger 1998).
Renin controls the first and rate‐limiting step in the activation of the RAS. By decreasing plasma renin activity and inhibiting the conversion of angiotensinogen to angiotensin I, it has been proposed that RIs might provide a more effective means of blocking the RAS (Skeggs 1957).
Why it is important to do this review
Guidelines, such as ESC/ESH 2018 and JNC8 2014, recommend ACE inhibitors as first‐line therapy for hypertension, while the position of RIs in hypertension pharmacotherapy is still unclear. Recent meta‐analyses have shown that RIs have a favorable tolerability profile in people with mild‐to‐moderate hypertension (Weir 2007; White 2010). Moreover, a Cochrane Review has demonstrated that RIs reduce blood pressure (BP) more than placebo, and that the magnitude of this effect is similar to that for ACE inhibitors (Heran 2008; Musini 2017). However, a drug's efficacy in lowering blood pressure cannot be considered as a definitive indicator of its effectiveness in reducing mortality and morbidity. To investigate the effectiveness and safety of renin inhibitors compared to ACE inhibitors, the most reliable method is head‐to‐head RCTs.
We have published a Cochrane Review evaluating the benefits and harms of first‐line RAS inhibitors as an overall group compared to other first‐line antihypertensive drugs, and have shown that RAS inhibitors reduce adverse cardiovascular events more than calcium channel blockers and beta blockers (Xue 2015). There is a Cochrane Review comparing angiotensin receptor blockers (ARBs) to ACE inhibitors (Li 2014). However, there is currently no Cochrane Review comparing the effectiveness and safety of RIs with ACE inhibitors. This review therefore aims to compare RIs with ACE inhibitors for their effects on mortality and morbidity, and for their safety profiles in people with primary hypertension.
Objectives
To evaluate the efficacy and safety of renin inhibitors compared to ACE inhibitors in people with primary hypertension.
Methods
Criteria for considering studies for this review
Types of studies
Studies must be double‐blind randomized controlled trials (DBRCTs) with a parallel design, randomizing participants to the renin inhibitor group or the ACE inhibitor group, and must have a duration of at least four weeks.
Types of participants
We included people with primary hypertension, and excluded people with proven secondary hypertension.
Diagnostic criteria for primary hypertension:
-
Office blood pressure (BP): systolic BP ≥ 140 mmHg or diastolic BP ≥ 90 mmHg, or both.
-
Ambulatory BP: daytime systolic BP ≥ 135 mmHg or diastolic BP ≥ 85 mmHg, or both; night‐time systolic BP ≥ 120 mmHg or diastolic BP ≥ 70 mmHg, or both; 24‐hour systolic BP ≥ 130 mmHg or diastolic BP ≥ 80 mmHg, or both.
Types of interventions
Invervention: any renin inhibitor. These include: aliskiren, ciprokiren, ditekiren, enalkiren, remikiren, rasilez, tekturna, terlakiren and zankiren.
Control: any ACE inhibitor. These include: alacepril, altiopril, benazepril, captopril, ceranapril, ceronapril, cilazapril, deacetylalacepril, delapril, derapril, enalapril, enalaprilat, epicaptopril, fasidotril, fosinopril, foroxymithine, gemopatrilat, idapril, imidapril, indolapril, libenzapril, lisinopril, moexipril, moveltipril, omapatrilat, pentopril, perindopril, pivopril, quinapril, ramipril, rentiapril, s‐nitrosocaptopril, spirapril, temocapril, teprotide, trandolapril, utibapril, zabicipril, and zofenopril.
Types of outcome measures
Mortality and morbidity outcomes (see below) are considered most important. Change in blood pressure is less important.
Primary outcomes
-
All‐cause mortality
-
Total cardiovascular events:
-
fatal or non‐fatal myocardial infarction
-
fatal or non‐fatal stroke
-
fatal congestive heart failure
-
hospitalizations for congestive heart failure
-
-
End‐stage renal disease (ESRD)
-
Withdrawal due to adverse effects (WDAE)
-
Fatal or non‐fatal serious adverse events (SAEs)
-
Adverse events (AEs)
Secondary outcomes
-
Individual cardiovascular events
-
Change in systolic and diastolic BP
-
Change in heart rate
Search methods for identification of studies
Electronic searches
The Cochrane Hypertension Information Specialist searched the following databases from date of inception for published, unpublished, and ongoing studies:
-
the Cochrane Hypertension Specialized Register via the Cochrane Register of Studies (searched 5 August 2020);
-
the Cochrane Central Register of Controlled Trials (CENTRAL 2020, Issue 7) via the Cochrane Register of Studies (searched 5 August 2020);
-
MEDLINE Ovid (from 1946 onwards), MEDLINE Ovid Epub Ahead of Print, and MEDLINE Ovid In‐Process & Other Non‐Indexed Citations (searched 5 August 2020);
-
Embase Ovid (from 1974 onwards; searched 4 August 2020);
-
ClinicalTrials.gov (www.clinicaltrials.gov; searched 4 August 2020);
-
World Health Organization International Clinical Trials Registry Platform (www.who.it.trialsearch; searched 5 August 2020).
The Information Specialist modelled subject strategies for databases on the search strategy designed for MEDLINE. Where appropriate, they were combined with subject strategy adaptations of the highly sensitive search strategy designed by Cochrane for identifying randomized controlled (as described in the Cochrane Handbook for Systematic Reviews of Interventions Version 6.1.0 (Lefebvre 2020)). We present search strategies for major databases in Appendix 1. We have combined searches for this review with the related review Renin inhibitors versus angiotensin receptor blockers for primary hypertension.
Searching other resources
-
The Hypertension Information Specialist searched the Hypertension Specialized Register segment (which includes searches of MEDLINE and Epistemonikos for systematic reviews) to retrieve published systematic reviews related to this review title, so that we could scan their reference lists to identify additional relevant trials.
-
We checked the bibliographies of included studies and any relevant systematic reviews identified for further references to relevant trials.
-
We did not perform a separate search for adverse effects of interventions used for the treatment of hypertension. We will consider adverse effects described in included studies only.
Data collection and analysis
Selection of studies
Two review authors (GMW and LJL) independently examined the titles and abstracts of citations identified by the electronic searches for possible inclusion. We retrieved full‐text publications of potentially relevant studies and two review authors (GMW and LJL) then independently determined study eligibility. We resolved disagreements about study eligibility by discussion and, if necessary, a third review author (WLT) would arbitrate.
Data extraction and management
Two review authors (GMW and LJL) independently extracted data using a standard form, and then cross‐checked. A third review author (WLT) confirmed all numeric calculations and graphic interpolations. We resolved any discrepancies by consensus.
Assessment of risk of bias in included studies
The review authors (GMW and LJL) independently used the Cochrane 'Risk of bias' tool to categorize studies as having low, unclear, or high risk of bias for sequence generation, allocation sequence concealment, loss of blinding, selective reporting, incomplete reporting of outcomes, and other potential sources of bias (Higgins 2011).
Measures of treatment effect
We based quantitative analysis of outcomes on intention‐to‐treat principles when possible. For dichotomous outcomes, we expressed results as a risk ratio (RR) with a 95% confidence interval (CI). For combining continuous variables, we used the mean difference (MD) with a 95% CI, whereby the studies are weighted according to the number of participants in the study and the within‐study variance.
Unit of analysis issues
The unit of analysis was the individual trial. For trials having more than two arms, we only included arms relevant to this review. Where studies included more than one intervention group with a single comparator arm, we included both intervention groups.
Dealing with missing data
If the included studies had information missing, we contacted investigators (using email, letter or fax) to obtain the missing information. When studies did not report a within‐study variance for the effect change of continuous data, we imputed the standard deviation (SD) using the following hierarchy:
-
Pooled SD calculated either from the t‐statistic corresponding to an exact P value reported, or from the 95% CI of the mean difference between treatment group and comparative group;
-
SD at the end of treatment;
-
SD at baseline;
-
Weighted mean SD of change calculated from at least three other trials using the same class of drug (at any dose).
Assessment of heterogeneity
We considered a P value of 0.10 or less from the Chi2 test as statistically significant for heterogeneity (Deeks 2020). We also used the I2 statistic for quantifying inconsistency across studies, following the rough guide to interpretation as described in Deeks 2020:
-
0% to 40%: might not be important;
-
30% to 60%: may represent moderate heterogeneity;
-
50% to 90%: may represent substantial heterogeneity;
-
75% to 100%: considerable heterogeneity.
Assessment of reporting biases
We used funnel plots to investigate publication reporting bias when suspected. As a rule of thumb, tests for funnel plot asymmetry should be used only when there are at least 10 studies included in the meta‐analysis, because when there are fewer studies the power of the tests is too low to distinguish chance from real asymmetry.
Data synthesis
We conducted data synthesis and analyses using Cochrane Review Manager 5 software (Review Manager 2020). We describe data results in tables and forest plots. We also give full details of all studies we include and exclude.
Where we identify statistically significant heterogeneity, we use a random‐effects model for meta‐analysis. Since a random‐effects model can overemphasize smaller studies, we planned a sensitivity analysis to gauge the effects of using a random‐effects model versus a fixed‐effect model on the observed intervention effect.
Subgroup analysis and investigation of heterogeneity
If appropriate, we would perform subgroup analyses.
Heterogeneity among participants could be related to: gender, age, baseline blood pressure, high‐risk participants, participants with comorbid conditions, or participants with a previous history of cardiovascular morbidity and renal disease.
Heterogeneity in treatments could be related to: form of drugs, dosage of drugs, or duration of therapy.
Sensitivity analysis
If appropriate, we would test the robustness of the results using several sensitivity analyses, including:
-
Trials that were industry‐sponsored versus non‐industry sponsored;
-
Trials with reported standard deviations of effect change versus imputed standard deviations;
-
Trials that have a high risk of bias versus those with a low risk of bias.
Summary of findings and assessment of the certainty of the evidence
We used the GRADE approach (GRADEpro GDT) to assess the quality of the supporting evidence behind each estimate of treatment effect (Schünemann 2011b; Schünemann 2020). We presented key findings of the review, including a summary of the amount of data, the magnitude of the effect size and the overall certainty of the evidence, in summary of findings Table 1. We had preselected the following outcomes for inclusion in summary of findings Table 1:
-
All‐cause mortality
-
Total cardiovascular events*:
-
fatal or non‐fatal myocardial infarction
-
fatal or non‐fatal stroke*
-
fatal congestive heart failure*
-
hospitalizations for congestive heart failure*
-
-
End‐stage renal disease (ESRD)*
-
Withdrawal due to adverse effects (WDAE)
-
Fatal or non‐fatal serious adverse events
-
Adverse events
-
Systolic blood pressure (SBP)
-
Diastolic blood pressure (DBP)
*These outcomes were not shown in the 'Summary of findings' table, due to no data available.
Results
Description of studies
We include 11 studies (15 publications). Nine trials reported BP data; 10 trials reported adverse events (AEs), serious adverse events (SAEs) and withdrawals due to adverse events (WDAEs); five trials reported all‐cause mortality events, and two trials reported fatal or nonfatal myocardial infarction. None of the trials reported total cardiovascular events (myocardial infarction, stroke, congestive heart failure, and hospitalizations for heart failure), hospitalizations for heart failure, stroke, ESRD or change in heart rate.
Results of the search
The results of the search are shown in the PRISMA diagram (Figure 1). Our search revealed 3079 references, which were reduced to 2136 after de‐duplication. After screening titles and abstracts, we obtained 30 full‐text articles. Of these articles, we excluded 14 studies (15 articles) based on them not meeting our inclusion criteria.
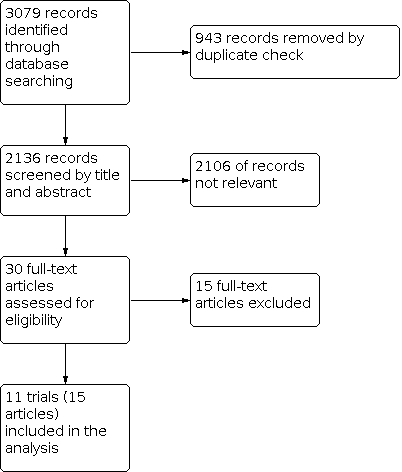
Study flow diagram.
Included studies
See Characteristics of included studies for details.
We include 11 RCTs involving 13,627 participants that were randomized (the total number is different from the sum of numbers of participants given in the meta‐analyses form, due to a subtraction of irrelevant groups from trials). Although aimed at people with heart failure, ATMOSPHERE 2016 was included because over 60% of its participants had hypertension at baseline, and it reported all‐cause mortality data for the hypertension subgroup which contributed to our meta‐analysis.
The mean follow‐up of the 11 RCTs ranged from four weeks to 36.6 months. The four trials with the longest duration were: ATMOSPHERE 2016 (36.6 months), NCT00631917 2011 (54 weeks), AGELESS 2010 (36 weeks) and Andersen 2008 (26 weeks). Most of the RCTs were conducted at multiple centers in various geographic locations (North America, Europe, Asia): ATMOSPHERE 2016, 789 centers in 43 countries; NCT00631917 2011, 115 centers in seven countries; Andersen 2008, 80 centers worldwide; Palatini 2010, 97 centers worldwide; Verdecchia 2007, 62 centers worldwide; Uresin 2007, 125 centers worldwide.
The average age of participants ranged from 51.5 years (Jones‐Burton 2010) to 74.2 years (Verdecchia 2007), with an approximately equal number of women in each arm of the various trials. The mean baseline blood pressure of participants in studies ranged from 146/93 mmHg (Palatini 2010) to 166/91 mmHg (ALIAS 2012). Data obtained were therefore from mild‐to‐moderate hypertension participants. Two RCTs were aimed at hypertensive participants with specific diseases (as inclusion criteria): one targeted chronic heart failure (ATMOSPHERE 2016), and the other type 1 or 2 diabetes mellitus (Uresin 2007). In addition, some of the participants (7% to 58.6%) in several RCTs had co‐morbidities such as diabetes or metabolic syndrome at baseline (AGELESS 2010; Andersen 2008; ATMOSPHERE 2016; NCT00631917 2011; Strasser 2007; Verdecchia 2007; Zhu 2012). See Table 1 for more detail.
| Study ID | N | Follow‐up (weeks) | Mean Age (years) | Co‐morbidity | Intervention | Add‐on drugs | Baseline SBP/DBP (mm Hg) |
|---|---|---|---|---|---|---|---|
| 901 | 36 | T: 72.0 C: 72.2 | Baseline diabetes: aliskiren 21.7%; ramipril 19.6%. | T: Aliskiren 150‐300 mg/day C: Ramipril 5‐10 mg/day | HCTZ 12.5 ‐ 25 mg/day or HCTZ 12.5 ‐ 25 mg/day +amlodipine 5 ‐ 10 mg/day | T: 156.5/85.5 C: 156.6/86.0 | |
| 506 | 8 | T: 60.1 C: 59.8 | NA | T: Aliskiren 150‐300 mg/day C: Ramipril 5‐10 mg/day | None | T: 166.4/89.9 C: 166.3/90.9 | |
| 842 | 26 | T: 53.4 C: 53.1 | Baseline diabetes: aliskiren 10%; ramipril 11.6%. Baseline metabolic syndrome: aliskiren 40.7%; ramipril 43.3%. | T: Aliskiren 150 ‐ 300 mg/day C: Ramipril 5 ‐ 10 mg/day | HCTZ 12.5 ‐ 25 mg/day | T: 151.3/98.8 C: 151.4/98.9 | |
| 7064 | 36.6 months | T: 63.3 C1: 63.3 C2: 63.2 | Heart failure as inclusion criterion; Baseline diabetes: aliskiren 26.8%; enalapril 27.9%; enalapril + aliskiren 28.4% | T: Aliskiren 150 ‐ 300 mg/day C1: Enalapril 5 ‐ 10 mg/day C2: Enalapril 5 ‐ 10 mg/day + Aliskiren 150 ‐ 300 mg/day | Optimal heart failure therapy, including beta blockers, but with the exception of ACE inhibitors | NA Note: Numbers of hypertensive participants at baseline, n(%): T: 1460 (62.4%) C1: 1425 (61.0%) C2: 1447 (61.8%) | |
| 195 | 4 | T1: 52.8 T2: 52.8 C1: 51.5 C2: 53.1 | NA | T1:MK‐8141 250 mg/day T2:MK‐8141 500 mg/day C1: Enalapril 20 mg/day C2: Placebo | None | T1: 150.2/93.8 T2: 149.7/94.2 C1: 150.6/95.1 C2: 151.9/93.6 | |
| 774 | 54 | T: 59.3 C: 59.3 | Baseline diabetes: aliskiren 22.1%; ramipril 25.1%. | T: Aliskiren 150 ‐ 300 mg/day C: Ramipril 5 ‐ 10 mg/day | HCTZ 12.5 ‐ 25 mg/day or HCTZ 12.5 ‐ 25 mg/ay + amlodipine 5 ‐ 10 mg/day | NA | |
| 654 | 9 | T: 53.5 C1: 53.9 C2: 53.4 | NA | T: Aliskiren 150 ‐ 300 mg/day C1: Ramipril 5 ‐ 10 mg/day C2: Irbesartan 150 ‐ 300 mg/day | None | T: 145.5/93 C1:145.8/92.4 C2:145.4/93.0 | |
| 183 | 8 | T: 55.3 C: 55.6 | Baseline diabetes: aliskiren 12.0%; lisinopril 13.8%. Baseline metabolic syndrome: aliskiren 52.8%; lisinopril 58.6% Baseline hypercholesterolemia: aliskiren 16.8%; lisinopril 15.5% | T: Aliskiren 150 ‐ 300 mg/day C: Lisinopril 20 ‐ 40 mg/day | HCTZ 25 mg/day | T: 163.4/108.4 C: 161.7/108.0 | |
| 837 | 8 | T: 60.0 C1: 59.9 C2: 59.5 | Type 1 or 2 diabetes mellitus as inclusion criteria | T: Aliskiren 150 ‐ 300 mg/day C1: Ramipril 5 ‐ 10 mg/day C2: Aliskiren 150 ‐ 300 mg/day+ Ramipril 5 ‐ 10 mg/day | None | T: 157.4/98.4 C1: 155.9/98.2 C2: 156.5/98.4 | |
| 355 | 8 | T1: 73.6 T2: 73.2 T3: 73.0 C: 74.2 | Baseline diabetes: aliskiren 75 mg 13.2%; aliskiren 150 mg 11.9%; aliskiren 300 mg 11.7%; lisinopril 7.0% Baseline metabolic syndrome: aliskiren 75 mg 27.5%; aliskiren 150 mg 22.6%; aliskiren 300 mg 24.5%; lisinopril 23.3% | T1: Aliskiren 75 mg/day T2: Aliskiren 150 mg/day T3: Aliskiren 300 mg/day C: Lisinopril 10 mg/day | None | T1: 160.4/88.0 T2: 160.2/89.3 T3: 160.7/90.1 C: 161.4/88.1 | |
| 1316 | 8 | T1: 52.7 T2: 53.3 T3: 53.8 C: 52.9 | Baseline diabetes: aliskiren 75 mg 10.5%; aliskiren 150 mg 9.6%; aliskiren 300 mg 10.9%; ramipril 5 mg 15.2%. | T1: Aliskiren 75 mg/day T2: Aliskiren 150 mg/day T3: Aliskiren 300 mg/day C: Ramipril 5 mg/day | None | T1: 147.3/98.9 T2: 146.8/98.5 T3: 148.9/98.9 C1: 148.5/98.8 |
C: control group; DBP: diastolic blood pressure; HCTZ: hydrochlorothiazide; N: total number of participants randomized in each trial; T: test group; NA: not available; SBP: systolic blood pressure
ACE inhibitors included enalapril (Jones‐Burton 2010; ATMOSPHERE 2016), lisinopril (Verdecchia 2007) and ramipril (AGELESS 2010; ALIAS 2012; Andersen 2008; NCT00631917 2011; Uresin 2007). RIs included MK‐8141 (Jones‐Burton 2010) and aliskiren (all other trials). Four RCTs allowed hydrochlorothiazide or amlodipine or both as add‐on medications to their treatment regimen in order to control BP (AGELESS 2010; Andersen 2008; NCT00631917 2011; Strasser 2007). Three studies had multiple‐dose groups for RIs. Jones‐Burton 2010 had two arms of MK‐8141 at dose 250 mg/day and 500 mg/day respectively. Verdecchia 2007 and Zhu 2012 both had three arms of aliskiren at dose 75, 150 and 300 mg/day respectively. We combined the data from different dose RIs groups from those studies to create a single pair‐wise comparison.
Excluded studies
See Characteristics of excluded studies for details.
We have excluded two potentially eligible studies in the phase of full‐text review, since no information on hypertensive participants was provided (ESCAPE‐SHF 2011; Kiowski 1994). However, we included ATMOSPHERE 2016 in our analyses because it reported all‐cause mortality data on the hypertensive subgroup. Four studies did not report outcomes pertinent to this review (Azizi 1994; Burnier 2011; Fisher 1994; Tsygankova 2012). Three studies were not parallel design (Fisher 1994; Lizakowski 2012; Quinn 2010), and three studies were not blinded (Fogari 2013; Makówka 2012; Virdis 2012). One study (NCT01151410 2015) was aimed at pediatric hypertension, and was excluded because the diagnostic criteria for pediatric hypertension differed from those for adults. In addition, Zeymer 2012 was excluded as a non‐interventional study.
Risk of bias in included studies
See Characteristics of included studies and 'Risk of bias' graph (Figure 2) for more details.

Risk of bias summary: review authors' judgements about each risk of bias item for each included study.
All included studies were double‐blind randomized control trials at low or unclear risk of bias for allocation, blinding, incomplete outcome data and selective reporting, but with high risk of bias for other sources of bias.
Allocation
All included studies reported randomization, but four of them did not mention the sequence generation process (ALIAS 2012; Andersen 2008; NCT00631917 2011; Zhu 2012) and five of them did not provide information about method of allocation concealment (ALIAS 2012; Andersen 2008; Jones‐Burton 2010; NCT00631917 2011; Zhu 2012). In these studies, we deemed selection bias to be unclear. The baseline participant characteristics tables of these studies revealed no significant differences between study arms indicative of inadequate randomization. Seven RCTs (AGELESS 2010; ATMOSPHERE 2016; Jones‐Burton 2010; Palatini 2010; Strasser 2007; Uresin 2007; Verdecchia 2007) are at low risk of bias for the sequence generation process, because they reported adequate sequence generation using computer‐generated random numbers and validated interactive voice response systems that automate random assignment. Six RCTs (AGELESS 2010; ATMOSPHERE 2016; Palatini 2010; Strasser 2007; Uresin 2007; Verdecchia 2007) have low risk of bias for allocation concealment, because they reported the use of a voice‐based computerized randomization system that involved concealed trial‐group assignments.
Blinding
All included studies mentioned blinding, but seven of them (AGELESS 2010; Andersen 2008; ATMOSPHERE 2016; NCT00631917 2011; Palatini 2010; Strasser 2007; Verdecchia 2007) reported using a double‐blind, double‐dummy design, so we deemed them to have a low risk of performance bias. Four studies (ALIAS 2012; Jones‐Burton 2010; Uresin 2007; Zhu 2012) have unclear risk of performance bias as information about blinding of participants and personnel was not provided. Three studies reported using blinding of outcome assessment (ATMOSPHERE 2016; NCT00631917 2011; Strasser 2007). For the remaining eight studies, it was unclear whether outcome assessors were blinded from the time of randomization until release of database lock, so we deemed them to be at unclear risk of detection bias.
Incomplete outcome data
Missing data had been imputed using appropriate methods (intention‐to‐treat analysis), with participant demographics and characteristics at baseline similar between treatment groups in 10 studies, which we judged to be at low risk of attrition bias. One study (Jones‐Burton 2010) accounted for participants lost to follow‐up, and missing data were unlikely to have an impact on the results of the trial.
Selective reporting
Although protocols were not available except for ATMOSPHERE 2016, all studies reported all prespecified outcomes in their Methods, so we judged them as having a low risk of reporting bias.
Other potential sources of bias
Jones‐Burton 2010 was jointly funded by Merck & Co. Inc. and Actelion Pharmaceuticals Ltd. The authors are employees of Merck & Co. Inc. and Actelion Pharmaceuticals Ltd. Novartis, (manufacturer of aliskiren) supported the other 10 trials.
A Cochrane Review (Lundh 2017) has found evidence that industry sponsorship is associated with more favorable results and conclusions, and that this bias is not captured by standard 'Risk of bias' assessments. We therefore rated all the included studies at high risk of bias, with concerns about methodology that might be influenced by vested interests. This is particularly true for the blood pressure outcome.
Effects of interventions
See: Summary of findings 1 Renin inhibitors compared to ACE inhibitors for primary hypertension
All‐cause mortality
Five studies (5962 participants) reported all‐cause mortality (AGELESS 2010; Andersen 2008; ATMOSPHERE 2016; NCT00631917 2011; Uresin 2007). There was no difference between RIs and ACE inhibitors (risk ratio (RR) 1.05, 95% confidence interval (CI) 0.93 to 1.18; Analysis 1.1). There was no evidence of statistical heterogeneity across the trials included for this outcome (P value = 0.79; I2 = 0%).
Myocardial infarction
Two studies (957 participants) reported total myocardial infarction (NCT00631917 2011; Strasser 2007). There was no difference between RIs and ACE inhibitors (RR 0.86, 95% CI 0.22 to 3.39; Analysis 1.2). There was minimal statistical heterogeneity across the trials included for this outcome (P value = 0.21; I2 = 36%).
Adverse events
Pooling of the 10 studies (6007 participants) that reported adverse events showed no difference between RIs and ACE inhibitors (RR 0.98, 95% CI 0.93 to 1.03; Analysis 1.3). There was no significant heterogeneity across trials for this outcome (P value = 0.68, I2 = 0%). Specific reasons for adverse events were available for all studies except one (ALIAS 2012).
Serious adverse events
Ten studies (6007 participants) reported on serious adverse events. We found no difference between RIs and ACE inhibitors (RR 1.21, 95% CI 0.89 to 1.64; Analysis 1.4). There was no significant heterogeneity across trials for this outcome (P value = 0.84, I2 = 0%).
Withdrawals due to AEs
Ten studies (6008 participants) reported on withdrawals due to adverse events (WDAEs). There was no evidence of a difference between RIs and ACE inhibitors for WDAEs (RR 0.85, 95% CI 0.68 to 1.06; Analysis 1.5) with no significant heterogeneity (P value = 0.44, I2 = 0%).
Blood pressure
Nine trials (5001 participants) reported BP data. RIs reduced both systolic blood pressure (SBP) (MD −1.72, 95% CI −2.47 to −0.97; Analysis 1.6) and diastolic blood pressure (DBP) (MD −1.18, 95% CI −1.65 to −0.72; Analysis 1.7) to a greater extent than ACE inhibitors. There was minimal statistical heterogeneity across trials for SBP (P value = 0.14, I2 = 34%) or for DBP (P value = 0.13, I2 = 36%).
Discussion
Summary of main results
This review demonstrates that RIs compared to ACE inhibitors have not been proven to be significantly different for the outcomes all‐cause mortality and myocardial infarction for people with mild‐to‐moderate hypertension. It should be noted that the data for mortality came almost entirely from a subgroup of the ATMOSPHERE 2016 trial, in which all the participants had heart failure plus hypertension. No data were available for total cardiovascular events, hospitalizations for heart failure, stroke, end‐stage renal disease or change in heart rate. We therefore currently have low‐certainty evidence that RIs and ACE inhibitors do not differ for morbidity and mortality outcomes.
There was no significant difference between RIs and ACE inhibitors for adverse events, serious adverse events or withdrawals due to adverse events. We have low‐to‐moderate certainty that RIs and ACE inhibitors are similar for tolerability outcomes.
RIs appeared to reduce SBP and DBP on average more than ACE inhibitors. However, we have graded this finding as low certainty, as there was a high risk of publication bias and in particular source of funding bias for this outcome.
We conducted subgroup analyses to investigate the effect on blood pressure of RIs versus different ACE inhibitors. The overall reduction in blood pressure with aliskiren was limited to the six RCTs comparing it with ramipril. There was no reduction in blood pressure when aliskiren was compared to lisinopril (one RCT) or to enalapril (two RCTs).
All included studies were industry‐sponsored and had similar high risk of bias. The planned sensitivity analysis for industry sponsorship and risk of bias was therefore not possible. Studies with reported standard deviations of effect change yielded similar results for mean changes in systolic and diastolic BP.
Overall completeness and applicability of evidence
Participants in some of the included studies had no co‐morbidities. The data on all‐cause mortality were mainly derived from ATMOSPHERE 2016, which included participants with chronic heart failure. Diabetes and metabolic syndrome were risk factors for participants in some of the included RCTs. This review therefore provides evidence for hypertensive people with or without co‐morbidities such as heart failure or diabetes and metabolic syndrome.
The baseline blood pressures represented in the pooled population largely ranged from mild to moderate hypertension, with average mean baseline blood pressures ranging from 146/93 (SBP/DBP) mmHg (Palatini 2010) to 166/91 (SBP/DBP) mmHg (ALIAS 2012). Our analyses are therefore confined to people whose hypertension is in the mild‐to‐moderate range.
In terms of the drugs represented, most of the data are available for aliskiren, the only marketed renin inhibitor. For trials with multiple dose arms (Zhu 2012; Jones‐Burton 2010; Verdecchia 2007), we combined the data for each dose into a single arm. The results represented were therefore all doses taken together for aliskiren (75 mg to 300 mg) and for MK‐8141 (250 mg to 500 mg). For the ACE inhibitors, the analyses of primary and secondary outcomes included ramipril (5 mg to 10 mg), enalapril (2.5 mg to 40 mg) and lisinopril (10 mg to 40 mg). Our analyses were underpowered to differentiate the effects of different drugs and doses using subgroup analysis.
For people using ACE inhibitors, it is known that a refractory dry cough can lead them to stop medication. In our analyses, RIs had no more adverse events, serious adverse events or WDAEs compared to ACE inhibitors. However, we note that several RCTs reported more cough in the ramipril arms than in the aliskiren arms (Andersen 2008; AGELESS 2010; Zhu 2012).
In this systematic review, we did not find any data on change in heart rate, total cardiovascular events (myocardial infarction, heart failure, stroke), stroke, heart failure or end‐stage renal disease. We need more and larger studies comparing RIs with ACE inhibitors for hypertension treatment.
The results of this review are in line with current clinical guidelines for the initial drug treatment of hypertension that recommend agents that have been shown to reduce clinical events, including ACE inhibitors, angiotensin receptor blockers, thiazide diuretics and calcium channel blockers, with renin inhibitors as secondary agents (ACC/AHA 2017; ISH 2020; ESC/ESH 2018).
Quality of the evidence
See summary of findings Table 1 for details.
The included RCTs were double‐blind, and were at low to high risk of bias. We found no inconsistency across studies in any of the meta‐analyses. The trials contributing to this review were all funded by the manufacturer. Furthermore, we detected possible publication bias in funnel plots (see Figure 3 and Figure 4), although only nine of the 11 RCTs were analyzed. It is therefore possible that the lower blood pressure with the renin inhibitors was achieved by preferentially publishing trials favoring the renin inhibitor. The certainty of evidence for the blood pressure outcomes were therefore downgraded to low, due to the high risk of publication bias and source‐of‐funding bias.

Funnel plot of comparison: 1 Renin inhibitors vs. ACE inhibitors, outcome: 1.6 SBP.

Funnel plot of comparison: 1 Renin inhibitors vs. ACE inhibitors, outcome: 1.7 DBP.
For all‐cause mortality, we downgraded the certainty of evidence to low, because the result was dominated by a hypertensive subgroup of ATMOSPHERE 2016. For myocardial infarction, fatal or non‐fatal serious adverse events and WDAEs, we downgraded the certainty of evidence to very low to low, due to the wide confidence intervals. For adverse events, the certainty of evidence was graded as moderate.
Potential biases in the review process
We assumed that all doses of all drugs within each class for our outcomes of interest were equally effective. This could have biased the blood pressure results against aliskiren, as aliskiren has been shown to have a dose‐related BP‐lowering effect (Musini 2017). With regard to safety, there was no evidence of an increased incidence of adverse events with increasing aliskiren dose (75 mg to 300 mg) (Verdecchia 2007). However, Musini 2017 found a significant increase in diarrhea in the aliskiren 600 mg group; the U.S. Food and Drug Administration (FDA) have approved a revision of the aliskiren label to warn of this overdose risk (Musini 2017). We did not conduct the subgroup analyses to adequately test this assumption, as it would have been underpowered. In addition, to maximize inclusiveness, we included studies with additional BP‐lowering medications (mainly hydrochlorothiazide, amlodipine, etc.) other than study drugs to control BP. We have assumed that this was balanced in each arm. However, it is unknown whether the added BP‐lowering regimens would equally affect outcomes. Unfortunately, there were too few trials for the primary outcomes to assess publication bias.
Agreements and disagreements with other studies or reviews
This systematic review suggests that RIs reduce mean SBP and DBP more than ACE inhibitors, but as explained above we have low certainty for this finding. In contrast, comprehensive Cochrane Reviews of placebo‐controlled data show that the magnitude of the BP‐lowering with RIs is similar to that for ACE inhibitors (Heran 2008; Musini 2017). A non‐Cochrane review (Chen 2013) suggested that aliskiren reduced SBP by a similar amount as ACE inhibitors, but reduced DBP more than ACE inhibitors. More independent trials are needed to establish the weight of evidence.
Findings for all‐cause mortality and myocardial infarction show a lack of statistical significance, and are based on very little data. Equivalence between RIs and ACE inhibitors cannot therefore be established based on the results of this review.
Our review indicates that RIs show a similar incidence of adverse events, serious adverse events and WDAEs as ACE inhibitors. Reviews of short‐term placebo‐controlled trials have shown that aliskiren does not increase withdrawals due to adverse effects, compared to placebo (Musini 2017). These findings suggest that aliskiren could be used for the treatment of hypertension. It is important to remember that regulatory agencies have warned that combined use of angiotensin‐converting enzyme inhibitors, angiotensin II receptor antagonists or aliskiren is not recommended, particularly in people with diabetes or renal impairment (EMA 2014; FDA 2012).

Study flow diagram.

Risk of bias summary: review authors' judgements about each risk of bias item for each included study.

Funnel plot of comparison: 1 Renin inhibitors vs. ACE inhibitors, outcome: 1.6 SBP.

Funnel plot of comparison: 1 Renin inhibitors vs. ACE inhibitors, outcome: 1.7 DBP.

Comparison 1: Renin inhibitors vs. ACE inhibitors, Outcome 1: All‐cause mortality

Comparison 1: Renin inhibitors vs. ACE inhibitors, Outcome 2: Fatal or non‐fatal myocardial infarction

Comparison 1: Renin inhibitors vs. ACE inhibitors, Outcome 3: Adverse events

Comparison 1: Renin inhibitors vs. ACE inhibitors, Outcome 4: Fatal or non‐fatal serious adverse events

Comparison 1: Renin inhibitors vs. ACE inhibitors, Outcome 5: Withdrawal due to adverse effects (WDAE)

Comparison 1: Renin inhibitors vs. ACE inhibitors, Outcome 6: SBP

Comparison 1: Renin inhibitors vs. ACE inhibitors, Outcome 7: DBP
| Renin inhibitors compared to ACE inhibitors for primary hypertension | |||||
| Patient or population: people with primary hypertension | |||||
| Outcomes | № of participants | Certainty of the evidence | Relative effect | Anticipated absolute effects* (95% CI) | |
|---|---|---|---|---|---|
| Risk with ACE inhibitors | Risk difference with Renin inhibitors | ||||
| All‐cause mortality | 5962 | ⊕⊕⊝⊝ | RR 1.05 | Study population | |
| 131 per 1000 | 7 more per 1,000 | ||||
| Fatal or non‐fatal myocardial infarction | 957 | ⊕⊝⊝⊝ | RR 0.86 | Study population | |
| 7 per 1000 | 1 fewer per 1000 | ||||
| Adverse events | 6007 | ⊕⊕⊕⊝ | RR 0.98 | Study population | |
| 489 per 1000 | 10 fewer per 1000 | ||||
| Fatal or non‐fatal serious adverse events | 6007 | ⊕⊕⊝⊝ | RR 1.21 | Study population | |
| 27 per 1000 | 6 more per 1000 | ||||
| Withdrawal due to adverse effects (WDAE) | 6008 | ⊕⊕⊝⊝ | RR 0.85 | Study population | |
| 60 per 1000 | 9 fewer per 1000 | ||||
| SBP | 5001 | ⊕⊕⊝⊝ | ‐ | ‐ | MD 1.72 mm Hg lower |
| DBP | 5001 | ⊕⊕⊝⊝ | ‐ | ‐ | MD 1.18 lower |
| *The risk in the intervention group (and its 95% confidence interval) is based on the assumed risk in the comparison group and the relative effect of the intervention (and its 95% CI). | |||||
| GRADE Working Group grades of evidence | |||||
| aDowngraded due to high risk of source of funding bias. | |||||
| Study ID | N | Follow‐up (weeks) | Mean Age (years) | Co‐morbidity | Intervention | Add‐on drugs | Baseline SBP/DBP (mm Hg) |
|---|---|---|---|---|---|---|---|
| 901 | 36 | T: 72.0 C: 72.2 | Baseline diabetes: aliskiren 21.7%; ramipril 19.6%. | T: Aliskiren 150‐300 mg/day C: Ramipril 5‐10 mg/day | HCTZ 12.5 ‐ 25 mg/day or HCTZ 12.5 ‐ 25 mg/day +amlodipine 5 ‐ 10 mg/day | T: 156.5/85.5 C: 156.6/86.0 | |
| 506 | 8 | T: 60.1 C: 59.8 | NA | T: Aliskiren 150‐300 mg/day C: Ramipril 5‐10 mg/day | None | T: 166.4/89.9 C: 166.3/90.9 | |
| 842 | 26 | T: 53.4 C: 53.1 | Baseline diabetes: aliskiren 10%; ramipril 11.6%. Baseline metabolic syndrome: aliskiren 40.7%; ramipril 43.3%. | T: Aliskiren 150 ‐ 300 mg/day C: Ramipril 5 ‐ 10 mg/day | HCTZ 12.5 ‐ 25 mg/day | T: 151.3/98.8 C: 151.4/98.9 | |
| 7064 | 36.6 months | T: 63.3 C1: 63.3 C2: 63.2 | Heart failure as inclusion criterion; Baseline diabetes: aliskiren 26.8%; enalapril 27.9%; enalapril + aliskiren 28.4% | T: Aliskiren 150 ‐ 300 mg/day C1: Enalapril 5 ‐ 10 mg/day C2: Enalapril 5 ‐ 10 mg/day + Aliskiren 150 ‐ 300 mg/day | Optimal heart failure therapy, including beta blockers, but with the exception of ACE inhibitors | NA Note: Numbers of hypertensive participants at baseline, n(%): T: 1460 (62.4%) C1: 1425 (61.0%) C2: 1447 (61.8%) | |
| 195 | 4 | T1: 52.8 T2: 52.8 C1: 51.5 C2: 53.1 | NA | T1:MK‐8141 250 mg/day T2:MK‐8141 500 mg/day C1: Enalapril 20 mg/day C2: Placebo | None | T1: 150.2/93.8 T2: 149.7/94.2 C1: 150.6/95.1 C2: 151.9/93.6 | |
| 774 | 54 | T: 59.3 C: 59.3 | Baseline diabetes: aliskiren 22.1%; ramipril 25.1%. | T: Aliskiren 150 ‐ 300 mg/day C: Ramipril 5 ‐ 10 mg/day | HCTZ 12.5 ‐ 25 mg/day or HCTZ 12.5 ‐ 25 mg/ay + amlodipine 5 ‐ 10 mg/day | NA | |
| 654 | 9 | T: 53.5 C1: 53.9 C2: 53.4 | NA | T: Aliskiren 150 ‐ 300 mg/day C1: Ramipril 5 ‐ 10 mg/day C2: Irbesartan 150 ‐ 300 mg/day | None | T: 145.5/93 C1:145.8/92.4 C2:145.4/93.0 | |
| 183 | 8 | T: 55.3 C: 55.6 | Baseline diabetes: aliskiren 12.0%; lisinopril 13.8%. Baseline metabolic syndrome: aliskiren 52.8%; lisinopril 58.6% Baseline hypercholesterolemia: aliskiren 16.8%; lisinopril 15.5% | T: Aliskiren 150 ‐ 300 mg/day C: Lisinopril 20 ‐ 40 mg/day | HCTZ 25 mg/day | T: 163.4/108.4 C: 161.7/108.0 | |
| 837 | 8 | T: 60.0 C1: 59.9 C2: 59.5 | Type 1 or 2 diabetes mellitus as inclusion criteria | T: Aliskiren 150 ‐ 300 mg/day C1: Ramipril 5 ‐ 10 mg/day C2: Aliskiren 150 ‐ 300 mg/day+ Ramipril 5 ‐ 10 mg/day | None | T: 157.4/98.4 C1: 155.9/98.2 C2: 156.5/98.4 | |
| 355 | 8 | T1: 73.6 T2: 73.2 T3: 73.0 C: 74.2 | Baseline diabetes: aliskiren 75 mg 13.2%; aliskiren 150 mg 11.9%; aliskiren 300 mg 11.7%; lisinopril 7.0% Baseline metabolic syndrome: aliskiren 75 mg 27.5%; aliskiren 150 mg 22.6%; aliskiren 300 mg 24.5%; lisinopril 23.3% | T1: Aliskiren 75 mg/day T2: Aliskiren 150 mg/day T3: Aliskiren 300 mg/day C: Lisinopril 10 mg/day | None | T1: 160.4/88.0 T2: 160.2/89.3 T3: 160.7/90.1 C: 161.4/88.1 | |
| 1316 | 8 | T1: 52.7 T2: 53.3 T3: 53.8 C: 52.9 | Baseline diabetes: aliskiren 75 mg 10.5%; aliskiren 150 mg 9.6%; aliskiren 300 mg 10.9%; ramipril 5 mg 15.2%. | T1: Aliskiren 75 mg/day T2: Aliskiren 150 mg/day T3: Aliskiren 300 mg/day C: Ramipril 5 mg/day | None | T1: 147.3/98.9 T2: 146.8/98.5 T3: 148.9/98.9 C1: 148.5/98.8 | |
| C: control group; DBP: diastolic blood pressure; HCTZ: hydrochlorothiazide; N: total number of participants randomized in each trial; T: test group; NA: not available; SBP: systolic blood pressure | |||||||
| Outcome or subgroup title | No. of studies | No. of participants | Statistical method | Effect size |
| 1.1 All‐cause mortality Show forest plot | 5 | 5962 | Risk Ratio (M‐H, Fixed, 95% CI) | 1.05 [0.93, 1.18] |
| 1.2 Fatal or non‐fatal myocardial infarction Show forest plot | 2 | 957 | Risk Ratio (M‐H, Fixed, 95% CI) | 0.86 [0.22, 3.39] |
| 1.3 Adverse events Show forest plot | 10 | 6007 | Risk Ratio (M‐H, Fixed, 95% CI) | 0.98 [0.93, 1.03] |
| 1.4 Fatal or non‐fatal serious adverse events Show forest plot | 10 | 6007 | Risk Ratio (M‐H, Fixed, 95% CI) | 1.21 [0.89, 1.64] |
| 1.5 Withdrawal due to adverse effects (WDAE) Show forest plot | 10 | 6008 | Risk Ratio (M‐H, Fixed, 95% CI) | 0.85 [0.68, 1.06] |
| 1.6 SBP Show forest plot | 9 | 5001 | Mean Difference (IV, Fixed, 95% CI) | ‐1.72 [‐2.47, ‐0.97] |
| 1.7 DBP Show forest plot | 9 | 5001 | Mean Difference (IV, Fixed, 95% CI) | ‐1.18 [‐1.65, ‐0.72] |