داروهای ضدالتهابی غیراستروئیدی (NSAIDs) برای دردهای مزمن غیرسرطانی در کودکان و نوجوانان
Appendices
Appendix 1. Meeting for NIHR Programme Grant agenda on pain in children
Date
Monday 1st June 2015
Location
International Association of the Study of Pain (IASP) Conference, Seattle, USA
Delegates
Allen Finlay, Anna Erskine, Boris Zernikow, Chantal Wood, Christopher Eccleston, Elliot Krane, George Chalkaiadis, Gustaf Ljungman, Jacqui Clinch, Jeffrey Gold, Julia Wager, Marie‐Claude Gregoire, Miranda van Tilburg, Navil Sethna, Neil Schechter, Phil Wiffen, Richard Howard, Susie Lord.
Purpose
National Institute for Health Research (NIHR) (UK) Programme Grant ‐ Addressing the unmet need of chronic pain: providing the evidence for treatments of pain.
Proposal
Nine reviews in pharmacological interventions for chronic pain in children and adolescents: Children (5 new, 1 update, 1 overview, and 2 rapid) self‐management of chronic pain is prioritised by the planned NICE guideline. Pain management (young people and adults) with a focus on initial assessment and management of persistent pain in young people and adults.
We propose titles in paracetamol, ibuprofen, diclofenac, other NSAIDs, and codeine, an overview review on pain in the community, 2 rapid reviews on the pharmacotherapy of chronic pain, and cancer pain, and an update of psychological treatments for chronic pain.
Key outcomes
The final titles: (1) opioids for cancer‐related pain (Wiffen 2017a), (2) opioids for chronic non‐cancer pain (Cooper 2017a), (3) antiepileptic drugs for chronic non‐cancer pain (Wiffen 2017b), (4) antidepressants for chronic non‐cancer pain (Cooper 2017b), (5) non‐steroidal anti‐inflammatory drugs (NSAIDs) for chronic non‐cancer pain (Eccleston 2017 ‐ this review), (6) non‐steroidal anti‐inflammatory drugs (NSAIDs) for cancer‐related pain (Cooper 2017c), (7) paracetamol for chronic non‐cancer pain (Cooper 2017d).
PICO
Participants : children, aged 3 to 12, chronic pain defined as pain persisting for 3 months (NB: now changed to: birth to 17 years to include infants, children and adolescents).
Interventions : by drug class including antiepileptic drugs, antidepressants, opioids, NSAIDs, paracetamol.
Comparisons : maintain a separation of cancer and non‐cancer, exclude headache, in comparison with placebo and or active control.
Outcomes : we will adopt the IMMPACT criteria.
Appendix 2. Methodological considerations for chronic pain
There have been several recent changes in how the efficacy of conventional and unconventional treatments is assessed in chronic painful conditions. The outcomes are now better defined, particularly with new criteria for what constitutes moderate or substantial benefit (Dworkin 2008); older trials may only report participants with 'any improvement'. Newer trials tend to be larger, avoiding problems from the random play of chance. Newer trials also tend to be of longer duration, up to 12 weeks, and longer trials provide a more rigorous and valid assessment of efficacy in chronic conditions. New standards have evolved for assessing efficacy in neuropathic pain, and we are now applying stricter criteria for the inclusion of trials and assessment of outcomes, and are more aware of problems that may affect our overall assessment. We summarise some of the recent insights that must be considered in this new review.
-
Pain results tend to have a U‐shaped distribution rather than a bell‐shaped distribution. This is true in acute pain (Moore 2011a; Moore 2011b), back pain (Moore 2010d), and arthritis (Moore 2010c), as well as in fibromyalgia (Straube 2010); in all cases average results usually describe the experience of almost no one in the trial. Data expressed as averages are potentially misleading, unless they can be proven to be suitable.
-
As a consequence, we have to depend on dichotomous results (the individual either has or does not have the outcome) usually from pain changes or participant global assessments. The Initiative on Methods, Measurement, and Pain Assessment in Clinical Trials (IMMPACT) group has helped with their definitions of minimal, moderate, and substantial improvement (Dworkin 2008). In arthritis, trials of less than 12 weeks' duration, and especially those shorter than eight weeks, overestimate the effect of treatment (Moore 2010c); the effect is particularly strong for less effective analgesics, and this may also be relevant in neuropathic‐type pain.
-
The proportion of patients with at least moderate benefit can be small, even with an effective medicine, falling from 60% with an effective medicine in arthritis to 30% in fibromyalgia (Moore 2009; Moore 2010c; Moore 2013b; Moore 2014b; Straube 2008; Sultan 2008). A Cochrane review of pregabalin in neuropathic pain and fibromyalgia demonstrated different response rates for different types of chronic pain (higher in diabetic neuropathy and postherpetic neuralgia and lower in central pain and fibromyalgia) (Moore 2009). This indicates that different neuropathic pain conditions should be treated separately from one another, and that pooling should not be done unless there are good grounds for doing so.
-
Individual patient analyses indicate that patients who get good pain relief (moderate or better) have major benefits in many other outcomes, affecting quality of life in a significant way (Moore 2010b; Moore 2014a).
-
Imputation methods such as last observation carried forward (LOCF), used when participants withdraw from clinical trials, can overstate drug efficacy, especially when adverse event withdrawals with drug are greater than those with placebo (Moore 2012).
Appendix 3. MEDLINE search strategy (via Ovid)
-
exp Child/
-
exp Adolescent/
-
exp Infant/
-
(child* or boy* or girl* or adolescen* or teen* or toddler* or preschooler* or pre‐schooler* or baby or babies or infant*).mp
-
1 or 2 or 3 or 4
-
exp Anti‐Inflammatory Agents, Non‐Steroidal/
-
(aspirin or celecoxib or diclofenac or dipyrone or flurbiprofen, or ibuprofen, or indomet?acin or ketorolac or mefenamic acid or naproxen or nefopam or phenylbutazone or piroxicam or ketoprofen or nimesulide).mp.
-
6 or 7
-
exp Pain/
-
4 and 8 and 9
-
randomized controlled trial.pt.
-
controlled clinical trial.pt.
-
randomized.ab.
-
placebo.ab.
-
drug therapy.fs.
-
randomly.ab.
-
trial.ab.
-
groups.ab.
-
11 or 12 or 13 or 14 or 15 or 16 or 17 or 18
-
10 and 19
Appendix 4. Embase search strategy (via Ovid)
-
exp Child/
-
exp Adolescent/
-
(child* or boy* or girl* or adolescen* or teen* or toddler* or preschooler* or pre‐schooler* or baby or babies or infant*).mp
-
exp Infant/
-
1 or 2 or 3 or 4
-
exp nonsteroid antiinflammatory agent/
-
(aspirin or celecoxib or diclofenac or dipyrone or flurbiprofen, or ibuprofen, or indomet?acin or ketorolac or mefenamic acid or naproxen or nefopam or phenylbutazone or piroxicam or ketoprofen or nimesulide).mp.
-
6 or 7
-
exp Pain/
-
5 and 8 and 9
-
crossover‐procedure/
-
double‐blind procedure/
-
randomized controlled trial/
-
(random* or factorial* or crossover* or cross over* or cross‐over* or placebo* or (doubl* adj blind*) or assign* or allocat*).tw.
-
11 or 12 or 13 or 14
-
10 and 15
Appendix 5. CENTRAL search strategy (via Cochrane Register of Studies Online)
-
MESH DESCRIPTOR Child EXPLODE ALL TREES
-
MESH DESCRIPTOR Adolescent
-
MESH DESCRIPTOR Infant EXPLODE ALL TREES
-
(child* or boy* or girl* or adolescen* or teen* or toddler* or preschooler* or pre‐schooler*or baby or babies or infant*) ):TI,AB,KY
-
#1 OR #2 OR #3 OR #4
-
MESH DESCRIPTOR Anti‐Inflammatory Agents, Non‐SteroidalEXPLODE ALL TREES
-
(aspirin or celecoxib or diclofenac or dipyrone or flurbiprofen, or ibuprofen, or indomet?acin or ketorolac or mefenamic acid or naproxen or nefopam or phenylbutazone or piroxicam or ketoprofen or nimesulide):TI,AB,KY
-
#6 OR #7
-
MESH DESCRIPTOR Pain EXPLODE ALL TREES
-
#5 AND #8 AND #9
Appendix 6. GRADE guidelines
Some advantages of utilising the GRADE process are (Guyatt 2008):
-
transparent process of moving from evidence to recommendations;
-
clear separation between quality of evidence and strength of recommendations;
-
explicit, comprehensive criteria for downgrading and upgrading quality of evidence ratings; and
-
clear, pragmatic interpretation of strong versus weak recommendations for clinicians, participants, and policymakers.
The GRADE system uses the following criteria for assigning grade of evidence:
-
high: we are very confident that the true effect lies close to that of the estimate of the effect;
-
moderate: we are moderately confident in the effect estimate; the true effect is likely to be close the estimate of effect, but there is a possibility that it is substantially different;
-
low: our confidence in the effect estimate is limited; the true effect may be substantially different from the estimate of the effect; and
-
very low: we have very little confidence in the effect estimate; the true effect is likely to be substantially different from the estimate of effect.
We decreased the grade if there was:
-
serious (‐1) or very serious (‐2) limitation to study quality;
-
important inconsistency (‐1);
-
some (‐1) or major (‐2) uncertainty about directness;
-
imprecise or sparse data (‐1); or
-
high probability of reporting bias (‐1).
We increased the grade if there was:
-
strong evidence of association ‐ significant risk ratio of > 2 (< 0.5) based on consistent evidence from two or more observational studies, with no plausible confounders (+1);
-
very strong evidence of association ‐ significant risk ratio of > 5 (< 0.2) based on direct evidence with no major threats to validity (+2);
-
evidence of a dose response gradient (+1); or
-
all plausible confounders would have reduced the effect (+1).
"In addition, there may be circumstances where the overall rating for a particular outcome would need to be adjusted per GRADE guidelines (Guyatt 2013a). For example, if there were so few data that the results were highly susceptible to the random play of chance, or if studies used LOCF imputation in circumstances where there were substantial differences in adverse event withdrawals, one would have no confidence in the result, and would need to downgrade the quality of the evidence by three levels, to very low quality. In circumstances where no data were reported for an outcome, we planned to report the level of evidence as 'no evidence to support or refute' (Guyatt 2013b)."
Appendix 7. Summary of efficacy in individual studies
| Study | Treatment | Pain outcome | Other efficacy outcomes |
| Intervention group (N = 15): indomethacin (2 weeks) then cross‐over to ketoprofen (2 weeks) Control group (N = 15): ketoprofen (2 weeks) then cross‐over to indomethacin (2 weeks) Participants < 20 kg: ketoprofen 25 mg capsule twice daily; participants > 20 kg: ketoprofen capsules x 2 = 50 mg twice daily Participants < 20 kg: indomethacin 25 mg capsule twice daily; participants > 20 kg: indomethacin capsules x 2 = 50 mg twice daily Study duration: 5 weeks | Participant‐reported pain relief of 30% or greater: no data Participant‐reported pain relief of 50% or greater: no data PGIC much or very much improved: no data | Patient Global Impression of Change: no data Carer Global Impression of Change: no data Requirement for rescue analgesia: no data Sleep duration and quality: no data Acceptability of treatment: no data Physical functioning: no data Quality of life: no data | |
| Intervention group (N = 50): fenoprofen 900 mg/m2/d increased to 1800 mg/m2/d, maximum 3200 mg/d Control group (N = 49): aspirin 1500 mg/m2/d increased to 3000 mg/m2/d, maximum 5450 mg/d Study duration: 12 weeks | Participant‐reported pain relief of 30% or greater: ≥ 25% improvement Severity of pain on movement fenoprofen: 23/50 aspirin: 21/49 Severity of limitation of movement fenoprofen: 18/50 aspirin: 16/49 Participant‐reported pain relief of 50% or greater: ≥ 50% improvement Severity of pain on movement fenoprofen: 18/50 aspirin: 15/49 Severity of limitation of movement fenoprofen: 12/50 aspirin: 12/49 PGIC much or very much improved: no data | Patient Global Impression of Change: Patient global assessment of patient response (satisfactory) to therapy fenoprofen: 30/50 aspirin: 24/49 Carer Global Impression of Change: Parent global assessment of patient response (satisfactory) to therapy fenoprofen: 34/50 aspirin: 30/49 Physician global assessment of patient response fenoprofen: 31/50 aspirin: 31/49 Requirement for rescue analgesia: no data Sleep duration and quality: no data Acceptability of treatment: no data Physical functioning: no data Quality of life: no data | |
| Intervention group (N = 77): celecoxib 50 mg/5 mL oral suspension (target dose approximately 3 mg/kg twice daily) Intervention group (N = 82): celecoxib 100 mg/5 mL oral suspension (target dose approximately 6 mg/kg twice daily) Control group (N = 83): naproxen 125 mg/5 mL oral suspension (target dose approximately 7.5 mg/kg twice daily) Study duration: 12 weeks | Participant‐reported pain relief of 30% or greater: ACR Pediatric‐30 responders, n (%) celecoxib 3 mg/kg: 53/77 (68.8%) celecoxib 6 mg/kg: 66/82 (80.5%) naproxen 7.5 mg/kg: 56/83 (67.5%) Participant‐reported pain relief of 50% or greater: no data PGIC much or very much improved: no data | Patient Global Impression of Change: no data Carer Global Impression of Change: Parent global assessment of overall well‐being 100‐millimetre VAS, least squares mean change from baseline (SE) celecoxib 3 mg/kg: ‐17.96 (2.42) celecoxib 6 mg/kg: ‐20.45 (2.34) naproxen 7.5 mg/kg: ‐18.25 (2.33) Physician global assessment of disease activity: 100‐millimetre VAS, least squares mean change from baseline (SE) celecoxib 3 mg/kg: ‐21.07 (1.86) celecoxib 6 mg/kg: ‐23.27 (1.80) naproxen 7.5 mg/kg: ‐21.88 (1.79) Requirement for rescue analgesia: no data Sleep duration and quality: no data Acceptability of treatment: no data Physical functioning: Parent assessment of physical functioning, Child Health Assessment Questionnaire, disability index 0 to 3, least squares mean change from baseline (SE) celecoxib 3 mg/kg: ‐0.28 (0.05) celecoxib 6 mg/kg: ‐0.32 (0.05) naproxen 7.5 mg/kg: ‐0.31 (0.05) Quality of life: Pediatric Quality of Life Inventory All treatment groups improved Pediatric Quality of Life Inventory scores. Scores of participants in the celecoxib 6 mg/kg twice‐daily group or naproxen 7.5 mg/kg twice‐daily group were higher than those of participants in the celecoxib 3 mg/kg twice‐daily group, but results were non‐significant (data not shown in publication). Unclear whether differences are between groups or over time. celecoxib 3 mg/kg: no data celecoxib 6 mg/kg: no data naproxen 7.5 mg/kg: no data | |
| Intervention group (N = 45): ibuprofen suspension (concentration 100 mg/5mL) + placebo aspirin Control group (N = 47): aspirin 200 mg tablet (participant weight 10 to 30 kg) or 300 mg capsules (participant weight > 30 kg) + placebo ibuprofen Week 2: physician's option to increase dose to 40 mg/kg/day ibuprofen or 80 mg/kg/day aspirin, provided no significant side effects Study duration: 12 weeks | Participant‐reported pain relief of 30% or greater: no data Participant‐reported pain relief of 50% or greater: no data PGIC much or very much improved: Patient Global Impression of Change very much improved: ibuprofen: 22/26 (85%) aspirin: 18/20 (90%) Carer Global Impression of Change: ibuprofen: 33/42 (79%) aspirin: 29/35 (83%) Investigator Global Evaluation: ibuprofen: 34/44 (78%) aspirin: 27/35 (77%) | Patient Global Impression of Change: ibuprofen: 22/26 (85%) aspirin: 18/20 (90%) Carer Global Impression of Change: ibuprofen: 33/42 (79%) aspirin: 29/35 (83%) Investigator Global Evaluation: ibuprofen: 34/44 (78%) aspirin: 27/35 (77%) Requirement for rescue analgesia: no data Sleep duration and quality: no data Acceptability of treatment: no data Physical functioning: no data Quality of life: no data | |
| Intervention group (N = 23): naproxen 10 mg/kg/24 hrs given as a suspension in 2 divided doses Control group (N = 23): aspirin soluble 80 mg/kg/day, divided into 4 doses Study duration: 2 x 4 weeks | Participant‐reported pain relief of 30% or greater: no data Participant‐reported pain relief of 50% or greater: no data PGIC much or very much improved: no data | Patient Global Impression of Change: no data Carer Global Impression of Change: no data Requirement for rescue analgesia: no data Sleep duration and quality: no data Acceptability of treatment: Medication preference at end of trial: Naproxen much better: 0 Naproxen better: 9 Both periods equal: 9 Aspirin better: 4 Aspirin much better: 1 Physical functioning: no separate data Quality of life: no data | |
| Intervention group (N = 209): (children) LD rofecoxib 0.3mg/kg/day maximum 12.5mg/day, or HD rofecoxib 0.6mg/kg/day maximum 25 mg/day; (adolescents) rofecoxib 12.5 or 25 mg daily Control group (N = 101): (children) naproxen 15 mg/kg/day 5 mg oral suspension; (adolescents) 15 mg/kg/day maximum 1000 mg/day Study duration: 12 weeks | Participant‐reported pain relief of 30% or greater: ACR Pedi 30% reduction LD rofecoxib: 45/97 (46.2%) HD rofecoxib: 49/90 (54.5%) naproxen: 48/87 (55.1%) Participant‐reported pain relief of 50% or greater: no data PGIC much or very much improved: no data | Patient Global Impression of Change: no data Carer Global Impression of Change: no data Patient/Parent Global Assessment of Pain: mean change from baseline (95% CI) LD rofecoxib: ‐12.50 (‐15.98; ‐9.02) HD rofecoxib: ‐13.12 (‐16.75; ‐9.48) naproxen: ‐8.43 (‐11.98; ‐4.88) Requirement for rescue analgesia: no data Sleep duration and quality: no data Acceptability of treatment: no data Physical functioning: CHAQ index: mean change from baseline (95% CI) LD rofecoxib: ‐0.11 (‐0.18; ‐0.05) HD rofecoxib: ‐0.15 (‐0.21; ‐0.08) naproxen: ‐0.12 (‐0.18; ‐0.05) Quality of life: Patient/parent assessment of overall well‐being:mean change from baseline (95% CI) (proportion of improvement from baseline) LD rofecoxib: ‐11.57 (‐14.78; ‐8.36) (74.3%) HD rofecoxib: ‐12.08 (‐15.44; ‐8.73) (76%) naproxen: ‐8.56 (‐11.85; ‐5.27) (73%) Additional data Investigators' global assessment of disease activity: mean change from baseline (95% CI) LD rofecoxib: ‐12.45 (‐14.95; ‐9.94) HD rofecoxib: ‐13.27 (‐15.88; ‐10.65) naproxen: ‐12.05 (‐14.60; ‐9.50) | |
| Intervention group 1 (N = 73): LD meloxicam 0.125 mg/kg, 1 dose per day Intervention group 2 (N = 74): HD meloxicam 0.25 mg/kg, 1 dose per day Control group (N = 78): naproxen 5 mg/kg, twice per day Study duration: 48 weeks | Participant‐reported pain relief of 30% or greater: @ 3 MONTHS LD meloxicam: 46/73 (63%), 95% CI 52 to 74% HD meloxicam: 43/74 (58%), 95% CI 47 to 69% naproxen: 50/78 (64%), 95% CI 53 to 75% @ 12 MONTHS LD meloxicam: 56/73 (77%), 95% CI 67 to 86% HD meloxicam: 56/74 (76%), 95% CI 66 to 85% naproxen: 58/78 (74%), 95% CI 65 to 84% Participant‐reported pain relief of 50% or greater: @ 3 MONTHS LD meloxicam: 38/73 (52%), 95% CI 41 to 64% HD meloxicam: 32/74 (43%), 95% CI 32 to 55% naproxen: 39/78 (50%), 95% CI 39 to 61% @ 12 MONTHS LD meloxicam: 50/73 (68%), 95% CI 58 to 79% HD meloxicam: 48/74 (65%), 95% CI 54 to 76% naproxen: 53/78 (68%), 95% CI 58 to 78% TOTAL POOLING: P = 0.7 PGIC much or very much improved: no data | Patient Global Impression of Change: no data Participant reported assessment of discomfort (facial affective scale 1 to 9 points): @ 3 MONTHS LD meloxicam: 0.3 ± 0.2 HD meloxicam: 0.4 ± 0.2 naproxen: 0.3 ± 0.2 @ 12 MONTHS LD meloxicam: 0.3 ± 0.2 HD meloxicam: 0.3 ± 0.2 naproxen: 0.2 ± 0.2 Physician global impression of disease activity (VAS 0 to 100): @ 3 MONTHS LD meloxicam: 19.4 ± 20.7 HD meloxicam: 20.6 ± 20.3 naproxen: 21.1 ± 19.2 @ 12 MONTHS LD meloxicam: 15.4 ± 20.5 HD meloxicam: 16.8 ± 19.0 naproxen: 14.4 ± 16.7 Carer Global Impression of Pain (VAS 0 to 100): @ 3 MONTHS LD meloxicam: 17.6 ± 20.2 HD meloxicam: 21.9 ± 23.6 naproxen: 20.8 ± 22.4 @ 12 MONTHS LD meloxicam: 13.4 ± 17.6 HD meloxicam: 17.2 ± 22.5 naproxen: 15.9 ± 21.3 Requirement for rescue analgesia: no data Sleep duration and quality: no data Acceptability of treatment: no data Physical functioning: CHAQ Disability Index (0 to 3 points) @ 3 MONTHS LD meloxicam: 0.4 ± 0.5 HD meloxicam: 0.5 ± 0.6 naproxen: 0.5 ± 0.6 @ 12 MONTHS LD meloxicam: 0.3 ± 0.4 HD meloxicam: 0.4 ± 0.6 naproxen: 0.3 ± 0.5 Quality of life: no data | |
| ACR: American College of Rheumatology; CI: confidence interval; HD: high‐dose; LD: low‐dose; N: number of participants; PGIC: Patient Global Impression of Change;SE: standard error; VAS: visual analogue scale | |||
Appendix 8. Summary of adverse events and withdrawals in individual studies
| Study | Treatment | Adverse events | Withdrawals |
| Intervention group (N = 15): indomethacin (2 weeks) then cross‐over to ketoprofen (2 weeks) Control group (N = 15): ketoprofen (2 weeks) then cross‐over to indomethacin (2 weeks) Participants < 20 kg: ketoprofen 25 mg capsule twice daily; participants > 20 kg: ketoprofen capsules x 2 = 50 mg twice daily Participants < 20 kg: indomethacin 25 mg capsule twice daily; participants > 20 kg: indomethacin capsules x 2 = 50 mg twice daily Study duration: 5 weeks | Total adverse events occurring (may be more than 1 per participant): ketoprofen: 9/30 indomethacin: 9/30 No. participants reporting an adverse event: ketoprofen: 9/30 indomethacin: 9/30 Serious adverse events: ketoprofen: 0/30 indomethacin: 0/30 Specific adverse events: ketoprofen; indomethacin loss of appetite: 1/30; 1/30 nausea: 1/30; 2/30 vomiting: 3/30; 2/30 abdominal pain: 3/30; 2/30 frank blood in stool: 0/30; 1/30 headache: 1/30; 1/30 | Total all‐cause withdrawals: ketoprofen: 0/30 indomethacin: 0/30 (1 disqualified for non‐compliance, not withdrawn) Withdrawals due to adverse events: ketoprofen: 0/30 indomethacin: 0/30 | |
| Intervention group (N = 50): fenoprofen 900 mg/m2/d increased to 1800 mg/m2/d, maximum 3200 mg/d Control group (N = 49): aspirin 1500 mg/m2/d increased to 3000 mg/m2/d, maximum 5450 mg/d Study duration: 12 weeks | Total adverse events occurring (may be more than 1 per participant): fenoprofen: n = 78 aspirin: n = 90 No. participants reporting an adverse event: fenoprofen: 28/49 aspirin: 40/50 Serious adverse events: fenoprofen: 0/79 aspirin: 0/50 Specific adverse events: fenoprofen (n = 49); aspirin (n = 50) abdominal pain: 9; 10 stomach discomfort: 12; 9 diarrhoea: 4; 2 vomiting: 2; 9 nausea: 2; 3 nausea and vomiting: 0; 2 general gastrointestinal upset: 0; 2 constipation: 3; 8 anorexia: 2; 3 occult blood in stool: 0; 2 cramps, abdominal: 2; 3 diplopia: 5; 0 dizziness: 0; 2 headache: 4; 2 rash: 6; 2 fatigue: 0; 2 chills: 0; 2 hyperventilation:1; 2 SGOT increase: 0; 7 SGPT increase: 0; 6 | Total all‐cause withdrawals: fenoprofen: 2/49 (4%); noncompliance (1); difficulty swallowing tablet (1) aspirin: 10/50 (20%); adverse effects (7); inefficacy (1); failed to co‐operate (1); wrong assignment chose to discontinue (1) Withdrawals due to adverse events: fenoprofen: 0/49 (0%) aspirin: 7/50 (14%) | |
| Intervention group (N = 77): celecoxib 50 mg/5 mL oral suspension (target dose approximately 3 mg/kg twice daily) Intervention group (N = 82): celecoxib 100 mg/5 mL oral suspension (target dose approximately 6 mg/kg twice daily) Control group (N = 83): naproxen 125 mg/5 mL oral suspension (target dose approximately 7.5 mg/kg twice daily) Study duration: 12 weeks | Total adverse events occurring (may be more than 1 per participant): celecoxib 3 mg/kg: 49/77 (63.6%) celecoxib 6 mg/kg: 57/82 (69.5%) naproxen 7.5 mg/kg: 60/83 (72.3%) No. participants reporting an adverse event: no data Serious adverse events: celecoxib 3 mg/kg: 3/77 celecoxib 6 mg/kg: 2/82 naproxen 7.5 mg/kg: 0/83 Specific adverse events: Significant AEs: skin and subcutaneous tissue disorders (celecoxib 6 mg; 6/82 (7.3%; P ≤ 0.10) Others AEs: eye disorders; headache (reported most often); gastrointestinal disorders; general disorders and administration site conditions; infections and infestations; injury and poisoning; investigations; musculoskeletal, connective tissue, and bone disorders; nervous system disorders; respiratory, thoracic, and mediastinal disorders | Total all‐cause withdrawals: celecoxib 3 mg/kg: 10/77 celecoxib 6 mg/kg: 11/82 naproxen 7.5 mg/kg: 9/83 Withdrawals due to adverse events: celecoxib 3 mg/kg: 3/77 celecoxib 6 mg/kg: 7/82 naproxen 7.5 mg/kg: 3/83 | |
| Intervention group (N = 45): ibuprofen suspension (concentration 100 mg/5 mL) + placebo aspirin Control group (N = 47): aspirin 200 mg tablet (participant weight 10 to 30 kg) or 300 mg capsules (participant weight > 30 kg) + placebo ibuprofen Week 2: physician's option to increase dose to 40 mg/kg/day ibuprofen or 80 mg/kg/day aspirin, provided no significant side effects Study duration: 12 weeks | Total adverse events occurring (may be more than 1 per participant): ibuprofen: unclear aspirin: unclear No. participants reporting an adverse event: ibuprofen: 40/45 aspirin: 44/47 Serious adverse events: ibuprofen: 4/45 aspirin: 13/47 Specific adverse events: ibuprofen; aspirin abnormalities in liver function: 1/45; 22/47; P < 0.01 digestive system adverse effects: 19/45; 33/47 elevated liver enzyme values: 0/45; 5/47 abdominal pain: 0/45; 1/47 positive stool test result: 8/45; 15/47 positive faecal occult blood tests: 2/45; 1/47 | Total all‐cause withdrawals: ibuprofen: 1/45 aspirin: 9/47 Withdrawals due to adverse events: ibuprofen: 0/45 aspirin: 6/47 | |
| Intervention group (N = 23): naproxen 10 mg/kg/24 hrs given as a suspension in 2 divided doses Control group (N = 23): aspirin soluble 80 mg/kg/day, divided into 4 doses Study duration: 2 x 4 weeks | Total adverse events occurring (may be more than 1 per participant): naproxen: 10/23 aspirin: 2/23 No. participants reporting an adverse event: naproxen: 6/23 aspirin: 1/23 Serious adverse events: naproxen: 0/23 aspirin: 0/23 Specific adverse events: naproxen: 1 ‐ abdominal pain aspirin: 1 ‐ abnormal liver test, nausea, tinnitus, and lassitude; 1 ‐ abnormal liver test; 1 ‐ vomiting | Total all‐cause withdrawals: naproxen: 1/23 (abdominal pain) aspirin: 3/23 (1 ‐ abnormal liver test, nausea, tinnitus, and lassitude; 1 ‐ abnormal liver test; 1 ‐ vomiting) Withdrawals due to adverse events: naproxen: 1/23 aspirin: 3/23 | |
| Intervention group (N = 209): (children) LD rofecoxib 0.3mg/kg/day maximum 12.5mg/day, or HD rofecoxib 0.6mg/kg/day maximum 25 mg/day; (adolescents) rofecoxib 12.5 or 25 mg daily Control group (N = 101): (children) naproxen 15 mg/kg/day 5 mg oral suspension; (adolescents) 15 mg/kg/day maximum 1000 mg/day Study duration: 12 weeks | Total adverse events occurring (may be more than 1 per participant): no data No. participants reporting an adverse event: LD rofecoxib: 21/109 (19.3%) HD rofecoxib: 22/100 (22%) naproxen: 28/101 (27.7%) Serious adverse events: LD rofecoxib: 0/109 HD rofecoxib: 0/100 naproxen: 0/101 Specific adverse events: Most common AEs, > 5% in each group: (n) LD rofecoxib; HD rofecoxib; naproxen abdominal pain: 7/109; 6/100; 13/101 headache: 6/109; 5/100; 13/101 upper abdominal pain: 7/109; 12/100; 7/101 nasopharyngitis: 11/109; 10/100; 1/101 pyrexia: 5/109; 4/100; 9/101 diarrhoea: 5/109; 7/100; 4/101 pharyngitis: 7/109; 3/100; 3/101 vomiting: 7/109; 3/100; 3/101 upper respiratory tract infection: 6/109; 6/100; 7/101 nausea: 3/109; 4/100; 6/101 | Total all‐cause withdrawals: LD rofecoxib: 10/109 HD rofecoxib: 5/100 naproxen: 10/101 Withdrawals due to adverse events: LD rofecoxib: 3/109 (0.03%) HD rofecoxib: 0/100 (0.0%) naproxen: 3/101 (0.03%) | |
| Intervention group 1 (N = 73): LD meloxicam 0.125 mg/kg, 1 dose per day Intervention group 2 (N = 74): HD meloxicam 0.25 mg/kg, 1 dose per day Control group (N = 78): naproxen 5 mg/kg, twice per day Study duration: 48 weeks | Total adverse events occurring (may be more than 1 per participant): LD meloxicam: n = 209 HD meloxicam: n= 229 naproxen: n = 247 No. participants reporting an adverse event: LD meloxicam: 54/73 (74%) HD meloxicam: 59/74 (80%) naproxen: 66/78 (85%) Considered to be drug related: LD meloxicam: 7/73 (10%) HD meloxicam: 11/74 (15%) naproxen: 10/78 (13%) Serious adverse events: LD meloxicam: 4/73 (5%) HD meloxicam: 7/74 (9%) naproxen: 10/78 (13%) Specific adverse events: LD meloxicam (n = 73); HD meloxicam (n = 74); naproxen (n = 79) eye disorders: 5; 6; 8 gastrointestinal disorders: 28; 27; 25 pain diarrhoea, nausea, vomiting: 21; 19; 19 pharyngolaryngeal pain: 9; 5; 4 general disorders: 13; 14; 19 pyrexia: 11; 13; 14 infections and infestations: 30; 38; 39 nasopharyngitis: 4; 9; 7 physical examination: 9; 6; 4 musculoskeletal and connective tissue disorders: 11; 22; 10 nervous system disorders: 10; 11; 7 headache not otherwise specified: 9; 10; 5 respiratory, thoracic, and mediastinal disorders: 22; 19; 26 cough: 7; 9; 14 rhinitis not otherwise specified: 13; 11; 16 skin and subcutaneous tissue disorders: 4; 5; 13 eczema, erythema, pruritus, rash: 0; 3; 8 bleeding disorders (rectal haemorrhage, epistaxis, haematuria, haematoma, Henoch‐Schonlein purpura): 3; 2; 9 | Total all‐cause withdrawals: LD meloxicam: n = 15/73 (21%). LTFU (0); AE (7); lack of efficacy (2); other (4); others (2). HD meloxicam: n = 11/74 (15%). LTFU (0); AE (3); lack of efficacy (1); other (5); others (2). naproxen: n = 17/78 (22%). LTFU (0); AE (10); lack of efficacy (3); other (4); others (0). Withdrawals due to adverse events: LD meloxicam: 7/73 (9.6%) HD meloxicam: 3/74 (4.1%) naproxen: 10/78 (12.8%) | |
| AE: adverse event; HD: high‐dose; LD: low‐dose; LTFU: long‐term follow‐up; N: number of participants; SGOT: serum glutamate‐oxaloacetic transaminase; SGPT: serum glutamate‐pyruvate transaminase | |||

Study flow diagram.
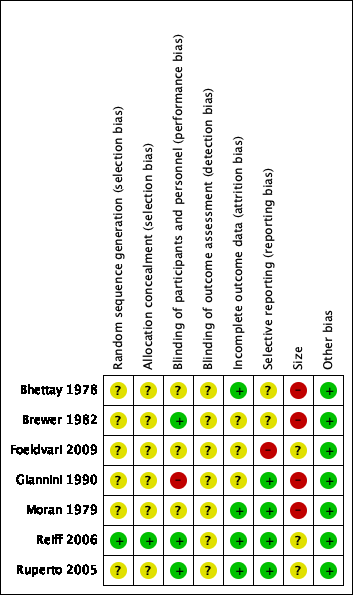
Risk of bias summary: review authors' judgements about each risk of bias item for each included study.
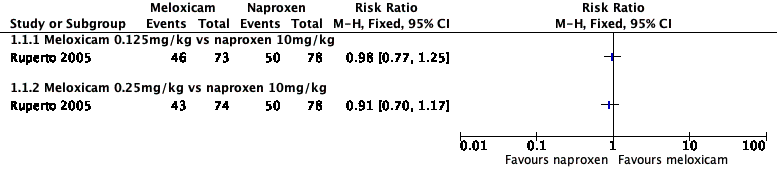
Forest plot of comparison: 1 Meloxicam versus naproxen, outcome: 1.1 Participant‐reported pain relief of 30% or greater.

Forest plot of comparison: 2 Celecoxib versus naproxen, outcome: 2.1 Participant‐reported pain relief of 30% or greater.

Forest plot of comparison: 3 Rofecoxib versus naproxen, outcome: 3.1 Participant‐reported pain relief of 30% or greater.

Forest plot of comparison: 1 Meloxicam versus naproxen, outcome: 1.2 Participant‐reported pain relief of 50% or greater.
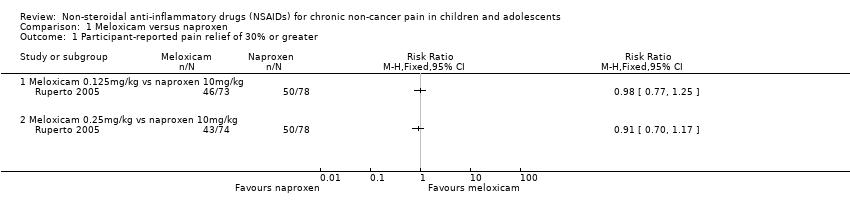
Comparison 1 Meloxicam versus naproxen, Outcome 1 Participant‐reported pain relief of 30% or greater.

Comparison 1 Meloxicam versus naproxen, Outcome 2 Participant‐reported pain relief of 50% or greater.

Comparison 2 Celecoxib versus naproxen, Outcome 1 Participant‐reported pain relief of 30% or greater.

Comparison 3 Rofecoxib versus naproxen, Outcome 1 Participant‐reported pain relief of 30% or greater.
| Meloxicam compared with naproxen for chronic non‐cancer pain | ||||||
| Patient or population: children and adolescents with chronic non‐cancer pain Settings: multicentre paediatric rheumatology tertiary care units (international) Intervention: meloxicam Comparison: naproxen | ||||||
| Outcomes | Illustrative comparative risks* (95% CI) | Relative effect | No. of participants | Quality of the evidence | Comments | |
| Naproxen | Meloxicam | |||||
| Participant‐reported pain relief of 30% or greater | 50/78 | 89/147 | N/A | 225 participants (1 study) | ⊕⊕⊝⊝ | |
| Participant‐reported pain relief of 50% or greater | 39/78 | 70/147 | N/A | 225 participants (1 study) | ⊕⊕⊝⊝ | |
| Patient Global Impression of Change much or very much improved | No data | No data | N/A | N/A | No evidence to support or refutec | |
| Any adverse event | 10/78 | 18/147 | N/A | 225 participants (1 study) | ⊕⊝⊝⊝ | |
| Serious adverse event | 10/78 | 11/147 | N/A | 225 participants (1 study) | ⊕⊝⊝⊝ | |
| Withdrawals due to adverse events | 10/78 | 10/147 | N/A | 225 participants (1 study) | ⊕⊝⊝⊝ | |
| *The basis for the assumed risk (e.g. the median control group risk across studies) is provided in footnotes. The corresponding risk (and its 95% confidence interval) is based on the assumed risk in the comparison group and the relative effect of the intervention (and its 95% CI). CI: confidence interval; N/A: not applicable | ||||||
| GRADE Working Group grades of evidence High quality: We are very confident that the true effect lies close to that of the estimate of the effect. Moderate quality: We are moderately confident in the effect estimate; the true effect is likely to be close to the estimate of effect, but there is a possibility that it is substantially different. Low quality: Our confidence in the effect estimate is limited; the true effect may be substantially different from the estimate of the effect. Very low quality: We have very little confidence in the effect estimate; the true effect is likely to be substantially different from the estimate of effect. | ||||||
| aDowngraded once for serious study limitations (risk of bias), and once for imprecision. bDowngraded three levels due to too few data and number of events are too small to be meaningful. cNo data available for this outcome, and therefore no GRADE rating has been applied and there is no evidence to support or refute. | ||||||
| Celecoxib compared with naproxen for chronic non‐cancer pain | ||||||
| Patient or population: children and adolescents with chronic non‐cancer pain Settings: 17 paediatric centres worldwide Intervention: celecoxib Comparison: naproxen | ||||||
| Outcomes | Illustrative comparative risks* (95% CI) | Relative effect | No. of participants | Quality of the evidence | Comments | |
| Naproxen | Celecoxib | |||||
| Participant‐reported pain relief of 30% or greater | 56/83 | 119/159 | N/A | 242 participants | ⊕⊕⊝⊝ | |
| Participant‐reported pain relief of 50% or greater | No data | No data | N/A | N/A | ‐ | No evidence to support or refutec |
| Patient Global Impression of Change much or very much improved | No data | No data | N/A | N/A | ‐ | No evidence to support or refutec |
| Any adverse event | No data | No data | N/A | N/A | ‐ | No evidence to support or refutec |
| Serious adverse event | 0/83 | 5/159 | N/A | 242 participants | ⊕⊝⊝⊝ | |
| Withdrawals due to adverse events | 3/83 | 10/159 | N/A | 242 participants | ⊕⊝⊝⊝ | |
| *The basis for the assumed risk (e.g. the median control group risk across studies) is provided in footnotes. The corresponding risk (and its 95% confidence interval) is based on the assumed risk in the comparison group and the relative effect of the intervention (and its 95% CI). | ||||||
| GRADE Working Group grades of evidence High quality: We are very confident that the true effect lies close to that of the estimate of the effect. Moderate quality: We are moderately confident in the effect estimate; the true effect is likely to be close to the estimate of effect, but there is a possibility that it is substantially different. Low quality: Our confidence in the effect estimate is limited; the true effect may be substantially different from the estimate of the effect. Very low quality: We have very little confidence in the effect estimate; the true effect is likely to be substantially different from the estimate of effect. | ||||||
| aDowngraded once for serious study limitations (risk of bias), and once for imprecision. bDowngraded three levels due to too few data and number of events are too small to be meaningful. cNo data available for this outcome, and therefore no GRADE rating has been applied and there is no evidence to support or refute. | ||||||
| Rofecoxib compared with naproxen for chronic non‐cancer pain | ||||||
| Patient or population: children and adolescents with chronic non‐cancer pain Settings: 41 clinical centres in Australia, Europe, Asia, Central America, South America, USA Intervention: rofecoxib Comparison: naproxen | ||||||
| Outcomes | Illustrative comparative risks* (95% CI) | Relative effect | No. of participants | Quality of the evidence | Comments | |
| Naproxen | Rofecoxib | |||||
| Participant‐reported pain relief of 30% or greater | 48/87 | 94/187 | N/A | 274 participants | ⊕⊕⊝⊝ | |
| Participant‐reported pain relief of 50% or greater | No data | No data | N/A | N/A | ‐ | No evidence to support or refutec |
| Patient Global Impression of Change much or very much improved | No data | No data | N/A | N/A | ‐ | No evidence to support or refutec |
| Any adverse event | 28/101 | 43/209 | N/A | 274 participants | ⊕⊝⊝⊝ | |
| Serious adverse event | 0/101 | 0/209 | N/A | 310 participants | ⊕⊝⊝⊝ | |
| Withdrawals due to adverse events | 3/101 | 3/209 | N/A | 310 participants | ⊕⊝⊝⊝ | |
| *The basis for the assumed risk (e.g. the median control group risk across studies) is provided in footnotes. The corresponding risk (and its 95% confidence interval) is based on the assumed risk in the comparison group and the relative effect of the intervention (and its 95% CI). | ||||||
| GRADE Working Group grades of evidence High quality: We are very confident that the true effect lies close to that of the estimate of the effect. Moderate quality: We are moderately confident in the effect estimate; the true effect is likely to be close to the estimate of effect, but there is a possibility that it is substantially different. Low quality: Our confidence in the effect estimate is limited; the true effect may be substantially different from the estimate of the effect. Very low quality: We have very little confidence in the effect estimate; the true effect is likely to be substantially different from the estimate of effect. | ||||||
| aDowngraded once for serious study limitations (risk of bias), and once for imprecision. bDowngraded three levels due to too few data and number of events were too small to be meaningful. cNo data available for this outcome, and therefore no GRADE rating has been applied and there is no evidence to support or refute. | ||||||
| Outcome or subgroup title | No. of studies | No. of participants | Statistical method | Effect size |
| 1 Participant‐reported pain relief of 30% or greater Show forest plot | 1 | Risk Ratio (M‐H, Fixed, 95% CI) | Totals not selected | |
| 1.1 Meloxicam 0.125mg/kg vs naproxen 10mg/kg | 1 | Risk Ratio (M‐H, Fixed, 95% CI) | 0.0 [0.0, 0.0] | |
| 1.2 Meloxicam 0.25mg/kg vs naproxen 10mg/kg | 1 | Risk Ratio (M‐H, Fixed, 95% CI) | 0.0 [0.0, 0.0] | |
| 2 Participant‐reported pain relief of 50% or greater Show forest plot | 1 | Risk Ratio (M‐H, Fixed, 95% CI) | Totals not selected | |
| 2.1 Meloxicam 0.125mg/kg vs naproxen 10mg/kg | 1 | Risk Ratio (M‐H, Fixed, 95% CI) | 0.0 [0.0, 0.0] | |
| 2.2 Meloxicam 0.25mg/kg vs naproxen 10mg/kg | 1 | Risk Ratio (M‐H, Fixed, 95% CI) | 0.0 [0.0, 0.0] | |
| Outcome or subgroup title | No. of studies | No. of participants | Statistical method | Effect size |
| 1 Participant‐reported pain relief of 30% or greater Show forest plot | 1 | Risk Ratio (M‐H, Fixed, 95% CI) | Totals not selected | |
| 1.1 Celecoxib 3mg/kg vs naproxen 7.5mg/kg | 1 | Risk Ratio (M‐H, Fixed, 95% CI) | 0.0 [0.0, 0.0] | |
| 1.2 Celecoxib 6mg/kg vs naproxen 7.5mg/kg | 1 | Risk Ratio (M‐H, Fixed, 95% CI) | 0.0 [0.0, 0.0] | |
| Outcome or subgroup title | No. of studies | No. of participants | Statistical method | Effect size |
| 1 Participant‐reported pain relief of 30% or greater Show forest plot | 1 | Risk Ratio (M‐H, Fixed, 95% CI) | Totals not selected | |
| 1.1 Rofecoxib 0.3 to 12.5mg/kg vs naproxen 15mg/kg | 1 | Risk Ratio (M‐H, Fixed, 95% CI) | 0.0 [0.0, 0.0] | |
| 1.2 Rofecoxib 12.5 to 25mg/kg vs naproxen 15mg/kg | 1 | Risk Ratio (M‐H, Fixed, 95% CI) | 0.0 [0.0, 0.0] | |