Scolaris Content Display Scolaris Content Display

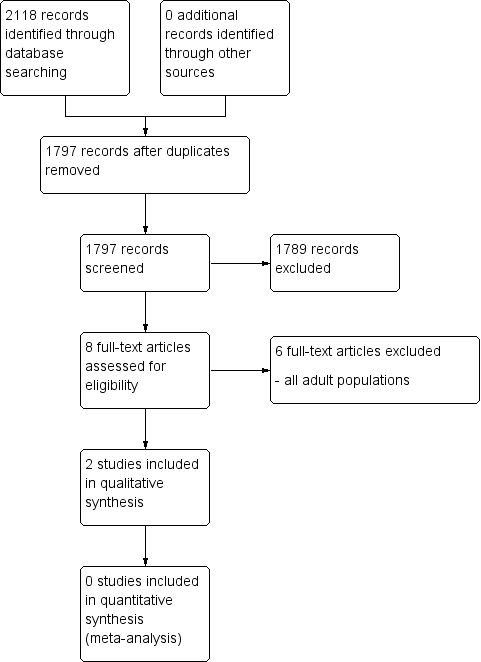
Study flow diagram.
Figuras y tablas -
Figure 1

Study flow diagram.

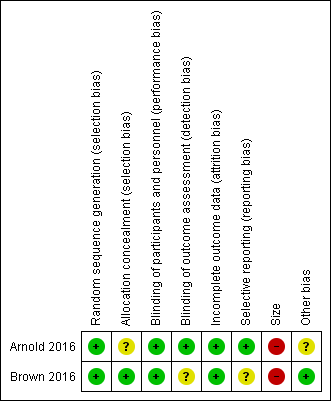
Risk of bias summary: review authors' judgements about each risk of bias item for each included study.
Figuras y tablas -
Figure 2

Risk of bias summary: review authors' judgements about each risk of bias item for each included study.

Summary of findings for the main comparison. Gabapentin compared with amitriptyline for chronic non‐cancer pain

Gabapentin compared with amitriptyline for chronic non‐cancer pain

Patient or population: children and adolescents (birth to 17 years of age) with chronic non‐cancer pain

Settings: primary care

Intervention: gabapentin

Comparison: amitriptyline

Outcomes

Illustrative comparative risks* (95% CI)

Relative effect
(95% CI)

No. of participants
(studies)

Quality of the evidence
(GRADE)

Comments

Amitriptyline

Gabapentin

Participant‐reported pain relief of 30% or greater

No data

No data

N/A

N/A

No evidence to support or refuteb

Participant‐reported pain relief of 50% or greater

No data

No data

N/A

N/A

No evidence to support or refuteb

Patient Global Impression of Change: much improved or very much improved

No data

No data

N/A

N/A

No evidence to support or refuteb

Any adverse events

1/17

2/17

N/A

34 participants

(1 study)

⊕⊝⊝⊝
very lowa

Serious adverse events

0/17

0/17

N/A

34 participants

(1 study)

⊕⊝⊝⊝
very lowa

Withdrawals due to adverse events

1/17

2/17

N/A

34 participants

(1 study)

⊕⊝⊝⊝
very lowa

*The basis for the assumed risk (e.g. the median control group risk across studies) is provided in footnotes. The corresponding risk (and its 95% confidence interval) is based on the assumed risk in the comparison group and the relative effect of the intervention (and its 95% CI).

CI: confidence interval; N/A: not applicable; RR: risk ratio

GRADE Working Group grades of evidence

High quality: We are very confident that the true effect lies close to that of the estimate of the effect.

Moderate quality: We are moderately confident in the effect estimate; the true effect is likely to be close to the estimate of effect, but there is a possibility that it is substantially different.

Low quality: Our confidence in the effect estimate is limited; the true effect may be substantially different from the estimate of the effect.

Very low quality: We have very little confidence in the effect estimate; the true effect is likely to be substantially different from the estimate of effect.

aDowngraded three levels due to too few data and number of events were too small to be meaningful.

bNo data available for this outcome, and therefore no GRADE rating has been applied and there is no evidence to support or refute.

Figuras y tablas -
Summary of findings for the main comparison. Gabapentin compared with amitriptyline for chronic non‐cancer pain
Summary of findings 2. Pregabalin compared with placebo for chronic non‐cancer pain

Pregabalin compared with placebo for chronic non‐cancer pain

Patient or population: children and adolescents (birth to 17 years of age) with chronic non‐cancer pain

Settings: multicentre, USA (28 primary care centres), India (5 primary care centres), Taiwan (2 primary care centres), and Czech Republic (1 primary care centre)

Intervention: pregabalin

Comparison: placebo

Outcomes

Illustrative comparative risks* (95% CI)

Relative effect
(95% CI)

No. of participants
(studies)

Quality of the evidence
(GRADE)

Comments

Placebo

Pregabalin

Participant‐reported pain relief of 30% or greater**

16/51

18/54

N/A

107 participants

(1 study)

⊕⊝⊝⊝
very lowa

Participant‐reported pain relief of 50% or greater**

4/51

9/54

N/A

107 participants

(1 study)

⊕⊝⊝⊝
very lowa

Patient Global Impression of Change: much improved or very much improved**

15/51

29/54

N/A

107 participants

(1 study)

⊕⊝⊝⊝
very lowa

Adverse events

34/53

38/54

N/A

107 participants

(1 study)

⊕⊝⊝⊝
very lowa

Serious adverse events

0/53

1/54

N/A

107 participants

(1 study)

⊕⊝⊝⊝
very lowa

Withdrawals due to adverse events

4/53

4/54

N/A

107 participants

(1 study)

⊕⊝⊝⊝
very lowa

GRADE Working Group grades of evidence

High quality: We are very confident that the true effect lies close to that of the estimate of the effect.

Moderate quality: We are moderately confident in the effect estimate; the true effect is likely to be close to the estimate of effect, but there is a possibility that it is substantially different.

Low quality: Our confidence in the effect estimate is limited; the true effect may be substantially different from the estimate of the effect.

Very low quality: We have very little confidence in the effect estimate; the true effect is likely to be substantially different from the estimate of effect.

aDowngraded three levels due to too few data and number of events were too small to be meaningful.

bNo data available for this outcome, and therefore no GRADE rating has been applied and there is no evidence to support or refute.

Figuras y tablas -
Summary of findings 2. Pregabalin compared with placebo for chronic non‐cancer pain