Macrolides for treatment of Haemophilus ducreyi infection in sexually active adults
Abstract
Background
Chancroid is a genital ulcerative disease caused by Haemophilus ducreyi. This microorganism is endemic in Africa, where it can cause up to 10% of genital ulcers. Macrolides may be an effective alternative to treat chancroid and, based on their oral administration and duration of therapy, could be considered as first line therapy.
Objectives
To assess the effectiveness and safety of macrolides for treatment of H ducreyi infection in sexually active adults.
Search methods
We searched the Cochrane STI Group Specialized Register, CENTRAL, MEDLINE, Embase, LILACS, WHO ICTRP, ClinicalTrials.gov and Web of Science to 30 October 2017. We also handsearched conference proceedings and reference lists of retrieved studies.
Selection criteria
Randomized controlled trials (RCTs) comparing macrolides in different regimens or with other therapeutic alternatives for chancroid.
Data collection and analysis
Two review authors independently assessed trials for inclusion, extracted data and assessed risk of bias. We resolved disagreements through consensus. We used the GRADE approach to assess the quality of the evidence.
Main results
Seven RCTs (875 participants) met our inclusion criteria, of which four were funded by industry. Five studies (664 participants) compared macrolides with ceftriaxone, ciprofloxacin, spectinomycin or thiamphenicol. Low quality evidence suggested there was no difference between the groups after treatment in terms of clinical cure (risk ratio (RR) 1.09, 95% confidence interval (CI) 0.97 to 1.21; 2 studies, 340 participants with syndromic approach and RR 1.06, 95% CI 0.98 to 1.15; 5 studies, 348 participants with aetiological diagnosis) or improvement (RR 0.89, 95% CI 0.52 to 1.52; 2 studies, 340 participants with syndromic approach and RR 0.80, 95% CI 0.42 to 1.51; 3 studies, 187 participants with aetiological diagnosis). Based on low and very low quality evidence, there was no difference between macrolides and any other antibiotic treatments for microbiological cure (RR 0.93, 95% CI 0.74 to 1.16; 1 study, 45 participants) and minor adverse effects (RR 1.34, 95% CI 0.24 to 7.51; 3 studies, 412 participants).
Two trials (269 participants) compared erythromycin with any other macrolide type. Low quality evidence suggested that, compared with azithromycin or rosaramicin, long courses of erythromycin did not increase clinical cure (RR 1.00, 95% CI 0.91 to 1.10; 2 studies, 269 participants with syndromic approach and RR 1.04, 95% CI 0.93 to 1.16; 2 studies, 211 participants with aetiological diagnosis), with a similar frequency of minor adverse effects between the groups (RR 1.14, 95% CI 0.63 to 2.06; 1 trial, 101 participants). For this comparison, subgroup analysis found no difference between HIV‐positive participants (RR 1.02, 95% CI 0.73 to 1.43; 1 study, 38 participants) and HIV‐negative participants (RR 1.04, 95% CI 0.94 to 1.14; 1 study, 89 participants). We downgraded the quality of evidence to low, because of imprecision, some limitations on risk of bias and heterogeneity.
None of the trials reported serious adverse events, cost effectiveness and participant satisfaction.
Authors' conclusions
At present, the quality of the evidence on the effectiveness and safety of macrolides for treatment of H ducreyi infection in sexually active adults is low, implying that we are uncertain about the estimated treatment effect. There is no statistically significant difference between the available therapeutic alternatives for the treatment of sexually active adults with genital ulcers compatible with chancroid. Low quality evidence suggests that azithromycin could be considered as the first therapeutic alternative, based on their mono‐dose oral administration, with a similar safety and effectiveness profile, when it is compared with long‐term erythromycin use.
Due to sparse available evidence about the safety and effectiveness of macrolides to treat H ducreyi infection in people with HIV, these results should be taken with caution.
PICO
Plain language summary
Macrolides for treatment of Haemophilus ducreyi infection in sexually active adults
Review question
In this Cochrane Review, we assess the effectiveness and safety of macrolides in different regimens or with other treatments for H ducreyi infection in adults.
Background
Chancroid is a sexually transmitted infection (STI) caused by infection with a bacteria called Haemophilus ducreyi. It causes ulcers in the genital area and is endemic in some low‐income countries. Control and eradication of chancroid could reduce transmission of the STI from one sexual partner to another. Macrolides are antibiotics that could be effective and safe for treating H ducreyi infection.
Trial characteristics
We searched the available literature up to 30 October 2017 and we included seven trials with 875 participants. The trials recruited men and non‐pregnant women over the age of 16 years who presented with genital ulcers compatible with chancroid. Three studies included people with high‐risk sexual behaviour as migrant mine workers, sex workers and men with prostitute contact. All the trials tested for other STIs, and discarded people who were also infected with syphilis and herpes simple virus. One study included people with HIV. The most frequent antibiotic treatment was erythromycin with azithromycin as an alternative. They were compared with ceftriaxone, ciprofloxacin, spectinomycin or thiamphenicol. Five studies compared two types of antibiotic and two studies compared different ways of treating with macrolides. Four trials were funded by pharmaceutical companies.
Key results
There was no difference between the types of antibiotics in sexually active adults with genital ulcers compatible with chancroid. Erythromycin is usually the first choice for treatment but low quality evidence suggested that azithromycin (as a single dose, oral (by mouth) administration) had similar safety and effectiveness.
Because of sparse evidence about the safety and effectiveness of macrolides to treat Haemophilus ducreyi infection in people with HIV, these results should be taken with caution.
Quality of evidence
The quality of evidence was low as there was a risk of bias due to poor methods, people dropping out of the study and pharmaceutical companies sponsored four studies.
Authors' conclusions
Summary of findings
| Macrolides compared to any other antibiotic for treatment of Haemophilus ducreyi infection in sexually active adults | |||||
| Patient or population: sexually active adults Settings: ‐ Intervention: macrolides Comparison: any other antibiotic | |||||
| Outcomes | Anticipated absolute effects* (95% CI) | Relative effect | No of participants | Quality of the evidence | |
| Risk with any other antibiotic | Risk with macrolides | ||||
| Clinical cure: syndromic approach | Study population | RR 1.09 | 340 | ⊕⊕⊝⊝ | |
| 735 per 1000 | 801 per 1000 | ||||
| Clinical cure: aetiological approach | Study population | RR 1.06 | 348 | ⊕⊕⊝⊝ | |
| 835 per 1000 | 885 per 1000 | ||||
| Clinical improvement: syndromic approach | Study population | RR 0.89 | 340 | ⊕⊝⊝⊝ | |
| 139 per 1000 | 123 per 1000 | ||||
| Clinical improvement: aetiological approach | Study population | RR 0.80 | 187 | ⊕⊕⊝⊝ | |
| 175 per 1000 | 140 per 1000 | ||||
| Microbiological cure | Study population | RR 0.93 | 45 | ⊕⊕⊝⊝ | |
| 933 per 1000 | 868 per 1000 | ||||
| Minor adverse events | Study population | RR 1.34 | 412 | ⊕⊝⊝⊝ | |
| 64 per 1000 | 86 per 1000 | ||||
| *The risk in the intervention group (and its 95% confidence interval) is based on the assumed risk in the comparison group and the relative effect of the intervention (and its 95% CI). CI: confidence interval; RCT: randomized controlled trial; RR: risk ratio. | |||||
| GRADE Working Group grades of evidence | |||||
| 1Downgraded by two levels for very serious limitations on blinding, incomplete outcome data and other bias domains. 2Downgraded by one level for substantial heterogeneity (I² > 40%). 3Downgraded by one level for imprecision as the 95% CI crossed through 0.75 and 1.25. 4Downgraded by one level for serious limitations on blinding, incomplete outcome data and other bias domains. 5Downgraded by two levels for imprecision as the 95% CI crossed through 0.75 and optimal information size was not achieved. | |||||
| Macrolide (erythromycin) compared to any other macrolide for Haemophilus ducreyi infection in sexually active adults | |||||
| Patient or population: sexually active adults Settings: ‐ Intervention: macrolide Comparison: any other macrolide | |||||
| Outcomes | Anticipated absolute effects* (95% CI) | Relative effect | No of participants | Quality of the evidence | |
| Risk with macrolides (erythromycin | Risk with macrolides | ||||
| Clinical cure: syndromic approach | Study population | RR 1.00 | 269 | ⊕⊕⊝⊝ | |
| 888 per 1000 | 888 per 1000 | ||||
| Clinical cure: aetiological approach | Study population | RR 1.04 | 211 | ⊕⊕⊝⊝ | |
| 860 per 1000 | 894 per 1000 | ||||
| Minor adverse events | Study population | RR 1.14 | 101 | ⊕⊝⊝⊝ | |
| 286 per 1000 | 326 per 1000 | ||||
| *The risk in the intervention group (and its 95% confidence interval) is based on the assumed risk in the comparison group and the relative effect of the intervention (and its 95% CI). CI: confidence interval; RCT: randomized controlled trial; RR: risk ratio. | |||||
| GRADE Working Group grades of evidence | |||||
| 1Downgraded by two levels for very serious limitations on blinding, incomplete outcome data and other bias domains. 2Downgraded by one level for serious limitations on blinding, incomplete outcome data and other bias domains. 3Downgraded by two levels for imprecision as the 95% CI crosses through 0.75 and 1.25 and optimal information size was not achieved. | |||||
Background
Description of the condition
Chancroid is a genital ulcerative disease caused by Haemophilus ducreyi (Spinola 2002), which is a Gram‐negative, facultatively anaerobic coccobacillus. This bacterium is from the family Pasteurellaceae, and was identified in 1889 by August Ducrey (Lewis 2003). Currently, the prevalence of H ducreyi is unknown. However, in the late 1990s, worldwide absolute frequency was estimated at around seven million cases (Steen 2001). It is endemic in some Africa countries, where H ducreyi infection can cause up to 10% of genital ulcer cases (González‐Beiras 2016; Mohammed 2008). The infection can occur in sporadic outbreaks in vulnerable populations, such as sex workers or between cocaine users (Bong 2002; Steen 2001).
H ducreyi infects the stratified squamous epithelium of mucosal surfaces and the regional lymph nodes (Mohammed 2008) through superficial abrasions that occur during sexual intercourse (O'Farrell 2014). Chancroid usually does not exhibit prodromal symptoms and, after an incubation period of three to seven days, generates a papule as the first clinical manifestation (Bong 2002). This papule commonly goes unnoticed, except on some occasions when it can cause local pain or burning (Mohammed 2008), and finally acquires a pustule configuration that precedes the ulcerative disease (Bong 2002). H ducreyi replication occurs during all these stages and is accompanied by intermittent bacterial shedding even before ulceration, which suggests that the bacteria may be transmissible before clinical manifestations (Lewis 2003).
Typically these ulcers are well‐defined, painful, with rough raised edges that are not indurated, but with a soft consistency. Hence, they are commonly known as soft chancres (Min Salud 2013). Multiple ulcers occur at the same time and show a tendency to coalescence, which is why they can acquire a giant (greater than 2 cm) or serpiginous configuration (Mohammed 2008). The base of the ulcer is covered by a greyish or yellowish necrotic, purulent exudate that frequently bleeds when scraped (Bong 2002). In men, the most common ulcer sites are the prepuce, frenulum and coronal sulcus; in women, it is the introitus (Lewis 2006). In most cases, ulcers can resolve and heal without any treatment between four and six weeks after infection (Lewis 2006). However, in up to 50% of cases, the ulcerative stage of the disease can be accompanied by tender inguinal lymphadenopathies with pyogenic response in an ipsilateral location, named buboes (Lewis 2000). Spreading of ulceration, with destruction of both skin and underlying soft tissue can also be followed up by bubo ulceration (Mohammed 2008).
The diagnosis of chancroid requires a high index of suspicion, since its clinical manifestations may be indistinguishable from other infections such as herpes simplex virus (HSV) or syphilis (Lewis 2000). For this reason, confirmation of H ducreyi infection may require different diagnostic methods and includes some specific techniques (Steen 2001). Various studies describe the usefulness of Gram staining and direct microscopy to diagnose chancroid through the visualization of morphological forms, such as "schools of fish" or "railroad tracks" (Lewis 2000; Zeballos 2002). However, Gram staining and direct microscopy are not recommended, given their limited accuracy due to contamination with common flora (Lewis 2006). Serological studies are not useful either, because of their low sensitivity and specificity, cross‐reactions with other Haemophilus species, the inability to distinguish recent infections from old ones, and scarce immunoglobulin G (IgG) serum antibody responses (O'Farrell 2014). Initially, serial cultures with 5% (v/v) carbon dioxide were considered the gold standard test to confirm diagnosis, despite their low accuracy, given by a sensitivity and specificity lower than 80% (CDC 2015; Lewis 2006). However, due to their low performance, requirement for highly qualified personnel, time‐consuming nature, requirement for stringent transport and that they are not widely available, cell culture has been abandoned as a diagnostic method (Lewis 2003).
Other diagnostic tests, such as immunofluorescence (IFI), show quite similar accuracy to in vitro cell culture, with a sensitivity of 89% and specificity of 81% (Lewis 2000). However, the cost and maintenance of these techniques represents a major disadvantage for populations that do not have the resources or technical capabilities for their development (Lewis 2000; Mohammed 2008). The nucleic acid amplification test (NAAT) is considered the gold standard for diagnosis of H ducreyi infection (Lewis 2000); it relegates other diagnostic techniques, such as cell culture, in cases of therapeutic failure or where susceptibility testing is needed to determine therapeutic management (Kemp 2011). The advantage of the NAAT is that it detects genes even if they are in low abundance from readily available samples (Chernesky 1999; Marrazzo 2001), and reflects a substantial improvement in accuracy with a higher sensitivity (98.4%) and specificity (99.6%) compared to other techniques (Mohammed 2008). However, the disadvantage of this approach is that specimens could contain amplification inhibitors that cause false‐negative results and test results are not immediately available (CDC 2015), which requires the patient to schedule a second appointment with the healthcare provider.
Based on the mentioned limitations for available diagnostic tests, the Centers for Disease Control and Prevention (CDC) advises suspicion of H ducreyi infection when the person presents with one or more painful genital ulcers, with or without regional lymphadenopathy, ruling‐out syphilis and HSV infections by examination of ulcer exudate, or, in the case of syphilis, with negative serological tests, at least seven days after the onset of the ulcer (CDC 2015). This approach has been adopted by the World Health Organization (WHO) for low‐income countries, proposing syndromic management of genital ulcers (Lewis 2000). This approach does not require laboratory studies and promotes the use of single doses in first‐line regimens to assure adherence and reduce costs (WHO 2005).
Description of the intervention
During the 1980s and 1990s, the management of genital ulcers caused by H ducreyi involved the prescription of trimethoprim‐sulfamethoxazole, amoxicillin or tetracycline. However, the emergence of resistant strains of H ducreyi in low‐income countries, with the subsequent worldwide increase of therapeutic failure rates forced a change in treatment approach. Macrolides may be an effective alternative to treat chancroid, and may replace the previously mentioned medications (BASSH 2014; CDC 2015; O'Farrell 2014).
The CDC and some guidelines development groups recommend the use of mono‐dose as first therapeutic alternative to treat sexually transmitted infections (STIs), based on the premise of effectiveness and adherence to the intervention (CDC 2015; Gaitán‐Duarte 2013; Min Salud 2013). In concordance with this, macrolides, particularly azithromycin, represent an attractive option for the syndromic management of genital ulcers (Kemp 2011). Macrolides can be administered to pregnant or nursing women (CDC 2015; Min Salud 2013), or people who are allergic to cephalosporins (O'Farrell 2014). Guidelines recommend as a first option a single oral dose of azithromycin 1 g or, if feasible, a long treatment regimen of erythromycin 500 mg every eight hours for one week (CDC 2015; Min Salud 2013). If treatment with macrolides is not available or not possible, a second line could be the administration of ceftriaxone at a single intramuscular dose of 250 mg, or ciprofloxacin 500 mg orally every 12 hours for three days, as an alternative regimen (CDC 2015).
How the intervention might work
The macrolides drug family includes azithromycin, erythromycin and clarithromycin; of which azithromycin and erythromycin are used for chancroid treatment. Macrolides inhibit bacterial protein synthesis by binding to the P site on the 50S subunit of the bacterial ribosome (Flórez 2008), and exhibit a bacteriostatic or bactericidal effect depending on the microorganism, tissue and bioavailability (Flórez 2008). Azithromycin is a second‐generation macrolide and is derived from erythromycin. It has a similar mode of action, but achieves higher concentrations at the site of infection due to cell accumulation (especially phagocytes) and to higher volume of distribution (Flórez 2008). Azithromycin has a half‐life of 68 hours, and its oral bioavailability is approximately 38%. The maximum plasma concentration is achieved between 2.2 and 4.0 hours after administration (Micromedex 2014), and it is mainly eliminated by hepatic metabolism (75%) (Flórez 2008). The most common adverse effects include diarrhoea (3.6%), nausea (2.5%), abdominal pain (2.5%), headache, dizziness (1.3%) and elevation of transaminases (1.5%) (Flórez 2008).
A second line of treatment is ceftriaxone, which is a third‐generation cephalosporin. Like other beta‐lactam drugs, it causes bacterial lysis by preventing cell wall synthesis through the disruption of peptidoglycan synthesis (Flórez 2008). Common adverse effects include diarrhoea (2.7% to 5.6%), eosinophilia (6%) and thrombocytosis (5.1%). Serious adverse effects include erythema multiforme, Stevens‐Johnson syndrome, toxic epidermal necrolysis, haemolytic anaemia (less than 1%), hypersensitivity reaction (2.7% to 3.3%) and renal failure (Micromedex 2014). Its half‐life is 5.8 to 8.7 hours (Flórez 2008). Ceftriaxone is eliminated primarily by renal excretion (33% to 67%) as the unmetabolized drug (Dynamed 2014). Finally, if treatment with macrolides or ceftriaxone is not available or not possible, the alternative is ciprofloxacin (CDC 2015). Ciprofloxacin is a fluoroquinolone and it functions by inhibiting DNA gyrase, which an enzyme that is necessary for cell division (Flórez 2008). Its half‐life is four hours, and 40% to 50% of the oral dose is excreted in the urine as the unmetabolized drug (Dynamed 2014). Adverse effects include nausea (2.5%), diarrhoea (1.6%), abnormal liver function tests (1.3%), vomiting (1%) and rash (1%) (Flórez 2008).
Why it is important to do this review
Recognition of chancroid as a susceptible disease for control and eradication (Steen 2001) could reduce STI transmission rates and burden in the community (Mutua 2012). Currently, there are no published systematic reviews that compare the effectiveness and safety of macrolides with any other antibiotic for treating H ducreyi infection in sexually active populations. This systematic review will facilitate the synthesis of the current evidence, and recognize its strengths and weakness, address the uncertainty of the current knowledge, and make it possible to assess the effectiveness and safety of this intervention. Macrolides could offer the advantages of oral and single‐dose administration, improved treatment adherence, and reduced adverse effects (CDC 2015).
Objectives
To assess the effectiveness and safety of macrolides for treatment of H ducreyi infection in sexually active adults.
Methods
Criteria for considering studies for this review
Types of studies
We included randomized controlled trials (RCTs) that compared macrolides as first‐line therapy with any other antibiotic treatment or any other symptomatic treatment. We also included RCTs that compared different macrolides regimens (by macrolide type) for the treatment of H ducreyi infection.
We excluded quasi‐RCTs because this produces effect estimates that indicate more extreme benefits when they are compared with RCTs (Higgins 2011). We excluded cross‐over and cluster trials, because of the nature of the condition and intervention (Higgins 2011). Finally, we excluded RCTs that assessed the effectiveness of trimethoprim‐sulfamethoxazole because several H ducreyi isolates with resistance to this medication have been reported worldwide (CDC 2015).
Types of participants
We included men and non‐pregnant women over the age of 16 years who presented with purulent genital ulcers compatible with chancroid.
We divided participants into two groups: syndromic (based on the presence of common and reasonably consistent signs and symptoms) and aetiological diagnosis (supporting on a laboratory‐confirmed).
Types of interventions
Macrolides (any dose, frequency, duration and administration route) versus:
-
any other antibiotic treatment (any dose, frequency, duration and administration route);
-
any symptomatic treatment (e.g. buboes aspiration or analgesic treatment); or
-
any other macrolide type (any dose, frequency, duration and administration route).
Types of outcome measures
Primary outcomes
-
Clinical cure (proportion of participants with complete healing of ulcer and buboes after therapy). Syndromic and aetiological approaches.
-
Clinical improvement (proportion of participants with decrease in the size of the ulcer or buboes after intervention). Syndromic and aetiological approaches.
-
Microbiological cure (proportion of participants with eradication of H ducreyi after treatment, by in vitro cell culture or by polymerase chain reaction (PCR) test).
-
Serious adverse event (proportion of participants who experience any adverse effect requiring hospitalization or discontinuation of therapy, or both).
Secondary outcomes
-
Minor adverse events (e.g. metallic taste, nausea, vomiting, diarrhoea, headache, etc.).
-
Participant satisfaction with treatment.
-
Cost‐effectiveness of the intervention.
Search methods for identification of studies
We conducted a systematic search of the literature to identify relevant RCTs irrespective of their language of publication, publication date and publication status (published, unpublished, in press, and in progress). We performed both electronic searches in bibliographic databases and handsearches, as described in the Cochrane Handbook for Systematic Reviews of Interventions (Higgins 2011).
Electronic searches
We contacted the Information Specialist of the Cochrane STI Group in order to implement a comprehensive search strategy to identify as many relevant RCTs as possible in electronic databases. We used a combination of controlled vocabulary (Medical Subject Headings (MeSH), Emtree terms, DeCS, including exploded terms) and free‐text terms (considering spelling variants, synonyms, acronyms and truncation) for "Haemophilus ducreyi infection" and "Macrolides," with field labels, proximity operators and boolean operators. We listed our search strategies in Appendix 1.
We searched the following electronic databases:
-
Cochrane STI Group's Specialized Register, which includes RCTs and controlled clinical trials, from 1944 to 2017, located through: electronic searches of CENTRAL, MEDLINE and Embase; online handsearching of journals not indexed in MEDLINE or Embase, according to the journals' master list of the Cochrane STI Group;
-
Cochrane Central Register of Controlled Trials (CENTRAL), Ovid: inception to 30 October 2017;
-
MEDLINE, Ovid: inception to 30 October 2017;
-
MEDLINE In‐Process & Other Non‐Indexed Citations, Ovid: inception to 30 October 2017;
-
MEDLINE Daily Update, Ovid: inception to 30 October 2017;
-
Embase (Emabase.com): inception to 30 October 2017;
-
LILACS, IAHx interface: inception to 30 October 2017.
For MEDLINE, we used the Cochrane highly sensitive search strategy for identifying RCTs: sensitivity and precision maximizing version (2008 revision), Ovid format (Higgins 2011). We combined the LILACS search strategy with an RCT filter of IAHx interface.
Searching other resources
We searched the following resources for additional trials:
-
trials registers:
-
WHO International Clinical Trials Registry Platform (ICTRP) portal (apps.who.int/trialsearch/): inception to 30 October 2017;
-
ClinicalTrials.gov (clinicaltrials.gov/): inception to 30 October 2017;
-
-
Web of Science: inception to 30 October 2017.
Grey literature
We searched the System for Information on Grey Literature in Europe "OpenGrey" (www.opengrey.eu/) from inception to 30 October 2017.
Handsearching
We handsearched the conference proceeding abstracts of the following events:
-
International Society for Sexually Transmitted Diseases Research (ISSTDR) (www.isstdr.org/): 2007, 2009, 2011, 2013 and 2015;
-
British Association for Sexual Health and HIV (BASHH) (www.bashh.org/): 2014 and 2015;
-
International Congress on Infectious Diseases (ICID) (www.isid.org/): 2010, 2012 and 2014;
-
International Union against Sexually Transmitted Infections (IUSTI) (www.iusti.org/): 2011, 2012, 2013, 2014 and 2015;
-
International Society for Infectious Diseases (ISID) (www.isid.org/): 2011, 2012, 2013, 2014 and 2015;
-
International Meeting on Emerging Diseases and Surveillance (IMED) (www.isid.org/): 2007, 2009, 2011, 2013 and 2014;
-
Interscience Conference on Antimicrobial Agents and Chemotherapy (ICAAC) (www.icaac.org/): 2011, 2012, 2013, 2014 and 2015;
-
International Federation of Gynecology and Obstetrics (FIGO) (www.figo2012.org/home/): 2009, 2012 and 2015.
We handsearched other relevant publications on the same topic and the reference lists of all relevant studies identified.
Data collection and analysis
Selection of studies
LR and CFG‐A independently screened all the titles and abstracts retrieved from the search strategy to determine which trials we should assessed further. LR and CFG‐A independently investigated the full‐text articles of all potentially relevant articles and we resolved any disagreements through discussion. We presented a PRISMA flow diagram to show the process of trial selection (Figure 1). We listed all articles excluded after full‐text assessment and the reasons for exclusion in the Characteristics of excluded studies table.

Study flow diagram.
Data extraction and management
We designed a data extraction form, which was pilot tested, to extract data from the included studies. For eligible studies, LR and CFG‐A independently extracted data. We resolved any disagreements through discussion until we reached a consensus.
We extracted data on the following:
-
location of the study and setting;
-
study design;
-
power calculation performed;
-
inclusion and exclusion criteria;
-
syndromic or aetiological diagnosis.
-
baseline information of the participants to ensure comparable intervention groups at entry (number of women, number of men, age, prior treatment for ulcer, presence of buboes, site and number of lesions, HIV coinfection);
-
total number of intervention groups;
-
types of interventions: macrolide type, concentration, frequency and duration of treatment;
-
types of comparison: any other antibiotic treatment (any dose, frequency, duration and administration route) or any symptomatic treatment (e.g. buboes aspiration or analgesic treatment);
-
methods used to generate random allocation and maintain allocation concealment;
-
use of any method of blinding of researchers or participants to evaluate outcomes;
-
number of participants enrolled, randomized, excluded after randomization, and analyzed;
-
adherence to the planned intervention and other interventions in the groups under evaluation;
-
how the trial authors defined outcomes;
-
time of follow‐up of participants to measure outcomes;
-
use of intention‐to‐treat (ITT) analysis;
-
funding sources;
-
ethical issues: use of signed informed consent and ethics approval.
For eligible studies, two review authors (CFG‐A and LR) entered data into Review Manager 5 (RevMan 2014), and checked for accuracy. When information regarding any of the above was unclear, we attempted to contact the authors of the original trial reports for further details. For a single RCT report, we extracted data directly into a data collection form; in cases of multiple reports, we extracted data from each report separately and then combined information across data collection forms.
Assessment of risk of bias in included studies
Two review authors (LR and CFG‐A) independently assessed the risk of bias for each included trial using the criteria outlined in the Cochrane Handbook for Systematic Reviews of Interventions (Higgins 2011). We resolved any disagreements by consensus or by consulting a third review author (CH). The review authors who assessed the risk of bias in the included studies were theme and methodology experts.
1. Random sequence generation (checking for possible selection bias)
For each included study, we described the method used to generate the allocation sequence in sufficient detail to allow an assessment of whether it should produce comparable groups. We assessed the method as:
-
low risk of bias (any truly random process, e.g. random number table; computer random number generator);
-
high risk of bias (any non‐random process, e.g. odd or even date of birth; hospital or clinic record number); or
-
unclear risk of bias.
2. Allocation concealment (checking for possible selection bias)
For each included study, we described the method used to conceal allocation to interventions prior to assignment and assessed whether intervention allocation could have been foreseen in advance of, or during, recruitment or changed after assignment. We assessed the methods as:
-
low risk of bias (e.g. telephone or central randomization; consecutively numbered sealed opaque envelopes);
-
high risk of bias (open random allocation; unsealed or non‐opaque envelopes, alternation; date of birth); or
-
unclear risk of bias.
3.1. Blinding of participants and personnel (checking for possible performance bias)
For each included study, we described the methods used, if any, to blind study participants and personnel from the knowledge of which intervention a participant received. We considered that studies were at low risk of bias if they were blinded, or if we judged that the lack of blinding would have been unlikely to affect results. We assessed blinding separately for different outcomes or classes of outcomes. We assessed the methods as at:
-
low, high or unclear risk of bias for participants;
-
low, high or unclear risk of bias for personnel.
3.2. Blinding of outcome assessment (checking for possible detection bias)
For each included study, we described the methods used, if any, to blind outcome assessors from the knowledge of which intervention a participant received. We assessed blinding separately for different outcome or classes of outcomes. We assessed methods used to blind outcome assessment as:
-
low, high or unclear risk of bias.
4. Incomplete outcome data (checking for possible attrition bias due to the amount, nature and handling of incomplete outcome data)
For each included study and for each outcome or class of outcomes, we described the completeness of the data including attrition and exclusions from the analysis. We stated whether attrition and exclusions were reported and the number of participants included in the analysis at each stage (compared with the total number of randomized participants), reasons for attrition or exclusion where reported, and whether missing data were balanced across groups or were related to outcomes. Where sufficient information was reported, or could be supplied by the trial authors, we reincluded missing data in the analyses that we undertook. We assessed methods as:
-
low risk of bias (e.g. no missing outcome data; missing outcome data balanced across groups);
-
high risk of bias (e.g. numbers or reasons for missing data imbalance across groups; 'as treated' analysis done with substantial departure of intervention received from that assigned at randomization); or
-
unclear risk of bias.
We used a cut‐off point of 20% to determine whether a study was at low or high risk of bias according to the level of missing data.
5. Selective reporting (checking for reporting bias)
For each included study, we described how we investigated the possibility of selective outcome reporting bias and what we found. We assessed the methods as:
-
low risk of bias (where it was clear that the study authors reported all the study's prespecified outcomes and all expected outcomes of interest to the review);
-
high risk of bias (where not all the study's prespecified outcomes had been reported; one or more reported primary outcomes were not prespecified; outcomes of interest were reported incompletely and so could not be used; the study failed to include results of a key outcome that would have been expected to had been reported); or
-
unclear risk of bias.
6. Other bias (checking for bias due to problems not covered by (1) to (5) above)
For each included study, we described any important concerns we had about other possible sources of bias (e.g. stopped early, extreme baseline imbalance, claimed to have been fraudulent or funded by industry). We assessed whether each study was free of other problems that could put it at risk of bias. We assessed methods as:
-
low risk of other bias;
-
high risk of other bias; or
-
unclear risk of other bias.
7. Overall risk of bias
To summarize the quality of the evidence, we considered sequence generation, blinding of outcome assessor, incomplete outcome data and selective reporting domains to classify each study as:
-
low risk of bias when we judged all the four criteria as at low risk of bias;
-
high risk of bias when we judged at least one criterion as at high risk of bias;
-
unclear risk of bias when we judged all the four criteria as at unclear risk of bias and moderate risk of bias in the remaining cases (Tramacere 2015).
We explored the impact of the level of bias through undertaking sensitivity analyses (see Sensitivity analysis).
Measures of treatment effect
For dichotomous data, we presented the results as risk ratios (RRs) with 95% confidence intervals (CIs). The RR was used as a relative effect measure, which works well with a low or high rate of events, and is easy to interpret and use in clinical practice.
We performed meta‐analysis separately for participants with syndromic and aetiological diagnosis. Syndromic management implies an approach in which clinic diagnostic was based on the presence of common and reasonably consistent signs and symptoms without resorting to techniques for laboratory confirmation (WHO 2005).
Unit of analysis issues
Where we identified a clinical trial that randomized participants to several intervention groups, we determined which intervention groups were relevant. To avoid confusion for the reader, we included all intervention groups of the study in the Characteristics of included studies table, and provided a detailed description only of the intervention groups that were relevant to the review, and we only used these groups in the analyses.
Finally, to overcome a unit‐of‐analysis error for a study that could contribute multiple, correlated comparisons, we combined all relevant experimental intervention groups of the studies into a single group and combined all relevant control intervention groups into a single control group, to create a single pair‐wise comparison (Higgins 2011).
The unit of analysis was the participant who received treatment. We performed separate analyses for participants who had microbiological and clinical cure and clinical improvement at first week, between first and second week, or after the second week.
Dealing with missing data
We reported the percentage of observations with missing data of each included trial. For all outcomes, we performed analyses, as far as possible, on an ITT basis (i.e. we attempted to include all participants randomized to each group in the analyses, and we analyzed all participants in the group to which they were allocated, regardless of whether or not they received the allocated intervention). In case that this was not possible, the denominator for each outcome in each trial was the number randomized minus any participants whose outcomes were missing. We contacted the study investigators to request the missing data.
Assessment of heterogeneity
We assessed statistical heterogeneity in each meta‐analysis using the I² statistic and Chi² test values (Higgins 2011). We regarded heterogeneity as substantial if the I² statistic value was greater than 40% and if we found a low P value (less than 0.10) in the Chi² test for heterogeneity, which we plotted in a forest plot (RevMan 2014).
Assessment of reporting biases
We planned to explored publication bias through assessment of funnel plot asymmetry and formal tests. For continuous outcomes, we planned to use the test proposed by Egger 1997, and for dichotomous outcomes we planned to use the test proposed by Harbord 2006. However, we included fewer than 10 trials in the meta‐analysis, so we did not perform these analyses.
Data synthesis
We performed statistical analyses using Review Manager 5 (RevMan 2014). We conducted separate analyses for syndromic and aetiological syndromic and diagnose. Because WHO (WHO 2005) and other clinical practice guidelines (Min Salud 2013) recommend syndromic management for low‐income countries, we presented as primary analysis the effects of the intervention based on those studies that implemented this approach and as secondary analysis, the results from trials that used aetiological diagnosis.
We used a fixed‐effect meta‐analysis for combining data where it was reasonable to assume that studies were estimating the same underlying treatment effect (i.e. where trials were examining the same intervention, and the trial populations and methods were judged sufficiently similar). If there was clinical heterogeneity sufficient to expect that the underlying treatment effects differed between trials, or if we detected substantial statistical heterogeneity, we used a random‐effects meta‐analysis to produce an overall summary if a mean treatment effect across trials was considered clinically meaningful. We treated the random‐effects summary as the mean range of possible treatment effects and we discussed the clinical implications of treatment effects differing between trials. If the mean treatment effect was not clinically meaningful, we did not combine trials.
If we used random‐effects analyses, we presented the results as the mean treatment effect with 95% CIs, and the estimates of the Tau² and I² statistics.
'Summary of findings' tables
We used the GRADE approach to produce a 'Summary of findings' table for each comparison and by outcome (microbiological and clinical cure, clinical improvement, and serious or minor adverse effects) (Guyatt 2011) We downgraded the quality of evidence depending on the presence of the following factors:
-
study limitations;
-
inconsistency of results;
-
indirectness of evidence;
-
imprecision;
-
publication bias.
Subgroup analysis and investigation of heterogeneity
We explored the following potential sources of heterogeneity using subgroup analyses:
-
HIV status (positive versus negative participants);
-
disease clinical stage (ulcer versus ulcer plus inguinal buboes).
We restricted subgroup analyses to the primary outcomes: microbiological and clinical cure, clinical improvement and serious adverse events.
Sensitivity analysis
We performed sensitivity analyses to identify aspects of the review that might have affected the results; for example, where there was risk of bias associated with the quality of some of the included trials (low versus unclear or high risk of bias).
Results
Description of studies
Results of the search
We searched the available literature up to 30 October 2017. We retrieved 62 references, of which we screened 36 after we removed duplicates. Of these, we screened the full‐text of 10 references. Seven published trials met our inclusion criteria (Ballard 1990; D'Souza 1998; Dos Santos 1994; Malonza 1999; Martin 1995; Plummer 1983; Tyndall 1994). We excluded three studies (see the Characteristics of excluded studies table). We presented a PRISMA diagram in Figure 1 to illustrate the study selection process.
Included studies
The seven included trials had 875 participants with a sample size ranging from 46 to 245 people. Three trials were from Kenya (Malonza 1999; Plummer 1983; Tyndall 1994), and one trial each from India (D'Souza 1998), South Africa (Ballard 1990), USA (Martin 1995), and Brazil (Dos Santos 1994), Two trials were multicentric (Dos Santos 1994; Martin 1995), but only one of them used a method for sample size calculation (Martin 1995). Four studies recruited their participants from STI clinics (Ballard 1990; Dos Santos 1994; Malonza 1999; Martin 1995). Four studies were sponsored by academic institutions with industry support (Malonza 1999; Martin 1995; Plummer 1983; Tyndall 1994), and three did not made a clear allusion to this aspect (Ballard 1990; Dos Santos 1994; D'Souza 1998). All trials included outpatients. Six trials were published in English and one in Portuguese (Dos Santos 1994).
Population
Included studies recruited sexually active people aged 16 to 60 years without recent history of antibiotic treatment, who attended with genital ulcer disease with or without inguinal or femoral lymphadenopathies. Three studies included men and non‐pregnant women (D'Souza 1998; Malonza 1999; Martin 1995), and four recruited only men (Ballard 1990; Dos Santos 1994; Plummer 1983; Tyndall 1994). Four trials implemented syndromic diagnosis for enrolling their population, additionally presenting the effect of the intervention when the analysis was restricted to participants with aetiological confirmation (Malonza 1999; Martin 1995; Plummer 1983; Tyndall 1994). The remaining studies recruited and reported exclusively people with bacteriological confirmation (Ballard 1990; D'Souza 1998; Dos Santos 1994). One study supplemented the diagnostic pathway with PCR (Malonza 1999), two studies supplemented the diagnostic pathway by direct Gram‐stained smear looking for gram‐negative bacilli with a "school of fish" pattern (D'Souza 1998; Dos Santos 1994), and the remaining trials used media culture. The specimens were taken from ulcer base or the buboes.
With the aim of identifying participants with Treponema pallidum coinfection, the retrieved studies implemented dark field microscopy combined with serology (Ballard 1990; D'Souza 1998; Dos Santos 1994; Martin 1995; Plummer 1983) or PCR (Malonza 1999) or with microhaemaglutination (Tyndall 1994). HSV infection was discarded using media culture (Ballard 1990; Martin 1995; Plummer 1983), Tzanck smear (D'Souza 1998) or PCR (Malonza 1999). Two trials did not discarded HSV and Chlamydia infection ( Dos Santos 1994; Tyndall 1994). Five trials screened their participants for HIV (Ballard 1990; D'Souza 1998; Malonza 1999; Martin 1995; Tyndall 1994); the remaining two did not (Dos Santos 1994; Plummer 1983). HIV seropositivity was not an exclusion criterion in only two trials (Malonza 1999; Tyndall 1994).
Some studies search for other STIs such as Chlamydia trachomatis (Ballard 1990), Donovanosis (D'Souza 1998), or Neisseria gonorrhoeae (Plummer 1983), but this was not consistent between trials. Three studies included populations with high‐risk sexual behaviour such as migrant mine workers (Ballard 1990), sex workers (Malonza 1999), and men with prostitute contact (Tyndall 1994). One trial required participants to refrain from sexual contact during treatment (Ballard 1990), and another encouraged the participants to bring recent sexual contacts for evaluation and treatment (Tyndall 1994). The remaining included trials did not make reference to these aspects.
Interventions
The most frequent intervention was treatment with erythromycin (Ballard 1990; D'Souza 1998; Dos Santos 1994; Malonza 1999; Plummer 1983), followed by azithromycin (Martin 1995; Tyndall 1994). For erythromycin, two studies used 500 mg given orally four times a day (D'Souza 1998; Dos Santos 1994), and the other two used 500 mg three times a day (Ballard 1990; Malonza 1999) with a duration therapy of five (Ballard 1990), seven (D'Souza 1998; Malonza 1999; Tyndall 1994), 10 (Plummer 1983), or 15 days (Dos Santos 1994). The prescription of azithromycin was more consistent, and was provided in a single dose of 1 g orally (Martin 1995; Tyndall 1994).
Comparisons
All trials used antibiotic therapy as the comparison. Two studies prescribed ciprofloxacin 500 mg orally as a single dose (Malonza 1999), or 500 mg orally twice a day for three days (D'Souza 1998). One study administered thiamphenicol 5 g orally as single dose or 500 mg three times a day for five days (Dos Santos 1994). Two studies provided the treatment through the intramuscular route as a single dose of ceftriaxone 250 mg (Martin 1995) or spectinomycin 2 g (Ballard 1990).
Two studies compared two different macrolides regimens. One was the use of azithromycin 1 g orally single dose versus erythromycin 500 mg four times daily for seven days (Tyndall 1994), and the other compared erythromycin 500 mg orally four times daily versus rosaramicin 250 mg orally four times daily for 10 days (Plummer 1983).
Outcomes
There were some differences in reporting and definition of the outcomes between trials. All the studies repeated clinical assessments to determinate the evolution of the lesions (ulcers and buboes) caused by chancroid, registering the change in the healing processes, size and tenderness after treatment.
All studies reported clinical cure as the primary outcome defining this as the complete epithelialization of the ulcers after the second treatment week. Three trials included resolution of the buboes as part of clinical cure (Ballard 1990; Malonza 1999; Plummer 1983), while the other four did not mention this aspect. Four trials reported clinical improvement defining it as the presence of a lesion without complete epithelialization with or without decreased tenderness after the second treatment week (Ballard 1990; D'Souza 1998; Malonza 1999; Martin 1995). One study assessed the proportion of participants with microbiological cure at the end of two weeks' follow‐up, based on a negative isolation for the germ during a microbiological examination (Dos Santos 1994).
Four trials reported the frequency of minor adverse events during treatment capturing the information through symptoms reported by participants (D'Souza 1998; Malonza 1999; Martin 1995; Plummer 1983).
We obtained no data for the primary outcome of serious adverse events or for the secondary outcomes of participant satisfaction with treatment and cost‐effectiveness of the intervention.
Excluded studies
We excluded three studies for the following reasons: one was not an RCT, one did not provide a relevant comparison group (some participants were treated with trimethoprim) and one did not provide a valid intervention group (macrolides as prophylaxis to prevent an infection) (see Characteristics of excluded studies table).
Risk of bias in included studies
We summarized the risk of bias assessment in Figure 2 and Figure 3.

Risk of bias summary: review authors' judgements about each risk of bias item for each included study.
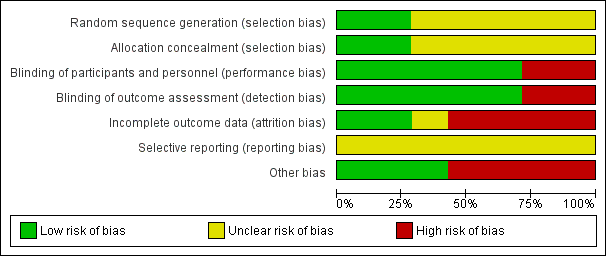
Risk of bias graph: review authors' judgements about each risk of bias item presented as percentages across all included studies.
Allocation
Random sequence generation (selection bias)
Two trials adequately reported the random sequence generation method by using a computer‐generated randomisation list, making selection bias at entry unlikely (Malonza 1999; Tyndall 1994). The remaining included trials did not report the random sequence generation method, making the risk of selection bias at entry unclear.
Allocation concealment (selection bias)
Two studies adequately implemented a valid concealment of allocation method, using sequentially numbered sealed envelopes or containers with a similar appearance (Malonza 1999; Tyndall 1994), making selection bias at entry unlikely. The remaining included trials did not report the method of allocation concealment, so we judged them at unclear risk of bias of selection bias.
Blinding
Five studies did not report the implemented methodology to blind study participants, outcome assessors and personnel from knowledge of which intervention a participant received (Ballard 1990; D'Souza 1998; Dos Santos 1994; Malonza 1999; Tyndall 1994). However, we considered the studies at low risk for performance or detection bias because the outcomes were objectively assessed, so the lack of blinding would be unlikely to affect results. Two studies did not report the methodology to blind study participants appropriately and so were at high risk for performance and detection bias because some outcomes were subjectively assessed and the lack of blinding would be likely to affect results (Martin 1995; Plummer 1983).
Incomplete outcome data
Two trials appropriately stated the attrition and exclusions at each stage; the reasons were balanced across groups and the level of missing data was not over 20%, making attrition bias unlikely (D'Souza 1998; Malonza 1999). Four studies were at high risk of bias because the level of missing data was over 20% or because they used an 'as treated' analysis with substantial departure of intervention received from that assigned at randomization (Ballard 1990; Martin 1995; Plummer 1983; Tyndall 1994). One study did not provide enough information making the risk of attrition bias unclear (Dos Santos 1994).
Selective reporting
The trial protocol was not available for all the included trials and it was unclear if the published reports included all the expected outcomes, including those that were prespecified. The report had insufficient information to permit judgement of 'yes' or 'no' (rated as unclear risk of bias).
Other potential sources of bias
Four studies were at high risks of bias because were sponsored by industry (Ballard 1990; Martin 1995; Plummer 1983; Tyndall 1994). The remaining retrieved trials appeared to be free from other sources of bias and were at low risk of other bias.
Overall risk of bias
Because of some limitations on sequence generation, blinding of outcome assessor, incomplete outcome data and selective reporting domains included studies were classified as unclear (D'Souza 1998; Dos Santos 1994; Malonza 1999) or high risk of bias (Ballard 1990; Martin 1995; Plummer 1983; Tyndall 1994).
Effects of interventions
See: Summary of findings for the main comparison Macrolides compared to any other antibiotic for treatment of Haemophilus ducreyi infection in sexually active adults; Summary of findings 2 Macrolide (erythromycin) compared to any other macrolide for Haemophilus ducreyi infection in sexually active adults
See: summary of findings Table for the main comparison for the main comparison 'Macrolides versus any other antibiotic treatment' and summary of findings Table 2 Macrolides versus macrolides (erythromycin versus other macrolide treatment).
1. Macrolides versus any other antibiotic treatment
Five trials including 664 participants compared macrolides versus any other antibiotic treatment (Ballard 1990; D'Souza 1998; Dos Santos 1994; Malonza 1999; Martin 1995). Not all contributed data to each outcome.
1.1a. Clinical cure: syndromic approach
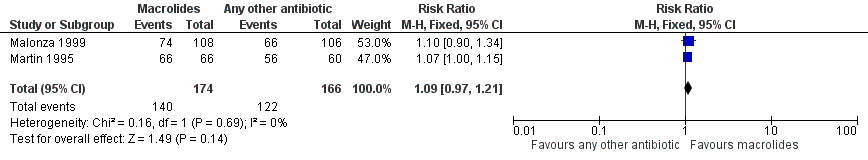
Two trials reported the syndromic approach to clinical cure (Malonza 1999; Martin 1995). There was no evidence of a difference between macrolides and any other antibiotic treatment (RR 1.09, 95% CI 0.97 to 1.21; 2 studies, 340 participants; I² = 0%; Analysis 1.1; Figure 4). The quality of the evidence was low due to limitations on risk of bias.

Forest plot of comparison: 1 Macrolides versus any other antibiotic treatment, outcome: 1.1 Clinical cure: syndromic approach.
1.1b. Clinical cure: aetiological approach
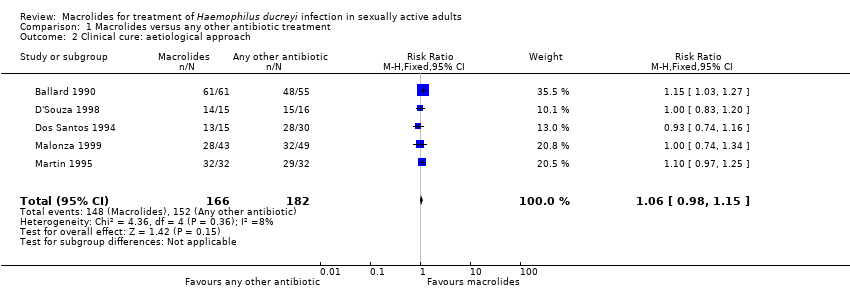
Five trials reported the aetiological approach to clinical cure (Ballard 1990; D'Souza 1998; Dos Santos 1994; Malonza 1999; Martin 1995). There was no evidence of a difference between macrolides and any other antibiotic treatment (RR 1.06, 95% CI 0.98 to 1.15; 5 studies, 348 participants; I² = 8%; Analysis 1.2; Figure 5). The quality of the evidence was low due to limitations on risk of bias.

Forest plot of comparison: 1 Macrolides versus any other antibiotic treatment, outcome: 1.2 Clinical cure: aetiological approach.
1.2a. Clinical improvement: syndromic approach
Two trials reported the syndromic approach to clinical improvement (Malonza 1999; Martin 1995). There was no evidence of a difference between macrolides and any other antibiotic treatment (RR 0.89, 95% CI 0.52 to 1.52; 2 studies, 340 participants; I² = 62%; Analysis 1.3). The quality of the evidence was very low due to limitations on precision, heterogeneity and risk of bias.
1.2b. Clinical improvement: aetiological approach
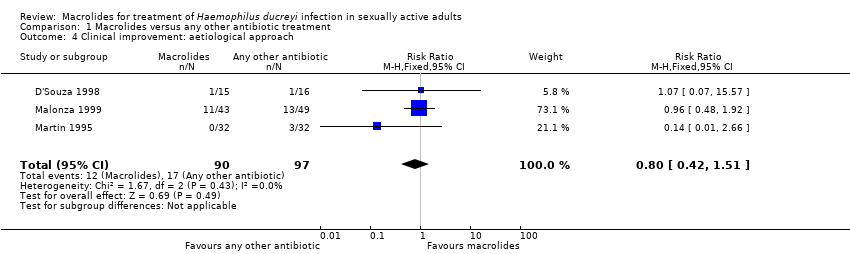
Three trials reported the aetiological approach to clinical improvement (D'Souza 1998; Malonza 1999; Martin 1995). There was no evidence of a difference between macrolides and any other antibiotic treatment (RR 0.80, 95% CI 0.42 to 1.51; 3 studies, 187 participants; I² = 0%; Analysis 1.4). The quality of the evidence was low due to limitations on precision and risk of bias.
1.3. Microbiological cure
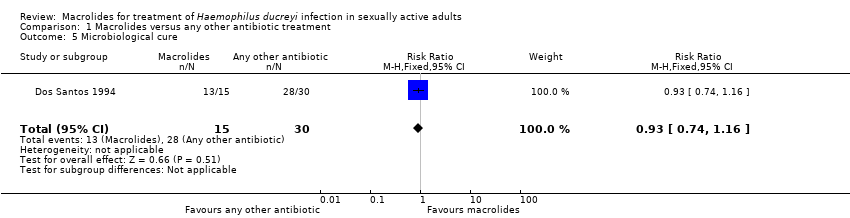
One trial assessed microbiological cure (Dos Santos 1994). There was no evidence of a difference between macrolides and any other antibiotic treatment (RR 0.93, 95% CI 0.74 to 1.16; 1 study, 45 participants; Analysis 1.5). The quality of evidence was low due to limitations on imprecision.
1.4. Serious adverse events
None of the trials reported serious adverse events.
1.5. Minor adverse events
Three trials reported minor adverse effects (D'Souza 1998; Malonza 1999; Martin 1995). There was no evidence of a significance difference between macrolides and any other antibiotic treatment (RR 1.34, 95% CI 0.24 to 7.51; 3 studies, 412 participants; I² = 62%; Analysis 1.6). The quality of the evidence was very low due to limitations on precision, heterogeneity and risk of bias.
1.6. Participant satisfaction with treatment
None of the trials reported participant satisfaction with treatment.
1.7. Cost‐effectiveness of the intervention
None of the trials reported cost‐effectiveness of the intervention.
2. Macrolides versus any symptomatic treatment
We found no trials comparing macrolides versus any symptomatic treatment.
3. Macrolides versus any other macrolide (erythromycin versus any other macrolide type)
Two trials including 269 participants compared erythromycin versus azithromycin or rosaramicin (Plummer 1983; Tyndall 1994). Not all contributed data to each outcome.
3.1a. Clinical cure: syndromic approach
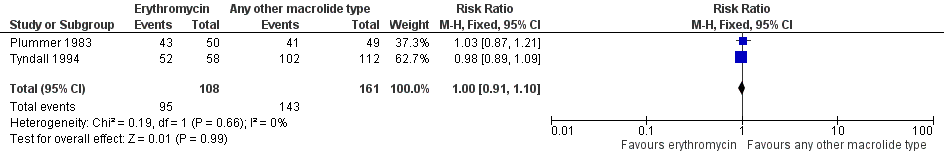
Two trials reported the syndromic approach to clinical cure (Plummer 1983; Tyndall 1994). There was no evidence of a difference between groups (RR 1.00, 95% CI 0.91 to 1.10; 2 studies, 269 participants; I² = 0%; Analysis 2.1; Figure 6). The quality of the evidence was low due to limitations on risk of bias.

Forest plot of comparison: 2 Macrolides versus macrolides (erythromycin versus other macrolide treatment), outcome: 2.1 Clinical cure: syndromic approach.
3.1b. Clinical cure: aetiological approach
Two trials reported the aetiological approach to clinical cure (Plummer 1983; Tyndall 1994). There was no evidence of a difference between the groups (RR 1.04, 95% CI 0.93 to 1.16; 2 studies, 211 participants; I² = 0%; Analysis 2.2). The quality of the evidence was low due to limitations on risk of bias.
3.2a. Clinical improvement: syndromic approach
Neither trial reported the syndromic approach to clinical improvement.
3.2b. Clinical improvement: aetiological approach
Neither trial reported the aetiological approach to clinical improvement.
3.3. Microbiological cure
Neither trial reported microbiological cure.
3.4. Serious adverse events
Neither trial reported serious adverse events.
3.5. Minor adverse event
One trial reported minor adverse events (Plummer 1983). There were no significant differences for minor adverse effects between groups (RR 1.14, 95% CI 0.63 to 2.06; 1 trial, 101 participants; Analysis 2.3). The quality of the evidence was very low due to limitations on precision, heterogeneity and risk of bias.
3.6. Participant satisfaction with treatment
Neither trial reported participant satisfaction with treatment.
3.7. Cost‐effectiveness of the intervention
Neither trial reported cost‐effectiveness of the intervention.
Subgroup analysis and investigation of heterogeneity
We performed subgroup analyses to explore whether differences by HIV status (positive versus negative participants) modified the observed results (Analysis 3.1). We only retrieved information in the analyses of 'clinical cure' for the comparison erythromycin versus any other macrolide. The tests for subgroup effect were not significantly different between HIV‐positive participants (RR 1.02, 95% CI 0.73 to 1.43; 1 study, 38 participants) and HIV‐negative participants (RR 1.04, 95% CI 0.94 to 1.14; 1 study, 89 participants) (P = 0.94).
We could not analyze potential sources of heterogeneity using subgroup analysis by disease clinical stage (ulcer versus ulcer plus inguinal buboes), because of lack of information.
Sensitivity analysis
We could not carry out the planned sensitivity analyses based on the quality of the included trials because all of the included studies were assessed at unclear or high risk of bias.
Discussion
Summary of main results
Seven RCTs (875 participants) met our inclusion criteria of which four were funded by industry. Five trials (664 participants) compared macrolides with ceftriaxone, ciprofloxacin, spectinomycin or thiamphenicol. Low quality evidence suggested that there was no difference between the groups after treatment in terms of clinical cure (RR 1.09, 95% CI 0.97 to 1.21; 2 studies, 340 participants with syndromic approach and RR 1.06, 95% CI 0.98 to 1.15; 5 studies, 348 participants with aetiological diagnosis) or improvement (RR 0.89, 95% CI 0.52 to 1.52; 2 studies, 340 participants with syndromic approach and RR 0.80, 95% CI 0.42 to 1.51; 3 studies, 187 participants with aetiological diagnosis). Based on low and very low quality evidence, there could be no difference between macrolides and any other antibiotic treatments for the outcomes microbiological cure (RR 0.93, 95% CI 0.74 to 1.16; 1 study, 45 participants) and minor adverse effects (RR 1.34, 95% CI 0.24 to 7.51; 3 studies, 412 participants).
Two trials (269 participants) compared erythromycin with any other macrolide type. Low quality evidence suggested that, compared with azithromycin or rosaramicin, a long course of erythromycin did not increase clinical cure (RR 1.00, 95% CI 0.91 to 1.10; 2 studies, 269 participants with syndromic approach and RR 1.04, 95% CI 0.93 to 1.16; 2 studies, 211 participants with aetiological diagnosis), with a similar frequency of minor adverse effects between the groups (RR 1.14, 95% CI 0.63 to 2.06; 1 trial, 101 participants). For this comparison, subgroup analysis did not suggest a significant difference between HIV‐positive participants (RR 1.02, 95% CI 0.73 to 1.43; 1 trial, 38 participants) and HIV‐negative participants (RR 1.04, 95% CI 0.94 to 1.14; 1 trial, 89 participants).
We downgraded the quality of evidence to low, because of imprecision, some limitations on risk of bias and heterogeneity.
Overall completeness and applicability of evidence
We conducted a comprehensive search to retrieve all relevant RCTs. Most outcomes were evaluated except for serious adverse events, cost effectiveness of the intervention and participant satisfaction with treatment, as none of the trial reported these outcomes.
The applicability of the evidence is both broadly and narrowly related with clinical practice. Broad because the studies included populations affected with more frequency by this condition (men and non‐pregnant women sexually active aged between 16 and 60 years, with or without high‐risk sexual behaviour, including people with HIV). Tightly related with clinical practice, as trials recruited participants who had the presence of genital ulcers consistent with a clinical diagnosis of chancroid (i.e. painful, non‐indurated lesions with purulent bases, with or without inguinal or femoral adenopathies). An aspect with high relevance is that this evidence could be applied to vulnerable and economically disadvantaged populations who live in high‐income countries as well as in low‐income countries, where the syndromic approach is the recommended management for people with genital ulcers, given the difficulty of perform an aetiological diagnosis. The interventions analysed in this review encompass multiple clinical scenarios that are common in current practice including various antibiotic regimens with different regimens from single doses to 10 days of therapy. Because there is sparse available evidence about the safety and effectiveness of macrolides to treat H ducreyi infection in people with HIV, these results should be taken with caution as they are based on small studies.
Quality of the evidence
We rated the quality of the evidence for this systematic review according to the recommendations of the GRADE Working Group (Higgins 2011). All included studies were at high or unclear risk of bias and consequently were graded with low or very low confidence on the estimate of effect. In addition, the design and execution limitations of retrieved trials, exhibited flaws in terms of their consistency (heterogeneity) and imprecision (outcome events with wide CIs and some optimal information size was not achieved). We could not evaluate publication bias because there were too few included trials for each comparison. All the results of this review should be taken with caution as they were based on low and very low quality evidence (see summary of findings Table for the main comparison and summary of findings Table 2).
Potential biases in the review process
This systematic review has some strengths as we adhered to the predefined objectives and study eligibility criteria. Our search included an appropriate range of databases and sources, including additional methods to identify eligible studies. We assessed all studies for risk of bias and graded the quality of evidence using the GRADE approach. However, we have some concerns about publication bias and related small‐study effects. We were unable to prepare a funnel plot to examine publication bias due to a lack of studies. Four of the included trials were funded by industry and due to the limited number of trials for each comparison our confidence on the estimate of effect was low and very low.
Agreements and disagreements with other studies or reviews
There are no previous systematic reviews published on this topic. Most outcomes of interest in this review revealed that there were no differences between ceftriaxone, ciprofloxacin, spectinomycin or thiamphenicol use against macrolides for the treatment of chancroid. The evidence included in our systematic review supports the recommendations from guideline development groups (CDC 2015; Gaitán‐Duarte 2013), who proposed that azithromycin single dose could be similar in terms of effectiveness, when this is compared with a long course of erythromycin (CDC 2015) or against other therapeutic alternatives (Gaitán‐Duarte 2013).

Study flow diagram.

Risk of bias summary: review authors' judgements about each risk of bias item for each included study.

Risk of bias graph: review authors' judgements about each risk of bias item presented as percentages across all included studies.
Forest plot of comparison: 1 Macrolides versus any other antibiotic treatment, outcome: 1.1 Clinical cure: syndromic approach.

Forest plot of comparison: 1 Macrolides versus any other antibiotic treatment, outcome: 1.2 Clinical cure: aetiological approach.
Forest plot of comparison: 2 Macrolides versus macrolides (erythromycin versus other macrolide treatment), outcome: 2.1 Clinical cure: syndromic approach.

Comparison 1 Macrolides versus any other antibiotic treatment, Outcome 1 Clinical cure: syndromic approach.
Comparison 1 Macrolides versus any other antibiotic treatment, Outcome 2 Clinical cure: aetiological approach.

Comparison 1 Macrolides versus any other antibiotic treatment, Outcome 3 Clinical improvement: syndromic approach.
Comparison 1 Macrolides versus any other antibiotic treatment, Outcome 4 Clinical improvement: aetiological approach.
Comparison 1 Macrolides versus any other antibiotic treatment, Outcome 5 Microbiological cure.

Comparison 1 Macrolides versus any other antibiotic treatment, Outcome 6 Minor adverse events.

Comparison 2 Macrolides versus macrolides (erythromycin versus other macrolide treatment), Outcome 1 Clinical cure: syndromic approach.

Comparison 2 Macrolides versus macrolides (erythromycin versus other macrolide treatment), Outcome 2 Clinical cure: aetiological approach.

Comparison 2 Macrolides versus macrolides (erythromycin versus other macrolide treatment), Outcome 3 Minor adverse events.

Comparison 3 Macrolides versus macrolides (subgroup analysis by HIV status), Outcome 1 Clinical cure.
| Macrolides compared to any other antibiotic for treatment of Haemophilus ducreyi infection in sexually active adults | |||||
| Patient or population: sexually active adults Settings: ‐ Intervention: macrolides Comparison: any other antibiotic | |||||
| Outcomes | Anticipated absolute effects* (95% CI) | Relative effect | No of participants | Quality of the evidence | |
| Risk with any other antibiotic | Risk with macrolides | ||||
| Clinical cure: syndromic approach | Study population | RR 1.09 | 340 | ⊕⊕⊝⊝ | |
| 735 per 1000 | 801 per 1000 | ||||
| Clinical cure: aetiological approach | Study population | RR 1.06 | 348 | ⊕⊕⊝⊝ | |
| 835 per 1000 | 885 per 1000 | ||||
| Clinical improvement: syndromic approach | Study population | RR 0.89 | 340 | ⊕⊝⊝⊝ | |
| 139 per 1000 | 123 per 1000 | ||||
| Clinical improvement: aetiological approach | Study population | RR 0.80 | 187 | ⊕⊕⊝⊝ | |
| 175 per 1000 | 140 per 1000 | ||||
| Microbiological cure | Study population | RR 0.93 | 45 | ⊕⊕⊝⊝ | |
| 933 per 1000 | 868 per 1000 | ||||
| Minor adverse events | Study population | RR 1.34 | 412 | ⊕⊝⊝⊝ | |
| 64 per 1000 | 86 per 1000 | ||||
| *The risk in the intervention group (and its 95% confidence interval) is based on the assumed risk in the comparison group and the relative effect of the intervention (and its 95% CI). CI: confidence interval; RCT: randomized controlled trial; RR: risk ratio. | |||||
| GRADE Working Group grades of evidence | |||||
| 1Downgraded by two levels for very serious limitations on blinding, incomplete outcome data and other bias domains. 2Downgraded by one level for substantial heterogeneity (I² > 40%). 3Downgraded by one level for imprecision as the 95% CI crossed through 0.75 and 1.25. 4Downgraded by one level for serious limitations on blinding, incomplete outcome data and other bias domains. 5Downgraded by two levels for imprecision as the 95% CI crossed through 0.75 and optimal information size was not achieved. | |||||
| Macrolide (erythromycin) compared to any other macrolide for Haemophilus ducreyi infection in sexually active adults | |||||
| Patient or population: sexually active adults Settings: ‐ Intervention: macrolide Comparison: any other macrolide | |||||
| Outcomes | Anticipated absolute effects* (95% CI) | Relative effect | No of participants | Quality of the evidence | |
| Risk with macrolides (erythromycin | Risk with macrolides | ||||
| Clinical cure: syndromic approach | Study population | RR 1.00 | 269 | ⊕⊕⊝⊝ | |
| 888 per 1000 | 888 per 1000 | ||||
| Clinical cure: aetiological approach | Study population | RR 1.04 | 211 | ⊕⊕⊝⊝ | |
| 860 per 1000 | 894 per 1000 | ||||
| Minor adverse events | Study population | RR 1.14 | 101 | ⊕⊝⊝⊝ | |
| 286 per 1000 | 326 per 1000 | ||||
| *The risk in the intervention group (and its 95% confidence interval) is based on the assumed risk in the comparison group and the relative effect of the intervention (and its 95% CI). CI: confidence interval; RCT: randomized controlled trial; RR: risk ratio. | |||||
| GRADE Working Group grades of evidence | |||||
| 1Downgraded by two levels for very serious limitations on blinding, incomplete outcome data and other bias domains. 2Downgraded by one level for serious limitations on blinding, incomplete outcome data and other bias domains. 3Downgraded by two levels for imprecision as the 95% CI crosses through 0.75 and 1.25 and optimal information size was not achieved. | |||||
| Outcome or subgroup title | No. of studies | No. of participants | Statistical method | Effect size |
| 1 Clinical cure: syndromic approach Show forest plot | 2 | 340 | Risk Ratio (M‐H, Fixed, 95% CI) | 1.09 [0.97, 1.21] |
| 2 Clinical cure: aetiological approach Show forest plot | 5 | 348 | Risk Ratio (M‐H, Fixed, 95% CI) | 1.06 [0.98, 1.15] |
| 3 Clinical improvement: syndromic approach Show forest plot | 2 | 340 | Risk Ratio (M‐H, Fixed, 95% CI) | 0.89 [0.52, 1.52] |
| 4 Clinical improvement: aetiological approach Show forest plot | 3 | 187 | Risk Ratio (M‐H, Fixed, 95% CI) | 0.80 [0.42, 1.51] |
| 5 Microbiological cure Show forest plot | 1 | 45 | Risk Ratio (M‐H, Fixed, 95% CI) | 0.93 [0.74, 1.16] |
| 6 Minor adverse events Show forest plot | 3 | 412 | Risk Ratio (M‐H, Random, 95% CI) | 1.34 [0.24, 7.51] |
| Outcome or subgroup title | No. of studies | No. of participants | Statistical method | Effect size |
| 1 Clinical cure: syndromic approach Show forest plot | 2 | 269 | Risk Ratio (M‐H, Fixed, 95% CI) | 1.00 [0.91, 1.10] |
| 2 Clinical cure: aetiological approach Show forest plot | 2 | 211 | Risk Ratio (M‐H, Fixed, 95% CI) | 1.04 [0.93, 1.16] |
| 3 Minor adverse events Show forest plot | 1 | 101 | Risk Ratio (M‐H, Fixed, 95% CI) | 1.14 [0.63, 2.06] |
| Outcome or subgroup title | No. of studies | No. of participants | Statistical method | Effect size |
| 1 Clinical cure Show forest plot | 1 | 127 | Risk Ratio (M‐H, Fixed, 95% CI) | 1.03 [0.92, 1.16] |
| 1.1 HIV positive | 1 | 38 | Risk Ratio (M‐H, Fixed, 95% CI) | 1.02 [0.73, 1.43] |
| 1.2 HIV negative | 1 | 89 | Risk Ratio (M‐H, Fixed, 95% CI) | 1.04 [0.94, 1.14] |