脐带结扎前为早产儿提供呼吸支持与不提供呼吸支持的比较
Appendices
Appendix 1. Search strategies
PubMed: ((infant, newborn[MeSH] OR newborn OR neonate OR neonatal OR premature OR low birth weight OR VLBW OR LBW or infan* or neonat*) AND (randomised controlled trial [pt] OR controlled clinical trial [pt] OR Clinical Trial[ptyp] OR randomised [tiab] OR placebo [tiab] OR clinical trials as topic [mesh: noexp] OR randomly [tiab] OR trial [ti]) NOT (animals [mh] NOT humans [mh]))
Embase: (infant, newborn or newborn or neonate or neonatal or premature or very low birth weight or low birth weight or VLBW or LBW or Newborn or infant* or neonat*) AND (human not animal) AND (randomized controlled trial or controlled clinical trial or randomized or placebo or clinical trials as topic or randomly or trial or clinical trial)
CINAHL: (infant, newborn OR newborn OR neonate OR neonatal OR premature OR low birth weight OR VLBW OR LBW or Newborn or infant* or neonat*) AND (randomized controlled trial OR controlled clinical trial OR randomized OR placebo OR clinical trials as topic OR randomly OR trial OR PT clinical trial)
Cochrane Library: (infant or newborn or neonate or neonatal or premature or very low birth weight or low birth weight or VLBW or LBW)
Appendix 2. Risk of bias tool
We used the standard methods of Cochrane and Cochrane Neonatal to assess the methodological quality (to meet the validity criteria) of the trials. For each trial, we sought information regarding the method of randomization, and the blinding and reporting of all outcomes of all the infants enrolled in the trial. We assessed each criterion as low, high, or unclear risk. Two review authors separately assessed each study. We resolved any disagreement by discussion. We added this information to the table Characteristics of included studies. We evaluated the following issues and entered the findings into the risk of bias table.
Sequence generation (checking for possible selection bias). Was the allocation sequence adequately generated?
For each included study, we categorized the method used to generate the allocation sequence as:
-
low risk (any truly random process, e.g. random number table; computer random number generator);
-
high risk (any non‐random process, e.g. odd or even date of birth; hospital or clinic record number);
-
unclear risk.
Allocation concealment (checking for possible selection bias). Was allocation adequately concealed?
For each included study, we categorized the method used to conceal the allocation sequence as:
-
low risk (e.g. telephone or central randomization; consecutively numbered sealed opaque envelopes);
-
high risk (open random allocation; unsealed or non‐opaque envelopes, alternation; date of birth);
-
unclear risk.
Blinding of participants and personnel (checking for possible performance bias). Was knowledge of the allocated intervention adequately prevented during the study?
For each included study, we categorized the methods used to blind study participants and personnel from knowledge of which intervention a participant received. Blinding was assessed separately for different outcomes or class of outcomes. We categorized the methods as:
-
low risk, high risk, or unclear risk for participants;
-
low risk, high risk, or unclear risk for personnel.
Blinding of outcome assessment (checking for possible detection bias). Was knowledge of the allocated intervention adequately prevented at the time of outcome assessment?
For each included study, we categorized the methods used to blind outcome assessment. Blinding was assessed separately for different outcomes or class of outcomes. We categorized the methods as:
-
low risk for outcome assessors;
-
high risk for outcome assessors;
-
unclear risk for outcome assessors.
Incomplete outcome data (checking for possible attrition bias through withdrawals, dropouts, protocol deviations). Were incomplete outcome data adequately addressed?
For each included study and for each outcome, we described the completeness of data including attrition and exclusions from the analysis. We noted whether attrition and exclusions were reported, the numbers included in the analysis at each stage (compared with the total randomized participants), reasons for attrition or exclusion where reported, and whether missing data were balanced across groups or were related to outcomes. Where sufficient information was reported or supplied by the trial authors, we re‐included missing data in the analyses. We categorized the methods as:
-
low risk (< 20% missing data);
-
high risk (≥ 20% missing data);
-
unclear risk.
Selective reporting bias. Are reports of the study free of suggestion of selective outcome reporting?
For each included study, we described how we investigated the possibility of selective outcome reporting bias and what we found. We assessed the methods as:
-
low risk (where it was clear that all of the study's prespecified outcomes and all expected outcomes of interest to the review were reported);
-
high risk (where not all the study's prespecified outcomes were reported; one or more reported primary outcomes were not prespecified outcomes of interest and were reported incompletely and so could not be used; study failed to include results of a key outcome that would have been expected to have been reported);
-
unclear risk.
Other sources of bias. Was the study apparently free of other problems that could put it at a high risk of bias?
For each included study, we described any important concerns we had about other possible sources of bias (e.g. whether there was a potential source of bias related to the specific study design or whether the trial was stopped early due to some data‐dependent process). We assessed whether each study was free of other problems that could put it at risk of bias as:
-
low risk;
-
high risk;
-
unclear risk.
If needed, we explored the impact of the level of bias through undertaking sensitivity analyses.

Study flow diagram.
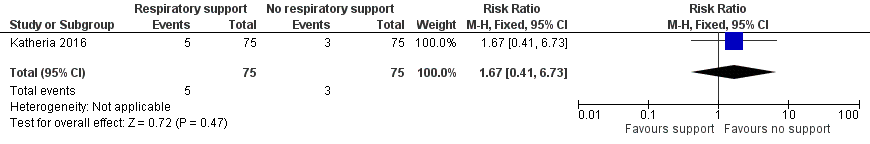
Forest plot of comparison: 1 Respiratory support versus no respiratory support during delayed cord clamping in preterm infants, outcome: 1.1 Mortality during neonatal admission.
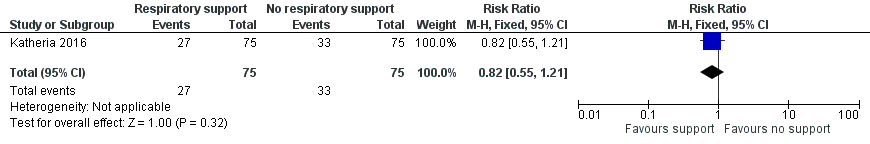
Forest plot of comparison: 1 Respiratory support versus no respiratory support during delayed cord clamping in preterm infants, outcome: 1.2 Need for intubation in delivery room.
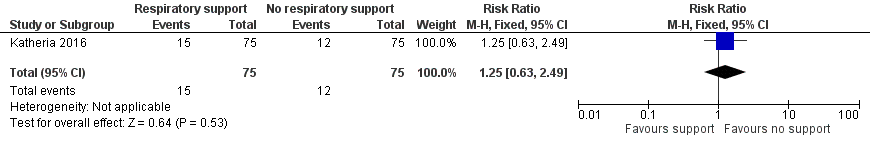
Forest plot of comparison: 1 Respiratory support versus no respiratory support during delayed cord clamping in preterm infants, outcome: 1.3 Inotropic support for hypotension.
![Forest plot of comparison: 1 Respiratory support versus no respiratory support during delayed cord clamping in preterm infants, outcome: 1.4 Peak haematocrit in first 24 hours [%].](/es/cdsr/doi/10.1002/14651858.CD012491.pub2/media/CDSR/CD012491/image_n/nCD012491-AFig-FIG05.png)
Forest plot of comparison: 1 Respiratory support versus no respiratory support during delayed cord clamping in preterm infants, outcome: 1.4 Peak haematocrit in first 24 hours [%].

Forest plot of comparison: 1 Respiratory support versus no respiratory support during delayed cord clamping in preterm infants, outcome: 1.5 Blood transfusion during neonatal admission.
![Forest plot of comparison: 1 Respiratory support versus no respiratory support during delayed cord clamping in preterm infants, outcome: 1.6 Phototherapy for hyperbilirubinaemia [days].](/es/cdsr/doi/10.1002/14651858.CD012491.pub2/media/CDSR/CD012491/image_n/nCD012491-AFig-FIG07.png)
Forest plot of comparison: 1 Respiratory support versus no respiratory support during delayed cord clamping in preterm infants, outcome: 1.6 Phototherapy for hyperbilirubinaemia [days].

Forest plot of comparison: 1 Respiratory support versus no respiratory support during delayed cord clamping in preterm infants, outcome: 1.7 Use of surfactant in the first 48 hours of life.
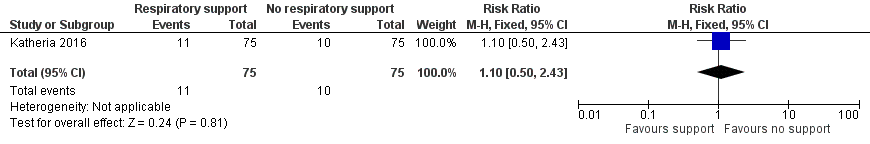
Forest plot of comparison: 1 Respiratory support versus no respiratory support during delayed cord clamping in preterm infants, outcome: 1.8 Bronchopulmonary dysplasia.

Forest plot of comparison: 1 Respiratory support versus no respiratory support during delayed cord clamping in preterm infants, outcome: 1.9 Intraventricular haemorrhage (of any grade).

Forest plot of comparison: 1 Respiratory support versus no respiratory support during delayed cord clamping in preterm infants, outcome: 1.10 Severe intraventricular haemorrhage grade 3 or 4.

Comparison 1 Respiratory support versus no respiratory support during delayed cord clamping in preterm infants, Outcome 1 Mortality during neonatal admission.
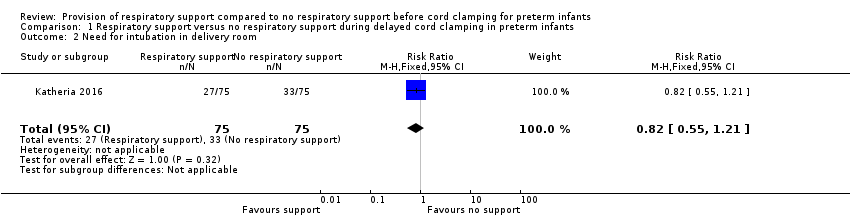
Comparison 1 Respiratory support versus no respiratory support during delayed cord clamping in preterm infants, Outcome 2 Need for intubation in delivery room.

Comparison 1 Respiratory support versus no respiratory support during delayed cord clamping in preterm infants, Outcome 3 Inotropic support for hypotension.
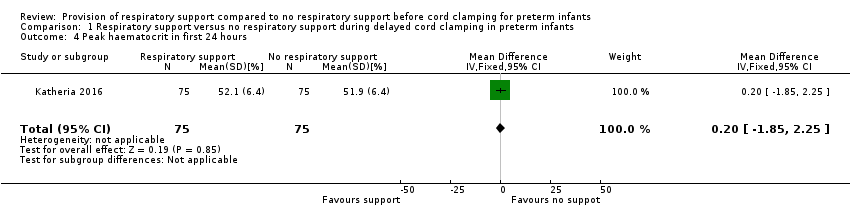
Comparison 1 Respiratory support versus no respiratory support during delayed cord clamping in preterm infants, Outcome 4 Peak haematocrit in first 24 hours.
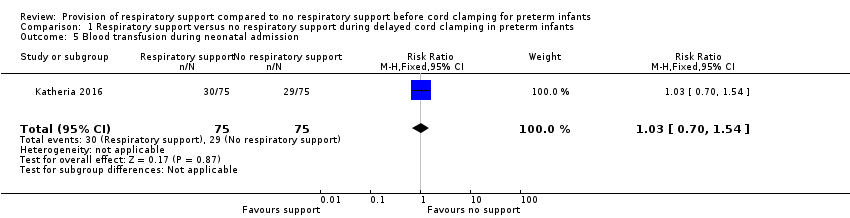
Comparison 1 Respiratory support versus no respiratory support during delayed cord clamping in preterm infants, Outcome 5 Blood transfusion during neonatal admission.
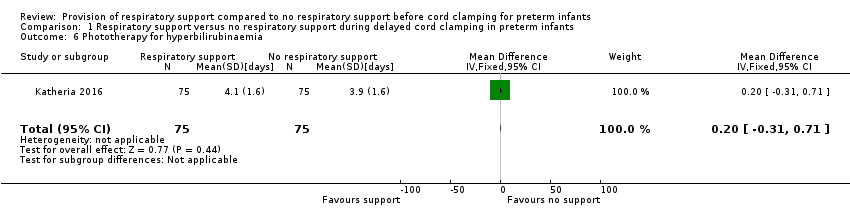
Comparison 1 Respiratory support versus no respiratory support during delayed cord clamping in preterm infants, Outcome 6 Phototherapy for hyperbilirubinaemia.

Comparison 1 Respiratory support versus no respiratory support during delayed cord clamping in preterm infants, Outcome 7 Use of surfactant in the first 48 hours of life.
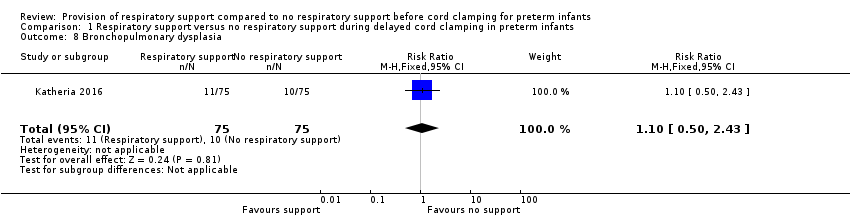
Comparison 1 Respiratory support versus no respiratory support during delayed cord clamping in preterm infants, Outcome 8 Bronchopulmonary dysplasia.
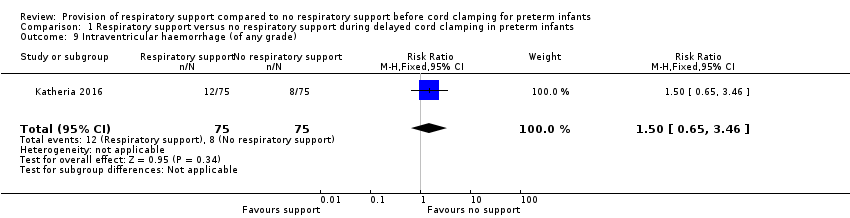
Comparison 1 Respiratory support versus no respiratory support during delayed cord clamping in preterm infants, Outcome 9 Intraventricular haemorrhage (of any grade).

Comparison 1 Respiratory support versus no respiratory support during delayed cord clamping in preterm infants, Outcome 10 Severe intraventricular haemorrhage grade 3 or 4.

Comparison 1 Respiratory support versus no respiratory support during delayed cord clamping in preterm infants, Outcome 11 Periventricular leukomalacia.

Comparison 1 Respiratory support versus no respiratory support during delayed cord clamping in preterm infants, Outcome 12 Necrotizing enterocolitis ≥ Bell's stage 2.

Comparison 1 Respiratory support versus no respiratory support during delayed cord clamping in preterm infants, Outcome 13 Retinopathy of prematurity requiring treatment.
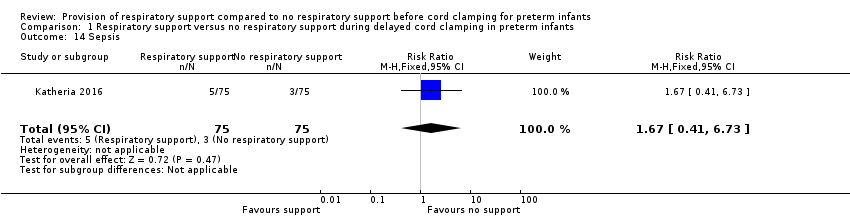
Comparison 1 Respiratory support versus no respiratory support during delayed cord clamping in preterm infants, Outcome 14 Sepsis.

Comparison 1 Respiratory support versus no respiratory support during delayed cord clamping in preterm infants, Outcome 15 Pharmacological treatment for patent ductus arteriosus.

Comparison 1 Respiratory support versus no respiratory support during delayed cord clamping in preterm infants, Outcome 16 Surgical ligation for patent ductus arteriosus.
| Respiratory support compared with no respiratory support before cord clamping in preterm infants | ||||
| Patient or population: preterm infants Settings: undergoing delayed cord clamping Intervention: respiratory support Comparison: no respiratory support | ||||
| Outcomes | Relative effect | No of participants | Quality of the evidence | Comments |
| Mortality ≤2 years after hospital discharge | RR 1.67 (0.41 to 6.73) | 150 | ⊕⊕⊝⊝ | Secondary study outcome. |
| Inotropic support for hypotension | RR 1.25 (0.63 to 2.49) | 150 | ⊕⊕⊝⊝ | ‐ |
| Peak haematocrit | MD 0.20 (‐1.85 to 2.25) | 150 | ⊕⊕⊕⊝ | Primary outcome. |
| Blood transfusion during neonatal admission | RR 1.03 (0.70 to 1.54) | 150 | ⊕⊕⊕⊝ | 40% with this outcome |
| Phototherapy for hyperbilirubinaemia | MD 0.20 (‐0.31 to 0.71) | 150 | ⊕⊕⊕⊝ | From unpublished data |
| Intraventricular haemorrhage (of any grade) | RR 1.50 (0.65 to 3.46) | 150 | ⊕⊕⊝⊝ | Secondary outcome. |
| Severe intraventricular haemorrhage grade 3 or 4 | RR 1.33 (0.31 to 5.75) | 150 | ⊕⊝⊝⊝ | Uncommon secondary outcome. |
| CI: confidence interval; MD: mean difference; RR: risk ratio. | ||||
| GRADE Working Group grades of evidence | ||||
| In the published report, results were presented according to method of delivery. For categorical variables (e.g. mortality), the RR was calculated for the delayed cord clamping with ventilation support (intervention) and delayed cord clamping (control) groups as a whole. For continuous variables (e.g. haematocrit), the authors provided unpublished data that enabled whole group statistics to be determined. 1Downgraded one level due to lack of precision with wide confidence intervals. 2Downgraded two levels due to lack of precision (confidence intervals included both important benefit and harm). The optimal information size for a 30% risk reduction with 80% power and 95% confidence intervals was 3280 infants per group. 3Unpublished data. | ||||
| Outcome or subgroup title | No. of studies | No. of participants | Statistical method | Effect size |
| 1 Mortality during neonatal admission Show forest plot | 1 | 150 | Risk Ratio (M‐H, Fixed, 95% CI) | 1.67 [0.41, 6.73] |
| 2 Need for intubation in delivery room Show forest plot | 1 | 150 | Risk Ratio (M‐H, Fixed, 95% CI) | 0.82 [0.55, 1.21] |
| 3 Inotropic support for hypotension Show forest plot | 1 | 150 | Risk Ratio (M‐H, Fixed, 95% CI) | 1.25 [0.63, 2.49] |
| 4 Peak haematocrit in first 24 hours Show forest plot | 1 | 150 | Mean Difference (IV, Fixed, 95% CI) | 0.20 [‐1.85, 2.25] |
| 5 Blood transfusion during neonatal admission Show forest plot | 1 | 150 | Risk Ratio (M‐H, Fixed, 95% CI) | 1.03 [0.70, 1.54] |
| 6 Phototherapy for hyperbilirubinaemia Show forest plot | 1 | 150 | Mean Difference (IV, Fixed, 95% CI) | 0.20 [‐0.31, 0.71] |
| 7 Use of surfactant in the first 48 hours of life Show forest plot | 1 | 150 | Risk Ratio (M‐H, Fixed, 95% CI) | 0.83 [0.54, 1.28] |
| 8 Bronchopulmonary dysplasia Show forest plot | 1 | 150 | Risk Ratio (M‐H, Fixed, 95% CI) | 1.1 [0.50, 2.43] |
| 9 Intraventricular haemorrhage (of any grade) Show forest plot | 1 | 150 | Risk Ratio (M‐H, Fixed, 95% CI) | 1.5 [0.65, 3.46] |
| 10 Severe intraventricular haemorrhage grade 3 or 4 Show forest plot | 1 | 150 | Risk Ratio (M‐H, Fixed, 95% CI) | 1.33 [0.31, 5.75] |
| 11 Periventricular leukomalacia Show forest plot | 1 | 150 | Risk Ratio (M‐H, Fixed, 95% CI) | 3.0 [0.12, 72.49] |
| 12 Necrotizing enterocolitis ≥ Bell's stage 2 Show forest plot | 1 | 150 | Risk Ratio (M‐H, Fixed, 95% CI) | 2.0 [0.19, 21.59] |
| 13 Retinopathy of prematurity requiring treatment Show forest plot | 1 | 150 | Risk Ratio (M‐H, Fixed, 95% CI) | 2.0 [0.38, 10.59] |
| 14 Sepsis Show forest plot | 1 | 150 | Risk Ratio (M‐H, Fixed, 95% CI) | 1.67 [0.41, 6.73] |
| 15 Pharmacological treatment for patent ductus arteriosus Show forest plot | 1 | 150 | Risk Ratio (M‐H, Fixed, 95% CI) | 0.74 [0.40, 1.36] |
| 16 Surgical ligation for patent ductus arteriosus Show forest plot | 1 | 150 | Risk Ratio (M‐H, Fixed, 95% CI) | 1.0 [0.26, 3.85] |