استنتها با پوشش دارویی در مقابل استنتهای فلزی بدون پوشش در مدیریت سندرم کرونری حاد
چکیده
پیشینه
در سال 2012 تقریبا 3.7 میلیون نفر در سراسر جهان در اثر ابتلا به سندرم کرونری حاد فوت کردند. سندرم کرونری حاد، که همچنین تحت نام انفارکتوس میوکارد یا آنژین پکتوریس ناپایدار شناخته شده، به دلیل انسداد ناگهانی عروق خونی تامین کننده ماهیچه قلب ایجاد میشود. مداخله کرونری از راه پوست (percutaneous coronary intervention) اغلب برای سندرم کرونری حاد استفاده میشود، اما مطالعات مروری سیستماتیک قبلی در خصوص مقایسه اثرات استنتهای دارای پوشش دارویی (drug‐eluting stents) با استنتهای فلزی بدون پوشش (bare‐metal stents) نتایج متناقضی از نظر انفارکتوس میوکارد نشان دادهاند؛ بهطور کامل خطر خطاهای تصادفی و سیستماتیک را در نظر نگرفته؛ و شامل تمام کارآزماییهای بالینی تصادفیسازی شده مرتبط نبودهاند.
اهداف
ارزیابی مزایا و مضرات استنتهای دارای پوشش دارویی در مقابل استنتهای فلزی بدون پوشش در افراد مبتلا به سندرم کرونری حاد.
روشهای جستوجو
پایگاه ثبت مرکزی کارآزماییهای کنترل شده کاکرین (CENTRAL)؛ MEDLINE؛ Embase؛ منابع علمی سلامت آمریکای لاتین و کارائیب (LILACS)؛ SCI‐EXPANDED، و BIOSIS را از آغاز به کار تا ژانویه 2017 جستوجو کردیم. همچنین دو پایگاه ثبت کارآزماییهای بالینی، بانکهای اطلاعاتی آژانس دارویی اروپا (European Medicines Agency) و اداره غذا و داروی ایالات متحده (US Food and Drug Administration) و وبسایتهای شرکت دارویی را بررسی کردیم. به علاوه، فهرست منابع مقالات مطالعه مروری و کارآزماییهای مرتبط را جستوجو کردیم.
معیارهای انتخاب
کارآزماییهای بالینی تصادفیسازی شده که اثرات استنتهای دارویی را در مقابل استنتهای فلزی بدون پوشش برای سندرم کرونری حاد ارزیابی کردند. کارآزماییها را بدون توجه به نوع انتشار، وضعیت، تاریخ، یا زبان آنها وارد کردیم.
گردآوری و تجزیهوتحلیل دادهها
پروتکل منتشر شده و پیشنهادهای روششناسی کاکرین خود را دنبال کردیم. دو نویسنده مرور بهطور مستقل از هم دادهها را استخراج کردند. خطرات خطای سیستماتیک را بر اساس حوزههای سوگیری (bias) ارزیابی کردیم. تجزیهوتحلیلهای مرحلهای کارآزمایی (Trial Sequential Analyses) را برای کنترل خطرات خطاهای تصادفی انجام دادیم. پیامدهای اولیه ما مورتالیتی به هر علتی، وقایع مهم قلبیعروقی، عوارض جانبی جدی، و کیفیت زندگی بودند. پیامدهای ثانویه عبارت بودند از آنژین، مورتالیتی قلبیعروقی، و انفارکتوس میوکارد. نقطه زمانی ارزیابی اولیه، در حداکثر دوره پیگیری بود. کیفیت شواهد را با رویکرد درجهبندی توصیه، ارزیابی، توسعه و ارزشیابی (GRADE) ارزیابی کردیم.
نتایج اصلی
ما 25 کارآزمایی را انتخاب کردیم که مجموعا 12,503 شرکتکننده را تصادفیسازی کردند. همه کارآزماییها در معرض خطر بالای سوگیری بوده، و سطح کیفیت شواهد طبق GRADE از پائین تا بسیار پائین متغیر بود. ما 22 کارآزمایی را وارد کردیم که در آن شرکتکنندگان مبتلا به انفارکتوس میوکارد با ST افزایش یافته بودند، 1 کارآزمایی که در آن شرکتکنندگان مبتلا به انفارکتوس میوکارد بدون ST افزایش یافته بودند، و 2 کارآزمایی که در آنها شرکتکنندگان ترکیبی را از سندرمهای کرونری حاد داشتند.
متاآنالیزها در حداکثر دوره پیگیری نشان داد که هیچ تفاوتی در مقایسه میان استنتهای دارای پوشش دارویی و استنتهای فلزی بدون پوشش از نظر خطر مورتالیتی به هر علتی یا وقایع مهم قلبیعروقی وجود نداشت. خطر مطلق مرگ 6.97% در گروه استنتهای دارای پوشش دارویی در مقایسه با 7.74% در گروه استنتهای فلزی بدون پوشش (خطر نسبی (RR): 0.90؛ 95% فاصله اطمینان (CI): 0.78 تا 1.03؛ 11,250 شرکتکننده؛ 21 کارآزمایی/22 مقایسه؛ شواهد با کیفیت پائین) گزارش شد. خطر مطلق یک رویداد قلبیعروقی مهم 6.36% در گروه استنتهای دارای پوشش دارویی در مقایسه با 6.63% در گروه استنتهای فلزی بدون پوشش (RR: 0.96؛ 95% CI؛ 0.83 تا 1.11؛ 10,939 شرکتکننده؛ 19 کارآزمایی/20 مقایسه؛ شواهد با کیفیت بسیار پائین) بود. نتایج تجزیهوتحلیل مرحلهای کارآزمایی نشان داد که به اطلاعات کافی برای تایید یا رد کاهش 10% خطر نسبی پیشبینی شده در مورتالیتی به هر علتی یا وقایع قلبیعروقی جدی در حداکثر دوره پیگیری دسترسی نداریم.
متاآنالیزها در حداکثر دوره پیگیری، شواهد مثبتی را از مقایسه استنتهای دارای پوشش دارویی و استنتهای فلزی بدون پوشش در خطر بروز عارضه جانبی جدی نشان دادند. خطر مطلق یک عارضه جانبی جدی 18.04% در گروه استنتهای دارای پوشش دارویی در مقایسه با 23.01% در گروه استنتهای فلزی بدون پوشش (RR: 0.80؛ 95% CI؛ 0.74 تا 0.86؛ 11,724 شرکتکننده؛ 22 کارآزمایی/23 مقایسه؛ شواهد با کیفیت پائین) بود، و تجزیهوتحلیل مرحلهای کارآزمایی این نتایج را تاکید کرد. زمانی که هر نوع خاصی از عوارض جانبی وارد شده در پیامد عارضه جانبی جدی بهطور جداگانه ارزیابی شدند، اکثر وقایع، بازسازی دوباره جریان خون (revascularisation) عروق هدف بودند. زمانی که بازسازی دوباره جریان خون عروق هدف بهطور جداگانهای تحلیل شدند، متاآنالیز شواهدی را از منفعت استنتهای دارای پوشش دارویی نشان داد و تجزیهوتحلیل مرحلهای کارآزمایی این نتیجه را تایید کرد.
متاآنالیزها در حداکثر دوره پیگیری، هیچ تفاوتی را در مقایسه استنتهای دارای پوشش دارویی و استنتهای فلزی بدون پوشش بر خطر مورتالیتی قلبیعروقی (RR: 0.91؛ 95% CI؛ 0.76 تا 1.09؛ 9248 شرکتکننده؛ 14 کارآزمایی/15 مقایسه؛ شواهد با کیفیت بسیار پائین) یا انفارکتوس میوکارد (RR: 0.98؛ 95% CI؛ 0.82 تا 1.18؛ 10,217 شرکتکننده؛ 18 کارآزمایی/19 مقایسه؛ شواهد با کیفیت بسیار پائین) نشان ندادند. نتایج تجزیهوتحلیل مرحلهای کارآزمایی نشان داد که اطلاعات کافی را برای تایید یا رد کاهش 10% نسبت خطر پیشبینی شده در مورتالیتی قلبیعروقی و انفارکتوس میوکارد نداشتیم.
هیچ یک از کارآزماییها نتایجی را در خصوص کیفیت زندگی یا آنژین گزارش ندادند.
نتیجهگیریهای نویسندگان
شواهد کنونی نشان میدهد که استنتهای دارای پوشش دارویی ممکن است عوارض جانبی جدی کمتری در مقایسه با استنتهای فلزی بدون پوشش داشته باشند، بدون اینکه خطر مورتالیتی به هر علتی یا وقایع مهم قلبیعروقی را افزایش دهند. با این حال، تجزیهوتحلیل مرحلهای کارآزمایی نشان داد که در حال حاضر اطلاعات کافی برای ارزیابی کاهش 10% خطر نسبی برای مورتالیتی به هر علتی، وقایع مهم قلبیعروقی، مورتالیتی قلبیعروقی، یا انفارکتوس میوکارد وجود ندارد، و هیچ اطلاعاتی در خصوص کیفیت زندگی یا آنژین در دست نبودند. کیفیت شواهد در این مطالعه مروری از پائین تا بسیار پائین متغیر بود، و ممکن است نتیجه واقعی از نتایج ارائه شده در این مطالعه مروری بهطور قابل توجهی متفاوت باشد.
انجام کارآزماییهای بالینی تصادفیسازی شده بیشتری با خطر پائین سوگیری و خطرات پائین خطاهای تصادفی مورد نیاز است تا مزایا و معایب استنتهای دارای پوشش دارویی برای سندرم کرونری حاد بهطور مناسبی ارزیابی شوند. دادههای بیشتری در خصوص پیامدهای مورتالیتی به هر علتی، وقایع قلبی و عروقی مهم، کیفیت زندگی، و آنژین برای کاهش خطر خطای تصادفی مورد نیاز است.
PICO
خلاصه به زبان ساده
مزایا و مضرات استنتهای دارای پوشش دارویی در مقابل استنتهای فلزی بدون پوشش در افراد مبتلا به سندرم کرونری حاد
پیشینه
سندرم کرونری حاد اصطلاحی است که برای حملات قلبی و نیز درد قفسه سینه در طول استراحت استفاده میشود. این سندرم به دلیل کاهش تامین خون مورد نیاز قلب بروز میکند که ناشی از باریک شدن رگهای تامین کننده قلب یا یک لخته خونی است. طبق برآورد سازمان جهانی بهداشت، در سال 2012 حدود 3.7 میلیون نفر در اثر ابتلا به سندرم کرونری حاد فوت شدند. مداخله عروق کرونر از راه پوست، که عموما به آنژیوپلاستی کرونری شناخته شده، برای درمان عروق بسته یا باریک شده قلب با باد کردن یک بالون استفاده میشوند تا به خون اجازه دهند که دوباره در رگ جریان داشته باشد. سپس برای اطمینان از باز ماندن رگ، استنتهای کرونری در آن قرار داده میشوند. دو نوع استنت برای استفاده در دسترس است، استنتی که با دارو پوشیده شده و به کاهش خطر بسته شدن رگ در آینده کمک میکند (استنت با پوشش دارویی) و استنت بدون پوشش (استنت فلزی بدون پوشش). هدف ما در این مطالعه مروری، ارزیابی مزایا و مضرات استنتهای دارای پوشش دارویی در مقایسه با استنتهای فلزی بدون پوشش بود.
ویژگیهای مطالعه
بانکهای اطلاعاتی را از ابتدا تا ژانویه 2017 جستوجو کرده و 25 کارآزمایی را یافتیم که در آنها افراد بهطور تصادفی در گروههایی قرار گرفتند که استنتهای دارای پوشش دارویی و استنتهای فلزی بدون پوشش را دریافت کردند. 25 کارآزمایی (26 مقایسه) شامل 12,503 بزرگسال با میانگین سنی 60.8 سال بودند.
نتایج کلیدی
افرادی که استنتهای دارای پوشش دارویی دریافت کردند در مقایسه با بیمارانی که در گروه استنتهای فلزی بدون پوشش قرار گرفتند، به نظر میرسید که با خطر کمتری از ابتلا به عارضه جانبی جدی روبهرو بودند، بدون اینکه بر خطر مرگ به هر دلیل یا بهطور خاص خطر مرگ ناشی از بیماری قلبی، یا حمله قلبی تاثیر بگذارد. عارضه جانبی جدی که احتمالا با استنتهای دارای پوشش دارویی پیشگیری میشود، تکرار آنژیوپلاستی بالون است. هیچ دادهای از کیفیت زندگی یا درد قفسه سینه (آنژین) پس از دریافت استنت گزارش نشد.
کیفیت شواهد
شواهد باید با احتیاط تفسیر شوند، زیرا به دلیل محدودیتهای کارآزماییهای بالینی تصادفیسازی شده وارد شده، کیفیت را از پائین تا بسیار پائین قضاوت کردیم. کیفیت بسیار پائین اساسا به دلیل این بود که همه کارآزماییهای وارد شده در معرض خطر بالای سوگیری (bias) قرار داشتند. در نتیجه، نتایج ممکن است منفعت بیشتری را از استنتهای دارویی نسبت به اثر واقعی آنها در بالین نشان دهند. به علاوه، اغلب پیامدها در مطالعه مروری ما قدرت آماری کافی را نداشتند. در نتیجه انجام کارآزماییهای بالینی تصادفیسازی شدهای که به خوبی طراحی شده باشند، ممکن است نتایج مذکور را تغییر دهند.
Authors' conclusions
Summary of findings
| Drug‐eluting stents compared to bare‐metal stents for acute coronary syndrome | ||||||
| Patient or population: People with acute coronary syndrome | ||||||
| Outcomes | Anticipated absolute effects* (95% CI) | Relative effect | № of participants | Quality of the evidence | Comments | |
|---|---|---|---|---|---|---|
| Risk with bare‐metal stents | Risk with drug‐eluting stents | |||||
| All‐cause mortality at maximum follow‐up | Study population | RR 0.90 | 11,250 | ⊕⊕⊝⊝ | Trial Sequential Analysis for a RRR of 10% showed that neither the boundary for futility, benefit or harm was breached, hence the risk of imprecision of the outcome result is high. Multiple eligible treatments were used in 1 trial, generating a further comparison (21 trials reporting on 22 experimental groups). | |
| 78 per 1000 | 70 per 1000 | |||||
| Serious adverse events at maximum follow‐up | Study population | RR 0.80 | 11,724 | ⊕⊕⊝⊝ | Trial Sequential Analysis for a RRR of 10% showed that the boundary for benefit was breached, hence the risk of imprecision of the outcome result is low. Multiple eligible treatments were used in 1 trial, generating a further comparison (22 trials reporting on 23 experimental groups). | |
| 230 per 1000 | 184 per 1000 | |||||
| Major cardiovascular events at maximum Follow‐up: median 12 months | Study population | RR 0.96 | 10,939 | ⊕⊝⊝⊝ | Trial Sequential Analysis for a RRR of 10% showed that neither the boundary for futility, benefit or harm was breached, hence the risk of imprecision of the outcome result is high. Multiple eligible treatments were used in 1 trial, generating a further comparison (19 trials reporting on 20 experimental groups). | |
| 66 per 1000 | 63 per 1000 | |||||
| Quality of life at maximum follow‐up ‐ not reported | ‐ | ‐ | ‐ | ‐ | ‐ | |
| Cardiovascular mortality at maximum follow‐up | Study population | RR 0.91 | 9248 | ⊕⊝⊝⊝ | Trial Sequential Analysis for a RRR of 10% showed that neither the boundary for futility, benefit or harm was breached, hence the risk of imprecision of the outcome result is high. Multiple eligible treatments were used in 1 trial, generating a further comparison (14 trials reporting on 15 experimental groups). | |
| 58 per 1000 | 53 per 1000 | |||||
| Myocardial infarction at maximum follow‐up | Study population | RR 0.98 | 10,217 | ⊕⊝⊝⊝ | Trial Sequential Analysis for a RRR of 10% showed that neither the boundary for futility, benefit or harm was breached, hence the risk of imprecision of the outcome result is high. Multiple eligible treatments were used in 1 trial, generating a further comparison (18 trials reporting on 19 experimental groups). | |
| 48 per 1000 | 47 per 1000 | |||||
| Angina at maximum follow‐up ‐ not reported | ‐ | ‐ | ‐ | ‐ | ‐ | |
| *The risk in the intervention group (and its 95% confidence interval) is based on the assumed risk in the comparison group and the relative effect of the intervention (and its 95% CI). | ||||||
| GRADE Working Group grades of evidence | ||||||
| 1Downgraded one level for serious risk of imprecision due to our required information size not being met. | ||||||
Background
Description of the condition
Cardiovascular disease, of which ischaemic heart disease is by far the largest component, is considered to be the number one cause of death globally (Lloyd‐Jones 2010; Nichols 2014; Rosamond 2008). Ischaemic heart disease is generally divided into acute coronary syndrome and stable ischaemic heart disease (Roffi 2016). The disease remains prevalent, with more than 7 million people worldwide expected to develop acute coronary syndrome each year (White 2008). According to the World Health Organization, 7.4 million people died from ischaemic heart disease in 2012, representing 15% of all global deaths, with acute coronary syndrome accounting for approximately half of the deaths (Turpie 2006; WHO 2015). The in‐hospital mortality proportions across different countries range from 5% to 10% (Gupta 2003). Ischaemic heart disease remains increasingly prevalent and costly to treat due to an increase in life expectancy and a decrease in death rates (Cooper 2000; Schmidt 2012).
Acute coronary syndrome is a collective term for the following:
-
unstable angina pectoris (myocardial ischaemia at rest or minimal exertion in the absence of cardiomyocyte necrosis) (Roffi 2016);
-
non‐ST‐segment elevation myocardial infarction (NSTEMI); and
-
ST‐segment elevation myocardial infarction (STEMI) (Amsterdam 2014). Myocardial infarction can be recognised by clinical features, electrocardiographic (ECG) findings, elevated values of biochemical markers (biomarkers) of myocardial necrosis, imaging, or pathology (Thygesen 2012). The diagnosis of myocardial infarction is dependent on an elevation of the serum levels of cardiac‐specific troponin I, troponin T, or the myocardial band isoenzyme of creatine kinase (CK‐MB), among others (Roffi 2016). Cardiac troponin levels will usually be positive within one hour in people with myocardial infarction when using high‐sensitivity assays (Roffi 2016). If the initial test is negative, a repeat test is advisable after three hours to rule out a myocardial infarction, since in some cases there is a delay in the elevation of cardiac enzymes (Roffi 2016). The changes in the ST‐segment reflected in an ECG provide the basis for the distinction between NSTEMI and STEMI (Roffi 2016). Compared to NSTEMI and STEMI, unstable angina pectoris presents without the characteristic rise in cardiac‐specific biomarkers (Roffi 2016).
For research purposes, the causes of myocardial infarction are generally divided into five main classes (Thygesen 2012).
-
Type 1: spontaneous myocardial infarction related to atherosclerotic plaque rupture, ulceration, fissuring, erosion, or dissection with resulting intraluminal thrombus in one or more of the coronary arteries often caused by coronary artery disease.
-
Type 2: myocardial infarction secondary to an ischaemic imbalance, such as coronary artery spasm, coronary embolism, anaemia, arrhythmias, hypertension, or hypotension.
-
Type 3: myocardial infarction with symptoms suggestive of myocardial ischaemia and resulting in sudden unexpected cardiac death when biomarker values are unavailable or unobtainable before death.
-
Type 4a: myocardial infarction associated with percutaneous coronary intervention.
-
Type 4b: myocardial infarction associated with stent thrombosis, as documented by angiography or at autopsy.
-
Type 5: myocardial infarction associated with coronary artery bypass graft.
Major complications associated with myocardial infarction
-
Life‐threatening ventricular arrhythmias caused by changes in the electrophysiologic characteristics of the myocyte, electrolyte imbalance, continuous ischaemia, and variations in heart rate, which are all due to obstruction and hence reduced flow to the myocardium and myocardial necrosis (Brieger 2009; Stevenson 1989).
-
Mechanical complications caused by necrosis of the myocardium, such as ventricular wall rupture, septum rupture, and papillary muscle rupture (Brieger 2009; Pohjola‐Sintonen 1989; Stevenson 1989).
-
Cardiogenic shock caused by failure of the ventricle to pump an adequate amount of blood leading to systemic hypotension (Brieger 2009; Stevenson 1989).
-
Acute decompensated heart failure caused by impairment in systolic and diastolic function due to myocardial ischaemia (Brieger 2009).
-
Depression (Thombs 2006).
A narrowing of a coronary vessel causes unstable angina due to one of five reasons:
-
non‐occlusive thrombus on pre‐existing plaques;
-
dynamic obstruction, i.e. coronary vasoconstriction;
-
progressive mechanical obstruction, such as restenosis after percutaneous coronary intervention;
-
inflammation or infection; and
-
secondary unstable angina due to conditions increasing the oxygen demand, such as hypertension, thyrotoxicosis, and tachycardia (Braunwald 1998; Roffi 2016). Unstable angina is associated with lower mortality compared to myocardial infarction but similar rates of rehospitalisations; however, the patient may have a worse quality of life (Dudas 2013; Maddox 2007; Roffi 2016). People with unstable angina are also at risk of cardiogenic shock (Ruiz‐Bailén 2008).
Historically, the degree of luminal stenosis and the number of coronary arteries involved (single‐, double‐, or triple‐vessel disease) have defined the severity of ischaemic heart disease (Ringqvist 1983). Researchers have since developed more comprehensive scoring systems (Gensini 1983; Seizer 1982). Coronary angiography score and two additional scores, that is vascular scoring and stenosis scoring, determine the Gensini score (Gensini 1983). The results of the coronary angiography determine the SYNTAX score, which takes into account lesion complexity, lesion location, and number of lesions (Sianos 2005). The SYNTAX score II is used to improve the decision‐making in choosing between percutaneous coronary intervention (PCI) and coronary artery bypass grafting (CABG) for a long‐term, individualised risk assessment in people with complex ischaemic heart disease. The SYNTAX score II combines the anatomical‐based SYNTAX score (Sianos 2005), as well as seven clinical variables (creatinine clearance, peripheral vascular disease, unprotected left main coronary disease, sex, chronic obstructive pulmonary disease, age, and left ventricular ejection fraction) (Farooq 2013; Sianos 2005).
A glossary of medical terms is in Appendix 1.
Description of the intervention
Percutaneous coronary intervention is performed by inserting an access sheath into a peripheral artery (most often the femoral artery or the radial artery); a catheter is advanced, under X‐ray screening, through the blood vessels to the aortic root, at the origin of the coronary arteries. Other tools such as balloons and stents can then be advanced down the artery, over a guide wire, to the location of the narrowing or blockage (Cantor 2005; Hamon 2009). Andreas Roland Grüntzig performed the first percutaneous coronary intervention in 1977 (Grüntzig 1978). Percutaneous coronary intervention has since then evolved to become one of the cornerstones in the treatment of ischaemic heart disease.
Percutaneous coronary intervention in people with acute coronary syndrome can be performed both as primary percutaneous coronary intervention (primary PCI) and secondary percutaneous coronary intervention (secondary PCI) (Meyer 1981; Meyer 1982; Meyer 1982a; Meyer 1983). Primary PCI may be performed in the acute phase of myocardial infarction if patients present with STEMI. Patients presenting with NSTEMI or unstable angina pectoris that is characterised as high‐risk acute coronary syndrome may also benefit from undergoing angiography and percutaneous coronary intervention either immediately or as part of an early (within 24 hours) invasive strategy (Hoenig 2010; Roffi 2016). The high‐risk factors include haemodynamic instability, severe left ventricular dysfunction, recurrent or persistent rest angina, mechanical complications, sustained ventricular tachycardia, and dynamic ST‐T wave electrocardiographic changes (Hoenig 2010).
Secondary PCI includes both subacute PCI and elective PCI. Subacute PCI is generally performed within the first 72 hours after symptom debut in people with unstable angina pectoris or NSTEMI who are not candidates for primary PCI because of being haemodynamically stable with medical therapy and not at high risk (Breall 2016; Roffi 2016). Elective PCI is performed in patients where coronary artery bypass grafting is not indicated, as well as in patients who are dissatisfied with their quality of life because of symptoms related to ischaemic heart disease or with adverse events due to their medical treatment (Levin 2016).
The first percutaneous coronary intervention was performed by inflating a balloon at the blockage of the coronary artery to dilate the artery ('balloon angioplasty') (Grüntzig 1978; Grüntzig 1979). The healing properties of the treatment seem to be related to the percutaneous coronary intervention expanding the outer diameter of the blocked coronary artery and not by decompression of the arterial plaque (Düber 1986). Balloon angioplasty, however, generally did not seem to achieve a long‐lasting result, with restenosis occurring over time (Dangas 2002; Puel 1988). In an attempt to keep the lumen open longer, the next development was a small metallic scaffold called a 'stent'. These tubular devices are expanded over a balloon and press against the walls of the artery to keep it open (Puel 1988). These first devices were subsequently termed 'bare‐metal stents' (after the later introduction of 'drug‐eluting stents') and had improved outcomes over balloon angioplasty, but were still associated with high rates of restenosis over time (Cutlip 2002; Erbel 1998; Fischman 1994; Macaya 1996; Puel 1988; Serruys 1994; Serruys 1998). A Cochrane review from 2005 found that primary stenting versus balloon angioplasty alone seemed to reduce the rate of reinfarction and target vessel revascularisation (Nordmann 2005).
The next stents were drug‐eluting stents consisting of three main components:
-
a metal mesh;
-
an antiproliferative drug (e.g. sirolimus, paclitaxel, zotarolimus, or everolimus); and
-
a polymer used to coat the metal mesh.
Antiproliferative drugs to limit the excessive growth of neointima using cytotoxic or cytostatic agents, as well as a polymer to control the release of the antiproliferative drug, supplemented the metal mesh (Degertekin 2002; Fajadet 2006; Holmes 2004; Lee 2005; Morice 2002; Moses 2003; Stone 2004; Stone 2004a).
Newer drug‐eluting stents have decreased strut thickness and are meant to have improved flexibility/deliverability, enhanced polymer biocompatibility/drug‐eluting profiles, and superior re‐endothelialisation kinetics (Serruys 2010; Stone 2010). They typically use everolimus or zotarolimus as their antiproliferative drug (Serruys 2010; Stone 2010).
The polymer‐coating of the drug‐eluting stents has, however, been linked with adverse events, such as stent thrombosis (Chen 2015). Both drug‐eluting stents with a biodegradable polymer as well as polymer‐free drug‐eluting stents have therefore been developed. Polymer‐free drug‐eluting stents use the same antiproliferative drugs (such as paclitaxel or sirolimus) as the polymer drug‐eluting stents (Abizaid 2010; Chen 2015).
In an attempt to further reduce the risk of restenosis, bioresorbable (also called biodegradable) stents were developed. The principal components of the bioresorbable stent are the same as the drug‐eluting stents; in most cases, a polylactic acid mesh replaces the metal mesh (Haude 2013; Puricel 2015). The polylactic acid mesh is broken down and removed over time (Tamai 2000). The same types of drugs (everolimus, paclitaxel, sirolimus) used in drug‐eluting stents along with Biolimus are used in bioresorbable stents (Haude 2013; Haude 2016; Puricel 2015).
Bare‐metal stents, drug‐eluting stents, and bioresorbable stents are used in modern percutaneous coronary interventions, with drug‐eluting stents generally being the first choice (Windecker 2014). Guidelines recommend that acute coronary syndrome patients receive 12 months of antiplatelet therapy (aspirin plus a G protein‐coupled purinergic (P2Y12 receptor) blocker) regardless of whether percutaneous coronary intervention is performed (Windecker 2014). The recommended minimum length of duration of antiplatelet therapy for the implant of the bare‐metal stents and drug‐eluting stents is one month and six months, respectively (Windecker 2014).
Adverse events associated with percutaneous coronary intervention include death, coronary artery complications (such as perforation of the artery, distal embolisation (passage of an intravascular mass, which is capable of clogging capillaries), or stent thrombosis), myocardial infarction (type 4 myocardial infarction) (Thygesen 2012), vascular complications (such as bleeding or infection at the access site, retroperitoneal bleeding, or atheroembolism), stroke, and acute kidney failure (Baim 1996; Cantor 1998; Stankovic 2004).
How the intervention might work
Percutaneous coronary intervention aims to decrease the stenosis of the coronary artery resulting in increased blood flow to the myocardium of the heart, which is thought to limit ischaemia and potentially reinfarction. Drug‐eluting stents may be more beneficial than bare‐metal stents because they release antiproliferative drugs, which may limit neointimal growth (Degertekin 2002; Fajadet 2006; Holmes 2004; Lee 2005; Morice 2002; Moses 2003; Stone 2004; Stone 2004a). The new bioresorbable stents as well as the polymer‐free drug‐eluting stents may be even more beneficial since they remove material that has been associated with adverse events (Abizaid 2010; Chen 2015; Haude 2013; Puricel 2015).
Why it is important to do this review
The prevalence of ischaemic heart disease is considerable and causes one‐third of all deaths in people over 35 years of age (Lloyd‐Jones 2010; Nichols 2014; Rosamond 2008). Beneficial treatments can therefore alleviate a considerable disease burden and healthcare cost. Former reviews have found conflicting evidence of the efficacy and safety of drug‐eluting stents versus bare‐metal stents.
A 2010 Cochrane review compared drug‐eluting stents versus bare‐metal stents in participants with both acute coronary syndrome and stable ischaemic heart disease (Greenhalgh 2010). The authors found no significant difference on all‐cause mortality, incidence of acute myocardial infarction, or thrombosis. However, the review showed indications of beneficial effects of drug‐eluting stents compared with bare‐metal stents on target lesion revascularisation, target vessel revascularisation, and a composite outcome of cardiac events.
Six non‐Cochrane reviews compared drug‐eluting stents with bare‐metal stents in participants with ischaemic heart disease (De Luca 2012; Kastrati 2007; Roukoz 2009; Stettler 2007; Suh 2011; Zheng 2014). Three reviews included only STEMI patients (De Luca 2012; Suh 2011; Zheng 2014). Two of these reviews found no difference between drug‐eluting stents versus bare‐metal stents on all‐cause mortality and stent thrombosis, but a beneficial effect on target vessel revascularisation (De Luca 2012; Suh 2011). Suh 2011 observed improvement of recurrent myocardial infarction with drug‐eluting stents, while De Luca 2012 found no effect. Zheng 2014, which included only four trials, compared the effects of bare‐metal stents with drug‐eluting stents in STEMI participants at five‐year follow‐up. The review found that there was no difference in the interventions with regard to all‐cause mortality and acute myocardial infarction, as well as no effect on thrombosis, except for its occurrence later than one year after percutaneous coronary intervention. Three reviews assessed the effects of drug‐eluting stents versus bare‐metal stents in participants with ischaemic heart disease (including STEMI, NSTEMI, unstable angina pectoris, and stable angina pectoris) (Kastrati 2007; Roukoz 2009; Stettler 2007). Of the three reviews, two compared sirolimus stents and paclitaxel stents with bare‐metal stents (Roukoz 2009; Stettler 2007), while one compared only sirolimus stents with bare‐metal stents (Kastrati 2007). All reviews found no statistically significant difference between drug‐eluting stents and bare‐metal stents on all‐cause mortality. While Stettler 2007 found a beneficial effect in favour of the drug‐eluting stents using sirolimus on myocardial infarction, they found no effect for drug‐eluting stents using paclitaxel. Kastrati 2007 and Roukoz 2009 found no difference between drug‐eluting stents versus bare‐metal stents on myocardial infarction. All three reviews found a beneficial effect favouring drug‐eluting stents on target vessel revascularisation (Kastrati 2007; Roukoz 2009; Stettler 2007).
Current guidelines on drug‐eluting stents versus bare‐metal stents for acute coronary syndrome
The 2011 American College of Cardiology Foundation/American Heart Association/Society for Cardiovascular Angiography and Interventions guideline recommends drug‐eluting stents as a useful alternative to bare‐metal stents to prevent restenosis in cases where there is an increased risk of restenosis, and the patient is likely to be able to tolerate and comply with prolonged dual antiplatelet therapy (so‐called evidence A for STEMI, evidence C for NSTEMI/unstable angina pectoris; evidence levels are explained in the glossary in Appendix 1) (Levine 2011). The clinical situations associated with increased risk of restenosis are left main disease, small vessels, in‐stent restenosis, bifurcations, diabetes, long lesions, multiple lesions, and saphenous vein grafts (Levine 2011; Levine 2016). The guideline also states that bare‐metal stents should be used in people with a high risk of bleeding; inability to comply with one year of dual antiplatelet therapy; or anticipated invasive or surgical procedures in the next year, which the 2013 American College of Cardiology Foundation/American Heart Association Guideline for the Management of ST‐Elevation Myocardial Infarction also recommends (ACEP 2013; Levine 2011).
The National Institute for Health and Care Excellence (NICE) has assessed the effects and cost‐effectiveness of drug‐eluting stents compared with bare‐metal stents (NICE 2008). NICE recommends drug‐eluting stents in people where the target artery for treatment has less than a 3 mm calibre or the lesion is longer than 15 mm, and the price difference between drug‐eluting stents and bare‐metal stents is no more than GBP 300.
This review is an update of the 2010 Cochrane review mentioned above (Greenhalgh 2010), which has now been divided into a review including acute coronary syndrome participants and a review including stable ischaemic heart disease participants. With the present review we planned to do the following:
-
take full account of the risk of systematic errors ('bias'), design errors, and risks of random errors ('play of chance') (Higgins 2011; Jakobsen 2014; Keus 2010; Thorlund 2011; Wetterslev 2008);
-
include trials irrespective of outcome, follow‐up duration, and number of participants;
-
assess outcomes at several time points and take into account the variability of the follow‐up period; and
-
include all types of drug‐eluting stents, including polymer‐free stents and bioresorbable stents.
Objectives
To assess the benefits and harms of drug‐eluting stents versus bare‐metal stents in people with acute coronary syndrome.
Methods
Criteria for considering studies for this review
Types of studies
We searched for randomised clinical trials (both individual and cluster‐randomised trials) irrespective of publication type, publication status, publication date, and language.
Types of participants
We included participants of any age with a diagnosis of acute coronary syndrome (according to the definition of the trialists).
Types of interventions
We included any type of drug‐eluting stents, including bioresorbable stents and polymer‐free drug‐eluting stents.
We accepted any type of medical therapy as a co‐intervention to percutaneous coronary intervention.
We included any type of bare‐metal stent as a control intervention.
Types of outcome measures
Primary outcomes
-
All‐cause mortality.
-
Serious adverse events, defined as any untoward medical occurrence that resulted in death, was life‐threatening, was persistent, or led to significant disability, prolonged hospitalisation, or any medical event that had jeopardised the participant or required intervention to prevent it (ICH‐GCP 1997).
-
Major cardiovascular event, defined as a composite outcome consisting of cardiovascular mortality and myocardial infarction.
-
Quality of life measured on any valid scale, such as the Seattle Angina Questionnaire or 36‐Item Short Form Health Survey (SF‐36) (Ware 1992; Wyrwich 2004).
Secondary outcomes
-
Cardiovascular mortality (defined by the trialists).
-
Myocardial infarction (defined by the trialists).
-
Angina on a continuous scale, such as 'angina stability' and 'angina frequency' used in the Seattle Angina Questionnaire (Wyrwich 2004).
Exploratory outcomes
-
Stent thrombosis.
-
Target vessel revascularisation (defined by the trialists). In general, target vessel revascularisation is any repeat percutaneous intervention or surgical bypass of any segment of the target vessel (Hicks 2010).
We conducted meta‐analyses when possible of all dichotomous and continuous outcomes at the following two time points:
-
outcomes assessed at maximal follow‐up (the time point of primary interest); and
-
outcomes assessed at one month.
Search methods for identification of studies
Electronic searches
We identified trials through systematic searches of the following bibliographic databases:
-
the Cochrane Central Register of Controlled Trials (CENTRAL) in the Cochrane Library (2017, Issue 1 of 12), 18 January 2017;
-
Epub Ahead of Print, In‐Process & Other Non‐Indexed Citations, MEDLINE Daily, and MEDLINE (Ovid, 1946 to 18 January 2017);
-
Embase (Ovid, 1980 to 2017 week 3), 18 January 2017;
-
LILACS (Latin American and Caribbean Health Sciences Literature) (Bireme, 1982 to 19 January 2017);
-
SCI‐EXPANDED (Thomson Reuters, 1900 to 19 January 2017);
-
BIOSIS Web of Science (Thomson Reuters, 1926 to 19 January 2017).
We adapted the search strategy for MEDLINE Ovid to the other databases (Appendix 2). We applied the Cochrane sensitivity‐maximising randomised controlled trial filter to MEDLINE Ovid, adaptations of which were applied to the other databases, except CENTRAL and LILACS (Lefebvre 2011). We searched all databases from their inception and imposed no restriction on language of publication.
We also conducted a search of ClinicalTrials.gov (www.clinicaltrials.gov, searched on 30 March 2017), the World Health Organization International Clinical Trials Registry Platform (WHO ICTRP) (www.apps.who.int/trialsearch, searched on 31 March 2017), European Medicines Agency (www.ema.europa.eu/ema/, searched on 3 April 2017), and the US Food and Drug Administration (www.fda.gov, searched on 4 April 2017). We also searched Google Scholar manually for trials not found in the preliminary search (Lefebvre 2011). We adapted the preliminary search strategy for MEDLINE (Ovid) for use in these databases.
We also searched the websites of the following pharmaceutical companies for ongoing or unpublished trials: Johnson & Johnson (www.jnj.com/about-jnj, searched on 30 March 2017), Medtronic (www.medtronic.com/us-en/index.html, searched on 30 March 2017), Boston Scientific (www.bostonscientific.com/en-US/Home.html, searched on 30 March 2017), and Abbott (www.abbott.com/, searched 30 March 2017).
Searching other resources
We identified additional trials from the reference lists of review articles and included trials.
Data collection and analysis
We performed the review following the recommendations of the Cochrane Handbook for Systematic Reviews of Interventions (Higgins 2011). We conducted the analyses using Review Manager 5 (RevMan 2014), Stata 14 (Stata 2015), and Trial Sequential Analysis (CTU 2011).
Selection of studies
Two review authors (JF and EEN) independently screened titles and abstracts of all of the potentially eligible trials for inclusion. We coded all of these studies as 'retrieve' (eligible or potentially eligible/unclear) or 'do not retrieve'. In case of disagreement, we asked a third review author to arbitrate (JCJ). We retrieved the full‐text trial reports/publications, and two review authors (JF and EEN) independently screened the full texts and identified trials for inclusion. We reported reasons for exclusion of the ineligible studies. Any disagreements were resolved through discussion. We identified and excluded duplicates and collated multiple reports of the same trial so that each trial, rather than each report, was the unit of interest in this review. We recorded the selection process in sufficient detail to complete a PRISMA flow diagram and 'Characteristics of excluded studies' tables.
Data extraction and management
We used a data collection form that we had piloted on three trials in the review to collect trial characteristics and outcome data. Two review authors (JF and EEN) independently extracted all trial characteristics from the included trials. In case of disagreement, we asked a third review author to arbitrate (JCJ). We extracted the following trial characteristics.
-
Methods: duration of the trial, details of any 'run‐in' period, and date of publication.
-
Participants: number randomised, number analysed, number lost to follow up/withdrawn, mean age, sex, inclusion criteria, and exclusion criteria.
-
Interventions: intervention, comparison, concomitant medications, and excluded medications.
-
Outcomes: primary and secondary outcomes specified and collected and time points reported.
-
Notes: trial funding and notable conflicts of interest of the trial authors.
Two review authors (JF and EEN) independently extracted outcome data from the included studies. Any disagreements were resolved by consensus or by involving a third review author (JCJ). One review author (JF) transferred the data into the Review Manager 5 file (RevMan 2014). We double‐checked that data were entered correctly by comparing the data presented in the review with the study reports. A second review author (EEN) spot‐checked study characteristics for accuracy against the trial report.
Assessment of risk of bias in included studies
Two review authors (JF and EEN) independently assessed risk of bias for each study using the criteria outlined in the Cochrane Handbook for Systematic Reviews of Interventions (Higgins 2011). Any disagreements were resolved by discussion or by involving a third review author (JCJ). We assessed the risk of bias according to the random sequence generation, allocation sequence concealment, blinding of participants and personnel, blinding of outcome assessment, incomplete outcome data, selective outcome reporting, and other potential sources of bias. These 'risk of bias' domains enable the classification of randomised trials with an overall bias assessment at low or high risk of bias. Trials with one domain at either high or unclear risk of bias are considered at overall high risk of bias as previous meta‐epidemiological studies demonstrate that these two categories do not differ in their overestimation of benefits and underestimation of harms (Gluud 2006; Kjaergard 2001; Lundh 2012; Lundh 2017; Moher 1998; Savović 2012; Savović 2012a; Schulz 1995; Wood 2008). For additional details on how we assessed the risk of bias, see Appendix 3. We assessed the risk of bias at both trial level and outcome level.
Assessment of bias in conducting the review
We conducted the review according to the published protocol and have reported any deviations from it in the Differences between protocol and review section of this review.
Measures of treatment effect
Dichotomous outcomes
We calculated risk ratios (RR) with 95% confidence intervals (CIs) for dichotomous outcomes.
Continuous outcomes
We had planned to use end scores in our analyses if both end scores and change scores were reported. If only change scores were reported, we would use these, but no trials reported any continuous outcomes. We planned to calculate mean differences (MD) and standardised mean differences (SMD) with 95% CIs for continuous outcomes, as well as Trial Sequential Analysis‐adjusted CIs. We planned to use the SMD when all trials assessed the same outcome but measured it in a variety of ways, for example with different scales (Higgins 2011).
Unit of analysis issues
Where multiple trial arms were reported in a single trial, we only included the relevant arms. In the case of a trial with two relevant experimental arms (PASEO 2009a; PASEO 2009b), we included the two arms as different comparisons and halved the control group to avoid double‐counting.
Dealing with missing data
We contacted investigators or study sponsors to obtain any missing data.
Dichotomous outcomes
We did not impute missing values for any outcomes in our primary analysis. We imputed data in two of our sensitivity analyses (see Sensitivity analysis).
Continuous outcomes
We did not impute missing values for any outcomes in our primary analysis. We planned to impute data in our sensitivity analysis for dichotomous and continuous outcomes (see Sensitivity analysis).
If studies did not report standard deviations (SD), we planned to calculate them using data from the trial where possible.
Assessment of heterogeneity
We primarily investigated forest plots to visually assess for any sign of heterogeneity. We additionally assessed the presence of statistical heterogeneity by Chi2 test (threshold P < 0.10) and measured the quantities of heterogeneity using the I2 statistic (Higgins 2002; Higgins 2003). We followed the recommendations for thresholds in the Cochrane Handbook for Systematic Reviews of Interventions (Higgins 2011):
-
0% to 40%: might not be important;
-
30% to 60%: may represent moderate heterogeneity;
-
50% to 90%: may represent substantial heterogeneity; and
-
75% to 100%: considerable heterogeneity.
We investigated possible heterogeneity through subgroup analyses. Ultimately, we performed meta‐analyses of our outcomes (Higgins 2011).
Assessment of reporting biases
We planned to assess publication bias and other reporting biases by visual inspection of funnel plots for our primary outcomes if we included at least 10 trials (Higgins 2011). Using the asymmetry of the funnel plot, we assessed the risk of bias. To attempt to correct for the impact of any reporting bias, we used the 'trim and fill' method (Duval 2000; Taylor 1998).
For dichotomous outcomes, we tested asymmetry with the Harbord test, Harbord 2006, if Tau2 was less than 0.1 and with the Rücker test, Rücker 2008, if Tau2 was more than 0.1.
Data synthesis
Meta‐analysis
We undertook this systematic review according to the recommendations provided in the Cochrane Handbook for Systematic Reviews of Interventions (Higgins 2011), according to Keus 2010, and according to the eight‐step assessment suggested by Jakobsen 2014. We used the statistical software Review Manager 5, provided by Cochrane, to meta‐analyse data (RevMan 2014).
We used Stata, Stata 2015, in case of zero‐event trials where Review Manager 5's zero‐event handling (replacing zero with a constant of 0.5) was not sufficient, for example in cases with a skewed number of participants between groups, we planned to handle this with reciprocal zero‐event handling according to Sweeting 2004. Additionally, we planned on using Stata 2015 in case we needed to undertake meta‐regression (post hoc).
We used Trial Sequential Analysis to assess and control the risk of random error (see below). If a meta‐analysis did not reach the required information size, we presented Trial Sequential Analysis‐adjusted confidence intervals to account for the lack of information.
We included all studies in our initial analyses and planned to conduct a sensitivity analysis of trials at low risk of bias, however no such trials were found. If the results were similar, we planned to base our primary conclusions on the overall analysis. If results differed, we planned to base our primary conclusions on trials at low risk of bias.
Trial Sequential Analysis
Cumulative meta‐analyses are at risk of producing random errors due to sparse data and multiple testing of accumulating data (Brok 2008; Brok 2009; Higgins 2011a; Pogue 1997; Thorlund 2009; Wetterslev 2008); Trial Sequential Analysis can be applied to control this risk (CTU 2011; Jackson 2017; Thorlund 2011; Wetterslev 2017). The required information size (i.e. the number of participants needed in a meta‐analysis to detect or reject a certain intervention effect) can be calculated in order to minimise random errors (Wetterslev 2008; Wetterslev 2009). The required information size takes into account the event proportion in the control group, the assumption of a plausible risk ratio reduction, and the heterogeneity of the meta‐analysis (Turner 2013; Wetterslev 2008; Wetterslev 2009; Wetterslev 2017). Trial Sequential Analysis enables testing for significance each time a meta‐analysis includes a new trial. On the basis of the required information size, trial sequential monitoring boundaries can be constructed, enabling the determination of the statistical inference concerning cumulative meta‐analysis that has not yet reached the required information size (Wetterslev 2008; Wetterslev 2017).
Firm evidence for benefit or harms may be established if the trial sequential monitoring boundary is crossed before reaching the required information size, in which case further trials may turn out to be superfluous. In contrast, if the boundaries for benefit or harm are not surpassed, it may be established that it is necessary to continue with further trials before a certain intervention effect can be detected or rejected. Firm evidence for lack of the postulated intervention effect, which occurs when the cumulative Z‐score crosses the trial sequential monitoring boundaries for futility, can also be assessed with Trial Sequential Analysis.
To control the risks of random error, we used relatively conservative estimations of the anticipated intervention effect estimates (Jakobsen 2014). Large anticipated intervention effects lead to small required information sizes, and the thresholds for significance will be too lenient (Jakobsen 2014).
We analysed all primary and secondary outcomes with Trial Sequential Analysis. We used the following assumptions.
Primary outcomes
We estimated the diversity‐adjusted required information size based on the proportion of participants with an outcome in the control group (Wetterslev 2009). We used a risk of a type I error of 2% (Jakobsen 2014), a risk of a type II error of 20%, and the diversity suggested by the trials in the meta‐analysis (Jakobsen 2014). We used a risk of a type I error of 2% due to us including four primary outcomes, hence adjusting our type I error accordingly (Jakobsen 2014). We chose a risk of a type II error of 20% based primarily on tradition; it could be argued this value should be lower (Castellini 2016).
As anticipated intervention effects we used the following risk ratio reductions (RRR) because they seemed to be the maximum realistic intervention effect estimates based on former studies, trials, and meta‐analyses.
-
All‐cause mortality: RRR of 10% (De Luca 2012; Suh 2011).
-
Serious adverse events: RRR of 10%.
-
Major cardiovascular event defined as a composite outcome consisting of cardiovascular mortality and myocardial infarction: RRR of 10% (De Luca 2012; Suh 2011).
-
Quality of life measured on any valid scale, such as the Seattle Angina Questionnaire or SF‐36: we planned to use the observed SD, a clinically relevant mean difference equal to SD/2.
Secondary outcomes
We estimated the diversity‐adjusted required information size based on the proportion of participants with an outcome in the control group (Wetterslev 2009). We used a risk of a type I error of 2.5% (Jakobsen 2014), a risk of a type II error of 20%, and the diversity suggested by the trials in the meta‐analysis (Jakobsen 2014). We used a risk of a type I error of 2.5% due to us including three secondary outcomes, hence adjusting our type I error accordingly (Jakobsen 2016). We chose a risk of a type II error of 20% based primarily on tradition; it could be argued this value should be lower (Castellini 2016).
As anticipated intervention effects for the secondary outcomes in the Trial Sequential Analysis, we used the following RRRs because we assumed that these intervention effects were realistic based on former studies, trials, and meta‐analyses as cited below.
-
Myocardial infarction: RRR of 10% (De Luca 2012; Suh 2011).
-
Cardiovascular mortality: RRR of 10% (De Luca 2012; Suh 2011).
-
Angina (continuous outcome): the observed SD, a clinically relevant mean difference equal to SD/2.
Exploratory outcomes
We estimated the diversity‐adjusted required information size based on the proportion of participants with an outcome in the control group (Wetterslev 2009). We used a risk of a type I error of 3.33% (Jakobsen 2014), a risk of a type II error of 20%, and the diversity suggested by the trials in the meta‐analysis (Jakobsen 2014). We used a risk of a type I error of 3.33% due to us including two exploratory outcomes, hence adjusting our type I error accordingly (Jakobsen 2016). We chose a risk of a type II error of 20% based primarily on tradition; it could be argued this value should be lower (Castellini 2016).
As anticipated intervention effects for the exploratory outcomes in the Trial Sequential Analysis, we used the following RRRs because we assumed that these intervention effects were realistic based on former studies, trials, and meta‐analyses as cited below.
-
Stent thrombosis: RRR of 10% (De Luca 2012; Suh 2011).
-
Target vessel revascularisation: RRR of 30% (De Luca 2012; Suh 2011).
As supplementary Trial Sequential Analysis, we planned to use the limit of the confidence interval closest to zero effect as the anticipated intervention effect for all trial sequential analyses (Jakobsen 2014).
Assessment of significance
We assessed our intervention effects with both random‐effects meta‐analyses, DerSimonian 1986, and fixed‐effect meta‐analyses, Demets 1987, using the more conservative point estimate, that is the estimate closest to zero effect, of the two (Jakobsen 2014). If the two estimates were equal, we used the estimate with the widest confidence interval. We had four primary outcomes and three secondary outcomes, and therefore considered a P value less than 2% as significant for the primary outcomes and a P value less than 2.5% as significant for the secondary outcomes (Jakobsen 2014; Jakobsen 2016). We used the eight‐step procedure to assess if the thresholds for significance were crossed or not (Jakobsen 2014).
'Summary of findings' tables
We used the GRADE approach to assess the quality of the body of evidence associated with each of the primary outcomes (all‐cause mortality, serious adverse events, major cardiovascular events, and quality of life) and secondary outcomes (cardiovascular mortality, myocardial infarction, and angina) in our review (Guyatt 2008), constructing 'Summary of findings' tables using GRADEpro software (www.gradepro.org). The GRADE approach appraises the quality of a body of evidence based on the extent to which one can be confident that an estimate of effect or association reflects the item being assessed. The quality measure of a body of evidence considers within‐study risk of bias, directness of the evidence, heterogeneity of the data, precision of effect estimates, and risk of publication bias (Guyatt 2008). We assessed the precision of the effect estimates according to Jakobsen and colleagues (Jakobsen 2014). We included all studies in our primary analyses, as we found no trials at low risk of bias or at low risk of bias in all domains other than 'blinding of participants and personnel' (Gluud 2006; Kjaergard 2001; Lundh 2012; Moher 1998; Savović 2012; Schulz 1995; Wood 2008).
Subgroup analysis and investigation of heterogeneity
We performed the following subgroup analyses.
-
Type of drug‐eluting stents used:
-
paclitaxel‐eluting stents;
-
sirolimus‐eluting stents;
-
zotarolimus‐eluting stents;
-
everolimus‐eluting stents;
-
bioresorbable stents;
-
polymer‐free drug‐eluting stents; and
-
mixed drug‐eluting stents.
-
-
Unstable angina pectoris/non‐ST‐segment elevation myocardial infarction participants compared with ST‐segment elevation myocardial infarction participants.
-
Length of maximum follow‐up:
-
less than or equal to six months;
-
between six months and 12 months;
-
between one year and three years; and
-
more than or equal to three years.
-
-
Comparison of the effect of drug‐eluting stents versus bare‐metal stents between trials with different clinical trial registration status:
-
pre‐registration;
-
postregistration; and
-
no registration.
-
We only used the primary outcomes in our subgroup analyses.
We used the formal test for subgroup differences in Review Manager 5 (RevMan 2014).
We did not perform the following subgroup analyses due to lack of data.
-
Participants with diabetes compared with participants without diabetes.
-
Participants with high risk of bleeding (as defined by trialists) compared with participants without high risk of bleeding.
-
Age of participants:
-
age 0 to 18 years;
-
age 19 to 75 years; and
-
age 76 years or above.
-
Sensitivity analysis
We planned to assess the potential impact of bias by performing a sensitivity analysis where we excluded trials at high risk of bias. However, we found no trials at low risk of bias.
As a secondary sensitivity analysis, we planned to only include trials with low risk of bias in all domains except 'blinding of participants and personnel', as we did not expect to find any trials at low risk of bias in this domain. However, we found no such trial. We thoroughly discussed the limitations of trials at high risk of bias in the Quality of the evidence.
To assess the potential impact of the missing data for dichotomous outcomes, we performed the two following analyses.
-
'Best‐worst‐case' scenario: we assumed that all participants lost to follow‐up in the experimental group survived, had no serious adverse event, had no major cardiovascular event, had no stent thrombosis, and had no target vessel revascularisation. We assumed that they also had a beneficial event with regard to quality of life and angina, defined as the group mean plus both one and two SDs of the group mean (Jakobsen 2014). We assumed that all of those with missing outcomes in the control group died, had a serious adverse event, had a major cardiovascular event, had stent thrombosis, and had target vessel revascularisation. We assumed that they also had a harmful event with regard to quality of life and angina, defined as the group mean plus both one and two SDs of the group mean (Jakobsen 2014).
-
'Worst‐best‐case' scenario: we assumed that all participants lost to follow‐up in the experimental group died, had a serious adverse event, had a major cardiovascular event, had stent thrombosis, and had target vessel revascularisation. We assumed that they also had a harmful event with regard to quality of life and angina, defined as the group mean plus both one and two SDs of the group mean (Jakobsen 2014). We assumed that all of those with missing outcomes in the control group survived, had no serious adverse event, had no major cardiovascular event, had no stent thrombosis, and had no target vessel revascularisation. We assumed that they also had a beneficial event with regard to quality of life and angina, defined as the group mean plus both one and two SDs of the group mean (Jakobsen 2014).
We presented results from both scenarios.
To assess the potential impact of missing SDs for continuous outcomes, we planned to perform the following sensitivity analyses.
-
Where SDs were missing and not possible to calculate, we would impute SDs from trials with similar populations and low risk of bias.
-
If we found no such trials, we would impute SDs from trials with a similar population. As the final option, we would impute SDs from all trials.
However, as we included no trials reporting data on continuous outcomes, we did not perform the above sensitivity analyses.
Results
Description of studies
Results of the search
We identified a total of 76,576 potentially relevant references through searching the CENTRAL (Cochrane Library) (n = 8778), MEDLINE (n = 21,652), Embase (n = 14,916), SCI‐EXPANDED (n = 19,920), BIOSIS (n = 10,657), and LILACS (n = 653) from inception to January 2017. The search strategy is presented in Appendix 2. Additionally, we found 18 trials by searching Google Scholar, ClinicalTrials.gov, and references identified through previous meta‐analyses and randomised clinical trials. We excluded 34,514 reference duplicates. Accordingly, we screened 42,080 records and excluded 41,985 references based on titles and abstracts. We assessed 95 full‐text articles for eligibility. Of these, we excluded 27 references reporting on 25 trials based on our inclusion and exclusion criteria. We have provided reasons for exclusion the Characteristics of excluded studies table. Fourteen trials/15 comparisons reported on a mix of acute coronary syndrome participants and stable angina participants and are awaiting classification (Characteristics of studies awaiting classification) (BASKET 2005a; BASKET 2005b; BASKET‐PROVE I 2010; BASKET‐PROVE II 2015; EAGLE 2006; Erglis 2007; FUTURE I 2004; FUTURE II 2004; Han 2007; Li 2004; NORSTENT 2016; PRODIGY 2014; SES‐SMART 2004; XIMA 2014; ZEUS 2015). We tried but could not establish contact with the trial authors to obtain individual participant data. We therefore did not include these trials in the primary analyses, but only in our exploratory analyses.
We included 51 publications reporting results of 25 trials (26 comparisons). The study flow chart is presented in Figure 1.
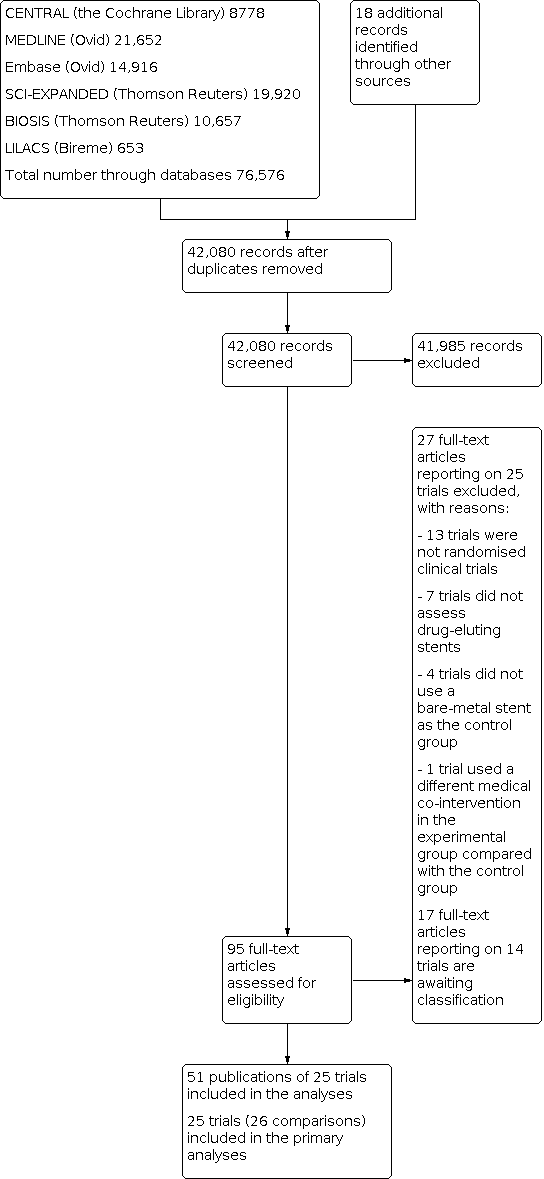
study flow diagram.
Included studies
We included 51 references reporting on 25 trials (26 comparisons) in our primary analyses comparing drug‐eluting stents versus bare‐metal stents. The trials were published between 2004 and 2016. The trials (which often took place in more than one country) were conducted at sites in 21 different countries: eight from Italy; eight from the Netherlands; five from Spain; three from Germany; three from the UK; three from Denmark; two each from Switzerland, Argentina, Austria, and Israel; and one each from Brazil, China, Croatia, Finland, France, Iran, Norway, Poland, Serbia, Sweden, and the USA. For further details on included studies please see Characteristics of included studies.
At one‐month follow‐up (median one‐month follow‐up), 6/25 trials reported all‐cause mortality, 7/25 trials reported serious adverse events, 6/25 trials reported major cardiovascular events, 5/25 trials reported cardiovascular mortality, 6/25 trials reported myocardial infarction, 5/25 trials reported stent thrombosis, and 6/25 trials reported target vessel revascularisation. No trials reported quality of life or angina.
At maximum follow‐up (median 12 months, range 1 to 72 months' follow‐up), 21/25 trials reported all‐cause mortality, 22/25 trials reported serious adverse events, 19/25 trials reported major cardiovascular events, 14/25 trials reported cardiovascular mortality, 18/25 trials reported myocardial infarction, 20/25 trials reported stent thrombosis, and 22/25 trials reported target vessel revascularisation. No trials reported quality of life or angina. Serious adverse events was not reported comprehensively and were limited to all‐cause mortality, cardiovascular mortality, myocardial infarction, stent thrombosis, and target vessel revascularisation.
Participants
The 25 included trials (26 comparisons) randomised a total of 12,503 participants with acute coronary syndrome. The number of participants in each trial ranged from 16 to 3006. The mean age was 60.4 years (range 55.9 years to 65.9 years) in the drug‐eluting stents group and 61.2 years (range 57.1 years to 64.6 years) in the bare‐metal stents group. The mean proportion of women was 21.1% in the drug‐eluting stents group and 31.3% in the bare‐metal stents group. In the drug‐eluting stents group 15.4% of participants had diabetes, whereas in the bare‐metal stents group 14.2% had diabetes. In both the drug‐eluting stents group and the bare‐metal stents group, 45% of participants had hypertension. In the drug‐eluting stents group 40.5% had hyperlipidaemia, whereas in the bare‐metal stents group 39.5% had hyperlipidaemia. The percentage of participants who had a previous myocardial infarction was 7.7% in the drug‐eluting stents group and 7.8% in the bare‐metal stents group. In the drug‐eluting stents group 6.6% had undergone a previous PCI, whereas in the bare‐metal stents group 5.7% had undergone a previous PCI. In the drug‐eluting stents group 2.3% had had a coronary bypass graft inserted, whereas in the bare‐metal stents group 1.9% had had a coronary bypass graft inserted.
In 22 trials (23 comparisons), the participants presented with STEMI. In two trials, the participants presented with different types of acute coronary syndrome. In one trial (ELISA‐3 2016), participants presented with NSTEMI.
In the drug‐eluting stents group, 50.1% had a lesion in the left anterior descending artery, 48.6% a lesion in the right circumflex artery, and 17.4% in the left circumflex artery. Under 1% had a lesion in the left main artery, intermediate branch, or in a graft. In the bare‐metal stents group, 49.8% had a lesion in the left anterior descending artery, 49.3% a lesion in the right circumflex artery, and 18.6% in the left circumflex artery. Under 1% had a lesion in the left main artery, intermediate branch, or in a graft.
In the drug‐eluting stents group, 62% of participants had one vessel disease and 38% had multivessel disease. In the bare‐metal stents group, 59% had one vessel disease and 41% had multivessel disease. In the drug‐eluting stents group, 62% of participants had a lesion with TIMI flow 0/1, 13.9% with TIMI 2, and 26.2% with TIMI 3. In the bare‐metal stents group, 61.6% had a lesion with TIMI flow 0/1, 13.9% with TIMI 2, and 26.3% with TIMI 3. Participants may have had a lesion in more than one vessel, hence the total of the above percentages is equal to more than 100%.
Experimental intervention
We included 11 trials where the drug‐eluting stent was a sirolimus‐eluting stent (with seven of these being a Cypher sirolimus‐eluting stent) and eight trials (nine comparisons) where it was a paclitaxel‐eluting stent (with six trials using a Taxus stent, either Express, Liberte, or unspecified). Two trials used an everolimus‐eluting stent, one trial a Biolimus‐eluting stent, one trial a dexamethasone‐eluting stent, one trial a zotarolimus‐eluting stent, and one trial a mix of drug‐eluting stents (sirolimus‐, paclitaxel‐ and zotarolimus‐eluting stents). In one trial it was unclear what type of drug‐eluting stent was used.
Successful PCI was performed in 95.2% of participants in the drug‐eluting stents group (reported by 16 trials). The average length of the drug‐eluting stent was 23.87 mm. The mean duration from onset of chest pain to PCI was 235.5 minutes (range 144 to 438 minutes) in the drug‐eluting stents group
Control intervention
The bare‐metal stent used in three trials was an Express bare‐metal stent, two trials a Driver stent, one trial an Express2 stent, one trial a Gazelle stent, one trial a Genius MAGIC stent, one trial a Multi‐Link Vision cobalt chromium stent, one trial a Vision stent, one trial a BiodivYsio stent, one trial a BX stent, and one trial a Liberte stent. In 10 trials the bare‐metal stent used was not specified. One trial used a mix of different bare‐metal stents.
Successful PCI was performed in 93.0% of participants in the bare‐metal stents group (reported by 16 trials). The average length of the bare‐metal stent was 22.29 mm. The mean duration from onset of chest pain to PCI was 242.2 minutes (range 164 to 426 minutes) in the bare‐metal stents group
Co‐interventions
All 25 trials (26 comparisons) employed co‐interventions. In 22 of these trials the study was designed to deliver the co‐interventions similarly in the drug‐eluting stents group and the bare‐metal stents group. In two trials the co‐interventions were not specified, and in one trial the drug‐eluting stents group and the bare‐metal stents group received different co‐interventions (different length of antithrombotic therapy). Before or at the time of PCI, aspirin was given to 99.8% of participants in both groups in the 10 trials that reported this. Clopidogrel was given to 85.4% of participants in the drug‐eluting stents group and 84.6% of participants in the bare‐metal stents group in the 10 trials that reported this. Heparin was given to 88.9% of participants in the drug‐eluting stents group and 89.8% of participants in the bare‐metal stents group in the eight trials that reported this. Glycoprotein IIb/IIIa receptor blocker was given to 63.5% of participants in the drug‐eluting stents group and 61.4% of participants in the bare‐metal stents group in the nine trials that reported this. For further details see Characteristics of included studies.
The post‐stent implantation therapy in 14 of the 25 trials was 80 mg to 100 mg of aspirin every day indefinitely. One trial administered 80 mg to 325 mg indefinitely; a second trial administered 250 mg for at least a year; and a third trial stated that participants received aspirin, but the dose was unclear. In eight trials it was unclear if the participants received aspirin in the months after stent implantation.
In three trials clopidogrel was administered for a year at an unspecified dose. In two trials 75 mg clopidogrel was administered for three months; in nine trials 75 mg was administered for nine to 12 months; and in four trials 75 mg was administered for six months. In five trials it was unclear if participants received clopidogrel in the months after stent implantation. One trial administered 500 mg ticlopidine for six weeks. Another trial administered 60 mg of prasugrel or 75 mg of clopidogrel for one year.
Excluded studies
Based on our inclusion and exclusion criteria, we excluded 27 publications on 25 trials after full‐text assessment. Seven trials did not assess drug‐eluting stents; four trials did not assess bare‐metal stents; one trial used a different medical intervention in the drug‐eluting stents group compared with the bare‐metal stents group; and 13 trials were not randomised clinical trials. For further details see Characteristics of excluded studies.
Risk of bias in included studies
Based on the information we collected from the published reports and received from authors, we judged all 25 trials (26 comparisons) to be at high risk of bias. We judged many trials to be at unclear risk of bias in several domains, and we were unable to obtain additional information from the authors when contacted. Additional information is provided in the 'Risk of bias' summary (Figure 2), 'Risk of bias' graph (Figure 3), and in the Characteristics of included studies table.

Risk of bias graph: review authors' judgements about each risk of bias item presented as percentages across all included studies.

Risk of bias summary: review authors' judgements about each risk of bias item for each included study.
Allocation
The generation of the allocation sequence was at low risk of bias in 11 trials. The remaining 14 trials were described as being randomised, but the method used for sequence generation was not mentioned.
The method used to conceal allocation was at low risk of bias in 12 trials. In the remaining 13 trials the method used for allocation concealment was insufficiently described.
Blinding
The blinding of participants was at low risk of bias in one trial (ELISA‐3 2016). Nine trials stated that participants and personnel were not blinded. In the remaining 15 trials the method used to blind participants and personnel was insufficiently described.
The blinding of outcome assessors was performed and adequately described in 11 trials. One trial stated that outcome assessors were not blinded. In the remaining 13 trials the method used to blind outcome assessors was insufficiently described.
Incomplete outcome data
Thirteen trials adequately addressed incomplete outcome data. In the remaining 12 trials the method used to handle incomplete outcome data was insufficiently described.
Selective reporting
Four trials reported the results of the outcomes as specified in their respective protocols, or reported our primary outcomes, resulting in a judgement of low risk of bias according to our predefined 'Risk of bias' assessment. Five trials did not report the same outcomes as stated in the pre‐published protocol. For the remaining 16 trials, we could not obtain a protocol and the trial did not report our primary outcomes sufficiently.
Other potential sources of bias
Four trials had no other biases, resulting in a judgement of low risk of bias. Eleven trials were industry funded, resulting in an assessment of high risk of bias. The remaining 10 trials did not report how they were funded and were therefore judged to be at unclear risk of bias.
Effects of interventions
See: Summary of findings 1 Drug‐eluting stents compared to bare‐metal stents for acute coronary syndrome
Results at maximum follow‐up
Primary outcomes
All‐cause mortality
Twenty‐one out of 25 trials (22 comparisons) with a total of 11,250 participants and a median follow‐up of 12 months (range 1 to 72 months) reported all‐cause mortality at maximum follow‐up. A total of 431/6250 (6.87%) participants receiving drug‐eluting stents died versus 387/5000 (7.74%) participants receiving bare‐metal stents. Meta‐analysis showed no evidence of a difference (risk ratio (RR) 0.90, 95% confidence interval (CI) 0.78 to 1.03, 11,250 participants, 21 trials/22 comparisons, low‐quality evidence, Analysis 1.1). Hence, the absolute risk for mortality at maximum follow‐up was 6.97% in the drug‐eluting stents group compared with 7.74% in the bare‐metal stents group.
Heterogeneity
Visual inspection of the forest plots and the tests for statistical heterogeneity (I2 = 0%; P = 0.68) indicated that heterogeneity might not be important.
Trial Sequential Analysis
Trial Sequential Analysis showed that there was not enough information to confirm or reject that drug‐eluting stents versus bare‐metal stents results in a risk ratio reduction (RRR) of 10% on all‐cause mortality at maximum follow‐up (Figure 4). The Trial Sequential Analysis‐adjusted CI was 0.70 to 1.14.

Trial Sequential Analysis of drug‐eluting stents versus bare‐metal stents on all‐cause mortality at maximum follow‐up in 21 trials. The diversity‐adjusted required information size (RIS) was calculated based on mortality in the control group of 7.76%; risk ratio reduction (RRR) of 10% in the experimental group; type I error of 2.0%; and type II error of 20% (80% power). No diversity was noted. The diversity‐adjusted required information size was 45,046 participants. The cumulative Z‐curve (blue line) did not cross the trial sequential monitoring boundaries for benefit or harm (red inward‐sloping lines). The cumulative Z‐curve did not cross the inner‐wedge futility line (the inner‐wedge futility could not be calculated due to too little information). Additionally, the cumulative Z‐score did not cross the RIS. The green dotted line shows conventional boundaries (2.0%).
Bayes factor
Bayes factor was calculated based on a RR of 0.90 and the meta‐analysis result (RR 0.90). Bayes factor of 0.79 was above the Bayes factor threshold for significance of 0.1, supporting that there seems to be no evidence of a beneficial effect of drug‐eluting stent on all‐cause mortality at maximum follow‐up.
Risk of bias and sensitivity analyses
We assessed the risk of bias of the outcome result in all trials as high, therefore we could not conduct sensitivity analysis for bias.
The best‐worst and worst‐best case meta‐analyses showed that incomplete outcome data bias had the potential to influence the results (best‐worst meta‐analysis (RR 0.60, 95% CI 0.44 to 0.80, 11,775 participants, 21 trials/22 comparisons, Analysis 1.2); worst‐best meta‐analysis (RR 1.27, 95% CI 0.99 to 1.64, 11,775 participants, 21 trials/22 comparisons, Analysis 1.3)). Data were imputed for 11 trials.
Visual inspection of the funnel plots showed some signs of asymmetry. Harbord's test for small‐study effects was not significant (P = 0.19). Using the trim and fill method, we found our meta‐analysis results were not affected. Hence, we assessed the risk of publication bias as low.
Subgroup analyses
The formal test for subgroup difference in Review Manager 5 found no evidence of a difference in subgroup analyses according to type of drug‐eluting stent, type of participants (STEMI compared with mixed acute coronary syndrome (ACS) participants), length of maximum follow‐up, and protocol registration status (Analysis 1.4; Analysis 1.5; Analysis 1.6; Analysis 1.7).
Serious adverse events
Twenty‐two out of 25 (23 comparisons) trials with a total of 11,724 participants and a median follow‐up of 12 months (range 1 to 72) reported serious adverse events at maximum follow‐up. A total of 1292/6484 (19.92%) participants receiving drug‐eluting stents had a serious adverse event versus 1206/5240 (23.01%) participants receiving bare‐metal stents. Meta‐analysis showed evidence of a beneficial effect of drug‐eluting stents compared with bare‐metal stents on the risk of serious adverse events at maximum follow‐up (RR 0.80, 95% CI 0.74 to 0.86, 11,724 participants, 22 trials/23 comparisons, low‐quality evidence, Analysis 1.8). Hence, the absolute risk for serious adverse events at maximum follow‐up was 18.04% in the drug‐eluting stents group compared with 23.01% in the bare‐metal stents group.
Heterogeneity
Visual inspection of the forest plots and the tests for statistical heterogeneity (I2 = 22%; P = 0.17) indicated that heterogeneity might not be important.
Trial Sequential Analysis
Trial Sequential Analysis showed that the Z‐curve crossed the boundary for benefit. Hence, there seems to be firm evidence that drug‐eluting stents versus bare‐metal stents results in a RRR of 10% or more on the risk of a serious adverse event at maximum follow‐up (Figure 5). In accordance, the Trial Sequential Analysis‐adjusted CI was 0.65 to 0.93. We did not calculate a Trial Sequential Analysis of the CI limit closest to zero effect, as we had already conducted a Trial Sequential Analysis of 10%, which was lower than the limit of the CI (14%).

Trial Sequential Analysis of drug‐eluting stents versus bare‐metal stents on serious adverse events at maximum follow‐up in 22 trials. The diversity‐adjusted required information size (RIS) was calculated based on a rate of serious adverse events in the control group of 22.95%; risk ratio reduction (RRR) of 10% in the experimental group; type I error of 2.0%; and type II error of 20% (80% power). No diversity was noted. The diversity‐adjusted required information size was 24,853 participants. The cumulative Z‐curve (blue line) crossed the trial sequential monitoring boundaries for benefit. The green dotted line shows conventional boundaries (2.0%).
Bayes factor
Bayes factor was calculated based on a RR of 0.90 and the meta‐analysis result (RR 0.80). Bayes factor of 0.069 was below the Bayes factor threshold for significance of 0.1, supporting that there seems to be evidence of an effect of drug‐eluting stents on serious adverse events at maximum follow‐up.
Risk of bias and sensitivity analyses
We assessed the risk of bias of the outcome result in all trials as high, therefore we could not conduct sensitivity analysis for bias.
The best‐worst case and worst‐best case meta‐analyses showed that incomplete outcome data bias alone had the potential to influence the results (best‐worst case meta‐analysis (RR 0.67, 95% CI 0.62 to 0.71, 12,249 participants, 22 trials/23 comparisons, Analysis 1.9); worst‐best case meta‐analysis (RR 0.98, 95% CI 0.91 to 1.05, 12,249 participants, 22 trials/23 comparisons, Analysis 1.10)). Data were imputed for 11 trials.
Visual inspection of the funnel plots showed no signs of asymmetry. Harbord's test for small‐study effects was not significant (P = 0.08). Hence, we assessed the risk of publication bias as low.
Subgroup analyses
The formal test for subgroup difference in Review Manager 5 found no evidence of a difference in subgroup analyses according to type of drug‐eluting stent, type of participants (STEMI compared with mixed ACS participants), length of maximum follow‐up, and protocol registration status (Analysis 1.11; Analysis 1.12; Analysis 1.13; Analysis 1.14).
Major cardiovascular events
Nineteen out of 25 trials (20 comparisons) with a total of 10,939 participants and a median follow‐up of 12 months (range 1 to 72) reported major cardiovascular events (defined as cardiovascular death or myocardial infarction) at maximum follow‐up. A total of 400/6096 (6.56%) participants receiving drug‐eluting stents had a major cardiovascular event versus 321/4843 (6.63%) participants receiving bare‐metal stents. Meta‐analysis showed no evidence of a difference (RR 0.96, 95% CI 0.83 to 1.11, 10,939 participants, 19 trials/20 comparisons, very low‐quality evidence, Analysis 1.15). Hence, the absolute risk for major cardiovascular event at maximum follow‐up was 6.36% in the drug‐eluting stents group compared with 6.63% in the bare‐metal stents group.
Heterogeneity
Visual inspection of the forest plots and the tests for statistical heterogeneity (I2 = 0%; P = 0.87) indicated that heterogeneity might not be important.
Trial Sequential Analysis
Trial Sequential Analysis showed that there was not enough information to confirm or reject that drug‐eluting stents versus bare‐metal stents results in a RRR of 10% on major cardiovascular events at maximum follow‐up. The Trial Sequential Analysis‐adjusted CI was 0.53 to 1.76.
Bayes factor
Bayes factor was calculated based on a RR of 0.90 and the meta‐analysis result (RR 0.96). Bayes factor of 0.57 was above the Bayes factor threshold for significance of 0.1, supporting that there seems to be no evidence of an effect of drug‐eluting stents on major cardiovascular events at maximum follow‐up.
Risk of bias and sensitivity analyses
We assessed the risk of bias of the outcome result in all trials as high, therefore we could not conduct sensitivity analysis for bias.
The best‐worst case and worst‐best case meta‐analyses showed that incomplete outcome data bias alone had the potential to influence the results (best‐worst case meta‐analysis (RR 0.53, 95% CI 0.39 to 0.72, 11,596 participants, 19 trials/20 comparisons, Analysis 1.16); worst‐best case meta‐analysis (RR 1.40, 95% CI 0.97 to 2.00, 11,596 participants, 19 trials/20 comparisons, Analysis 1.17)). Data were imputed for nine trials.
Visual inspection of the funnel plots showed no signs of asymmetry. Harbord's test for small‐study effects was not significant (P = 0.21). Hence, we assessed the risk of publication bias as low.
Subgroup analyses
The formal test for subgroup difference in Review Manager 5 found no evidence of a difference in subgroup analyses according to type of drug‐eluting stent, type of participants (STEMI compared with mixed ACS participants), length of maximum follow‐up, and protocol registration status (Analysis 1.18; Analysis 1.19; Analysis 1.20; Analysis 1.21).
Quality of life
No trials reported quality of life at any time point.
Secondary outcomes
Cardiovascular mortality
Fourteen out of 25 trials (15 comparisons) with a total of 9248 participants and a mean follow‐up of 44.5 months (range 3 to 137) reported cardiovascular mortality at maximum follow‐up. A total of 260/5402 (4.81%) participants receiving drug‐eluting stents died by a cardiovascular cause versus 223/3846 (5.80%) participants receiving bare‐metal stents. Meta‐analysis showed no evidence of a difference (RR 0.91, 95% CI 0.76 to 1.09, 9248 participants, 14 trials/15 comparisons, very low‐quality evidence, Analysis 1.22).
Heterogeneity
Visual inspection of the forest plots and the tests for statistical heterogeneity (I2 = 0%; P = 0.44) indicated that heterogeneity might not be important.
Trial Sequential Analysis
Trial Sequential Analysis showed that there was not enough information to confirm or reject that drug‐eluting stents versus bare‐metal stents results in a RRR of 10% on cardiovascular mortality at maximum follow‐up. The Trial Sequential Analysis‐adjusted CI was 0.44 to 1.89.
Bayes factor
Bayes factor was calculated based on a RR of 0.90 and the meta‐analysis result (RR 0.91). Bayes factor of 0.9 was above the Bayes factor threshold for significance of 0.1, supporting that there seems to be no evidence of an effect of drug‐eluting stents on cardiovascular mortality at maximum follow‐up.
Risk of bias and sensitivity analyses
We assessed the risk of bias of the outcome result in all trials as high, therefore we could not conduct sensitivity analysis for bias.
The best‐worst case and worst‐best case meta‐analyses showed that incomplete outcome data bias alone had the potential to influence the results (best‐worst case meta‐analysis (RR 0.50, 95% CI 0.32 to 0.77, 9742 participants, 14 trials, Analysis 1.23); worst‐best case meta‐analysis (RR 1.49, 95% CI 1.06 to 2.11, 9742 participants, 14 trials, Analysis 1.24)). Data were imputed for eight trials.
Visual inspection of the funnel plots showed no signs of asymmetry. Harbord's test for small‐study effects was not significant (P = 0.39). Hence, we assessed the risk of publication bias as low.
Subgroup analyses
The formal test for subgroup difference in Review Manager 5 found no evidence of a difference in subgroup analyses according to type of drug‐eluting stent, type of participants (STEMI compared with mixed ACS participants), length of maximum follow‐up, and protocol registration status (Analysis 1.25; Analysis 1.26; Analysis 1.27; Analysis 1.28).
Myocardial infarction
Eighteen out of 25 trials (19 comparisons) with a total of 10,217 participants and a mean follow‐up of 44.5 months (range 3 to 137) reported myocardial infarction at maximum follow‐up. A total of 296/5732 (5.15%) participants receiving drug‐eluting stents had a myocardial infarction versus 214/4485 (4.75%) participants receiving bare‐metal stents. Meta‐analysis showed no evidence of a difference (RR 0.98, 95% CI 0.82 to 1.18, 10,217 participants, 18 trials/19 comparisons, very low‐quality evidence, Analysis 1.29).
Heterogeneity
Visual inspection of the forest plots and the tests for statistical heterogeneity (I2 = 0%; P = 0.56) indicated that heterogeneity might not be important.
Trial Sequential Analysis
Trial Sequential Analysis showed that there was not enough information to confirm or reject that drug‐eluting stents versus bare‐metal stents results in a RRR of 10% on myocardial infarction at maximum follow‐up. The Trial Sequential Analysis‐adjusted CI was 0.46 to 2.08.
Bayes factor
Bayes factor was calculated based on a RR of 0.90 and the meta‐analysis result (RR 0.98). Bayes factor of 1.09 was above the Bayes factor threshold for significance of 0.1, supporting that there seems to be no evidence of an effect of drug‐eluting stents on myocardial infarction at maximum follow‐up.
Risk of bias and sensitivity analyses
We assessed the risk of bias of the outcome result in all trials as high, therefore we could not conduct sensitivity analysis for bias.
The best‐worst case and worst‐best case meta‐analyses showed that incomplete outcome data bias alone had the potential to influence the results (best‐worst case meta‐analysis (RR 0.46, 95% CI 0.33 to 0.66, 10,851 participants, 18 trials/19 comparisons, Analysis 1.30); worst‐best case meta‐analysis (RR 1.56, 95% CI 1.00 to 2.45, 10,851 participants, 18 trials/19 comparisons, Analysis 1.31)). Data were imputed for 10 trials.
Visual inspection of the funnel plots showed no signs of asymmetry. Harbord's test for small‐study effects was not significant (P = 0.39). Hence, we assessed the risk of publication bias as low.
Subgroup analyses
The formal test for subgroup difference in Review Manager 5 found no evidence of a difference in subgroup analyses according to type of drug‐eluting stent, type of participants (STEMI compared with mixed ACS participants), length of maximum follow‐up, and protocol registration status (Analysis 1.32; Analysis 1.33; Analysis 1.34; Analysis 1.35).
Angina
No trials reported angina at any time point.
Exploratory outcomes
Stent thrombosis
Twenty out of 25 trials (21 comparisons) with a total of 11,350 participants and a mean follow‐up of 44.5 months (range 3 to 137) reported stent thrombosis at maximum follow‐up. A total of 268/6299 (4.23%) participants receiving drug‐eluting stents had a stent thrombosis versus 223/5051 (4.41%) of participants receiving bare‐metal stents. Meta‐analysis showed no evidence of a difference (RR 0.96, 95% CI 0.80 to 1.16, 11,350 participants, 20 trials/21 comparisons, Analysis 1.36).
Heterogeneity
Visual inspection of the forest plots and the tests for statistical heterogeneity (I2 = 0%; P = 0.53) indicated that heterogeneity might not be important.
Trial Sequential Analysis
Trial Sequential Analysis showed that there was not enough information to confirm or reject that drug‐eluting stents versus bare‐metal stents results in a RRR of 10% on stent thrombosis at maximum follow‐up. The Trial Sequential Analysis‐adjusted CI was 0.45 to 2.05.
Bayes factor
Bayes factor was calculated based on a RR of 0.90 and the meta‐analysis result (RR 0.96). Bayes factor of 1.03 was above the Bayes factor threshold for significance of 0.1, supporting that there seems to be no evidence of an effect of drug‐eluting stents on stent thrombosis at maximum follow‐up.
Risk of bias and sensitivity analyses
We assessed the risk of bias of the outcome result in all trials as high, therefore we could not conduct sensitivity analysis for bias.
The best‐worst case and worst‐best case meta‐analyses showed that incomplete outcome data bias alone had the potential to influence the results (best‐worst case meta‐analysis (RR 0.47, 95% CI 0.32 to 0.67, 12,007 participants, 20 trials/21 comparisons, Analysis 1.37); worst‐best case meta‐analysis (RR 1.55, 95% CI 1.12 to 2.15, 12,007 participants, 20 trials/21 comparisons, Analysis 1.38)). Data were imputed for 12 trials.
Visual inspection of the funnel plots showed signs of asymmetry. Harbord's test for small‐study effects was not significant (P = 0.05). The trim and fill method did not change our results. Hence, we assessed the risk of publication bias as low.
Subgroup analyses
The formal test for subgroup difference in Review Manager 5 found no evidence of a difference in subgroup analyses according to type of drug‐eluting stent, type of participants (STEMI compared with mixed ACS participants), length of maximum follow‐up, and protocol registration status (Analysis 1.39; Analysis 1.40; Analysis 1.41; Analysis 1.42).
Target vessel revascularisation
Twenty‐two out of 25 trials (23 comparisons) with a total of 11,770 participants and a median follow‐up of 12 months (range 1 to 72) reported target vessel revascularisation at maximum follow‐up. A total of 576/6504 (8.85%) participants receiving drug‐eluting stents had a target vessel revascularisation versus 702/5266 (13.33%) participants receiving bare‐metal stents. Meta‐analysis showed evidence of a beneficial effect of drug‐eluting stents compared with bare‐metal stents on the risk of target vessel revascularisation at maximum follow‐up (RR 0.58, 95% CI 0.52 to 0.65, 11,770 participants, 22 trials/23 comparisons, Analysis 1.43).
Heterogeneity
Visual inspection of the forest plots indicated no statistical heterogeneity. The test for statistical heterogeneity (I2 = 37%; P = 0.04) indicated moderate heterogeneity.
Trial Sequential Analysis
Trial Sequential Analysis showed that the Z‐curve crossed the boundary for benefit. Hence, there seems to be firm evidence that drug‐eluting stents versus bare‐metal stents results in a RRR of 30% or more on the risk of target vessel revascularisation at maximum follow‐up (Figure 6). In accordance, the Trial Sequential Analysis‐adjusted CI was 0.50 to 0.67.

Trial Sequential Analysis of drug‐eluting stents versus bare‐metal stents on target vessel revascularisation at maximum follow‐up in 22 trials. The diversity‐adjusted required information size (RIS) was calculated based on a rate of target vessel revascularisations in the control group of 13.28%; risk ratio reduction (RRR) of 30% in the experimental group; type I error of 3.33%; and type II error of 20% (80% power). No diversity was noted. The diversity‐adjusted required information size was 5361 participants. The cumulative Z‐curve (blue line) crossed the trial sequential monitoring boundaries for benefit. The green dotted line shows conventional boundaries (3.33%).
Bayes factor
Bayes factor was calculated based on a RR of 0.70 and the meta‐analysis result (RR 0.58). Bayes factor of 0.0002 was below the Bayes factor threshold for significance of 0.1, supporting that there seems to be evidence of an effect of drug‐eluting stents on target vessel revascularisation at maximum follow‐up.
Risk of bias and sensitivity analyses
We assessed the risk of bias of the outcome result in all trials as high, therefore we could not conduct sensitivity analysis for bias.
The best‐worst case and worst‐best case meta‐analyses showed that incomplete outcome data bias alone had the potential to influence the results (best‐worst case random‐effects meta‐analysis (RR 0.41, 95% CI 0.37 to 0.45, 12,368 participants, 22 trials/23 comparisons, Analysis 1.44); worst‐best case meta‐analysis (RR 0.98, 95% CI 0.89 to 1.07, 12,368 participants, 22 trials/23 comparisons, Analysis 1.45)). Data were imputed for 14 trials.
Visual inspection of the funnel plots showed no clear signs of asymmetry. Harbord's test for small‐study effects was not significant (P = 0.05). Hence, we assessed the risk of publication bias as low.
Subgroup analyses
The formal test for subgroup difference in Review Manager 5 found no evidence of a difference in subgroup analyses according to type of drug‐eluting stent, type of participants (STEMI compared with mixed ACS participants), length of maximum follow‐up, and protocol registration status (Analysis 1.46; Analysis 1.47; Analysis 1.48; Analysis 1.49).
Results at one‐month follow‐up
Primary outcomes
All‐cause mortality
Six out of 25 trials with a total of 3233 participants reported target vessel revascularisation at one‐month follow‐up. A total of 25/1621 (1.54%) participants receiving drug‐eluting stents had a target vessel revascularisation versus 51/1612 (3.16%) participants receiving bare‐metal stents. Meta‐analysis showed evidence of a beneficial effect of drug‐eluting stents compared with bare‐metal stents on the risk of target vessel revascularisation at one‐month follow‐up (RR 0.50, 95% CI 0.31 to 0.82, 3233 participants, 6 trials, Analysis 2.1).
Heterogeneity
Visual inspection of the forest plots and the tests for statistical heterogeneity (I2 = 0%; P = 0.55) indicated that heterogeneity might not be important.
Bayes factor
Bayes factor was calculated based on a RR 0.70 and the meta‐analysis result (RR 0.50). Bayes factor of 0.26 was above the Bayes factor threshold for significance of 0.1, supporting that there seems to be no evidence of an effect of drug‐eluting stents on target vessel revascularisation at one‐month follow‐up.
Risk of bias and sensitivity analyses
We assessed the risk of bias of the outcome result in all trials as high, therefore we could not conduct sensitivity analysis for bias.
The best‐worst case and worst‐best case meta‐analyses showed that incomplete outcome data bias alone did not have the potential to influence the results (best‐worst case meta‐analysis (RR 0.41, 95% CI 0.26 to 0.66, 3251 participants, 6 trials, Analysis 2.2); worst‐best case meta‐analysis (RR 0.62, 95% CI 0.40 to 0.98, 3251 participants, 6 trials, Analysis 2.3)). Data were imputed for two trials.
We did not visually inspect the funnel plots or perform Harbord's test as fewer than 10 trials were included for this outcome. Hence, we assessed the risk of publication bias as unclear.
Subgroup analyses
The formal test for subgroup difference in Review Manager 5 found no evidence of a difference in subgroup analyses according to type of drug‐eluting stent, type of participants (STEMI compared with mixed ACS participants), and protocol registration status (Analysis 2.4; Analysis 2.5; Analysis 2.6).
Serious adverse events
Seven out of 25 trials with a total of 3313 participants reported serious adverse events at one‐month follow‐up. A total of 48/1661 (2.89%) participants receiving drug‐eluting stents had a serious adverse event versus 74/1652 (4.48%) participants receiving bare‐metal‐stents. Meta‐analysis showed evidence of a beneficial effect of drug‐eluting stents compared with bare‐metal stents on the risk of serious adverse events at one‐month follow‐up (RR 0.65, 95% CI 0.45 to 0.93, 3313 participants, 7 trials, Analysis 2.7).
Heterogeneity
Visual inspection of the forest plots and the tests for statistical heterogeneity (I2 = 0%; P = 0.94) indicated that heterogeneity might not be important.
Bayes factor
Bayes factor was calculated based on a RR of 0.90 and the meta‐analysis result (RR 0.65). Bayes factor of 0.68 was above the Bayes factor threshold for significance of 0.1, supporting that there seems to be no beneficial significant effect of drug‐eluting stents on serious adverse events at one‐month follow‐up.
Risk of bias and sensitivity analyses
We assessed the risk of bias of the outcome result in all trials as high, therefore we could not conduct sensitivity analysis for bias.
The best‐worst case and worst‐best case meta‐analyses showed that incomplete outcome data bias alone had the potential to influence the results (best‐worst case meta‐analysis (RR 0.56, 95% CI 0.40 to 0.80, 3331 participants, 7 trials, Analysis 2.8); worst‐best case meta‐analysis (RR 0.73, 95% CI 0.52 to 1.03, 3331 participants, 7 trials, Analysis 2.9)). Data were imputed for three trials.
We did not visually inspect the funnel plots or perform Harbord's test as fewer than 10 trials were included for this outcome. Hence, we assessed the risk of publication bias as unclear.
Subgroup analyses
The formal test for subgroup difference in Review Manager 5 found no evidence of a difference in subgroup analyses according to type of drug‐eluting stent, type of participants (STEMI compared with mixed ACS participants), and protocol registration status (Analysis 2.10; Analysis 2.11; Analysis 2.12).
Major cardiovascular events
Six out of 25 trials with a total of 3150 participants reported major cardiovascular events (defined as cardiovascular mortality or myocardial infarction) at one‐month follow‐up. A total of 30/1580 (1.90%) participants receiving drug‐eluting stents had a major cardiovascular event versus 44/1570 (2.80%) participants receiving bare‐metal stents. Meta‐analysis showed no evidence of a difference (RR 0.68, 95% CI 0.43 to 1.08, 3150 participants, 6 trials, Analysis 2.13).
Heterogeneity
Visual inspection of the forest plots and the tests for statistical heterogeneity (I2 = 0%; P = 0.98) indicated that heterogeneity might not be important.
Bayes factor
Bayes factor was calculated based on a RR 0.90 and the meta‐analysis result (RR 0.68). Bayes factor of 0.93 was above the Bayes factor threshold for significance of 0.1, supporting that there seems to be no evidence of an effect of drug‐eluting stents on major cardiovascular events at one‐month follow‐up.
Risk of bias and sensitivity analyses
We assessed the risk of bias of the outcome result in all trials as high, therefore we could not conduct sensitivity analysis for bias.
The best‐worst case and worst‐best case meta‐analyses showed that incomplete outcome data bias alone had the potential to influence the results (best‐worst case meta‐analysis (RR 0.54, 95% CI 0.35 to 0.84, 3168 participants, 6 trials, Analysis 2.14); worst‐best case meta‐analysis (RR 0.82, 95% CI 0.53 to 1.27, 3168 participants, 6 trials Analysis 2.15)). Data were imputed for three trials.
We did not visually inspect the funnel plots or perform Harbord's test as fewer than 10 trials were included for this outcome. Hence, we assessed the risk of publication bias as unclear.
Subgroup analyses
The formal test for subgroup difference in Review Manager 5 found no evidence of a difference in subgroup analyses according to type of drug‐eluting stent, type of participants (STEMI compared with mixed ACS participants), and protocol registration status (Analysis 2.16; Analysis 2.17; Analysis 2.18).
Secondary outcomes
Cardiovascular mortality
Five out of 25 trials with a total of 2406 participants reported cardiovascular mortality at one‐month follow‐up. A total of 22/1208 (1.82%) participants receiving drug‐eluting stents died by a cardiovascular cause versus 30/1198 (2.50%) of participants receiving bare‐metal stents. Meta‐analysis showed no evidence of a difference (RR 0.73, 95% CI 0.43 to 1.25, 2406 participants, 5 trials, Analysis 2.19).
Heterogeneity
Visual inspection of the forest plots and the test for statistical heterogeneity (I2 = 0%; P = 0.88) indicated that heterogeneity might not be important.
Bayes factor
Bayes factor was calculated based on a RR 0.90 and the meta‐analysis result (RR 0.73). Bayes factor of 1.02 was above the Bayes factor threshold for significance of 0.1, supporting that there seems to be no evidence of an effect of drug‐eluting stents on cardiovascular mortality at one‐month follow‐up.
Risk of bias and sensitivity analyses
We assessed the risk of bias of the outcome result in all trials as high, therefore we could not conduct sensitivity analysis for bias.
The best‐worst case and worst‐best case meta‐analyses showed that incomplete outcome data bias alone had the potential to influence the results (best‐worst case meta‐analysis (RR 0.53, 95% CI 0.32 to 0.88, 2423 participants, 5 trials, Analysis 2.20); worst‐best case meta‐analysis (RR 0.90, 95% CI 0.54 to 1.50, 2423 participants, 5 trials, ; Analysis 2.21)). Data were imputed for two trials.
We did not visually inspect the funnel plots or perform Harbord's test as fewer than 10 trials were included for this outcome. Hence, we assessed the risk of publication bias as unclear.
Subgroup analyses
The formal test for subgroup difference in Review Manager 5 found no evidence of a difference in subgroup analyses according to type of drug‐eluting stent, type of participants (STEMI compared with mixed ACS participants), and protocol registration status (Analysis 2.22; Analysis 2.23; Analysis 2.24).
Myocardial infarction
Six out of 25 trials with a total of 3150 participants reported myocardial infarction at one‐month follow‐up. A total of 13/1580 (0.82%) participants receiving drug‐eluting stents had a myocardial infarction versus 26/1570 (1.66%) of participants receiving bare‐metal stents. Meta‐analysis showed no evidence of a difference (RR 0.51, 95% CI 0.26 to 0.98, 3150 participants, 6 trials, Analysis 2.25).
Heterogeneity
Visual inspection of the forest plots and the tests for statistical heterogeneity (I2 = 0%; P = 0.99) indicated that heterogeneity might not be important.
Bayes factor
Bayes factor was calculated based on a RR 0.90 and the meta‐analysis result (RR 0.51). Bayes factor of 0.88 was above the Bayes factor threshold for significance of 0.1, supporting that there seems to be no evidence of an effect of drug‐eluting stents on myocardial infarction at one‐month follow‐up.
Risk of bias and sensitivity analyses
We assessed the risk of bias of the outcome result in all trials as high, therefore we could not conduct sensitivity analysis for bias.
The best‐worst case and worst‐best case meta‐analyses showed that incomplete outcome data bias alone had the potential to influence the results (best‐worst case meta‐analysis (RR 0.37, 95% CI 0.20 to 0.68, 3168 participants, 6 trials, Analysis 2.26); worst‐best case meta‐analysis: (RR 0.74, 95% CI 0.41 to 1.32, 3168 participants, 6 trials, Analysis 2.27)). Data were imputed for three trials.
We did not visually inspect the funnel plots or perform Harbord's test as fewer than 10 trials were included for this outcome. Hence, we assessed the risk of publication bias as unclear.
Subgroup analyses
The formal test for subgroup difference in Review Manager 5 found no evidence of a difference in subgroup analyses according to type of drug‐eluting stent, type of participants (STEMI compared with mixed ACS participants), and protocol registration status (Analysis 2.28; Analysis 2.29; Analysis 2.30).
Exploratory outcomes
Stent thrombosis
Five out of 25 trials with a total of 3070 participants reported stent thrombosis at one‐month follow‐up. A total of 15/1540 (0.97%) participants receiving drug‐eluting stents had a stent thrombosis versus 31/1530 (2.03%) participants receiving bare‐metal stents. Meta‐analysis showed evidence of a beneficial effect of drug‐eluting stents compared with bare‐metal stents on the risk of stent thrombosis (RR 0.48, 95% CI 0.26 to 0.90, 3070 participants, 5 trials, Analysis 2.31).
Heterogeneity
Visual inspection of the forest plots and the tests for statistical heterogeneity (I2 = 0%; P = 0.88) indicated that heterogeneity might not be important.
Bayes factor
Bayes factor was calculated based on a RR 0.90 and the meta‐analysis result (RR 0.48). Bayes factor of 0.87 was above the Bayes factor threshold for significance of 0.1, supporting that there seems to be no evidence of an effect of drug‐eluting stents on stent thrombosis at one‐month follow‐up.
Risk of bias and sensitivity analyses
We assessed the risk of bias of the outcome result in all trials as high, therefore we could not conduct sensitivity analysis for bias.
The best‐worst case and worst‐best case meta‐analyses showed that incomplete outcome data bias alone had the potential to influence the results (best‐worst case meta‐analysis (RR 0.36, 95% CI 0.20 to 0.65, 3088 participants, 5 trials, Analysis 2.32); worst‐best case meta‐analysis (RR 0.68, 95% CI 0.39 to 1.18, 3088 participants, 5 trials, Analysis 2.33)). Data were imputed for three trials.
We did not visually inspect the funnel plots or perform Harbord's test as fewer than 10 trials were included for this outcome. Hence, we assessed the risk of publication bias as unclear.
Subgroup analyses
The formal test for subgroup difference in Review Manager 5 found no evidence of a difference in subgroup analyses according to type of drug‐eluting stent, type of participants (STEMI compared with mixed ACS participants), length of maximum follow‐up, and protocol registration status (Analysis 2.34; Analysis 2.35; Analysis 2.36).
Target vessel revascularisation
Six out of 25 trials with a total of 3233 participants reported target vessel revascularisation at one‐month follow‐up. A total of 25/1621 (1.54%) participants receiving drug‐eluting stents had a target vessel revascularisation versus 51/1612 (3.16%) participants receiving bare‐metal stents. Meta‐analysis showed evidence of a beneficial effect of drug‐eluting stents compared with bare‐metal stents on the risk of target vessel revascularisation at one‐month follow‐up (RR 0.50, 95% CI 0.31 to 0.82, 3233 participants, 6 trials, Analysis 2.37).
Heterogeneity
Visual inspection of the forest plots and the tests for statistical heterogeneity (I2 = 0%; P = 0.55) indicated that heterogeneity might not be important.
Bayes factor
Bayes factor was calculated based on a RR 0.70 and the meta‐analysis result (RR 0.50). Bayes factor of 0.26 was above the Bayes factor threshold for significance of 0.1, supporting that there seems to be no evidence of an effect of drug‐eluting stents on target vessel revascularisation at one‐month follow‐up.
Risk of bias and sensitivity analyses
We assessed the risk of bias of the outcome result in all trials as high, therefore we could not conduct sensitivity analysis for bias.
The best‐worst case and worst‐best case meta‐analyses showed that incomplete outcome data bias alone did not have the potential to influence the results (best‐worst case meta‐analysis (RR 0.41, 95% CI 0.26 to 0.66, 3251 participants, 6 trials, Analysis 2.38); worst‐best case meta‐analysis (RR 0.62, 95% CI 0.40 to 0.98, 3251 participants, 6 trials, Analysis 2.39)). Data were imputed for two trials.
We did not visually inspect the funnel plots or perform Harbord's test as fewer than 10 trials were included for this outcome. Hence, we assessed the risk of publication bias as unclear.
Subgroup analyses
The formal test for subgroup difference in Review Manager 5 found no evidence of a difference in subgroup analyses according to type of drug‐eluting stent, type of participants (STEMI compared with mixed ACS participants), and protocol registration status (Analysis 2.40; Analysis 2.41; Analysis 2.42).
GRADE assessments
Our main results are summarised in the summary of findings Table 1.
Discussion
Summary of main results
We included 25 trials (26 comparisons) randomising a total of 12,503 participants. All trials and outcomes were at high risk of bias, and the quality of the evidence according to the GRADE assessment was low to very low for all outcomes.
Meta‐analyses showed no evidence of a difference when comparing drug‐eluting stents with bare‐metal stents on the risk of all‐cause mortality and on major cardiovascular events. The results of our Trial Sequential Analysis showed that we did not have sufficient information to confirm or reject our anticipated RRR of 10% on both risk of all‐cause mortality and on major cardiovascular events.
Meta‐analyses showed evidence of a beneficial effect of drug‐eluting stents compared with bare‐metal stents on the risk of serious adverse events. The Trial Sequential Analysis for serious adverse events showed that the Z‐curve crossed the boundary for benefit for drug‐eluting stents. Hence, there seems to be firm evidence that drug‐eluting stents versus bare‐metal stents results in a RRR of 10% or more on the risk of a serious adverse event at maximum follow‐up. When assessing specific types of events included in the serious adverse event outcome separately, we found the majority of the events were target vessel revascularisation.
Formal tests for subgroup differences showed no evidence of a difference according to drug‐eluting stent type (including bioresorbable stents), type of participants (STEMI, NSTEMI, ACS), protocol registration status, and length of follow‐up for any of our primary outcomes.
Meta‐analyses showed no evidence of a difference when comparing drug‐eluting stents with bare‐metal stents on the risk of cardiovascular mortality and myocardial infarction. The results of our Trial Sequential Analysis showed that we did not have sufficient information to confirm or reject our anticipated RRR of 10% on both risk of cardiovascular mortality and on myocardial infarction.
No trials reported results on angina or quality of life.
Overall completeness and applicability of evidence
This review provides the most comprehensive and contemporary appraisal of the evidence on drug‐eluting stents versus bare‐metal stents to date. We searched for published and unpublished trials irrespective of publication type, publication status, publication date, and language. We also searched bibliographies of both Cochrane and non‐Cochrane reviews for any trials we might have missed. The high risk of bias in our trials suggests that our results may show an overestimation of the benefit of drug‐eluting stents and an underestimation of the harm of drug‐eluting stents.
No trials reported quality of life or the number of participants with angina.
A number of trials did not report data separately on ACS participants and participants with other ischaemic heart disease, therefore we could not include these participants in our analyses. We have included these trials as 'studies awaiting classification'. The results from these trials deviate from our analyses in showing a difference between interventions for major cardiovascular events and myocardial infarction. We have attempted to contact the trial authors for specific information on ACS participants, and hope to receive these data in the future.
Quality of the evidence
Heterogeneity
We assessed the statistical heterogeneity in the planned analyses of our primary and secondary outcomes as low.
Risk of systematic error ('bias')
Our 'Risk of bias' assessment showed that all trials were at high risk of bias. It is, therefore, highly probable that our review results are also biased, that is that there is a great risk that our results overestimate benefits and underestimate harm (Hrobjartsson 2012; Hrobjartsson 2013; Hrobjartsson 2014; Hrobjartsson 2014a; Jakobsen 2014; Lundh 2012; Savović 2012; Schulz 1995; Wood 2008). We have downgraded all of our outcomes by two levels for a very serious risk of bias.
Only one trial had low risk of bias in blinding of participants and personnel, due to the nature of the PCI procedure. Trials without blinding of participants and personnel tend to overestimate benefits and underestimate harm (Hrobjartsson 2014; Pocock 2015; Savović 2012; Wood 2008). This may be due to a lack of expectations in a control group; differential behaviours across intervention groups (e.g. differential dropout or differential cross‐over to an alternative intervention); or different perception and reporting of an outcome such as pain or feeling more obliged to consider participants for target vessel revascularisation when knowing that a participant had received a bare‐metal stent (Higgins 2011a.
We assessed 12 out of 25 trials as at unclear or high risk of bias for the incomplete outcome data bias domain. Our best‐worst case and worst‐best case analyses showed that incomplete outcome data alone had the potential to change our results at maximum follow‐up. Where insufficient data were reported by the trialists, we attempted to contact the authors, but frequently did not receive a reply. Hence, the extent of the incomplete outcome data was often unclear. Our best‐worst case and worst‐best case analyses might underestimate the potential impact of missing data because only the data on the reported population were used if no other information was available. Incomplete outcome data bias might potentially have an even greater bias impact than our best‐worst case/worst‐best case scenarios show, that is the ’true’ difference between the actually observed cases and the intention‐to‐treat population might be larger than our data suggest.
Publication bias
Most of our funnel plots and Harbord's tests did not show clear signs of asymmetry (only all‐cause mortality and stent thrombosis showed some signs). We assessed those that did show signs with a trim and fill method, which showed that the results were not changed. Hence, there was no strong suspicion of significant small‐study bias or publication bias for any of our results.
Indirectness
In our review the composite outcome 'serious adverse events' was largely driven by target vessel revascularisation. The reason for performing target vessel revascularisation is typically based on clinical characteristics such as unstable angina or an angiographic indication. The angiographic indication could be problematic: it may be that there is an angiographic difference at follow‐up between participants receiving drug‐eluting stents and participants receiving bare‐metal stents, but that this angiographic difference does not necessarily translate into different clinical outcomes. Despite the above, we have not chosen to downgrade for indirectness, but the reader should be aware of this limitation.
Imprecision (risk of random error)
The Trial Sequential Analysis of serious adverse events confirmed that we had enough information to assess a 10% RRR at maximum follow‐up. Trial Sequential Analysis of all‐cause mortality, major cardiovascular events, cardiovascular mortality, and myocardial infarction showed that we did not have enough information to assess a 10% RRR at maximum follow‐up, resulting in a GRADE downgrade for imprecision for these outcomes.
GRADE
We have assessed the quality of the evidence for the results of each outcome using GRADE (summary of findings Table 1). The GRADE assessment generally showed the evidence to be of low to very low quality. Reasons for the GRADE assessment are given in the footnotes of the summary of findings Table 1.
Potential biases in the review process
Strengths
Our review has several strengths. We included trials regardless of language of publication and whether they reported data for the outcomes we had planned to assess. Where additional information was needed, we contacted all relevant authors. We included more participants than any previous systematic review, which gave us increased power and precision to detect any significant differences between the intervention and the control group. We followed our peer‐reviewed protocol, which was published before the literature search began (Feinberg 2016), and we conducted the review using the methods recommended by Cochrane and findings from additional methodological studies (Higgins 2011a). We also performed Trial Sequential Analyses and used an eight‐step procedure to assess if the thresholds for statistical and clinical significance were crossed (Jakobsen 2014), which adds further robustness to our results and conclusions. We also tested the robustness of our results with sensitivity analyses (best‐worst case and worst‐best case). Our meta‐analyses had little statistical heterogeneity, strengthening the validity of our results.
Limitations
Our systematic review has several limitations. Our findings, interpretations, and conclusions are affected by the quality and quantity of the included trials. The relatively short follow‐up might also make it harder to detect a difference; it may be that longer follow‐up would reveal such a difference.
Furthermore, by only including randomised clinical trials and ignoring harms assessed in quasi‐randomised studies and observational studies, we run the risk of focusing overly on potential benefits at the cost of overlooking late and rare harms.
Another, and likely often ignored, limitation is the fact that we have compared drug‐eluting stents versus bare‐metal stents without having solid proof that the latter intervention is significantly more beneficial from a statistical and clinical point of view than just balloon dilatation or no intervention at all (see Description of the intervention). Evidence points in this direction, but solid evidence based on systematic reviews with meta‐analysis and Trial Sequential Analysis taking risks of bias into consideration is lacking (Garattini 2016).
In our primary analyses, we included only one trial using a biodegradable drug‐eluting stent in the experimental group (COMFORTABLE 2012). Our subgroup assessing different types of drug‐eluting stents compared with bare‐metal stents found no differences between the experimental stents, but this may be due to a low number of included trials evaluating these types of stents. In the future, network meta‐analyses and individual participant data meta‐analysis may assess these types of stents (Garattini 2016; Skoog 2015).
We used observed data in the estimation of a required information size, which might lead to lack of consistency in stopping boundaries across analyses. The alternative would be to predefine diversity for each analysis the incidence in all of the control groups before data were known. This also has several limitations, that is how these were values estimated, and if they are erroneous then this will lead to erroneous results. We chose from a pragmatic perspective the observed data (Jakobsen 2014).
Composite outcome
To increase the statistical power, we chose to use two composite outcomes: major cardiovascular events and serious adverse events. A potential limitation when using composite outcomes is that each component of a composite outcome will not necessarily have similar degrees of severity, especially with serious adverse events, and this might bias the results of the outcome (Garattini 2016). For example, if certain more severe serious adverse events occur in one intervention group and other less severe serious adverse events occur in the other intervention group, then there is a risk of overlooking actual severity differences between the compared groups on this composite outcome (Garattini 2016).
In our review, the composite outcome serious adverse events was largely driven by target vessel revascularisation. The reason for performing target vessel revascularisation is typically based on clinical characteristics such as unstable angina or an angiographic indication. The angiographic indication could be problematic: it may be that there is an angiographic difference at follow‐up between participants receiving drug‐eluting stents and participants receiving bare‐metal stents, but that this angiographic difference does not necessarily translate into different clinical outcomes. For this reason we did not use the traditional outcome MACE (major adverse cardiac events). MACE usually consists of a composite of cardiac death, myocardial infarction, and either target vessel revascularisation or target lesion revascularisation, but may include other outcomes (Kip 2008). In recent years, two major reports have described and analysed several issues regarding the cardiac composite outcome MACE (Cutlip 2007; Kip 2008). The main issues regarding MACE concern the variability and lack of consistency in which outcomes are included in the composite outcome (Cutlip 2007; Kip 2008), which can lead to misleading conclusions. The main issue with MACE in this particular review was using target vessel revascularisation or target lesion revascularisation as a component of MACE. This was problematic for several reasons. Firstly, it is important to note that the decision of whether or not target vessel revascularisation will be performed is based on subjective opinion. As both treatment providers and participants in the included trials were not blinded to treatment allocation, target vessel revascularisation and target lesion revascularisation may introduce bias. Secondly, using a composite outcome consisting of safety outcomes (death and myocardial infarction) and outcomes presumed to be a measure of procedural effectiveness (target vessel revascularisation and target lesion revascularisation) could lead to erroneous conclusions (Kip 2008). We therefore decided not to use MACE as a composite outcome, and instead used a composite cardiovascular outcome consisting of cardiovascular mortality and myocardial infarction ('major cardiovascular events').
It must be noted that we found no evidence of a difference when assessing all‐cause mortality, cardiovascular mortality, and myocardial infarction, but the Trial Sequential Analysis showed that we did not have enough information to confirm or reject our anticipated intervention effects, so the lack of a shown difference on these clinical outcomes might be caused by lack of statistical power.
Another limitation when assessing serious adverse events is that the results on serious adverse events were not comprehensively reported in any of the included trials (Ioannidis 2009). The only serious adverse events reported were usually all‐cause mortality, cardiovascular mortality, myocardial infarction, and target vessel revascularisation.
Patient group
Our primary analyses assessed the effects of drug‐eluting stents versus bare‐metal stents for acute coronary syndrome. During our literature search we found 14 trials pooling participants with both ACS and stable angina (BASKET 2005a; BASKET 2005b; BASKET‐PROVE I 2010; BASKET‐PROVE II 2015; EAGLE 2006; Erglis 2007; FUTURE I 2004; FUTURE II 2004; Han 2007; Li 2004; NORSTENT 2016; PRODIGY 2014; SES‐SMART 2004; XIMA 2014; ZEUS 2015). The results were similar to our primary results except for the outcome major cardiovascular events (RR 0.72, 95% CI 0.60 to 0.85, I2 = 26%, 17,628 participants, 12 trials) and myocardial infarction (RR 0.57, 95% CI 0.41 to 0.79, I2 = 58%, 17,628 participants, 12 trials).
Agreements and disagreements with other studies or reviews
A 2010 Cochrane review compared drug‐eluting stents versus bare‐metal stents in participants with both ACS and stable ischaemic heart disease (Greenhalgh 2010). They found no significant difference on all‐cause mortality, incidence of acute myocardial infarction, or thrombosis. However, the review showed indications of beneficial effects of drug‐eluting stents compared with bare‐metal stents on target lesion revascularisation, target vessel revascularisation, and a composite outcome of cardiac events. They did not perform Trial Sequential Analysis or another method to assess the risk of random error, neither did they assess the strength of evidence for the alternative hypothesis (Jakobsen 2014).
We identified three previous reviews assessing the effects of drug‐eluting stents versus bare‐metal stents in STEMI participants. All three reviews confirmed our results showing that there is no difference between drug‐eluting stents and bare‐metal stents on all‐cause mortality.
De Luca 2012 found no difference in terms of mortality at 440 days of follow‐up (hazard ratio (HR) 0.85, 95% CI 0.70 to 1.04, P = 0.11). No difference in stent thrombosis was also observed. A significant reduction in target vessel revascularisation was found (HR 0.57, 95% CI 0.50 to 0.66, P = 0.001). They did not perform Trial Sequential Analysis or other method to assess the risk of random error, neither did they assess the strength of evidence for the alternative hypothesis (Jakobsen 2014).
Suh 2011 included 14 trials and found no evidence of an effect on mortality (RR 0.88, 95% CI 0.70 to 1.10, P = 0.26). Suh 2011 found evidence of an effect on myocardial infarction (RR 0.77, 95% CI 0.77 to 0.97, P = 0.03), but did not perform Trial Sequential Analysis or other method to assess the risk of random error, nor did they assess the strength of evidence for the alternative hypothesis (Jakobsen 2014).
Zheng 2014 found no difference in terms of mortality in a meta‐analysis of four trials all with a minimum follow‐up of four years (odds ratio (OR) 0.85, 95% CI 0.59 to 1.20, P = 0.35) or stent thrombosis (OR 3.03, 95% CI 1.28 to 7.18, P = 0.01). Additionally, Zheng 2014 also found a reduction in target vessel revascularisation (OR 0.55, 95% CI 0.55 to 0.77). They did not perform Trial Sequential Analysis or other method to assess the risk of random error, neither did they assess the strength of evidence for the alternative hypothesis (Jakobsen 2014).

study flow diagram.

Risk of bias graph: review authors' judgements about each risk of bias item presented as percentages across all included studies.

Risk of bias summary: review authors' judgements about each risk of bias item for each included study.

Trial Sequential Analysis of drug‐eluting stents versus bare‐metal stents on all‐cause mortality at maximum follow‐up in 21 trials. The diversity‐adjusted required information size (RIS) was calculated based on mortality in the control group of 7.76%; risk ratio reduction (RRR) of 10% in the experimental group; type I error of 2.0%; and type II error of 20% (80% power). No diversity was noted. The diversity‐adjusted required information size was 45,046 participants. The cumulative Z‐curve (blue line) did not cross the trial sequential monitoring boundaries for benefit or harm (red inward‐sloping lines). The cumulative Z‐curve did not cross the inner‐wedge futility line (the inner‐wedge futility could not be calculated due to too little information). Additionally, the cumulative Z‐score did not cross the RIS. The green dotted line shows conventional boundaries (2.0%).

Trial Sequential Analysis of drug‐eluting stents versus bare‐metal stents on serious adverse events at maximum follow‐up in 22 trials. The diversity‐adjusted required information size (RIS) was calculated based on a rate of serious adverse events in the control group of 22.95%; risk ratio reduction (RRR) of 10% in the experimental group; type I error of 2.0%; and type II error of 20% (80% power). No diversity was noted. The diversity‐adjusted required information size was 24,853 participants. The cumulative Z‐curve (blue line) crossed the trial sequential monitoring boundaries for benefit. The green dotted line shows conventional boundaries (2.0%).

Trial Sequential Analysis of drug‐eluting stents versus bare‐metal stents on target vessel revascularisation at maximum follow‐up in 22 trials. The diversity‐adjusted required information size (RIS) was calculated based on a rate of target vessel revascularisations in the control group of 13.28%; risk ratio reduction (RRR) of 30% in the experimental group; type I error of 3.33%; and type II error of 20% (80% power). No diversity was noted. The diversity‐adjusted required information size was 5361 participants. The cumulative Z‐curve (blue line) crossed the trial sequential monitoring boundaries for benefit. The green dotted line shows conventional boundaries (3.33%).

Comparison 1: Drug‐eluting stents versus bare‐metal stents for acute coronary syndrome at maximum follow‐up, Outcome 1: All‐cause mortality

Comparison 1: Drug‐eluting stents versus bare‐metal stents for acute coronary syndrome at maximum follow‐up, Outcome 2: All‐cause mortality best‐worst

Comparison 1: Drug‐eluting stents versus bare‐metal stents for acute coronary syndrome at maximum follow‐up, Outcome 3: All‐cause mortality worst‐best

Comparison 1: Drug‐eluting stents versus bare‐metal stents for acute coronary syndrome at maximum follow‐up, Outcome 4: All‐cause mortality according to type of drug‐eluting stent

Comparison 1: Drug‐eluting stents versus bare‐metal stents for acute coronary syndrome at maximum follow‐up, Outcome 5: All‐cause mortality according to type of ACS

Comparison 1: Drug‐eluting stents versus bare‐metal stents for acute coronary syndrome at maximum follow‐up, Outcome 6: All‐cause mortality according to length of maximum follow‐up

Comparison 1: Drug‐eluting stents versus bare‐metal stents for acute coronary syndrome at maximum follow‐up, Outcome 7: All‐cause mortality according to registration status

Comparison 1: Drug‐eluting stents versus bare‐metal stents for acute coronary syndrome at maximum follow‐up, Outcome 8: Serious adverse events

Comparison 1: Drug‐eluting stents versus bare‐metal stents for acute coronary syndrome at maximum follow‐up, Outcome 9: Serious adverse events best‐worst

Comparison 1: Drug‐eluting stents versus bare‐metal stents for acute coronary syndrome at maximum follow‐up, Outcome 10: Serious adverse events worst‐best

Comparison 1: Drug‐eluting stents versus bare‐metal stents for acute coronary syndrome at maximum follow‐up, Outcome 11: Serious adverse events according to type of drug‐eluting stent

Comparison 1: Drug‐eluting stents versus bare‐metal stents for acute coronary syndrome at maximum follow‐up, Outcome 12: Serious adverse events according to type of ACS

Comparison 1: Drug‐eluting stents versus bare‐metal stents for acute coronary syndrome at maximum follow‐up, Outcome 13: Serious adverse events according to length of maximum follow‐up

Comparison 1: Drug‐eluting stents versus bare‐metal stents for acute coronary syndrome at maximum follow‐up, Outcome 14: Serious adverse events according to registration status

Comparison 1: Drug‐eluting stents versus bare‐metal stents for acute coronary syndrome at maximum follow‐up, Outcome 15: Major cardiovascular events

Comparison 1: Drug‐eluting stents versus bare‐metal stents for acute coronary syndrome at maximum follow‐up, Outcome 16: Major cardiovascular events best‐worst

Comparison 1: Drug‐eluting stents versus bare‐metal stents for acute coronary syndrome at maximum follow‐up, Outcome 17: Major cardiovascular events worst‐best

Comparison 1: Drug‐eluting stents versus bare‐metal stents for acute coronary syndrome at maximum follow‐up, Outcome 18: Major cardiovascular events according to type of drug‐eluting stent

Comparison 1: Drug‐eluting stents versus bare‐metal stents for acute coronary syndrome at maximum follow‐up, Outcome 19: Major cardiovascular events according to type of ACS

Comparison 1: Drug‐eluting stents versus bare‐metal stents for acute coronary syndrome at maximum follow‐up, Outcome 20: Major cardiovascular events according to length of maximum follow‐up

Comparison 1: Drug‐eluting stents versus bare‐metal stents for acute coronary syndrome at maximum follow‐up, Outcome 21: Major cardiovascular events according to registration status

Comparison 1: Drug‐eluting stents versus bare‐metal stents for acute coronary syndrome at maximum follow‐up, Outcome 22: Cardiovascular mortality

Comparison 1: Drug‐eluting stents versus bare‐metal stents for acute coronary syndrome at maximum follow‐up, Outcome 23: Cardiovascular mortality best‐worst

Comparison 1: Drug‐eluting stents versus bare‐metal stents for acute coronary syndrome at maximum follow‐up, Outcome 24: Cardiovascular mortality worst‐best

Comparison 1: Drug‐eluting stents versus bare‐metal stents for acute coronary syndrome at maximum follow‐up, Outcome 25: Cardiovascular mortality according to type of drug‐eluting stent

Comparison 1: Drug‐eluting stents versus bare‐metal stents for acute coronary syndrome at maximum follow‐up, Outcome 26: Cardiovascular mortality according to type of ACS

Comparison 1: Drug‐eluting stents versus bare‐metal stents for acute coronary syndrome at maximum follow‐up, Outcome 27: Cardiovascular mortality according to length of maximum follow‐up

Comparison 1: Drug‐eluting stents versus bare‐metal stents for acute coronary syndrome at maximum follow‐up, Outcome 28: Cardiovascular mortality according to registration status

Comparison 1: Drug‐eluting stents versus bare‐metal stents for acute coronary syndrome at maximum follow‐up, Outcome 29: Myocardial infarction

Comparison 1: Drug‐eluting stents versus bare‐metal stents for acute coronary syndrome at maximum follow‐up, Outcome 30: Myocardial infarction best‐worst

Comparison 1: Drug‐eluting stents versus bare‐metal stents for acute coronary syndrome at maximum follow‐up, Outcome 31: Myocardial infarction worst‐best

Comparison 1: Drug‐eluting stents versus bare‐metal stents for acute coronary syndrome at maximum follow‐up, Outcome 32: Myocardial infarction according to type of drug‐eluting stent

Comparison 1: Drug‐eluting stents versus bare‐metal stents for acute coronary syndrome at maximum follow‐up, Outcome 33: Myocardial infarction according to type of ACS

Comparison 1: Drug‐eluting stents versus bare‐metal stents for acute coronary syndrome at maximum follow‐up, Outcome 34: Myocardial infarction according to length of maximum follow‐up

Comparison 1: Drug‐eluting stents versus bare‐metal stents for acute coronary syndrome at maximum follow‐up, Outcome 35: Myocardial infarction according to registration status

Comparison 1: Drug‐eluting stents versus bare‐metal stents for acute coronary syndrome at maximum follow‐up, Outcome 36: Stent thrombosis

Comparison 1: Drug‐eluting stents versus bare‐metal stents for acute coronary syndrome at maximum follow‐up, Outcome 37: Stent thrombosis best‐worst

Comparison 1: Drug‐eluting stents versus bare‐metal stents for acute coronary syndrome at maximum follow‐up, Outcome 38: Stent thrombosis worst‐best

Comparison 1: Drug‐eluting stents versus bare‐metal stents for acute coronary syndrome at maximum follow‐up, Outcome 39: Stent thrombosis according to type of drug‐eluting stent

Comparison 1: Drug‐eluting stents versus bare‐metal stents for acute coronary syndrome at maximum follow‐up, Outcome 40: Stent thrombosis according to type of ACS

Comparison 1: Drug‐eluting stents versus bare‐metal stents for acute coronary syndrome at maximum follow‐up, Outcome 41: Stent thrombosis according to length of maximum follow‐up

Comparison 1: Drug‐eluting stents versus bare‐metal stents for acute coronary syndrome at maximum follow‐up, Outcome 42: Stent thrombosis according to registration status

Comparison 1: Drug‐eluting stents versus bare‐metal stents for acute coronary syndrome at maximum follow‐up, Outcome 43: Target vessel revascularisation

Comparison 1: Drug‐eluting stents versus bare‐metal stents for acute coronary syndrome at maximum follow‐up, Outcome 44: Target vessel revascularisation best‐worst

Comparison 1: Drug‐eluting stents versus bare‐metal stents for acute coronary syndrome at maximum follow‐up, Outcome 45: Target vessel revascularisation worst‐best

Comparison 1: Drug‐eluting stents versus bare‐metal stents for acute coronary syndrome at maximum follow‐up, Outcome 46: Target vessel revascularisation according to type of drug‐eluting stent

Comparison 1: Drug‐eluting stents versus bare‐metal stents for acute coronary syndrome at maximum follow‐up, Outcome 47: Target vessel revascularisation according to type of ACS

Comparison 1: Drug‐eluting stents versus bare‐metal stents for acute coronary syndrome at maximum follow‐up, Outcome 48: Target vessel revascularisation according to length of maximum follow‐up

Comparison 1: Drug‐eluting stents versus bare‐metal stents for acute coronary syndrome at maximum follow‐up, Outcome 49: Target vessel revascularisation according to registration status

Comparison 2: Drug‐eluting stents versus bare‐metal stents for acute coronary syndrome at one month, Outcome 1: All‐cause mortality

Comparison 2: Drug‐eluting stents versus bare‐metal stents for acute coronary syndrome at one month, Outcome 2: All‐cause mortality best‐worst

Comparison 2: Drug‐eluting stents versus bare‐metal stents for acute coronary syndrome at one month, Outcome 3: All‐cause mortality worst‐best

Comparison 2: Drug‐eluting stents versus bare‐metal stents for acute coronary syndrome at one month, Outcome 4: All‐cause mortality according to type of drug‐eluting stent

Comparison 2: Drug‐eluting stents versus bare‐metal stents for acute coronary syndrome at one month, Outcome 5: All‐cause mortality according to type of ACS

Comparison 2: Drug‐eluting stents versus bare‐metal stents for acute coronary syndrome at one month, Outcome 6: All‐cause mortality according to registration status

Comparison 2: Drug‐eluting stents versus bare‐metal stents for acute coronary syndrome at one month, Outcome 7: Serious adverse events

Comparison 2: Drug‐eluting stents versus bare‐metal stents for acute coronary syndrome at one month, Outcome 8: Serious adverse events best‐worst

Comparison 2: Drug‐eluting stents versus bare‐metal stents for acute coronary syndrome at one month, Outcome 9: Serious adverse events worst‐best

Comparison 2: Drug‐eluting stents versus bare‐metal stents for acute coronary syndrome at one month, Outcome 10: Serious adverse events according to type of drug‐eluting stent

Comparison 2: Drug‐eluting stents versus bare‐metal stents for acute coronary syndrome at one month, Outcome 11: Serious adverse events according to type of ACS

Comparison 2: Drug‐eluting stents versus bare‐metal stents for acute coronary syndrome at one month, Outcome 12: Serious adverse events according to registration status

Comparison 2: Drug‐eluting stents versus bare‐metal stents for acute coronary syndrome at one month, Outcome 13: Major cardiovascular events

Comparison 2: Drug‐eluting stents versus bare‐metal stents for acute coronary syndrome at one month, Outcome 14: Major cardiovascular events best‐worst

Comparison 2: Drug‐eluting stents versus bare‐metal stents for acute coronary syndrome at one month, Outcome 15: Major cardiovascular events worst‐best

Comparison 2: Drug‐eluting stents versus bare‐metal stents for acute coronary syndrome at one month, Outcome 16: Major cardiovascular events according to type of drug‐eluting stent

Comparison 2: Drug‐eluting stents versus bare‐metal stents for acute coronary syndrome at one month, Outcome 17: Major cardiovascular events according to type of ACS

Comparison 2: Drug‐eluting stents versus bare‐metal stents for acute coronary syndrome at one month, Outcome 18: Major cardiovascular events according to registration status

Comparison 2: Drug‐eluting stents versus bare‐metal stents for acute coronary syndrome at one month, Outcome 19: Cardiovascular mortality

Comparison 2: Drug‐eluting stents versus bare‐metal stents for acute coronary syndrome at one month, Outcome 20: Cardiovascular mortality best‐worst

Comparison 2: Drug‐eluting stents versus bare‐metal stents for acute coronary syndrome at one month, Outcome 21: Cardiovascular mortality worst‐best

Comparison 2: Drug‐eluting stents versus bare‐metal stents for acute coronary syndrome at one month, Outcome 22: Cardiovascular mortality according to type of drug‐eluting stent

Comparison 2: Drug‐eluting stents versus bare‐metal stents for acute coronary syndrome at one month, Outcome 23: Cardiovascular mortality according to type of ACS

Comparison 2: Drug‐eluting stents versus bare‐metal stents for acute coronary syndrome at one month, Outcome 24: Cardiovascular mortality according to registration status

Comparison 2: Drug‐eluting stents versus bare‐metal stents for acute coronary syndrome at one month, Outcome 25: Myocardial infarction

Comparison 2: Drug‐eluting stents versus bare‐metal stents for acute coronary syndrome at one month, Outcome 26: Myocardial infarction best‐worst

Comparison 2: Drug‐eluting stents versus bare‐metal stents for acute coronary syndrome at one month, Outcome 27: Myocardial infarction worst‐best

Comparison 2: Drug‐eluting stents versus bare‐metal stents for acute coronary syndrome at one month, Outcome 28: Myocardial infarction according to type of drug‐eluting stent

Comparison 2: Drug‐eluting stents versus bare‐metal stents for acute coronary syndrome at one month, Outcome 29: Myocardial infarction according to type of ACS

Comparison 2: Drug‐eluting stents versus bare‐metal stents for acute coronary syndrome at one month, Outcome 30: Myocardial infarction according to registration status

Comparison 2: Drug‐eluting stents versus bare‐metal stents for acute coronary syndrome at one month, Outcome 31: Stent thrombosis

Comparison 2: Drug‐eluting stents versus bare‐metal stents for acute coronary syndrome at one month, Outcome 32: Stent thrombosis best‐worst

Comparison 2: Drug‐eluting stents versus bare‐metal stents for acute coronary syndrome at one month, Outcome 33: Stent thrombosis worst‐best

Comparison 2: Drug‐eluting stents versus bare‐metal stents for acute coronary syndrome at one month, Outcome 34: Stent thrombosis according to type of drug‐eluting stent

Comparison 2: Drug‐eluting stents versus bare‐metal stents for acute coronary syndrome at one month, Outcome 35: Stent thrombosis according to type of ACS

Comparison 2: Drug‐eluting stents versus bare‐metal stents for acute coronary syndrome at one month, Outcome 36: Stent thrombosis according to registration status

Comparison 2: Drug‐eluting stents versus bare‐metal stents for acute coronary syndrome at one month, Outcome 37: Target vessel revascularisation

Comparison 2: Drug‐eluting stents versus bare‐metal stents for acute coronary syndrome at one month, Outcome 38: Target vessel revascularisation best‐worst

Comparison 2: Drug‐eluting stents versus bare‐metal stents for acute coronary syndrome at one month, Outcome 39: Target vessel revascularisation worst‐best

Comparison 2: Drug‐eluting stents versus bare‐metal stents for acute coronary syndrome at one month, Outcome 40: Target vessel revascularisation according to type of drug‐eluting stent

Comparison 2: Drug‐eluting stents versus bare‐metal stents for acute coronary syndrome at one month, Outcome 41: Target vessel revascularisation according to type of ACS

Comparison 2: Drug‐eluting stents versus bare‐metal stents for acute coronary syndrome at one month, Outcome 42: Target vessel revascularisation according to registration status
| Drug‐eluting stents compared to bare‐metal stents for acute coronary syndrome | ||||||
| Patient or population: People with acute coronary syndrome | ||||||
| Outcomes | Anticipated absolute effects* (95% CI) | Relative effect | № of participants | Quality of the evidence | Comments | |
|---|---|---|---|---|---|---|
| Risk with bare‐metal stents | Risk with drug‐eluting stents | |||||
| All‐cause mortality at maximum follow‐up | Study population | RR 0.90 | 11,250 | ⊕⊕⊝⊝ | Trial Sequential Analysis for a RRR of 10% showed that neither the boundary for futility, benefit or harm was breached, hence the risk of imprecision of the outcome result is high. Multiple eligible treatments were used in 1 trial, generating a further comparison (21 trials reporting on 22 experimental groups). | |
| 78 per 1000 | 70 per 1000 | |||||
| Serious adverse events at maximum follow‐up | Study population | RR 0.80 | 11,724 | ⊕⊕⊝⊝ | Trial Sequential Analysis for a RRR of 10% showed that the boundary for benefit was breached, hence the risk of imprecision of the outcome result is low. Multiple eligible treatments were used in 1 trial, generating a further comparison (22 trials reporting on 23 experimental groups). | |
| 230 per 1000 | 184 per 1000 | |||||
| Major cardiovascular events at maximum Follow‐up: median 12 months | Study population | RR 0.96 | 10,939 | ⊕⊝⊝⊝ | Trial Sequential Analysis for a RRR of 10% showed that neither the boundary for futility, benefit or harm was breached, hence the risk of imprecision of the outcome result is high. Multiple eligible treatments were used in 1 trial, generating a further comparison (19 trials reporting on 20 experimental groups). | |
| 66 per 1000 | 63 per 1000 | |||||
| Quality of life at maximum follow‐up ‐ not reported | ‐ | ‐ | ‐ | ‐ | ‐ | |
| Cardiovascular mortality at maximum follow‐up | Study population | RR 0.91 | 9248 | ⊕⊝⊝⊝ | Trial Sequential Analysis for a RRR of 10% showed that neither the boundary for futility, benefit or harm was breached, hence the risk of imprecision of the outcome result is high. Multiple eligible treatments were used in 1 trial, generating a further comparison (14 trials reporting on 15 experimental groups). | |
| 58 per 1000 | 53 per 1000 | |||||
| Myocardial infarction at maximum follow‐up | Study population | RR 0.98 | 10,217 | ⊕⊝⊝⊝ | Trial Sequential Analysis for a RRR of 10% showed that neither the boundary for futility, benefit or harm was breached, hence the risk of imprecision of the outcome result is high. Multiple eligible treatments were used in 1 trial, generating a further comparison (18 trials reporting on 19 experimental groups). | |
| 48 per 1000 | 47 per 1000 | |||||
| Angina at maximum follow‐up ‐ not reported | ‐ | ‐ | ‐ | ‐ | ‐ | |
| *The risk in the intervention group (and its 95% confidence interval) is based on the assumed risk in the comparison group and the relative effect of the intervention (and its 95% CI). | ||||||
| GRADE Working Group grades of evidence | ||||||
| 1Downgraded one level for serious risk of imprecision due to our required information size not being met. | ||||||
| Outcome or subgroup title | No. of studies | No. of participants | Statistical method | Effect size |
| 1.1 All‐cause mortality Show forest plot | 22 | 11250 | Risk Ratio (M‐H, Random, 95% CI) | 0.90 [0.78, 1.03] |
| 1.2 All‐cause mortality best‐worst Show forest plot | 22 | 11775 | Risk Ratio (M‐H, Random, 95% CI) | 0.60 [0.44, 0.80] |
| 1.3 All‐cause mortality worst‐best Show forest plot | 22 | 11775 | Risk Ratio (M‐H, Random, 95% CI) | 1.27 [0.99, 1.64] |
| 1.4 All‐cause mortality according to type of drug‐eluting stent Show forest plot | 22 | 11250 | Risk Ratio (M‐H, Random, 95% CI) | 0.90 [0.78, 1.03] |
| 1.4.1 Biodegradable (Biolimus) | 1 | 1157 | Risk Ratio (M‐H, Random, 95% CI) | 0.89 [0.54, 1.45] |
| 1.4.2 Everolimus | 1 | 1458 | Risk Ratio (M‐H, Random, 95% CI) | 0.73 [0.54, 1.00] |
| 1.4.3 Paclitaxel | 8 | 4468 | Risk Ratio (M‐H, Random, 95% CI) | 0.89 [0.71, 1.12] |
| 1.4.4 Sirolimus | 9 | 3113 | Risk Ratio (M‐H, Random, 95% CI) | 0.89 [0.68, 1.16] |
| 1.4.5 Zotarolimus | 1 | 44 | Risk Ratio (M‐H, Random, 95% CI) | Not estimable |
| 1.4.6 Mixed | 1 | 626 | Risk Ratio (M‐H, Random, 95% CI) | 1.34 [0.91, 1.98] |
| 1.4.7 Unclear | 1 | 384 | Risk Ratio (M‐H, Random, 95% CI) | 0.43 [0.02, 7.39] |
| 1.5 All‐cause mortality according to type of ACS Show forest plot | 22 | 11250 | Risk Ratio (M‐H, Random, 95% CI) | 0.90 [0.78, 1.03] |
| 1.5.1 STEMI | 21 | 11171 | Risk Ratio (M‐H, Random, 95% CI) | 0.90 [0.78, 1.03] |
| 1.5.2 Acute coronary syndrome | 1 | 79 | Risk Ratio (M‐H, Random, 95% CI) | Not estimable |
| 1.6 All‐cause mortality according to length of maximum follow‐up Show forest plot | 22 | 11250 | Risk Ratio (M‐H, Random, 95% CI) | 0.90 [0.78, 1.03] |
| 1.6.1 Less or equal to 6 months | 4 | 726 | Risk Ratio (M‐H, Random, 95% CI) | 0.85 [0.29, 2.53] |
| 1.6.2 Between 6 and 12 months | 6 | 1315 | Risk Ratio (M‐H, Random, 95% CI) | 0.81 [0.54, 1.21] |
| 1.6.3 Between 1 and 3 years | 3 | 703 | Risk Ratio (M‐H, Random, 95% CI) | 0.99 [0.55, 1.76] |
| 1.6.4 More or equal to 3 years | 8 | 8490 | Risk Ratio (M‐H, Random, 95% CI) | 0.90 [0.77, 1.05] |
| 1.6.5 Unclear | 1 | 16 | Risk Ratio (M‐H, Random, 95% CI) | Not estimable |
| 1.7 All‐cause mortality according to registration status Show forest plot | 22 | 11250 | Risk Ratio (M‐H, Random, 95% CI) | 0.90 [0.78, 1.03] |
| 1.7.1 Pre‐registration | 3 | 1301 | Risk Ratio (M‐H, Random, 95% CI) | 0.85 [0.52, 1.39] |
| 1.7.2 Post‐registration | 13 | 9028 | Risk Ratio (M‐H, Random, 95% CI) | 0.89 [0.77, 1.03] |
| 1.7.3 No registration | 6 | 921 | Risk Ratio (M‐H, Random, 95% CI) | 1.09 [0.54, 2.20] |
| 1.8 Serious adverse events Show forest plot | 23 | 11724 | Risk Ratio (M‐H, Fixed, 95% CI) | 0.80 [0.74, 0.86] |
| 1.9 Serious adverse events best‐worst Show forest plot | 23 | 12249 | Risk Ratio (M‐H, Fixed, 95% CI) | 0.67 [0.62, 0.71] |
| 1.10 Serious adverse events worst‐best Show forest plot | 23 | 12249 | Risk Ratio (M‐H, Fixed, 95% CI) | 0.98 [0.91, 1.05] |
| 1.11 Serious adverse events according to type of drug‐eluting stent Show forest plot | 23 | 11724 | Risk Ratio (M‐H, Fixed, 95% CI) | 0.80 [0.74, 0.86] |
| 1.11.1 Biodegradable (Biolimus) | 1 | 1157 | Risk Ratio (M‐H, Fixed, 95% CI) | 0.75 [0.58, 0.98] |
| 1.11.2 Everolimus | 2 | 1932 | Risk Ratio (M‐H, Fixed, 95% CI) | 0.82 [0.69, 0.97] |
| 1.11.3 Paclitaxel | 8 | 4468 | Risk Ratio (M‐H, Fixed, 95% CI) | 0.86 [0.76, 0.96] |
| 1.11.4 Sirolimus | 9 | 3113 | Risk Ratio (M‐H, Fixed, 95% CI) | 0.74 [0.64, 0.84] |
| 1.11.5 Zotarolimus | 1 | 44 | Risk Ratio (M‐H, Fixed, 95% CI) | 1.33 [0.17, 10.70] |
| 1.11.6 Mixed | 1 | 626 | Risk Ratio (M‐H, Fixed, 95% CI) | 0.74 [0.54, 1.01] |
| 1.11.7 Unclear | 1 | 384 | Risk Ratio (M‐H, Fixed, 95% CI) | 0.93 [0.52, 1.69] |
| 1.12 Serious adverse events according to type of ACS Show forest plot | 23 | 11724 | Risk Ratio (M‐H, Fixed, 95% CI) | 0.80 [0.74, 0.86] |
| 1.12.1 STEMI | 21 | 11171 | Risk Ratio (M‐H, Fixed, 95% CI) | 0.80 [0.75, 0.86] |
| 1.12.2 Acute coronary syndrome | 1 | 79 | Risk Ratio (M‐H, Fixed, 95% CI) | 0.58 [0.29, 1.15] |
| 1.12.3 NSTEMI | 1 | 474 | Risk Ratio (M‐H, Fixed, 95% CI) | 0.78 [0.50, 1.23] |
| 1.13 Serious adverse events according to length of maximum follow‐up Show forest plot | 23 | 11724 | Risk Ratio (M‐H, Fixed, 95% CI) | 0.80 [0.74, 0.86] |
| 1.13.1 Less or equal to 6 months | 4 | 726 | Risk Ratio (M‐H, Fixed, 95% CI) | 0.67 [0.45, 0.99] |
| 1.13.2 Between 6 and 12 months | 7 | 1748 | Risk Ratio (M‐H, Fixed, 95% CI) | 0.85 [0.69, 1.05] |
| 1.13.3 Between 1 and 3 years | 3 | 744 | Risk Ratio (M‐H, Fixed, 95% CI) | 0.64 [0.47, 0.88] |
| 1.13.4 More or equal to 3 years | 8 | 8490 | Risk Ratio (M‐H, Fixed, 95% CI) | 0.81 [0.75, 0.88] |
| 1.13.5 Unclear | 1 | 16 | Risk Ratio (M‐H, Fixed, 95% CI) | Not estimable |
| 1.14 Serious adverse events according to registration status Show forest plot | 23 | 11724 | Risk Ratio (M‐H, Fixed, 95% CI) | 0.80 [0.74, 0.86] |
| 1.14.1 Pre‐registration | 3 | 1301 | Risk Ratio (M‐H, Fixed, 95% CI) | 0.71 [0.55, 0.91] |
| 1.14.2 Post‐registration | 14 | 9502 | Risk Ratio (M‐H, Fixed, 95% CI) | 0.81 [0.75, 0.87] |
| 1.14.3 No registration | 6 | 921 | Risk Ratio (M‐H, Fixed, 95% CI) | 0.83 [0.57, 1.20] |
| 1.15 Major cardiovascular events Show forest plot | 20 | 10939 | Risk Ratio (M‐H, Random, 95% CI) | 0.96 [0.83, 1.11] |
| 1.16 Major cardiovascular events best‐worst Show forest plot | 20 | 11596 | Risk Ratio (M‐H, Random, 95% CI) | 0.53 [0.39, 0.72] |
| 1.17 Major cardiovascular events worst‐best Show forest plot | 20 | 11596 | Risk Ratio (M‐H, Random, 95% CI) | 1.40 [0.97, 2.00] |
| 1.18 Major cardiovascular events according to type of drug‐eluting stent Show forest plot | 20 | 10939 | Risk Ratio (M‐H, Random, 95% CI) | 0.96 [0.83, 1.11] |
| 1.18.1 Biodegradable (Biolimus) | 1 | 1104 | Risk Ratio (M‐H, Random, 95% CI) | 0.90 [0.54, 1.49] |
| 1.18.2 Everolimus | 1 | 1458 | Risk Ratio (M‐H, Random, 95% CI) | 0.85 [0.58, 1.24] |
| 1.18.3 Paclitaxel | 7 | 4305 | Risk Ratio (M‐H, Random, 95% CI) | 1.01 [0.81, 1.26] |
| 1.18.4 Sirolimus | 8 | 3018 | Risk Ratio (M‐H, Random, 95% CI) | 0.89 [0.64, 1.24] |
| 1.18.5 Zotarolimus | 1 | 44 | Risk Ratio (M‐H, Random, 95% CI) | Not estimable |
| 1.18.6 Mixed | 1 | 626 | Risk Ratio (M‐H, Random, 95% CI) | 1.04 [0.60, 1.81] |
| 1.18.7 Unclear | 1 | 384 | Risk Ratio (M‐H, Random, 95% CI) | 1.36 [0.54, 3.40] |
| 1.19 Major cardiovascular events according to type of ACS Show forest plot | 20 | 10939 | Risk Ratio (M‐H, Random, 95% CI) | 0.96 [0.83, 1.11] |
| 1.19.1 STEMI | 19 | 10860 | Risk Ratio (M‐H, Random, 95% CI) | 0.96 [0.83, 1.12] |
| 1.19.2 Acute coronary syndrome | 1 | 79 | Risk Ratio (M‐H, Random, 95% CI) | 0.68 [0.12, 3.87] |
| 1.20 Major cardiovascular events according to length of maximum follow‐up Show forest plot | 20 | 10939 | Risk Ratio (M‐H, Random, 95% CI) | 0.96 [0.83, 1.11] |
| 1.20.1 Less or equal to 6 months | 3 | 563 | Risk Ratio (M‐H, Random, 95% CI) | 1.04 [0.48, 2.28] |
| 1.20.2 Between 1 and 3 years | 9 | 2018 | Risk Ratio (M‐H, Random, 95% CI) | 0.89 [0.69, 1.16] |
| 1.20.3 More or equal to 3 years | 8 | 8358 | Risk Ratio (M‐H, Random, 95% CI) | 0.99 [0.82, 1.19] |
| 1.21 Major cardiovascular events according to registration status Show forest plot | 20 | 10939 | Risk Ratio (M‐H, Random, 95% CI) | 0.96 [0.83, 1.11] |
| 1.21.1 Pre‐registration | 3 | 1248 | Risk Ratio (M‐H, Random, 95% CI) | 0.86 [0.52, 1.42] |
| 1.21.2 Post‐registration | 13 | 8949 | Risk Ratio (M‐H, Random, 95% CI) | 0.97 [0.83, 1.14] |
| 1.21.3 No registration | 4 | 742 | Risk Ratio (M‐H, Random, 95% CI) | 0.95 [0.47, 1.93] |
| 1.22 Cardiovascular mortality Show forest plot | 15 | 9248 | Risk Ratio (M‐H, Random, 95% CI) | 0.91 [0.76, 1.09] |
| 1.23 Cardiovascular mortality best‐worst Show forest plot | 15 | 9742 | Risk Ratio (M‐H, Random, 95% CI) | 0.50 [0.32, 0.77] |
| 1.24 Cardiovascular mortality worst‐best Show forest plot | 15 | 9742 | Risk Ratio (M‐H, Random, 95% CI) | 1.49 [1.06, 2.11] |
| 1.25 Cardiovascular mortality according to type of drug‐eluting stent Show forest plot | 15 | 9248 | Risk Ratio (M‐H, Random, 95% CI) | 0.91 [0.76, 1.09] |
| 1.25.1 Biodegradable (Biolimus) | 1 | 1104 | Risk Ratio (M‐H, Random, 95% CI) | 0.90 [0.54, 1.49] |
| 1.25.2 Everolimus | 1 | 1458 | Risk Ratio (M‐H, Random, 95% CI) | 0.85 [0.58, 1.24] |
| 1.25.3 Paclitaxel | 6 | 4141 | Risk Ratio (M‐H, Random, 95% CI) | 0.86 [0.65, 1.13] |
| 1.25.4 Sirolimus | 5 | 1875 | Risk Ratio (M‐H, Random, 95% CI) | 0.81 [0.52, 1.25] |
| 1.25.5 Zotarolimus | 1 | 44 | Risk Ratio (M‐H, Random, 95% CI) | Not estimable |
| 1.25.6 Mixed | 1 | 626 | Risk Ratio (M‐H, Random, 95% CI) | 2.40 [1.17, 4.93] |
| 1.26 Cardiovascular mortality according to type of ACS Show forest plot | 15 | 9248 | Risk Ratio (M‐H, Random, 95% CI) | 0.91 [0.76, 1.09] |
| 1.26.1 STEMI | 15 | 9248 | Risk Ratio (M‐H, Random, 95% CI) | 0.91 [0.76, 1.09] |
| 1.26.2 Acute coronary syndrome | 0 | 0 | Risk Ratio (M‐H, Random, 95% CI) | Not estimable |
| 1.27 Cardiovascular mortality according to length of maximum follow‐up Show forest plot | 15 | 9248 | Risk Ratio (M‐H, Random, 95% CI) | 0.91 [0.76, 1.09] |
| 1.27.1 Less or equal to 6 months | 1 | 100 | Risk Ratio (M‐H, Random, 95% CI) | 0.21 [0.01, 4.23] |
| 1.27.2 Between 6 and 12 months | 6 | 1584 | Risk Ratio (M‐H, Random, 95% CI) | 0.94 [0.65, 1.35] |
| 1.27.3 Between 1 and 3 years | 2 | 270 | Risk Ratio (M‐H, Random, 95% CI) | 0.56 [0.23, 1.32] |
| 1.27.4 More or equal to 3 years | 6 | 7294 | Risk Ratio (M‐H, Random, 95% CI) | 0.95 [0.72, 1.27] |
| 1.28 Cardiovascular mortality according to registration status Show forest plot | 15 | 9248 | Risk Ratio (M‐H, Random, 95% CI) | 0.91 [0.76, 1.09] |
| 1.28.1 Pre‐registration | 3 | 1248 | Risk Ratio (M‐H, Random, 95% CI) | 0.86 [0.52, 1.42] |
| 1.28.2 Post‐registration | 10 | 7806 | Risk Ratio (M‐H, Random, 95% CI) | 0.93 [0.73, 1.18] |
| 1.28.3 No registration | 2 | 194 | Risk Ratio (M‐H, Random, 95% CI) | 0.71 [0.16, 3.16] |
| 1.29 Myocardial infarction Show forest plot | 19 | 10217 | Risk Ratio (M‐H, Random, 95% CI) | 0.98 [0.82, 1.18] |
| 1.30 Myocardial infarction best‐worst Show forest plot | 19 | 10851 | Risk Ratio (M‐H, Random, 95% CI) | 0.46 [0.33, 0.66] |
| 1.31 Myocardial infarction worst‐best Show forest plot | 19 | 10851 | Risk Ratio (M‐H, Random, 95% CI) | 1.56 [1.00, 2.45] |
| 1.32 Myocardial infarction according to type of drug‐eluting stent Show forest plot | 19 | 10217 | Risk Ratio (M‐H, Random, 95% CI) | 0.98 [0.82, 1.18] |
| 1.32.1 Biodegradable (Biolimus) | 1 | 1118 | Risk Ratio (M‐H, Random, 95% CI) | 0.64 [0.36, 1.15] |
| 1.32.2 Everolimus | 1 | 1458 | Risk Ratio (M‐H, Random, 95% CI) | 1.29 [0.79, 2.11] |
| 1.32.3 Paclitaxel | 7 | 4305 | Risk Ratio (M‐H, Random, 95% CI) | 1.05 [0.75, 1.46] |
| 1.32.4 Sirolimus | 7 | 2282 | Risk Ratio (M‐H, Random, 95% CI) | 0.90 [0.58, 1.39] |
| 1.32.5 Zotarolimus | 1 | 44 | Risk Ratio (M‐H, Random, 95% CI) | Not estimable |
| 1.32.6 Mixed | 1 | 626 | Risk Ratio (M‐H, Random, 95% CI) | 0.74 [0.40, 1.36] |
| 1.32.7 Unclear | 1 | 384 | Risk Ratio (M‐H, Random, 95% CI) | 1.36 [0.54, 3.40] |
| 1.33 Myocardial infarction according to type of ACS Show forest plot | 19 | 10217 | Risk Ratio (M‐H, Random, 95% CI) | 0.98 [0.82, 1.18] |
| 1.33.1 STEMI | 18 | 10138 | Risk Ratio (M‐H, Random, 95% CI) | 0.98 [0.82, 1.18] |
| 1.33.2 Acute coronary syndrome | 1 | 79 | Risk Ratio (M‐H, Random, 95% CI) | 0.68 [0.12, 3.87] |
| 1.34 Myocardial infarction according to length of maximum follow‐up Show forest plot | 19 | 10217 | Risk Ratio (M‐H, Random, 95% CI) | 0.98 [0.82, 1.18] |
| 1.34.1 Less or equal to 6 months | 3 | 563 | Risk Ratio (M‐H, Random, 95% CI) | 1.17 [0.52, 2.63] |
| 1.34.2 Between 6 and 12 months | 7 | 1748 | Risk Ratio (M‐H, Random, 95% CI) | 0.98 [0.58, 1.66] |
| 1.34.3 Between 1 and 3 years | 2 | 270 | Risk Ratio (M‐H, Random, 95% CI) | 0.55 [0.24, 1.25] |
| 1.34.4 More or equal to 3 years | 7 | 7636 | Risk Ratio (M‐H, Random, 95% CI) | 1.00 [0.80, 1.25] |
| 1.35 Myocardial infarction according to registration status Show forest plot | 19 | 10217 | Risk Ratio (M‐H, Random, 95% CI) | 0.98 [0.82, 1.18] |
| 1.35.1 Pre‐registration | 3 | 1262 | Risk Ratio (M‐H, Random, 95% CI) | 0.64 [0.36, 1.15] |
| 1.35.2 Post‐registration | 12 | 8213 | Risk Ratio (M‐H, Random, 95% CI) | 1.03 [0.85, 1.26] |
| 1.35.3 No registration | 4 | 742 | Risk Ratio (M‐H, Random, 95% CI) | 0.97 [0.44, 2.12] |
| 1.36 Stent thrombosis Show forest plot | 21 | 11350 | Risk Ratio (M‐H, Random, 95% CI) | 0.96 [0.80, 1.16] |
| 1.37 Stent thrombosis best‐worst Show forest plot | 21 | 12007 | Risk Ratio (M‐H, Random, 95% CI) | 0.47 [0.32, 0.67] |
| 1.38 Stent thrombosis worst‐best Show forest plot | 21 | 12007 | Risk Ratio (M‐H, Random, 95% CI) | 1.55 [1.12, 2.15] |
| 1.39 Stent thrombosis according to type of drug‐eluting stent Show forest plot | 21 | 11350 | Risk Ratio (M‐H, Random, 95% CI) | 0.96 [0.80, 1.16] |
| 1.39.1 Biodegradable (Biolimus) | 1 | 1104 | Risk Ratio (M‐H, Random, 95% CI) | 0.72 [0.40, 1.30] |
| 1.39.2 Everolimus | 2 | 1932 | Risk Ratio (M‐H, Random, 95% CI) | 0.60 [0.34, 1.08] |
| 1.39.3 Paclitaxel | 7 | 4305 | Risk Ratio (M‐H, Random, 95% CI) | 1.01 [0.73, 1.39] |
| 1.39.4 Sirolimus | 8 | 2957 | Risk Ratio (M‐H, Random, 95% CI) | 1.04 [0.76, 1.41] |
| 1.39.5 Zotarolimus | 1 | 44 | Risk Ratio (M‐H, Random, 95% CI) | Not estimable |
| 1.39.6 Mixed | 1 | 626 | Risk Ratio (M‐H, Random, 95% CI) | 1.00 [0.52, 1.92] |
| 1.39.7 Unclear | 1 | 382 | Risk Ratio (M‐H, Random, 95% CI) | 2.16 [0.82, 5.70] |
| 1.40 Stent thrombosis according to type of ACS Show forest plot | 21 | 11350 | Risk Ratio (M‐H, Random, 95% CI) | 0.96 [0.80, 1.16] |
| 1.40.1 STEMI | 20 | 10876 | Risk Ratio (M‐H, Random, 95% CI) | 0.98 [0.81, 1.18] |
| 1.40.2 NSTEMI | 1 | 474 | Risk Ratio (M‐H, Random, 95% CI) | 0.44 [0.12, 1.68] |
| 1.41 Stent thrombosis according to length of maximum follow‐up Show forest plot | 21 | 11350 | Risk Ratio (M‐H, Random, 95% CI) | 0.96 [0.80, 1.16] |
| 1.41.1 Less or equal to 6 months | 2 | 482 | Risk Ratio (M‐H, Random, 95% CI) | 2.16 [0.82, 5.70] |
| 1.41.2 Between 6 and 12 months | 7 | 1748 | Risk Ratio (M‐H, Random, 95% CI) | 0.83 [0.46, 1.49] |
| 1.41.3 Between 1 and 3 years | 3 | 744 | Risk Ratio (M‐H, Random, 95% CI) | 0.57 [0.25, 1.29] |
| 1.41.4 More or equal to 3 years | 8 | 8360 | Risk Ratio (M‐H, Random, 95% CI) | 0.98 [0.78, 1.22] |
| 1.41.5 Unclear | 1 | 16 | Risk Ratio (M‐H, Random, 95% CI) | 0.20 [0.01, 3.61] |
| 1.42 Stent thrombosis according to registration status Show forest plot | 21 | 11350 | Risk Ratio (M‐H, Random, 95% CI) | 0.96 [0.80, 1.16] |
| 1.42.1 Pre‐registration | 3 | 1248 | Risk Ratio (M‐H, Random, 95% CI) | 0.72 [0.40, 1.30] |
| 1.42.2 Post‐registration | 13 | 9346 | Risk Ratio (M‐H, Random, 95% CI) | 0.99 [0.81, 1.21] |
| 1.42.3 No registration | 5 | 756 | Risk Ratio (M‐H, Random, 95% CI) | 0.70 [0.22, 2.20] |
| 1.43 Target vessel revascularisation Show forest plot | 23 | 11770 | Risk Ratio (M‐H, Fixed, 95% CI) | 0.58 [0.52, 0.65] |
| 1.44 Target vessel revascularisation best‐worst Show forest plot | 23 | 12368 | Risk Ratio (M‐H, Fixed, 95% CI) | 0.41 [0.37, 0.45] |
| 1.45 Target vessel revascularisation worst‐best Show forest plot | 23 | 12368 | Risk Ratio (M‐H, Fixed, 95% CI) | 0.98 [0.89, 1.07] |
| 1.46 Target vessel revascularisation according to type of drug‐eluting stent Show forest plot | 23 | 11770 | Risk Ratio (M‐H, Fixed, 95% CI) | 0.58 [0.52, 0.65] |
| 1.46.1 Biodegradable (Biolimus) | 1 | 1118 | Risk Ratio (M‐H, Fixed, 95% CI) | 0.45 [0.29, 0.70] |
| 1.46.2 Everolimus | 2 | 1932 | Risk Ratio (M‐H, Fixed, 95% CI) | 0.57 [0.42, 0.78] |
| 1.46.3 Sirolimus | 9 | 3062 | Risk Ratio (M‐H, Fixed, 95% CI) | 0.54 [0.44, 0.66] |
| 1.46.4 Paclitaxel | 8 | 4530 | Risk Ratio (M‐H, Fixed, 95% CI) | 0.63 [0.53, 0.75] |
| 1.46.5 Mixed | 1 | 626 | Risk Ratio (M‐H, Fixed, 95% CI) | 0.52 [0.35, 0.76] |
| 1.46.6 Unclear | 1 | 382 | Risk Ratio (M‐H, Fixed, 95% CI) | 2.16 [0.82, 5.70] |
| 1.46.7 Dexamethasone | 1 | 120 | Risk Ratio (M‐H, Fixed, 95% CI) | 0.60 [0.32, 1.12] |
| 1.47 Target vessel revascularisation according to type of ACS Show forest plot | 23 | 11770 | Risk Ratio (M‐H, Fixed, 95% CI) | 0.58 [0.52, 0.65] |
| 1.47.1 STEMI | 20 | 11097 | Risk Ratio (M‐H, Fixed, 95% CI) | 0.59 [0.53, 0.66] |
| 1.47.2 Acute coronary syndrome | 2 | 199 | Risk Ratio (M‐H, Fixed, 95% CI) | 0.49 [0.27, 0.86] |
| 1.47.3 NSTEMI | 1 | 474 | Risk Ratio (M‐H, Fixed, 95% CI) | 0.37 [0.18, 0.77] |
| 1.48 Target vessel revascularisation according to length of maximum follow‐up Show forest plot | 23 | 11770 | Risk Ratio (M‐H, Fixed, 95% CI) | 0.58 [0.52, 0.65] |
| 1.48.1 Less or equal to 6 months | 4 | 724 | Risk Ratio (M‐H, Fixed, 95% CI) | 0.46 [0.25, 0.84] |
| 1.48.2 Between 6 and 12 months | 8 | 1930 | Risk Ratio (M‐H, Fixed, 95% CI) | 0.58 [0.43, 0.78] |
| 1.48.3 Between 1 and 3 years | 3 | 744 | Risk Ratio (M‐H, Fixed, 95% CI) | 0.33 [0.19, 0.56] |
| 1.48.4 More or equal to 3 years | 8 | 8372 | Risk Ratio (M‐H, Fixed, 95% CI) | 0.61 [0.54, 0.69] |
| 1.48.5 Unclear | 0 | 0 | Risk Ratio (M‐H, Fixed, 95% CI) | Not estimable |
| 1.49 Target vessel revascularisation according to registration status Show forest plot | 23 | 11770 | Risk Ratio (M‐H, Fixed, 95% CI) | 0.58 [0.52, 0.65] |
| 1.49.1 Pre‐registration | 3 | 1262 | Risk Ratio (M‐H, Fixed, 95% CI) | 0.42 [0.28, 0.65] |
| 1.49.2 Post‐registration | 14 | 9425 | Risk Ratio (M‐H, Fixed, 95% CI) | 0.60 [0.53, 0.67] |
| 1.49.3 No registration | 6 | 1083 | Risk Ratio (M‐H, Fixed, 95% CI) | 0.56 [0.38, 0.82] |
| Outcome or subgroup title | No. of studies | No. of participants | Statistical method | Effect size |
| 2.1 All‐cause mortality Show forest plot | 6 | 3213 | Risk Ratio (M‐H, Fixed, 95% CI) | 0.78 [0.49, 1.22] |
| 2.2 All‐cause mortality best‐worst Show forest plot | 6 | 3231 | Risk Ratio (M‐H, Random, 95% CI) | 0.61 [0.40, 0.95] |
| 2.3 All‐cause mortality worst‐best Show forest plot | 6 | 3231 | Risk Ratio (M‐H, Random, 95% CI) | 0.92 [0.60, 1.43] |
| 2.4 All‐cause mortality according to type of drug‐eluting stent Show forest plot | 6 | 3213 | Risk Ratio (M‐H, Fixed, 95% CI) | 0.78 [0.49, 1.22] |
| 2.4.1 Everolimus | 1 | 1498 | Risk Ratio (M‐H, Fixed, 95% CI) | 0.78 [0.36, 1.71] |
| 2.4.2 Paclitaxel | 3 | 857 | Risk Ratio (M‐H, Fixed, 95% CI) | 0.83 [0.42, 1.64] |
| 2.4.3 Sirolimus | 2 | 858 | Risk Ratio (M‐H, Fixed, 95% CI) | 0.68 [0.26, 1.78] |
| 2.5 All‐cause mortality according to type of ACS Show forest plot | 6 | 3213 | Risk Ratio (M‐H, Fixed, 95% CI) | 0.78 [0.49, 1.22] |
| 2.5.1 STEMI | 6 | 3213 | Risk Ratio (M‐H, Fixed, 95% CI) | 0.78 [0.49, 1.22] |
| 2.6 All‐cause mortality according to registration status Show forest plot | 6 | 3213 | Risk Ratio (M‐H, Fixed, 95% CI) | 0.78 [0.49, 1.22] |
| 2.6.1 Post‐registration | 3 | 2856 | Risk Ratio (M‐H, Fixed, 95% CI) | 0.68 [0.41, 1.14] |
| 2.6.2 No registration | 3 | 357 | Risk Ratio (M‐H, Fixed, 95% CI) | 1.28 [0.47, 3.47] |
| 2.7 Serious adverse events Show forest plot | 7 | 3313 | Risk Ratio (M‐H, Random, 95% CI) | 0.65 [0.45, 0.93] |
| 2.8 Serious adverse events best‐worst Show forest plot | 7 | 3331 | Risk Ratio (M‐H, Random, 95% CI) | 0.56 [0.40, 0.80] |
| 2.9 Serious adverse events worst‐best Show forest plot | 7 | 3331 | Risk Ratio (M‐H, Random, 95% CI) | 0.73 [0.52, 1.03] |
| 2.10 Serious adverse events according to type of drug‐eluting stent Show forest plot | 7 | 3313 | Risk Ratio (M‐H, Random, 95% CI) | 0.65 [0.45, 0.93] |
| 2.10.1 Everolimus | 1 | 1498 | Risk Ratio (M‐H, Random, 95% CI) | 0.55 [0.30, 0.98] |
| 2.10.2 Paclitaxel | 4 | 957 | Risk Ratio (M‐H, Random, 95% CI) | 0.77 [0.41, 1.46] |
| 2.10.3 Sirolimus | 2 | 858 | Risk Ratio (M‐H, Random, 95% CI) | 0.67 [0.35, 1.28] |
| 2.11 Serious adverse events according to type of ACS Show forest plot | 7 | 3313 | Risk Ratio (M‐H, Random, 95% CI) | 0.65 [0.45, 0.93] |
| 2.11.1 STEMI | 7 | 3313 | Risk Ratio (M‐H, Random, 95% CI) | 0.65 [0.45, 0.93] |
| 2.12 Serious adverse events according to registration status Show forest plot | 7 | 3313 | Risk Ratio (M‐H, Random, 95% CI) | 0.65 [0.45, 0.93] |
| 2.12.1 Pre‐registration | 1 | 100 | Risk Ratio (M‐H, Random, 95% CI) | 0.35 [0.01, 8.31] |
| 2.12.2 Post‐registration | 3 | 2856 | Risk Ratio (M‐H, Random, 95% CI) | 0.60 [0.41, 0.88] |
| 2.12.3 No registration | 3 | 357 | Risk Ratio (M‐H, Random, 95% CI) | 1.09 [0.43, 2.76] |
| 2.13 Major cardiovascular events Show forest plot | 6 | 3150 | Risk Ratio (M‐H, Random, 95% CI) | 0.68 [0.43, 1.08] |
| 2.14 Major cardiovascular events best‐worst Show forest plot | 6 | 3168 | Risk Ratio (M‐H, Random, 95% CI) | 0.54 [0.35, 0.84] |
| 2.15 Major cardiovascular events worst‐best Show forest plot | 6 | 3168 | Risk Ratio (M‐H, Random, 95% CI) | 0.82 [0.53, 1.27] |
| 2.16 Major cardiovascular events according to type of drug‐eluting stent Show forest plot | 6 | 3150 | Risk Ratio (M‐H, Random, 95% CI) | 0.68 [0.43, 1.08] |
| 2.16.1 Everolimus | 1 | 1498 | Risk Ratio (M‐H, Random, 95% CI) | 0.78 [0.36, 1.71] |
| 2.16.2 Paclitaxel | 3 | 794 | Risk Ratio (M‐H, Random, 95% CI) | 0.66 [0.32, 1.37] |
| 2.16.3 Sirolimus | 2 | 858 | Risk Ratio (M‐H, Random, 95% CI) | 0.60 [0.25, 1.45] |
| 2.17 Major cardiovascular events according to type of ACS Show forest plot | 6 | 3150 | Risk Ratio (M‐H, Random, 95% CI) | 0.68 [0.43, 1.08] |
| 2.17.1 STEMI | 6 | 3150 | Risk Ratio (M‐H, Random, 95% CI) | 0.68 [0.43, 1.08] |
| 2.18 Major cardiovascular events according to registration status Show forest plot | 6 | 3150 | Risk Ratio (M‐H, Random, 95% CI) | 0.68 [0.43, 1.08] |
| 2.18.1 Pre‐registration | 1 | 100 | Risk Ratio (M‐H, Random, 95% CI) | 0.35 [0.01, 8.31] |
| 2.18.2 Post‐registration | 3 | 2856 | Risk Ratio (M‐H, Random, 95% CI) | 0.67 [0.41, 1.09] |
| 2.18.3 No registration | 2 | 194 | Risk Ratio (M‐H, Random, 95% CI) | 0.92 [0.24, 3.58] |
| 2.19 Cardiovascular mortality Show forest plot | 5 | 2406 | Risk Ratio (M‐H, Fixed, 95% CI) | 0.73 [0.43, 1.25] |
| 2.20 Cardiovascular mortality best‐worst Show forest plot | 5 | 2423 | Risk Ratio (M‐H, Fixed, 95% CI) | 0.53 [0.32, 0.88] |
| 2.21 Cardiovascular mortality worst‐best Show forest plot | 5 | 2423 | Risk Ratio (M‐H, Random, 95% CI) | 0.90 [0.54, 1.50] |
| 2.22 Cardiovascular mortality according to type of drug‐eluting stent Show forest plot | 5 | 2406 | Risk Ratio (M‐H, Fixed, 95% CI) | 0.73 [0.43, 1.25] |
| 2.22.1 Everolimus | 1 | 1498 | Risk Ratio (M‐H, Fixed, 95% CI) | 0.78 [0.36, 1.71] |
| 2.22.2 Paclitaxel | 3 | 794 | Risk Ratio (M‐H, Fixed, 95% CI) | 0.67 [0.30, 1.46] |
| 2.22.3 Sirolimus | 1 | 114 | Risk Ratio (M‐H, Fixed, 95% CI) | 0.90 [0.13, 6.17] |
| 2.23 Cardiovascular mortality according to type of ACS Show forest plot | 5 | 2406 | Risk Ratio (M‐H, Fixed, 95% CI) | 0.73 [0.43, 1.25] |
| 2.23.1 STEMI | 5 | 2406 | Risk Ratio (M‐H, Fixed, 95% CI) | 0.73 [0.43, 1.25] |
| 2.24 Cardiovascular mortality according to registration status Show forest plot | 5 | 2406 | Risk Ratio (M‐H, Fixed, 95% CI) | 0.73 [0.43, 1.25] |
| 2.24.1 Pre‐registration | 1 | 100 | Risk Ratio (M‐H, Fixed, 95% CI) | 0.35 [0.01, 8.31] |
| 2.24.2 Post‐registration | 2 | 2112 | Risk Ratio (M‐H, Fixed, 95% CI) | 0.70 [0.39, 1.25] |
| 2.24.3 No registration | 2 | 194 | Risk Ratio (M‐H, Fixed, 95% CI) | 1.30 [0.27, 6.38] |
| 2.25 Myocardial infarction Show forest plot | 6 | 3150 | Risk Ratio (M‐H, Random, 95% CI) | 0.51 [0.26, 0.98] |
| 2.26 Myocardial infarction best‐worst Show forest plot | 6 | 3168 | Risk Ratio (M‐H, Random, 95% CI) | 0.37 [0.20, 0.68] |
| 2.27 Myocardial infarction worst‐best Show forest plot | 6 | 3168 | Risk Ratio (M‐H, Random, 95% CI) | 0.74 [0.41, 1.32] |
| 2.28 Myocardial infarction according to type of drug‐eluting stent Show forest plot | 6 | 3150 | Risk Ratio (M‐H, Random, 95% CI) | 0.51 [0.26, 0.98] |
| 2.28.1 Everolimus | 1 | 1498 | Risk Ratio (M‐H, Random, 95% CI) | 0.55 [0.19, 1.64] |
| 2.28.2 Paclitaxel | 3 | 794 | Risk Ratio (M‐H, Random, 95% CI) | 0.38 [0.09, 1.63] |
| 2.28.3 Sirolimus | 2 | 858 | Risk Ratio (M‐H, Random, 95% CI) | 0.54 [0.20, 1.46] |
| 2.29 Myocardial infarction according to type of ACS Show forest plot | 6 | 3150 | Risk Ratio (M‐H, Random, 95% CI) | 0.51 [0.26, 0.98] |
| 2.29.1 STEMI | 6 | 3150 | Risk Ratio (M‐H, Random, 95% CI) | 0.51 [0.26, 0.98] |
| 2.30 Myocardial infarction according to registration status Show forest plot | 6 | 3150 | Risk Ratio (M‐H, Random, 95% CI) | 0.51 [0.26, 0.98] |
| 2.30.1 Pre‐registration | 1 | 100 | Risk Ratio (M‐H, Random, 95% CI) | Not estimable |
| 2.30.2 Post‐registration | 3 | 2856 | Risk Ratio (M‐H, Random, 95% CI) | 0.50 [0.25, 1.00] |
| 2.30.3 No registration | 2 | 194 | Risk Ratio (M‐H, Random, 95% CI) | 0.59 [0.07, 4.69] |
| 2.31 Stent thrombosis Show forest plot | 5 | 3070 | Risk Ratio (M‐H, Random, 95% CI) | 0.48 [0.26, 0.90] |
| 2.32 Stent thrombosis best‐worst Show forest plot | 5 | 3088 | Risk Ratio (M‐H, Random, 95% CI) | 0.36 [0.20, 0.65] |
| 2.33 Stent thrombosis worst‐best Show forest plot | 5 | 3088 | Risk Ratio (M‐H, Random, 95% CI) | 0.68 [0.39, 1.18] |
| 2.34 Stent thrombosis according to type of drug‐eluting stent Show forest plot | 5 | 3070 | Risk Ratio (M‐H, Random, 95% CI) | 0.48 [0.26, 0.90] |
| 2.34.1 Everolimus | 1 | 1498 | Risk Ratio (M‐H, Random, 95% CI) | 0.37 [0.15, 0.95] |
| 2.34.2 Paclitaxel | 2 | 714 | Risk Ratio (M‐H, Random, 95% CI) | 0.66 [0.11, 3.94] |
| 2.34.3 Sirolimus | 2 | 858 | Risk Ratio (M‐H, Random, 95% CI) | 0.58 [0.23, 1.46] |
| 2.35 Stent thrombosis according to type of ACS Show forest plot | 5 | 3070 | Risk Ratio (M‐H, Random, 95% CI) | 0.48 [0.26, 0.90] |
| 2.35.1 STEMI | 5 | 3070 | Risk Ratio (M‐H, Random, 95% CI) | 0.48 [0.26, 0.90] |
| 2.36 Stent thrombosis according to registration status Show forest plot | 5 | 3070 | Risk Ratio (M‐H, Random, 95% CI) | 0.48 [0.26, 0.90] |
| 2.36.1 Pre‐registration | 1 | 100 | Risk Ratio (M‐H, Random, 95% CI) | Not estimable |
| 2.36.2 Post‐registration | 3 | 2856 | Risk Ratio (M‐H, Random, 95% CI) | 0.47 [0.25, 0.88] |
| 2.36.3 No registration | 1 | 114 | Risk Ratio (M‐H, Random, 95% CI) | 0.90 [0.06, 14.04] |
| 2.37 Target vessel revascularisation Show forest plot | 6 | 3233 | Risk Ratio (M‐H, Random, 95% CI) | 0.50 [0.31, 0.82] |
| 2.38 Target vessel revascularisation best‐worst Show forest plot | 6 | 3251 | Risk Ratio (M‐H, Random, 95% CI) | 0.41 [0.26, 0.66] |
| 2.39 Target vessel revascularisation worst‐best Show forest plot | 6 | 3251 | Risk Ratio (M‐H, Random, 95% CI) | 0.62 [0.40, 0.98] |
| 2.40 Target vessel revascularisation according to type of drug‐eluting stent Show forest plot | 6 | 3233 | Risk Ratio (M‐H, Random, 95% CI) | 0.50 [0.31, 0.82] |
| 2.40.1 Everolimus | 1 | 1498 | Risk Ratio (M‐H, Random, 95% CI) | 0.36 [0.17, 0.76] |
| 2.40.2 Paclitaxel | 3 | 877 | Risk Ratio (M‐H, Random, 95% CI) | 0.52 [0.18, 1.49] |
| 2.40.3 Sirolimus | 2 | 858 | Risk Ratio (M‐H, Random, 95% CI) | 0.77 [0.29, 2.04] |
| 2.41 Target vessel revascularisation according to type of ACS Show forest plot | 6 | 3233 | Risk Ratio (M‐H, Random, 95% CI) | 0.50 [0.31, 0.82] |
| 2.41.1 STEMI | 6 | 3233 | Risk Ratio (M‐H, Random, 95% CI) | 0.50 [0.31, 0.82] |
| 2.42 Target vessel revascularisation according to registration status Show forest plot | 6 | 3233 | Risk Ratio (M‐H, Random, 95% CI) | 0.50 [0.31, 0.82] |
| 2.42.1 Pre‐registration | 1 | 100 | Risk Ratio (M‐H, Random, 95% CI) | Not estimable |
| 2.42.2 Post‐registration | 3 | 2856 | Risk Ratio (M‐H, Random, 95% CI) | 0.53 [0.32, 0.90] |
| 2.42.3 No registration | 2 | 277 | Risk Ratio (M‐H, Random, 95% CI) | 0.34 [0.09, 1.29] |