Patient‐mediated interventions to improve professional practice
Abstract
Background
Healthcare professionals are important contributors to healthcare quality and patient safety, but their performance does not always follow recommended clinical practice. There are many approaches to influencing practice among healthcare professionals. These approaches include audit and feedback, reminders, educational materials, educational outreach visits, educational meetings or conferences, use of local opinion leaders, financial incentives, and organisational interventions. In this review, we evaluated the effectiveness of patient‐mediated interventions. These interventions are aimed at changing the performance of healthcare professionals through interactions with patients, or through information provided by or to patients. Examples of patient‐mediated interventions include 1) patient‐reported health information, 2) patient information, 3) patient education, 4) patient feedback about clinical practice, 5) patient decision aids, 6) patients, or patient representatives, being members of a committee or board, and 7) patient‐led training or education of healthcare professionals.
Objectives
To assess the effectiveness of patient‐mediated interventions on healthcare professionals' performance (adherence to clinical practice guidelines or recommendations for clinical practice).
Search methods
We searched MEDLINE, Ovid in March 2018, Cochrane Central Register of Controlled Trials (CENTRAL) in March 2017, and ClinicalTrials.gov and the International Clinical Trials Registry (ICTRP) in September 2017, and OpenGrey, the Grey Literature Report and Google Scholar in October 2017. We also screened the reference lists of included studies and conducted cited reference searches for all included studies in October 2017.
Selection criteria
Randomised studies comparing patient‐mediated interventions to either usual care or other interventions to improve professional practice.
Data collection and analysis
Two review authors independently assessed studies for inclusion, extracted data and assessed risk of bias. We calculated the risk ratio (RR) for dichotomous outcomes using Mantel‐Haenszel statistics and the random‐effects model. For continuous outcomes, we calculated the mean difference (MD) using inverse variance statistics. Two review authors independently assessed the certainty of the evidence (GRADE).
Main results
We included 25 studies with a total of 12,268 patients. The number of healthcare professionals included in the studies ranged from 12 to 167 where this was reported. The included studies evaluated four types of patient‐mediated interventions: 1) patient‐reported health information interventions (for instance information obtained from patients about patients' own health, concerns or needs before a clinical encounter), 2) patient information interventions (for instance, where patients are informed about, or reminded to attend recommended care), 3) patient education interventions (intended to increase patients' knowledge about their condition and options of care, for instance), and 4) patient decision aids (where the patient is provided with information about treatment options including risks and benefits). For each type of patient‐mediated intervention a separate meta‐analysis was produced.
Patient‐reported health information interventions probably improve healthcare professionals' adherence to recommended clinical practice (moderate‐certainty evidence). We found that for every 100 patients consulted or treated, 26 (95% CI 23 to 30) are in accordance with recommended clinical practice compared to 17 per 100 in the comparison group (no intervention or usual care). We are uncertain about the effect of patient‐reported health information interventions on desirable patient health outcomes and patient satisfaction (very low‐certainty evidence). Undesirable patient health outcomes and adverse events were not reported in the included studies and resource use was poorly reported.
Patient information interventions may improve healthcare professionals' adherence to recommended clinical practice (low‐certainty evidence). We found that for every 100 patients consulted or treated, 32 (95% CI 24 to 42) are in accordance with recommended clinical practice compared to 20 per 100 in the comparison group (no intervention or usual care). Patient information interventions may have little or no effect on desirable patient health outcomes and patient satisfaction (low‐certainty evidence). We are uncertain about the effect of patient information interventions on undesirable patient health outcomes because the certainty of the evidence is very low. Adverse events and resource use were not reported in the included studies.
Patient education interventions probably improve healthcare professionals' adherence to recommended clinical practice (moderate‐certainty evidence). We found that for every 100 patients consulted or treated, 46 (95% CI 39 to 54) are in accordance with recommended clinical practice compared to 35 per 100 in the comparison group (no intervention or usual care). Patient education interventions may slightly increase the number of patients with desirable health outcomes (low‐certainty evidence). Undesirable patient health outcomes, patient satisfaction, adverse events and resource use were not reported in the included studies.
Patient decision aid interventions may have little or no effect on healthcare professionals' adherence to recommended clinical practice (low‐certainty evidence). We found that for every 100 patients consulted or treated, 32 (95% CI 24 to 43) are in accordance with recommended clinical practice compared to 37 per 100 in the comparison group (usual care). Patient health outcomes, patient satisfaction, adverse events and resource use were not reported in the included studies.
Authors' conclusions
We found that two types of patient‐mediated interventions, patient‐reported health information and patient education, probably improve professional practice by increasing healthcare professionals' adherence to recommended clinical practice (moderate‐certainty evidence). We consider the effect to be small to moderate. Other patient‐mediated interventions, such as patient information may also improve professional practice (low‐certainty evidence). Patient decision aids may make little or no difference to the number of healthcare professionals' adhering to recommended clinical practice (low‐certainty evidence).
The impact of these interventions on patient health and satisfaction, adverse events and resource use, is more uncertain mostly due to very low certainty evidence or lack of evidence.
PICO
Plain language summary
Patient‐mediated interventions to improve professional practice
What is the aim of the review?
Our aim with this Cochrane review was to assess whether patients can change the performance of healthcare professionals. We collected and analysed all relevant studies to answer this question and found 25 studies.
Key message
This review suggests that patients may change healthcare professionals’ practice though the following three strategies: 1) strategies where patients give healthcare professionals information about themselves; 2) strategies where patients are given healthcare information; and 3) strategies where patients take part in patient education. Patient decision aids may make little or no difference to healthcare professionals’ practice, however, the certainty is low, and these results should be interpreted carefully. We still need more research about the best ways in which patients can change professional practice and about the impact it has on patients’ health.
What was studied in the review?
Many strategies have been tested to see if they can improve healthcare professionals’ practice and make sure that patients receive the best available care. These strategies include sending reminders to healthcare professionals, giving them further education, or giving them financial rewards. These strategies have mostly had only small or moderate effects. Another way of changing what healthcare professionals do is through the patients themselves. These strategies are called 'patient‐mediated interventions'.
What are the main results of the review?
The studies in this review assessed different patient‐mediated strategies compared to usual care or no strategies.
Strategies where patients give information to healthcare professionals
In these studies, patients gave information about their own health, concerns or needs to the doctor. This was usually done by filling in a questionnaire in the waiting area before a consultation. The doctor was then given this information before or at the consultation. The review shows that these strategies:
‐ probably improve the extent to which healthcare professionals follow recommended clinical practice (moderate‐certainty evidence).
We are uncertain about the effect of these strategies on patient health, patient satisfaction and resource use because these outcomes were not measured in the studies or because the certainty of the evidence is very low.
Strategies where information was given to patients
In these studies, patients were given information about recommended care or were reminded to use services, for instance to go for a check‐up. The review shows that these strategies:
‐ may improve the extent to which healthcare professionals follow recommended clinical practice (low‐certainty evidence);
‐ may have little or no effect on patient satisfaction (low‐certainty evidence);
‐ may have little or no effect on some patient health outcomes, such as the number of patients who reach controlled blood pressure (low‐certainty evidence). However, we are uncertain about the effect of these strategies on other patient health outcomes because the certainty of the evidence is very low. We also lack information to draw conclusions about resource use.
Patient education strategies
In these studies, patients took part in patient education such as self‐management programmes, for instance to increase their knowledge about their condition. The review shows that these strategies:
‐ probably improve the extent to which healthcare professionals follow recommended clinical practice (moderate‐certainty evidence);
‐ may slightly improve some patient health outcomes such as the number of patients who reach controlled blood pressure (low‐certainty evidence). However, we are uncertain about the effect of these strategies on other patient health outcomes, patient satisfaction and resource use because these outcomes were not measured in the included studies.
Patient decision aid strategies
In the one study that assessed effect of patient decision aids, patients were given a decision aid consisting of a booklet, personal worksheet, and audiotape to make decisions about their medical management. The review shows that these strategies:
‐ may have little or no effect on the extent to which healthcare professionals follow recommended clinical practice (low‐certainty evidence)
We are uncertain about the effect of these strategies on patient health, patient satisfaction and resource use because these outcomes were not measured in the studies or because the certainty of the evidence is very low.
How up‐to‐date is this review?
We searched for studies up to March 2018 and ongoing studies up to October 2017.
Authors' conclusions
Summary of findings
| Patient‐reported health information interventions versus comparisons to improve professional performance | ||||||
| Patient or population: general patient population, "at risk" patient population and patient population with a specific condition or disease | ||||||
| Outcomes | Anticipated absolute effects* (95% CI) | Relative effect | № of participants | Certainty of the evidence | What happens? | |
| Risk with comparisons | Risk with patient‐reported health information interventions | |||||
| Adherence to recommended clinical practice (0‐3 months follow‐up) | 17 per 100 | 26 per 100 | RR 1.59 | 3865 | ⊕⊕⊕⊝ | Patient‐reported health information interventions probably improve healthcare professionals' adherence to recommended clinical practice compared to no intervention or usual care |
| Desirable patient health outcomes (0‐3 months follow‐up) | 32 per 100 | 52 per 100 | RR 1.62 | 79 | ⊕⊝⊝⊝ | We are uncertain about the effect of patient‐reported health information interventions on desirable patient health outcomes because the certainty of the evidence is very low |
| Undesirable patient health outcomes | Not reported | ‐ | ‐ | ‐ | ‐ | None of the included studies reported on undesirable patient health outcomes |
| Patient satisfaction Number of satisfied patients (0‐3 months follow‐up) | 38 per 100 | 94 per 100 | RR 2.45 | 26 | ⊕⊝⊝⊝ | We are uncertain about the effect of patient‐reported health information interventions on the number of satisfied patients because the certainty of the evidence is very low |
| Patient satisfaction The degree of satisfaction (unknown scale, but higher score means higher degree of satisfaction) (0‐3 months follow‐up) | The mean patient satisfaction score was 4.3 points | The mean patient satisfaction was 0.40 points higher (0.12 higher to 0.68 higher) | ‐ | 79 | ⊕⊝⊝⊝ | We are uncertain about the effect of patient‐reported health information interventions on the degree of patient satisfaction because the certainty of the evidence is very low |
| Adverse events | Not reported | ‐ | ‐ | ‐ | ‐ | None of the included studies reported on adverse events |
| Resource use (0‐3 months follow‐up) | The findings are narratively presented in Table 3. The researchers in this study reported a total cost of 69.20 US $ per child | We did not judge the certainty of the evidence for this outcome | ||||
| *The risk in the intervention group (and its 95% confidence interval) is based on the assumed risk in the comparison group and the relative effect of the intervention (and its 95% CI). | ||||||
| GRADE Working Group grades of evidence ** Substantially different = a large enough difference that it might affect a decision | ||||||
| 1 Downgraded one level because we judged only 1 of 4 studies to have low risk of bias 2 Downgraded one level because we judged the study to have potential risk of bias 3 Downgraded two levels for imprecision because of very few events (and one small study only) 4 Downgraded two levels for imprecision because of a very small sample size (and one small study only) A Goldberg 2012; Kenealy 2005; Mazonson 1996; Quinn 2008 B Brody 1990 C Quinn 2008 | ||||||
| Patient information interventions versus comparisons to improve professional performance | ||||||
| Patient or population: general patient population, "at risk" patient population and patient population with a specific condition or disease | ||||||
| Outcomes | Anticipated absolute effects* (95% CI) | Relative effect | № of participants | Certainty of the evidence | What happens? | |
| Risk with comparisons | Risk with patient information interventions | |||||
| Adherence to recommended clinical practice (0‐12 months follow‐up) | 20 per 100 | 32 per 100 | RR 1.60 | 3502 | ⊕⊕⊝⊝ | Patient information interventions may improve healthcare professionals' adherence to recommended clinical practice compared to no intervention or usual care |
| Desirable patient health outcomes (3‐12 months follow‐up) | 55 per 100 | 54 per 100 | RR 0.99 | 261 | ⊕⊕⊝⊝ | There may be little or no difference in the number of people with desirable health outcomes among people in the patient information intervention group compared to those in the usual care group |
| Undesirable patient health outcomes (0‐12 months follow‐up) | 28 per 100 | 27 per 100 | RR 0.94 | 246 | ⊕⊝⊝⊝ | We are uncertain about the effect of patient information interventions on undesirable patient outcomes because the certainty of the evidence is very low |
| Patient satisfaction Number of satisfied patients (0‐3 months follow‐up) | 89 per 100 | 92 per 100 | RR 1.03 | 186 | ⊕⊕⊝⊝ | There may be little or no difference in the number of satisfied patients among those in the patient information intervention group compared to those in the usual care group |
| Patient satisfaction The degree of satisfaction (on a 1‐10 scale where 10 is highest degree of satisfaction) (0‐3 months follow‐up) | The mean patient satisfaction score was 9.1 points | The mean patient satisfaction was 0.30 points higher (0.01 higher to 0.59 higher) | ‐ | 186 | ⊕⊕⊝⊝ | There may be little or no difference in the degree of satisfaction among patients in the patient information intervention group compared to those in the usual care group |
| Adverse events | Not reported | ‐ | ‐ | ‐ | ‐ | None of the included studies reported on adverse events |
| Resource use | Not reported | ‐ | ‐ | ‐ | ‐ | None of the included studies reported on resource use |
| *The risk in the intervention group (and its 95% confidence interval) is based on the assumed risk in the comparison group and the relative effect of the intervention (and its 95% CI). | ||||||
| GRADE Working Group grades of evidence ** Substantially different = a large enough difference that it might affect a decision | ||||||
| 1 Downgraded one level because all the studies were judged to have potential risk of bias, 2 Downgraded one level for inconsistency because of statistical heterogeneity (I2 is 79%) 3 Downgraded two levels for imprecision because of few events and a 95% CI that crosses the line of "no effect" 4 Downgraded one level for imprecision because of small study sample 5 Downgraded one level because we judged the study to have potential risk of bias 6 Downgraded one level for imprecision because of few events A Aragones 2010; Caskey 2011; Herman 1995; Jacobson 1999; Krol 2004; Leveille 2009; McKinstry 2006; Mouland 1997; Thomas 2003; Turner 1990; Wright 2012 B McKinstry 2006 C Krol 2004; Leveille 2009 D Leveille 2009 (patient satisfaction was assessed using both a dichotomous and a continuous outcome in this study) | ||||||
| Patient education interventions versus comparisons to improve professional performance | ||||||
| Patient or population: general patient population, "at risk" patient population and patient population with a specific condition or disease | ||||||
| Outcomes | Anticipated absolute effects* (95% CI) | Relative effect | № of participants | Certainty of the evidence | What happens? | |
| Risk with comparisons | Risk with patient education interventions | |||||
| Adherence to recommended clinical practice (0‐3 months follow‐up) | 35 per 100 | 46 per 100 | RR 1.31 | 1029 | ⊕⊕⊕⊝ | Patient education interventions probably improve healthcare professionals' adherence to recommended clinical practice compared to no intervention or usual care |
| Desirable patient health outcomes (0‐3 months follow‐up) | 66 per 100 | 72 per 100 | RR 1.09 | 500 | ⊕⊕⊕⊝ | Patient education interventions may slightly increase the number of people with desirable health outcomes compared to usual care |
| Undesirable patient health outcomes | Not reported | ‐ | ‐ | ‐ | ‐ | None of the included studies reported on undesirable patient health outcomes |
| Patient satisfaction Number of satisfied patients | Not reported | ‐ | ‐ | ‐ | ‐ | None of the included studies reported on patient satisfaction |
| Patient satisfaction The degree of satisfaction | Not reported | ‐ | ‐ | ‐ | ‐ | None of the included studies reported on patient satisfaction |
| Adverse events | Not reported | ‐ | ‐ | ‐ | ‐ | None of the included studies reported on adverse events |
| Resource use | Not reported | ‐ | ‐ | ‐ | ‐ | None of the included studies reported on resource use |
| GRADE Working Group grades of evidence ** Substantially different = a large enough difference that it might affect a decision | ||||||
| 1 Downgraded one level because most of the studies were assessed as having potential risk of bias 2 Downgraded one level for imprecision because the 95% CI crosses the line of "no effect" 3 Downgraded one level because the study has potential risk of bias (allocation concealment and other biases related to cluster issues) A Khan 2011; Kravitz 2012; Miaskowski 2004; Thiboutot 2013 B Thiboutot 2013 | ||||||
| Patient decision aid interventions versus comparisons to improve professional performance | ||||||
| Patient or population: patient population with a specific condition or disease | ||||||
| Outcomes | Anticipated absolute effects* (95% CI) | Relative effect | № of participants | Certainty of the evidence | What happens? | |
| Risk with comparisons | Risk with patient‐reported health information interventions | |||||
| Adherence to recommended clinical practice (12 months follow up) | 37 per 100 | 32 per 100 | RR 0.86 | 353 | ⊕⊕⊕⊝ | There may be little or no difference in the number of healthcare professionals' adhering to recommended clinical practice in the patient decision aid group compared to usual care |
| Desirable patient health outcomes | Not reported | ‐ | ‐ | ‐ | ‐ | The included study did not report on desirable patient health outcomes |
| Undesirable patient health outcomes | Not reported | ‐ | ‐ | ‐ | ‐ | The included study did not report on undesirable patient health outcomes |
| Patient satisfaction Number of satisfied patients | Not reported | The included study did not report on patient satisfaction outcomes | ||||
| Patient satisfaction The degree of satisfaction (unknown scale, but higher score means higher degree of satisfaction) | Not reported | ‐ | ‐ | ‐ | ‐ | The included study did not report on patient satisfaction outcomes |
| Adverse events | Not reported | ‐ | ‐ | ‐ | ‐ | None of the included studies reported on adverse events |
| Resource use | Not reported | ‐ | ‐ | ‐ | ‐ | None of the included studies reported on resource use |
| *The risk in the intervention group (and its 95% confidence interval) is based on the assumed risk in the comparison group and the relative effect of the intervention (and its 95% CI). | ||||||
| GRADE Working Group grades of evidence ** Substantially different = a large enough difference that it might affect a decision | ||||||
| 1 Downgraded one level because the study was assessed as having high risk of performance bias (no blinding of patients or healthcare professionals) 2 Downgraded one level for imprecision because of few events and because the 95% CI crosses the line of "no effect" A McAlister 2005 | ||||||
Background
Description of the condition
Healthcare professionals' performance is not always in line with recommended clinical practices (McGlynn 2003; Runciman 2012; Schuster 1998; Seddon 2001). Reducing the gap between recommended and actual clinical practice is a key element of healthcare quality improvement. Recommended practices are typically formulated in clinical practice guidelines. Clinical practice guidelines have the potential to improve the quality of healthcare and patient outcomes by providing specific recommendations for professional practice (Grol 2003; Schuster 1998; Seddon 2001). Adherence to clinical practice guidelines is thus frequently used as a measure of the quality of healthcare. Various interventions are proposed as means to improve the performance of healthcare professionals, e.g. audit and feedback, reminders, educational material, educational outreach visits, educational meetings or conferences, use of local opinion leaders, financial incentives, organisational interventions, and patient‐mediated interventions.
Description of the intervention
Several definitions of patient‐mediated intervention have been proposed (Grimshaw 2004; Légaré 2014; Robertson 2006). Here we define patient‐mediated interventions according to Légaré 2014: "any intervention aimed at changing the performance of healthcare professionals through interactions with patients, or information provided by or to patients".
Overall, experimental studies of interventions to improve professional practice have yielded small to moderate effects. A Cochrane review shows that audit and feedback probably improves professional practice, but the effectiveness ranges from little or no effect to a substantial effect (Ivers 2012). Reminders, such as computer‐generated reminders delivered on paper to healthcare professionals, probably improve professional practice (Arditi 2017). Printed educational material may also improve professional practice, but the effect seems small, and the certainty of the evidence is low (Giguère 2012). Educational meetings or educational outreach visits may result in modest improvements in professional practice (Forsetlund 2009; O'Brien 2007). Using local opinion leaders may improve professional practice (Flodgren 2011a), as may financial incentives (Flodgren 2011b). Another recent Cochrane review shows that healthcare professionals provided with clinical practice guidelines accompanied by tools developed by guideline producers probably adhere more to clinical guidelines (Flodgren 2016). Organisational interventions, such as provision of pharmaceutical care, medication reviews, and follow‐up visits by a healthcare professional including a pharmacist, nurse or physician, probably make little or no difference to the number of medication errors by primary healthcare professionals that lead to hospital admissions, emergency department visits, or death among adult patients (Khalil 2017).
Direct involvement of patients or their representatives in decision‐making processes is seen both as an ethical imperative, and as a promising approach for quality improvement (Richards 2013). Interventions to promote shared decision‐making (Légaré 2014) and patient‐centred care (Dwamena 2012), including patient‐mediated interventions, have been reviewed elsewhere. Also, the effectiveness of the use of decision aids among people facing treatment or screening decisions has been reviewed elsewhere (Stacey 2017). The focus of the Stacey 2017 Cochrane review was on people's decision‐making processes, behaviour and health, and on outcomes related to health care system cost, use. The studies included in this decision aids review most likely did not address outcomes directly related to changing professional practice and would therefore not be eligible for inclusion in our review.
In this review we focus specifically on the effects of using patient involvement as a means to improving healthcare professionals' performance. This can be done through interactions with patients, or information provided by or to patients. Examples of such interventions include:
-
patient‐reported health information where patients provide information about their own health, concerns, or needs before a clinical encounter;
-
patient information where patients are informed about recommended care;
-
patient education/training/counselling to increase patients' knowledge about their condition;
-
patient decision aids to ensure that the choices about treatment and management reflect recommended care and the patients' values and preferences;
-
patient feedback about clinical practice;
-
patients being members of committees or boards of healthcare organisations;
-
patient‐led training or education of healthcare professionals.
We have used adherence to clinical practice guidelines and recommendations as a measure for quality of professional practice, as is commonly done, for example in Cochrane reviews of interventions to improve healthcare worker performance (Arditi 2017; Flodgren 2011a; Flodgren 2011b; Flodgren 2016; Forsetlund 2009; Giguère 2012; O'Brien 2007; Tzortziou Brown 2016). It is worth noting that adherence to guidelines is not necessarily what a patient wants. A patient‐mediated intervention could therefore improve professional practice without improving shared decision‐making, and vice versa. Still, it seems reasonable to assume that most recommended clinical practices are in the best interest of the patient, and therefore also in line with the care most patients would want.
The importance of patient involvement at all levels of healthcare services is widely recognised. Patients are, in general, positive to engaging in improving the quality of the care they receive (Schwappach 2010a). Also, patient information materials developed in collaboration with patients is probably more relevant, readable, understandable, and effective in improving knowledge among patients (Nilsen 2006).
On the other hand, concerns have been raised about how patient involvement can affect patients' trust in healthcare professionals and their experience of receiving healthcare (Hrisos 2013; Luszczynska 2007; McGunkin 2006). In addition, patients' comfort level with active involvement may vary considerably, as some might feel that they can appear rude or disrespectful and that this may upset the healthcare professional and, consequently, might compromise their healthcare (Hrisos 2013). Patients may also find it hard to overcome distrust if the independence, agency, or expertise of healthcare professionals is questioned (Plomp 2010).
The patient's socioeconomic status has been shown to correlate with the degree of involvement in treatment decisions (Willems 2005). Patients from higher social classes may get more information from their healthcare professionals because they often communicate more actively (they ask more questions and are more opinionated) and show more affective expressiveness (Willems 2005).
Most healthcare professionals, like patients, welcome patient involvement to improve healthcare safety (Davis 2012a; Davis 2012b; Hrisos 2013; Schwappach 2010b; Schwappach 2011; Schwappach 2013). When patients question or challenge healthcare professionals' practice, however, the healthcare professionals' morale and professional integrity may suffer negative consequences (Hrisos 2013; Schwappach 2010b). Thus, in some situations or cases, the unwanted consequences of patient‐mediated interventions may negatively affect both the patient and the healthcare professional and, thus, the patient‐healthcare professional relationship.
To avoid tensions between healthcare professionals and patients, a conceptual common ground or consensus on how to set treatment and management goals has been recommended (Sugavanam 2013). Collaboration and communication are important factors and communication in the form of discussions may also lead to more reciprocal, trustful relationships and more open information exchanges (Skirbekk 2011).
How the intervention might work
Despite being regarded as a promising approach for improving healthcare systems and and being the focus of research, the theoretical foundation for patient‐mediated interventions seems meagre. Very few, if any, of the studies to evaluate the effectiveness of such interventions have reported use of theory in the development and design of the intervention (Gagliardi 2016; Ng 2017). Still, if healthcare professionals are well‐informed about recommended clinical practices through patients or patients' representatives, or if patients are empowered to ask for appropriate health care, it seems reasonable to believe that this can influence professional practice. Table 1 shows examples of patient‐mediated interventions, how they might influence healthcare workers' behaviour, and possible adverse effects. In Figure 1, we present a summary of various types of patient‐mediated interventions and indicate two mechanisms through which they can improve patient outcomes: directly, and indirectly through improving the care provided by health professionals. This review focuses on the latter mechanism.

Summary figure of different examples of patient‐mediated interventions and proposal of where within the healthcare system the direct interaction may take place.
| Examples of different types of patient‐mediated interventions | An example | Possible mechanisms of action | How it might have positive effects | How it might have adverse effects |
| Patient‐reported health information about own health/needs/concerns or other relevant outcomes (collecting information from patients and giving it to professionals before, or during a clinical encounter) | The patient or carer completes a questionnaire or form in the waiting area before a consultation. The doctor is then given this information before or during the consultation. | Information to healthcare professionals from patients → clinical encounter → impact on healthcare professionals' performance | Information from patients about own health/needs/concerns might ensure that professionals get important information that they might otherwise not have received. This information might prompt professionals to improve their practice and provide recommended health care. | This might distract healthcare professionals from focusing on other things or lead to longer consultations without measurable improvements in the quality of care, if the information that is collected turns out not to be important. |
| Patient information where patients are informed about recommended care | The patient is given a brochure with information about cancer screening. | Information to patient from others → clinical encounter → impact on healthcare professionals' performance | Giving recommendations or evidence to patients might lead them to ask for recommended care, and professionals might respond by providing it. | Healthcare professionals might feel threatened by this or disagree with the information given to patients. Patients might become distrustful of the healthcare professionals. |
| Patient education/ training/ counselling to increase patients' knowledge about their condition | The patient signs up for a group‐based self‐management program where she is provided with information about her condition and becomes part of a patient group for sharing of experiences to increase self‐efficacy and coping. | Activation of patient by others → clinical encounter → impact on healthcare professionals' performance | Education/training/counselling to increase patients' knowledge about their condition, which can increasing their self‐efficacy and self‐care skills. This in turn, might encourage patients to get more involved in decisions about their treatment and management and professionals might respond by providing recommended health care. | Healthcare professionals might feel threatened by this or disagree with the patient. It might increase healthcare professionals' burden if they need to spend more time finding answers to patients' questions. Patients might feel more uncomfortable if they have more questions but do not feel comfortable asking them. Patients might not like the answers they are given. This might lead to longer consultations without measurable improvements in the quality of care. |
| Patient feedback about clinical practice (collecting information from patients after an encounter) | After the patient has used a healthcare service, she might be asked about her experience with the service or doctor. This information is then fed back to the doctors and/or hospital. | Information to healthcare professionals from patients → impact on healthcare professionals' performance | Clinical performance feedback from patients might ensure that professionals get important information that they might otherwise not have received. This information might prompt professionals to improve their practice and provide recommended health care. | This might distract healthcare professionals from focusing on other things or lead to longer consultations without measurable improvements in the quality of care, if the information that is collected turns out not to be important. |
| Patient decision aids to ensure that the choices about treatment and management reflect recommended care and the patients' values and preferences | The patient is provided with information about treatment options including risks and benefits. The patient considers this information, either alone or with a healthcare professional, to reach a decision in accordance with her values and preferences. | Activation of patient by others → clinical encounter → impact on healthcare professionals' performance | Giving recommendations or evidence to patients and encouraging them to engage with their own values and preferences for treatment options might encourage healthcare professionals to provide recommended health care. | Healthcare professionals might feel threatened by this or disagree with the patient. It might increase healthcare professionals' burden if they need to spend more time finding answers to patients' questions. Patients might feel more uncomfortable if they have more questions but do not feel comfortable asking them. Patients might not like the answers they are given. This might lead to longer consultations without measurable improvements in the quality of care. |
| Patients, or patient representatives, being members of a committee or board | A patient representative from a patient organisation is, on behalf of a patient group, part of a hospital board. The board may discuss patient care and make decisions about professional practice within the hospital. | Information to healthcare professionals from patients → committee or board meeting→ impact on healthcare professionals' performance | Patients being part of a prioritisation or agenda deciding process at the health system level might influence professional practice and result in giving patients the recommended health care | Healthcare professionals on the committee or board might feel threatened by this or disagree with the patients' prioritisation or decisions. This might in turn, lead to poor implementation of recommendations or guidelines made within this format. |
| Patient‐led training or education of healthcare professionals | Patients taking part in training of doctors, e.g. to improve communication skills, how to perform physical examinations or the importance of certain clinical procedures. | Information and/or activation of healthcare professionals by patients → impact on healthcare professionals' performance | Patients being part of the education or training of healthcare professional might influence professional practice and result in providing recommended health care | Healthcare professionals might feel threatened by this or disagree with the patient trainer or educator. This might result in non‐adherence to the care recommended in this training or education. |
Why it is important to do this review
Allthough many systematic reviews exist that have assessed the effect of different patient involvement or patient‐directed interventions, these have mainly focused on patient outcomes, such as satisfaction, well‐being, and health. For example, there are series of Cochrane reviews on patient education/self‐management programs for various conditions, including musculoskeletal‐related conditions (Kroon 2014; Parreira 2017; Poquet 2016), lung‐related conditions (Kelly 2018; Lenferink 2017; McCallum 2017; Peytremann‐Bridevaux 2015; Zwerink 2014), stroke (Fryer 2016), heart‐related conditions (Anderson 2017; Clarkesmith 2017), diabetes type 2 (Attridge 2014; McBain 2016), and cancer‐related conditions (Bennett 2016). The purpose of our review, however, is to assess the effect patients can have on healthcare professionals' performance. Similiarly, there are Cochrane reviews on interventions to promote shared decision‐making (Légaré 2014) and a patient‐centred approach (Dwamena 2012), but these have not focused on the effects on professional practice, i.e. adherence to clinical practice guidelines or recommendations.
Previous systematic reviews have covered patient‐mediated interventions as one of a wide range of interventions aimed at improving professional practice (Davis 1995; Grimshaw 2004; Oxman 1995). Some studies have found mixed effects on professional practice for patient‐mediated interventions (Davis 1995; Oxman 1995), while others have reported moderate to large effects (Grimshaw 2004). The certainty of the evidence in these systematic reviews varies, but is generally low, making it impossible to draw firm conclusions about the effectiveness of these interventions. It is important to do this review as there are, to our knowledge, no recently updated systematic reviews that have assessed the effectiveness of patient‐mediated interventions on healthcare professionals' practice.
Objectives
To assess the effects of patient‐mediated interventions on healthcare professionals' clinical performance (adherence to clinical practice guidelines or recommendations).
Methods
Criteria for considering studies for this review
Types of studies
We included randomised and cluster‐randomised studies comparing a patient‐mediated intervention to no intervention, usual care or other interventions to improve professional practice.
We included full‐text studies, conference abstracts, and unpublished data.
Types of participants
We included practicing healthcare professionals and those in postgraduate training responsible for patient care. We excluded undergraduate students or non‐professional (lay) healthcare workers.
Types of interventions
Types of interventions included
Interventions aimed at changing the performance of healthcare professionals through interactions with patients, or information provided by or to patients, including:
-
patient‐reported health information where patients provide information about their own health, concerns, or needs before a clinical encounter;
-
patient information where patients are informed about recommended care;
-
patient education/training/counselling to increase patients' knowledge about their condition;
-
patient feedback about clinical practice;
-
patient decision aids to ensure that the choices about treatment and management reflect recommended care and the patients' values and preferences;
-
patients being members of committees or boards;
-
patient‐led training or education of healthcare professionals.
See Table 1 for more detailed information and examples.
We excluded studies where patient‐mediated intervention was a small component in a multi‐component package. We also excluded studies that did not include authentic patients (such as studies including standardised or simulated patients).
Types of comparisons included
We included studies where patient‐mediated interventions were compared with common practice/usual care, or any other intervention to improve professional practice (including comparisons of different types of patient‐mediated interventions).
Types of outcome measures
Primary outcomes
Adherence to recommended clinical practice or clinical practice guidelines by healthcare professionals.
Secondary outcomes
We only included studies that reported relevant primary outcomes. Thus, we extracted secondary outcomes from studies that also reported on adherence to recommended clinical practice or clinical practice guidelines.
-
Patient outcomes
-
health outcomes
-
satisfaction with the care they receive
-
acceptance, confidence in, or satisfaction with the intervention
-
experiences/perceptions of healthcare professionals' acceptance, confidence in or satisfaction with the intervention
-
-
Healthcare professional outcomes
-
satisfaction with the care they provide
-
acceptance, confidence in or satisfaction with the intervention
-
We also included data on resource use, adverse events and issues of equity in the included studies.
Search methods for identification of studies
Electronic searches
We searched the following electronic databases for primary studies without any language or time limits.
-
The Cochrane Central Register of Controlled Trials (CENTRAL), part of the Cochrane Library (www.cochranelibrary.com) (searched March 10, 2017)
-
MEDLINE and Epub Ahead of Print, In‐Process & Other Non‐Indexed Citations and Daily 1946 to August 24, 2018, Ovid (searched August 28, 2018 with time limit up to March 10, 2018)
We tested whether or not to search Embase, using the phrase 'patient mediated' in title and abstract. We screened all records that were unique to Embase, found none to be eligible and therefore omitted Embase from our search.
See Appendix 1 for all strategies used, including the MEDLINE strategy, which was peer reviewed using the Peer Review of Electronic Search Strategies (PRESS) checklist (Sampson 2008).
Searching other resources
Grey literature (searched October 2017)
-
Open Grey (www.opengrey.eu)
-
Grey Literature Report (www.greylit.org)
-
Google Scholar (scholar.google.com)
Trial registries (searched September 2017)
-
International Clinical Trials Registry Platform (ICTRP), Word Health Organization (WHO) (www.who.int/ictrp)
-
ClinicalTrials.gov, US National Institutes of Health (NIH) (clinicaltrials.gov)
We also:
-
screened the reference lists of all included studies for relevant studies;
-
conducted cited reference searches for all included studies using Web of Science, Clarivate Analytics (searched October 2017).
An Information Specialist (MJ) and a review author (MSF) carried out the searches.
Data collection and analysis
Selection of studies
Two review authors (MSF and TKD) screened titles and abstracts independently to assess which studies met the inclusion criteria. We retrieved full‐text copies of all papers that were potentially relevant, including those where the description of the population, intervention, comparison or outcomes was insufficient in the abstract to make a decision about inclusion. Review authors MSF and TKD independently assessed the full‐text copies of the papers for relevance. We resolved any disagreements by discussion and consensus with a third review author (AF). We kept a log of the selection process to complete a PRISMA flow diagram (Moher 2009) using Covidence (Covidence) (see Figure 2). We described studies that initially appeared to meet the inclusion criteria but later were excluded, including the reasons for exclusion, in the Characteristics of included studies table.

Study flow diagram.
Data extraction and management
Review authors MSF and TKD independently extracted data from each included study using a modified version of the EPOC Data Collection Checklist (EPOC 2017a). We resolved any disagreements by discussion and by consensus. When needed, a third review author (AF) was consulted. Missing or unclear data from a published study were marked clearly on the data collection form. Missing or unclear data were sought from the corresponding author of a published paper.
Assessment of risk of bias in included studies
Review authors MSF and TKD independently assessed the risk of bias in accordance with the Cochrane Handbook for Systematic Reviews of Interventions (Higgins 2011), and in line with the Cochrane Effective Practice and Organisation of Care Group suggested risk of bias criteria (EPOC 2017b). We resolved any discrepancies through discussion.
We assessed the risk of bias according to the following domains:
-
random sequence generation;
-
allocation concealment;
-
blinding of participants and personnel;
-
blinding of outcome assessment;
-
incomplete outcome data;
-
selective outcome reporting;
-
other biases (for cluster‐randomised studies, we judged five additional sources of potential biases under "other biases").
We judged each potential source of bias as high, low, or unclear and provided a quote from the study report together with a justification for our judgement in the 'Risk of bias' table.
Assessment of bias in conducting the systematic review
We conducted the review according to the published protocol and report any deviations from it in the Differences between protocol and review section of the systematic review.
Measures of treatment effect
For the dichotomous outcomes, we analysed data based on the number of events and the number of people or cases assessed in the intervention and comparison groups. We used these to calculate the risk ratio (RR) with 95% confidence interval (CI). For continuous outcomes, we analysed the data based on the mean, standard deviation (SD) and number of people assessed for both the intervention and comparison groups to calculate mean difference (MD) and 95% CI.
All relevant outcomes reported in the studies were collected along with data on how they were measured (self‐report, medical record, other objective primary or secondary outcome). For all relevant primary and secondary outcomes, we extracted the intervention effect estimates with relevant CIs, and the method of statistical analysis used to calculate it, as reported by the authors of the study. We extracted data from all time points and categorised them into one of three follow‐up time intervals (0 to 3 months, more than 3 months to 12 months, more than 12 months). Studies reporting one outcome in multiple follow‐up intervals were only reported once in our meta‐analyses, with the longest follow‐up. Alos, if a study reported multiple data within one interval, we used the data with the longest follow‐up within that interval.
When the same study reported more than one relevant primary outcome (adherence outcome), we used the primary outcome as defined by the study authors. If a primary outcome was not clearly defined or multiple outcomes were defined as primary or secondary outcomes, we calculated and used the median value from all relevant primary outcomes. When calculating the median from even numbers of outcomes, we chose the outcome with reporting from the most participants. In cases where the number of participants contributing to the outcome was the same, we randomly selected the outcome (flipping coin).
Unit of analysis issues
We found eligible studies with cluster designs (studies in which the unit of allocation is not a person, but a group of people for instance in a clinic). Studies in which comparisons are allocated as groups of people should account for clustering in their analysis. Standard statistical methods assume independence of observation, and for cluster‐design studies the use of these will generally result in artificially small P values and overly narrow CIs for the effect estimates (Ukoumunne 1999), if analysed at the individual level rather than at the cluster level.
We re‐analysed studies with potential unit of analysis errors by using the information on the size number of clusters and the value of the intra‐cluster correlation coefficient (ICC). If no ICC was reported, we used the median ICC value from similar studies found in the University of Edinburgh's Database of ICCs (ABDN 2015). We used the following formula, as suggested by Cochrane Handbook for Systematic Reviews of Interventions (Higgins 2011): n patients / (1 + ICC (average cluster size ‐1)).
Dealing with missing data
We attempted to contact study authors in order to verify key study characteristics and to obtain missing numerical outcome data where possible. In cases where this was unsuccessful, we have reported the data as 'not reported' and have not attempted to impute the missing values. The potential impact of the missing data is explored in the 'Assessment of risk of bias' section of the review.
Assessment of heterogeneity
By examining study populations, interventions and outcomes, we considered if the studies were similar enough to be pooled in a meta‐analysis. We assessed the degree of statistical heterogeneity by visual examination of the scatter of effect estimates on forest plots and by using the Chi2 and I2 statistics (Higgins 2003).
Assessment of reporting biases
The tendency for inconclusive results to remain unpublished may impact the findings of a systematic review. We attempted to obtain study protocols to assess selective outcome reporting. Another important factor that might introduce biases is the small‐study effects. We planned to use funnel plots to assess small‐study effects for 10 or more studies investigating a particular outcome according to Egger 1997 (for continuous outcomes) and Harbord 2006 (for dichotomous outcomes). A funnel plot was created for the patient information comparison which had 12 studies in the meta‐analysis Figure 3. Even though we did not find clear evidence for a publication bias, we cannot rule out the possibility. Also, we failed to find more studies with few participants and negative effect estimates, and we should therefore be cautious when we interpret that we have little to indicate a potential publication bias in our result.

Funnel plot of comparison: 2 Patient information interventions versus comparisons, outcome: 2.1 Adherence to recommended practice.
Data synthesis
We grouped patient‐mediated interventions according to the six categories listed under Types of interventions, and categorised the interventions of the included studies accordingly. We then prepared tables summarising the findings of studies for each type of relevant primary and secondary outcome.
We prepared separate meta‐analyses for each type of intervention and visualised the different types of comparisons in the forest plot.
We carried out the meta‐analyses by using Review Manager 5 (RevMan 2014). We used random‐effects meta‐analysis for combining data, as we anticipated that there may be natural heterogeneity between studies attributable to the variation across similar interventions, populations and implementation strategies. For continuous variables, we used the inverse‐variance method while for dichotomous variables we used the method proposed by Mantel‐Haenszel.
For the included studies with three or more arms, we only extracted data from the two most relevant comparisons for our question.
Summary of findings
We summarised the findings of the different types of patient‐mediated interventions for the following outcomes in 'Summary of findings' tables.
-
Adherence to recommended clinical practice or clinical practice guidelines by healthcare professionals
-
Patient health outcomes (desirable and undesirable health outcomes)
-
Patients' satisfaction with the care they receive
-
Adverse events
-
Resource use
Two review authors (MSF and TKD) independently assessed the certainty of the evidence (high, moderate, low, and very low) using the five GRADE considerations (study limitations, consistency of effect, imprecision, indirectness, and publication bias). We used methods and recommendations described in Section 8.5 and Chapter 12 of Higgins 2011 and the EPOC worksheets (EPOC 2017c), using GRADEpro software (GRADEpro GDT 2015). We resolved disagreements on certainty ratings by discussion and consulted a third review author (AF) when disagreement persisted. Our decisions to down‐ or upgrade are presented in footnotes in the tables. We used plain language statements to report these findings in the review (EPOC 2017d).
Subgroup analysis and investigation of heterogeneity
We assessed heterogeneity between studies by visually inspecting forest plots and, if possible, by performing subgroup analyses (see below). Since the importance of inconsistency depends on several factors, we used the guide to interpret heterogeneity as outlined in the Cochrane Handbook for Systematic Reviews of Interventions (Higgins 2011): 0% to 40% might not be important; 30% to 60% may represent moderate heterogeneity; 50% to 90% may represent substantial heterogeneity; and 75% to 100% would be considerable heterogeneity.
When the effect estimates varied considerably across studies of similar types of patient‐mediated interventions, we explored whether the following factors could explain the observed variation.
-
Direction of change required (increase current behaviour, decrease current behaviour, mix, or unclear). Hypothesis: effect on increasing a behaviour is larger than that on decreasing behaviour.
-
Recipient (physician; other healthcare professionals). Hypothesis: clinical practice is more difficult to change among physicians than among non‐physicians.
-
Risk of bias (high; unclear; low). Hypothesis: effect sizes are smaller when risk of bias is low.
-
Baseline clinical performance (continuous measure of healthcare professionals' compliance with recommended clinical practice or clinical guidelines). Hypothesis: when baseline clinical performance is low, effect sizes are larger.
Sensitivity analysis
We did not perform any sensitivity analysis.
Results
Description of studies
See Characteristics of included studies; Characteristics of excluded studies.
Results of the search
We identified a total of 12,247 records from the electronic and supplementary searches (11,003 from electronic database searching and 1244 of additional records identified through clinicaltrial.gov (1040) and ICTRP (81), Open Grey (85), Grey Litterature Report (7) and Google Sholar (31)) Figure 2. Two review authors (MSF and TKD) independently screened 12,247 titles and abstracts and found 12,107 records to be irrelevant and these were directly excluded. Full‐text publications were retrieved for 139 of the 140 potential relevant studies. For one study we only had information presented in an abstract (Caskey 2011). We included 25 studies (Alder 2005; Aragones 2010; Brody 1990; Caskey 2011; Christy 2013; Goldberg 2012; Herman 1995; Jacobson 1999; Kattan 2006; Kenealy 2005; Khan 2011; Kravitz 2012; Krol 2004; Leveille 2009; Mazonson 1996; McAlister 2005; McKinstry 2006; Miaskowski 2004; Mouland 1997; Nagykaldi 2012; Quinn 2008; Thiboutot 2013; Thomas 2003; Turner 1990; Wright 2012). We also identified two ongoing studies (NCT01904656; NCT02686775).
Included studies
The 25 included studies are described in detail in the Characteristics of included studies.
Study design
Fifteen studies were randomised at the individual level. Twelve of these studies had the patient as the unit of randomisation (Alder 2005; Christy 2013; Jacobson 1999; Kattan 2006; Khan 2011; Kravitz 2012; Leveille 2009; McKinstry 2006; Miaskowski 2004; Mouland 1997; Quinn 2008; Thomas 2003), and three had the healthcare professional as the unit (Aragones 2010; Goldberg 2012; Turner 1990). Ten studies were cluster‐randomised studies. Among the cluster‐randomised studies, five had the healthcare professional as the unit of randomisation (Caskey 2011; Kenealy 2005; Krol 2004; Mazonson 1996; Thiboutot 2013), and five had the healthcare practice as the unit of randomisation (Brody 1990; Herman 1995; McAlister 2005; Nagykaldi 2012; Wright 2012). Cluster‐randomisation may lead to misleading findings unless the results are adjusted for clustering effects. The idea is to reduce the size of each trial to its ‘effective sample size’ to prevent artificially small P values. To prevent this 'unit of analysis error' caused by clustering, we re‐analysed the studies included in our meta‐analyses by using the information on the number of clusters and the assumed value of the intra‐cluster correlation coefficient (ICC). We have analysed the impact of clustering effects among all the ten cluster‐randomised studies. For the five studies in which healthcare professionals were the unit of randomisation (Caskey 2011; Kenealy 2005; Krol 2004; Mazonson 1996; Thiboutot 2013), the median ICC among similar studies for our primary outcome was 0.000 (95% CI; 0, 0.142) according to the University of Edinburgh's Database of ICCs (ABDN 2015). The effective sample sizes of these studies were thus the same as reported by the study authors. The effective sample size for the five studies in which the healthcare practice was the unit of randomisation (Brody 1990; Herman 1995; McAlister 2005; Nagykaldi 2012; Wright 2012), the median ICC among similar studies for our primary outcome in the University of Edinburgh's Database of ICCs (ABDN 2015) was 0.076 (95% CI, 0, 0.219). We did not attempt to re‐analyse studies that were not pooled in a meta‐analysis (Brody 1990; Nagykaldi 2012). The effective total sample sizes for the three cluster‐randomised studies included in our meta‐analyses (Herman 1995; McAlister 2005; Wright 2012) were calculated and are listed in Table 2.
| Study | Primary outcomes | Findings |
| Antibiotic prescriptions (Recommended clinical practice is less antibiotic prescriptions to children with ear‐nose‐throat infections) | Author’s quote: “A significant protective effect is demonstrated for the SCT‐based communication intervention (OR = 0.171, p = 0.042)” N= 40 (20 patients in each comparison group). | |
| Physician recommendation of colorectal cancer screening (Recommended clinical practice is to increase screening) | Intervention: 19/31 (61.3%) Comparison: 14/34 (41.2%) Outcome also included in meta‐analysis | |
| Number of counselling items done by healthcare professional (Desired practice is more counselling of people with mental problems) | Patient‐reported Intervention: 2.8 (se=1.62), N= 29 Comparison: 2.9 (se=1.41), N= 50 Healthcare professional reported Intervention: 2.8 (se=1.62), N= 29 Comparison: 2.9 (se=1.41), N= 50 ** did not attempt to accounting for clustering because the study was not pooled in a meta‐analysis | |
| Pertussis (Tdap) vaccination (Desired practice is to increase vaccination) | Intervention: 89/687 (13%) Comparison: 76/715 (10.6%) Outcome also included in meta‐analysis ** with accounting for clustering (ICC = 0.000), the effective total sample size remained the same | |
| 1. Primary care provider write an order for a colorectal cancer screening test 2. Doctor recommended fecal occult blood test (FOBT) 3. Doctor recommended colonoscopy (Desired practice is to increase screening) | 1. Doctor recommendation of FOBT: OR=1.15 (95% CI: 0.81, 1.63), p=0.420 | |
| 1. Correctly identified level of chronic asthma control 2. Correctly identified child’s asthma trajectory 3. Correctly identified level of medication adherence 4. Correctly identified degree of disease burden to the family (Desired practice is more accurate identification of asthma morbidity) | 1. Intervention: 17/40 (43%) Comparison: 7/37 (19%) 2.* Intervention: 29/40 (72%) Comparison: 17/37 (45%) 3. Intervention: 29/40 (72%) Comparison: 18/37 (48%) 4. Intervention: 30/40 (74%) Comparison: 13/37 (35%) * outcome also included in meta‐analysis (median outcome) | |
| 1. Number of women offered mammogram 2. Number of women offered clinical breast exam 3. Number of women offered mammogram among those not previously having a mammogram 4. Number of women with a documented clinical breast exam among those not previously having a clinical breast exam (Desired practice is to increase preventive services) | 1. Intervention: 28.4%, N=not reported Comparison: 19.4%, N=not reported 2. Intervention:25%, N=not reported Comparison: 17.9%, N=not reported 3. Intervention: 50/159 (31.4%) Comparison: 29/161 (18%) 4.* Intervention: 40/183 (21.9%) **3/13 when adjusted for clustering Comparison: 34/192 (17.9%) **2/13 when adjusted for clustering * outcome also included in meta‐analysis (median outcome of 3 and 4). ** with accounting for clustering (ICC=0.076), the effective total sample size was 39 patients (13 patients to each group, if evenly distributed between 3 arms). | |
| 1. Clinician recommended vaccine 2. Administration of the vaccine at that clinic visit (Desired practice is to increase vaccination) | 1. Intervention: 60/221 (27.1%) Comparison: 13/212 (6.1%) 2.* Intervention: 44/221 (19.9%) Comparison: 8/212 (3.8%) * outcome also included in meta‐analysis (primary outcome defined by study author) | |
| Change in medication when indicated by NAEPP guideline recommended practice (Change according to recommended clinical practice) | Intervention: 105 persons stepped up per 1332 step‐up letters* sent to providers Comparison: 49 persons stepped up per 1117 “non‐sent potential” step‐up letters* sent to providers *identified cases in need of stepping up medication (referred to as step‐up letters that could have been sent 1‐6 times per patient that needed step‐up) | |
| Diabetes screening of eligible patients who visited a family practitioner (Recommended clinical practice is to increase screening of eligible people) | Intervention: 392/1639 (23.9%) Comparison: 240/1550 (15.5%) Outcome also included in meta‐analysis ** with accounting for clustering (ICC = 0.000), the effective total sample size remained the same | |
| 1. Diabetes medication prescriptions 2. Hypertension medications (Desired practice is intensification of diabetes therapy) | 1.* Intervention: 51/53 (96.2%) Comparison: 35/47 (74.5%) 2. Intervention: 43/53 (81.1%) Comparison: 30/47 (63.8%) * outcome also included in meta‐analysis (median outcome) | |
| Physician‐directed adjustment in analgesia | Intervention: 75/125 (60%) Comparison: 48/132 (36.4%) Outcome also included in meta‐analysis | |
| 1. Stopped or reduced PPI dose 2. Stopped prescribed PPI 3. Had increased PPI dose (Desired practice is reduction in PPI medication) | 1.* Intervention: 12/54 (22.2%) Comparison: 3/44 (6.8%) 2. Intervention: 7/54 (13%) Comparison: 2/44 (4.5%) 3. Intervention: 3/54 (5.6%) Comparison: 6/44 (13.6%) * outcome also included in meta‐analysis (primary outcome defined by study author) ** with accounting for clustering (ICC = 0.000), the effective total sample size remained the same | |
| Screened condition identified at the index visit (Desired practice is to increase identification of mental problems) | Intervention: 69/115 (60%) Comparison: 65/118 (55.1%) Outcome also included in meta‐analysis | |
| Recognition of mental health problems (Desired practice is to increase identification of mental problems) | Intervention: 114/357 (31.9%) Comparison: 40/216 (18.5%) Outcome also included in meta‐analysis ** with accounting for clustering (ICC = 0.000), the effective total sample size remained the same | |
| 1. The proportion of patients whose therapy met the ACCP treatment recommendations – at 3 months 2. The proportion of patients whose therapy met the ACCP treatment recommendations – at 12 months | 1. Intervention: 89/219 (40.6%) Comparison: 79/215 (36.7%) 2.* Intervention: 70/219 (32%) Comparison: 80/215 (37.4%) * outcome also included in meta‐analysis (secondary outcome defined by study authors, but we predefined in our protocol that we would choose the outcome with the longest follow‐up as our primary outcome.) | |
| 1. Proportion of patients prescribed statins according to guideline 2. Proportion of patients prescribed aspirin according to guideline (Recommended clinical practice is adherence to hypertension treatment Guidelines) | 1.* Intervention: 39/134 (29%) Comparison: 54/142 (38%) 2. Intervention: 53/88 (60%) Comparison: 55/95 (58%) * outcome also included in meta‐analysis (median outcome) | |
| Appropriate analgesic prescription (around the clock plus as needed) | Intervention: 34/92 (37%) Comparison: 26/80 (32.5%) Outcome also included in meta‐analysis | |
| 1. No benzodiazepines prescription 2. 50‐90% reduction in benzodiazepines prescriptions 3. 0‐49% reduction in benzodiazepines prescriptions 4. Increase in benzodiazepines prescriptions 5. Average prescriptions of benzodiazepines (defined daily doses) (Recommended clinical practice is less benzodiazepines prescriptions in mental health) | 1.* Intervention: 29/92 (32%) Comparison: 6/63 (10%) 2. Intervention: Approximately 25%, N=92 Comparison: Approximately 22%, N=63 3. Intervention: Approximately 36%, N=92 Comparison: Approximately 47%, N=63 4. Intervention: Approximately 8%, N=92 Comparison: Approximately 20%, N=63 5. Intervention: Before: 24.63 DDD/month (range 5‐80). After: 12.40 DDD/ month (range 0‐70), N=92 Comparison: Before: 29.02 ODD/ month (range 4‐108). After: 22.39 DDD/ month (range 0 ‐ 102), N=63 * outcome also included in meta‐analysis (the only relevant outcome reported dichotomously with complete numbers) | |
| 1. Adults provided all recommended preventive services 2. Adults given low dose aspirin, if indicated 3. Adults given Pneumococcal vaccination because of chronic health conditions 4. Adults given Pneumococcal vaccination because of chronic health conditions 5. Children given all recommended immunizations (Desired practice is increased coverage of preventive services) | 1. Intervention: 84.4%, N=not reported Comparison: 67.6%, N=not reported 2. Intervention: 78.6%, N=not reported Comparison: 52.3%, N=not reported 3. Intervention: 82.5%, N=not reported Comparison: 53.9%, N=not reported 4. Intervention: 86.3%, N=not reported Comparison: 44.6%, N=not reported 5. Intervention: 95.5%, N=not reported Comparison: 87.2%, N=not reported ** did not attempt to accounting for clustering because the study was not pooled in a meta‐analysis | |
| 1. Medications titrated or changed by their healthcare professional 2. Medication errors identified by their healthcare professional (Desired practice is to follow prescribing guidelines) | 1.* Intervention: 11/13 (84.6%) Comparison: 3/63 (23.1%) 2. Intervention: 7/13 (53.4%) Comparison: 0/13 (0%) * outcome also included in meta‐analysis (median outcome) | |
| 1. Perform serum creatinine tests 2. Perform urine protein tests 3. Perform serum potassium tests 4. Doctor recommended starting a new blood pressure medication 5. Doctor recommended increasing dose of a blood pressure medication (Desired practice is medication intensification among patients whose blood pressure was not at target) | 1. Intervention: 211/282 (74.8%) Comparison: 156/218 (71.6%) 2.* Intervention: 86/282 (30.5%) Comparison: 58/218 (26.6%) 3. Intervention: 209/282 (74.1%) Comparison: 153/218 (70.2%) 4. Intervention: 21/179 (11.7%) Comparison: 13/149 (8.7%) 5. Intervention: 18/168 (10.7%) Comparison: 13/144 (9%) * outcome also included in meta‐analysis (median outcome) ** with accounting for clustering (ICC = 0.000), the effective total sample size remained the same | |
| Primary care physician recommended vaccine (Recommended clinical practice is to increase vaccination) | Intervention: 64/189 (33.9%) Comparison: 24/182 (13.2%) Outcome also included in meta‐analysis | |
| 1. Perform pap‐smear 2. Perform breast exam 3. Schedule mammography 4. Stool occult test 5. Give influenza vaccine 6. Give pneumococcal vaccine (Recommended clinical practice is to increase vaccination) | 1. Intervention: 28/94 indicated (29.8%) Comparison: 30/151 indicated (19.9%) 2. Intervention: 44/84 indicated (52.4%) Comparison: 58/118 indicated (49.2%) 3. Intervention: 18/147 indicated (12.2%) Comparison: 25/130 indicated (19.2%) 4.* Intervention: 86/132 indicated (65.2%) Comparison: 91/196 indicated (46.4%) 5. Intervention: 59/86 indicated (68.6%) Comparison: 51/177 indicated (28.8%) 6. Intervention: 19/86 indicated (22.1%) Comparison: 29/118 indicated (24.6%) * outcome also included in meta‐analysis (median outcome) | |
| 1. Give influenza vaccines 2. Perform mammography 3. Perform pap smears 4. Give pneumococcal vaccine 5. Test bone density 6. Test cholesterol (Recommended clinical practice is to increase vaccination) | 1.* Intervention: 50/227 (22%) Comparison: 40/285 (14%) 2. Intervention: 51/105 (48.6%) Comparison: 28/95 (29.5%) 3. Intervention: 25/61 (41%) Comparison: 7/67 (10.4%) 4. Intervention: 11/86 (12.8%) Comparison: 10/113 (8.9%) 5. Intervention: 2/24 (8.3%) Comparison: 3/132 (2.3%) 6. Intervention: 20/43 (46.5%) Comparison: 14/48 (29.2%) * outcome also included in meta‐analysis (median outcome) |
Most of the studies had two comparison arms, except for Brody 1990, Herman 1995 and Thomas 2003, which had three arms, and Alder 2005 and Kenealy 2005, which had four arms. We selected and analysed data from two relevant arms per study (see Characteristics of included studies for description).
Population/participants
Patients
The total number of patients included in the studies of this review was 12,268 (the total number of patients would be 16,700 if we had included all comparison arms in the studies). The included sample size varied from 40 participants (Alder 2005) to 3189 (Kenealy 2005). The number of patients contributing to our meta‐analyses for the primary outcome is 8749. Ten studies were on preventive care with a general patient population (Caskey 2011; Nagykaldi 2012; Turner 1990; Wright 2012) or an 'at risk' patient population (Aragones 2010; Christy 2013; Herman 1995; Jacobson 1999; Kenealy 2005; Thomas 2003), of which all except one study (Jacobson 1999) defined risk based on an age‐threshold, often 50 years or older. One study, which was on vaccination, defined 'at risk' as having a chronic condition. The preventive service provided in the studies included cancer screening (Aragones 2010; Christy 2013; Herman 1995), diabetes screening (Kenealy 2005), vaccination (Caskey 2011; Jacobson 1999; Nagykaldi 2012; Thomas 2003), and both vaccination and cancer screening (Turner 1990; Wright 2012). Fifteen studies were on identification, treatment or management of patients with certain conditions such as mental health problems (Brody 1990; Mazonson 1996; Mouland 1997), asthma (Goldberg 2012; Kattan 2006), diabetes (Khan 2011; Quinn 2008), cancer (Kravitz 2012; Miaskowski 2004), hypertension (McKinstry 2006; Thiboutot 2013), heart‐related disease (McAlister 2005), dyspepsia (Krol 2004), and musculoskeletal pain, depression and mobility difficulty (Leveille 2009), and upper respiratory tract symptoms (Alder 2005).
Most studies included adult patients except for three studies (Alder 2005; Goldberg 2012; Kattan 2006) in which the children's mean age varied between three years (Alder 2005) and seven/eight years (Goldberg 2012; Kattan 2006). The total number of children included in our analyses was 1054. In two of these three studies the children were mostly female (Alder 2005; Goldberg 2012). Among the 22 studies with adult patients, 18 studies had a mean patient age of 50 years or more. The mean patient age was below 50 years in three studies (Mazonson 1996; Quinn 2008; Wright 2012), and age was not reported in one study (Caskey 2011). In seventeen of the 22 studies with adult patients over fifty per cent of participants were women. One study recruited only women (Herman 1995), one study did not report on gender (Caskey 2011), and three studies included mostly men (Kenealy 2005; Khan 2011; McAlister 2005). Among the 25 included studies one study recruited only Latino immigrants (Aragones 2010), and another study only African‐Americans (Christy 2013).
Healthcare professionals
All studies involved physicians, but in five studies nurses and physician assistants were also included (Jacobson 1999; Kattan 2006; McKinstry 2006; Nagykaldi 2012; Thomas 2003). The number of healthcare professionals included in the studies was not consistently reported, but for the studies where this information was available the total number ranged from 8 to 167 (see Characteristics of included studies for further details).
Settings
All studies were carried out in the USA apart from five: one in Canada (McAlister 2005), in New Zealand (Kenealy 2005), in Norway (Mouland 1997), in Scotland (McKinstry 2006), and in the Netherlands (Krol 2004). Most studies were conducted in a primary care setting. Three studies were within both specialist and primary care settings (Kattan 2006;Kravitz 2012; Miaskowski 2004), and one study was within specialist care (Goldberg 2012).
Interventions and comparisons
Interventions
We categorised six studies as patient‐reported health information interventions (Brody 1990; Goldberg 2012; Kattan 2006; Kenealy 2005; Mazonson 1996; Quinn 2008). We categorised 13 studies as patient‐information interventions. These included written or electronic reminders, prompts, handouts, posters etc. (Caskey 2011; Herman 1995; Jacobson 1999; Krol 2004; Leveille 2009; McKinstry 2006; Mouland 1997; Turner 1990; Wright 2012) or video or web‐based information (Aragones 2010; Christy 2013; Nagykaldi 2012; Thomas 2003). Five studies were patient‐education interventions (Alder 2005; Khan 2011; Kravitz 2012; Miaskowski 2004; Thiboutot 2013). These varied greatly in content from electronic based education or training (Khan 2011; Thiboutot 2013), to in‐person communication or coaching interventions (Alder 2005; Kravitz 2012), to a multi session nurse‐led patient‐education intervention (Miaskowski 2004). The remaining study was about patient decision aids (McAlister 2005).
We did not identify any studies fulfilling our inclusion criteria that involved other patient‐mediated interventions such as patient feedback about clinical practice, patients being members of committees or boards, or patient‐led training or education of healthcare professionals.
Fourteen studies delivered the intervention at the practice site (Alder 2005; Aragones 2010; Brody 1990; Caskey 2011; Christy 2013; Goldberg 2012; Herman 1995; Jacobson 1999; Kenealy 2005; Khan 2011; Kravitz 2012; Mazonson 1996; Thomas 2003; Turner 1990). The remaining studies delivered the intervention outside the practice, including in the patient’s home, in person (Miaskowski 2004), by telephone (Kattan 2006), electronically (e‐mail or web portal) (Leveille 2009; Nagykaldi 2012; Quinn 2008; Thiboutot 2013; Wright 2012), or by post (Krol 2004; McAlister 2005; McKinstry 2006; Mouland 1997). Among the studies where the intervention was delivered outside the practice, four studies had a "one‐time delivery" of the intervention (Krol 2004; McAlister 2005; McKinstry 2006; Mouland 1997) and seven studies had continuous intervention delivery over three months or less (Kattan 2006; Leveille 2009; Miaskowski 2004; Wright 2012), or over a year (Nagykaldi 2012; Quinn 2008; Thiboutot 2013).
Comparisons
The comparisons were categorised as "no intervention" in 11 studies (Brody 1990; Caskey 2011; Goldberg 2012; Herman 1995; Kattan 2006; Kenealy 2005; Mazonson 1996; Mouland 1997; Nagykaldi 2012; Quinn 2008: Turner 1990) and "usual care" in 14 studies (Alder 2005; Aragones 2010; Christy 2013; Jacobson 1999; Khan 2011; Kravitz 2012; Krol 2004; Leveille 2009; McAlister 2005; McKinstry 2006; Miaskowski 2004; Thiboutot 2013; Thomas 2003; Wright 2012). Among the 11 studies within the "no intervention" comparison category, five studies had a "pure" "no intervention" comparison (Brody 1990; Goldberg 2012; Kattan 2006; Mazonson 1996; Nagykaldi 2012), while in the remaining six, both groups received a non‐patient‐mediated intervention component (Caskey 2011; Herman 1995; Kenealy 2005; Mouland 1997; Quinn 2008;Turner 1990). These non‐patient‐mediated intervention components were typically information or reminders given to healthcare professionals in both groups.
Among the 14 studies within the "usual care" comparison category, two studies were described as having a "usual care" comparison without further description (Aragones 2010; Krol 2004), six studies used a placebo‐like usual care‐comparison, where the comparison group typically received patient information not related to the health condition(s) being studied (Alder 2005; Jacobson 1999; Leveille 2009; Thiboutot 2013; Thomas 2003; Wright 2012) and six studies used a patient information‐like usual care‐comparison, where the comparison group was given minimal patient information about the health condition being studied as part of usual care (Christy 2013; Khan 2011; Kravitz 2012; McAlister 2005; McKinstry 2006; Miaskowski 2004). This was typically untailored or standard information brochures about the health condition being studied and could be given to both the comparison group and patient‐mediated intervention group (Kravitz 2012; McAlister 2005; McKinstry 2006) or to the comparison group only (Christy 2013; Khan 2011;Miaskowski 2004).
Outcomes
Primary outcomes
The primary outcome, adherence to recommended clinical practice, was reported in all 25 studies. The outcomes we defined as primary were defined as primary outcomes in eight studies (Caskey 2011; Goldberg 2012; Jacobson 1999; Kenealy 2005; Krol 2004; Leveille 2009; Mazonson 1996; Wright 2012), and secondary outcomes in eight studies (Aragones 2010; Christy 2013; McAlister 2005; McKinstry 2006; Miaskowski 2004; Quinn 2008; Thiboutot 2013; Thomas 2003). The outcomes were not categorised into primary and secondary outcomes in nine studies (Alder 2005; Brody 1990; Herman 1995; Kattan 2006; Khan 2011; Kravitz 2012; Mouland 1997; Nagykaldi 2012; Turner 1990). All studies except for one (Brody 1990), reported the primary outcome in a dichotomous way.
Secondary outcomes
Secondary outcomes that matched our inclusion criteria were reported in 12 of the 25 included studies (Alder 2005; Brody 1990; Herman 1995; Kattan 2006; Khan 2011; Kravitz 2012; Krol 2004; Leveille 2009; McKinstry 2006; Miaskowski 2004; Quinn 2008; Thiboutot 2013).
Eight of the 12 studies reported patient health outcomes (Brody 1990; Khan 2011; Kravitz 2012; Krol 2004; Leveille 2009; McKinstry 2006; Miaskowski 2004; Thiboutot 2013). Patient satisfaction with the care they received was reported in four studies (Alder 2005; Brody 1990; Leveille 2009; Quinn 2008), and resource use was reported in one study (Kattan 2006).
None of the included studies reported on:
-
patients' acceptance, confidence in, or satisfaction with the intervention;
-
patients' experiences / perceptions of healthcare professionals acceptance, confidence in or satisfaction with the intervention;
-
healthcare professionals' satisfaction with the care they provide;
-
healthcare professionals' acceptance, confidence in or satisfaction with the intervention;
-
adverse events;
-
equity.
For all included outcomes, we narratively report effect estimates as reported by the authors of the study (Table 2; Table 3), and also report how these data were collected (self‐report or medical record) (Characteristics of included studies).
| Study | Secondary outcomes | Findings |
| Patient satisfaction with the care they receive 1. General satisfaction 2. Interpersonal manner 3. Time spent with doctor | Author’s quote: “Significant associations were observed for General Satisfaction (p = 0.002), Interpersonal Manner (p = 0.010), and Time Spent with Doctor (p = 0.002)”. | |
| No relevant secondary outcomes reported | ||
| Patient health outcomes 1. Patients with a psychological disorder (outcome could not be categorised into our categories because desired direction not provided) 2. Control over stress Patient satisfaction with the care they receive 3. Patient report of rating of amount of time spent counselling (1=no time, 5= >15 minutes) 4. Patient report of rating of satisfaction with physician (scale range not reported, higher score means better) | 1. Intervention: 71%, N= 29 Comparison: 56%, N=50 2. Authors quote: “…52% felt they experienced some increase in their sense of control over stress following the medical visit.” “… 32% of control patients who indicated some beneficial changes in their control over stress. 3. Intervention: 2.9 (se=0.2), N= 29 Comparison: 2.5 (se=0.1), N=50 4. Intervention: 4.7 (se=0.1), N= 29 Comparison: 4.3 (se=0.1), N=50 | |
| No relevant secondary outcomes reported | ||
| No relevant secondary outcomes reported | ||
| No relevant secondary outcomes reported | ||
| No relevant secondary outcomes reported | ||
| No relevant secondary outcomes reported | ||
| Patient health outcomes Maximum symptom days (outcome could not be categorised into our categories) Resource use Intervention cost and cost effectiveness | Author’s quote: “It took 40 minutes per child to reach the caretaker and make the assessment call, enter the data, and mail the letter. In calculating the costs, we used an hourly wage of $15 for a clerical employee. There were 6 calls per child per year resulting in a cost of $60. We estimated $10 for supplies and informational materials for the PCP. Because some PCPs had 1 child in the study, the cost for these materials on a per child basis was $9.20. The intervention was estimated to cost $69.20 per child over the year. When this cost was added to the cost of health services use for the year by intervention children and compared with the cost of health service use by control children, there was a savings of $337.00 per child in the intervention group. The Monte Carlo simulations, using the observed distributions of symptom days and resource use, showed that the intervention had a 97% chance of being cost saving.” | |
| No relevant secondary outcomes reported | ||
| Patient health outcomes HbA1c (outcome could not be categorised into our categories) | Intervention: Before: 9.1 (sd=2.5). After: 7.6 (sd=1.8), N= 53 Comparison: Before: 9.4 (sd=2.7). After: 8.6 (sd=2.5), N=47 | |
| Patient health outcomes 1. Pain severity 2. Pain‐related impairment | 1. Pain severity. Coefficient 0.05 (95% CI ‐0.39, 0.49) p=0.81. Pain severity is the mean of worst and average pain, scaled 0‐10, with 10 representing maximal pain (Intervention group N= 126, comparison group N= 132) 2. Pain‐related impairment. Coefficient ‐0.08 (95% CI ‐0.28, 0.12) p=0.44. Pain impairment is scaled 1‐5, with 5 representing maximal impairment (Intervention group N= 126, comparison group N= 132) | |
| Patient health outcomes 1. Dyspesia severity is high 2. Mental health (RAND‐36, higher score means a more favourable health state) 3. Vitality (RAND‐36, higher score means a more favourable health state) | 1. Intervention: Before: 29/63. After: 19/59 Comparison: Before 23/50. After: 20/45 2.* Intervention: Before: 23.5, N=63. After: 22.6, N= 59 Comparison: Before: 24, N=50. After: 23.1, N=45 3.* Intervention: Before: 17, N=63. After: 16.5, N= 59 Comparison: Before: 16, N=50. After: 16.4, N=45 | |
| Patient satisfaction with the care they receive (at 1 week) 1. Rate the medical care in visit (on a 1‐10 scale, 10 is best) 2. Doctor definitely showed concern about health/feelings 3. Doctor definitely spent enough time Patient health outcomes (at 3 months) 4. Fair to poor health 5. Pain subscale SF‐36 (moderate‐severe) 6. Average pain rating (on a 1‐10 scale, 10 is most) (outcome could not be categorised into our categories) | 1. Intervention: 9.4 (sd=0.9), N=94 Comparison: 9.1 (sd=1.1), N=92 2. Intervention: 86/94 Comparison: 82/92 3. Intervention: 75/94 Comparison: 68/92 4. Intervention: Before: 19/71. After: 17/71 Comparison: Before: 15/71. After: 13/71 5. Intervention: Before: 40/64. After: 36/64 Comparison: Before: 38/59. After: 35/59 6. Intervention: Before: 4.5 (sd=2.2). After: 3.3 (sd=2.9), N= 64 Comparison: Before: 5.1 (sd=2.0). After: 3.8 (sd=3.1), N=59 | |
| No relevant secondary outcomes reported | ||
| No relevant secondary outcomes reported | ||
| Patient health outcomes 1. Blood pressure (controlled, systolic and diastolic) 2. Cholesterol (outcome could not be categorised into our categories) | 1. Intervention: Controlled: Before: 64/148, after: 71/131. Systolic: Before: 147 mmHg (sd=19), N=148, after: 148 mmHg (sd=22), N= 131. Diastolic: after: 84 mmHg (sd=10), after: 80 mmHg (sd=12), N=131 Controlled: Before: 69/146, after: 71/130 Systolic: Before: 146 mmHg (sd=19), N=146, after: 148 mmHg mmHg (sd=21), N=130 Diastolic: Before: 82 mmHg (sd=11), N=146, after: 80 mmHg (sd=12), N=130 2. Intervention: Before: 5.4 (sd=1.2), N= 148, after: 5.2 mmol/L (sd=1.0), N=131 Comparison: Before: 5.4 (sd=1.1), N= 146, 5.2 mmol/L (sd=1.1), N=130 | |
| Patient health outcomes (average pain) | Author’s quote: “For average pain, a significant group time interaction (P < 0.0001) as well as significant main effects of group (P < 0.026) and time (P < 0.0001) were found. Tests of simple effects within the two groups showed a significant decrease in average pain scores over time in the intervention group (P < 0.0001) but not in the standard care group (P = 0.857).” Self‐report before bedtime for 6 weeks using a descriptive numeric rating scale that ranged from 0 (none) to 10 (excruciating). | |
| No relevant secondary outcomes reported | ||
| No relevant secondary outcomes reported | ||
| Patient health outcomes 1. HbA1c 2. Depression diagnosis (outcome could not be categorised into our categories because desired direction not provided) Patient satisfaction with the care they receive 3. Healthcare provider's diabetes management improved by receipt of blood sugar measurements (patient survey) | 1.* Intervention: Before: 9.51%. After: 7.48%, N=13 2. Intervention: 1/13 (9.1%) Comparison: 3/13 (20%) 3. Intervention: 13/13 (100%) Comparison: 5/13 (27.5%) *No sd (standard deviation) provided | |
| Patient health outcomes (controlled blood pressure) | Intervention: 201/282 (71.3%) Comparison: 143/218 (65.6%) | |
| No relevant secondary outcomes reported | ||
| No relevant secondary outcomes reported | ||
| No relevant secondary outcomes reported |
When the same study reported more than one relevant primary outcome (adherence outcome), we used the primary outcome as defined by the study authors. If a primary outcome was not clearly defined (Herman 1995; Khan 2011; Turner 1990), or multiple outcomes were defined as primary (Goldberg 2012; Wright 2012) or secondary outcomes (McKinstry 2006; Thiboutot 2013), we calculated and used the median value from all relevant primary outcomes. When calculating the median from even numbers of outcomes (Goldberg 2012; Herman 1995; Khan 2011; McKinstry 2006; Turner 1990; Wright 2012), we chose the outcome with reporting from the most participants (Herman 1995; McKinstry 2006; Turner 1990; Wright 2012). In cases where the number of participants contributing to the outcome was the same, we randomly selected the outcome (flip of a coin) (Goldberg 2012; Khan 2011).
The time points at which our primary outcomes were measured was within the 0‐3 months interval in most of the studies except from four studies (Krol 2004; McAlister 2005; McKinstry 2006; Mouland 1997), in which our primary outcomes were measured within the 3‐12 months interval.
Excluded studies
We excluded 115 studies, see Characteristics of excluded studies. Fifty‐six studies were excluded on the basis of outcomes and 42 studies on the basis of interventions or comparisons. The remaining studies were excluded on the basis of study design (11 studies) and the way the studies were carried out (no guarantee that a clinical encounter took place and thus the outcome is likely to be confounded by patients' attendance rates) (six studies).
Risk of bias in included studies
The judgments for the risk of bias from the 25 included studies are summarised in Figure 4 and Figure 5. We found 10 studies with adequate randomisation generation (Goldberg 2012; Jacobson 1999; Kattan 2006; Kenealy 2005; Khan 2011; Kravitz 2012; McAlister 2005; McKinstry 2006; Mouland 1997; Thiboutot 2013). Two studies had high risk of allocation bias due to lack of a random sequence generation (Thomas 2003; Turner 1990). Thirteen studies had unclear reporting of the randomisation (Alder 2005; Aragones 2010; Brody 1990; Caskey 2011; Christy 2013; Herman 1995; Krol 2004; Leveille 2009; Mazonson 1996; Miaskowski 2004; Nagykaldi 2012; Quinn 2008; Wright 2012).
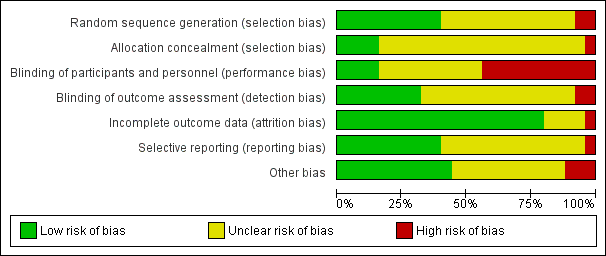
'Risk of bias' graph: review authors' judgements about each risk of bias item presented as percentages across all included studies.

'Risk of bias' summary: review authors' judgements about each risk of bias item for each included study.
Allocation
Random sequence generation
Ten studies reported adequate randomisation generation (Goldberg 2012; Jacobson 1999; Kattan 2006; Kenealy 2005; Khan 2011; Kravitz 2012; McAlister 2005; McKinstry 2006; Mouland 1997; Thiboutot 2013). Thirteen studies had unclear reporting of the sequence generation (Alder 2005; Aragones 2010; Brody 1990; Caskey 2011; Christy 2013; Herman 1995; Krol 2004; Leveille 2009; Mazonson 1996; Miaskowski 2004; Nagykaldi 2012; Quinn 2008; Wright 2012) and two studies had high risk of bias due to lack of a random sequence generation (Thomas 2003; Turner 1990).
Allocation concealment
We judged allocation concealment to be adequate in four studies (Kattan 2006; Kenealy 2005; Kravitz 2012; McAlister 2005).Twenty studies had unclear reporting of allocation concealment (Alder 2005; Aragones 2010; Brody 1990; Caskey 2011; Christy 2013; Goldberg 2012; Herman 1995; Jacobson 1999; Khan 2011; Krol 2004; Leveille 2009; Mazonson 1996; McKinstry 2006; Miaskowski 2004; Mouland 1997; Nagykaldi 2012; Quinn 2008; Thiboutot 2013; Turner 1990; Wright 2012) and one study had high risk of bias due to lack of adequate allocation concealment.
Blinding
We judged participants and personnel to be blinded in four studies (Jacobson 1999; Kravitz 2012; Miaskowski 2004; Thiboutot 2013) and not blinded in 11 studies (Aragones 2010; Kattan 2006; Kenealy 2005; Khan 2011; Mazonson 1996; McAlister 2005; McKinstry 2006; Mouland 1997; Nagykaldi 2012; Quinn 2008; Thomas 2003). We judged the remaining 10 studies (Alder 2005; Brody 1990; Caskey 2011; Christy 2013; Goldberg 2012; Herman 1995; Krol 2004; Leveille 2009; Turner 1990; Wright 2012) to have unclear risk of bias because these studies did not sufficiently describe participant and personnel blinding.
We judged outcome assessors to be blinded in eight studies (Aragones 2010; Brody 1990; Kattan 2006; Kenealy 2005; Kravitz 2012; McAlister 2005; McKinstry 2006; Thiboutot 2013) and not blinded in two studies (Jacobson 1999; Quinn 2008). We judged the remaining 15 studies (Alder 2005; Caskey 2011; Christy 2013; Goldberg 2012; Herman 1995; Khan 2011; Krol 2004; Leveille 2009; Mazonson 1996; Miaskowski 2004; Mouland 1997; Nagykaldi 2012; Thomas 2003; Turner 1990; Wright 2012) to have unclear risk of bias because these studies did not sufficiently describe blinding of outcome assessors.
Incomplete outcome data
We found no indication of incomplete outcome data in most of the studies (Alder 2005; Aragones 2010; Christy 2013; Goldberg 2012; Kattan 2006; Kenealy 2005; Khan 2011; Kravitz 2012; Krol 2004; Leveille 2009; Mazonson 1996; McAlister 2005; McKinstry 2006; Miaskowski 2004; Mouland 1997; Quinn 2008; Thiboutot 2013; Thomas 2003; Turner 1990; Wright 2012). We judged one study (Nagykaldi 2012) to have high risk of bias and four studies (Brody 1990; Caskey 2011; Herman 1995; Jacobson 1999; ) to have unclear risk of attrition bias.
Selective reporting
We could not decide if there was a risk of selective reporting in more than half of the studies (Alder 2005; Brody 1990; Caskey 2011; Jacobson 1999; Kattan 2006; Kenealy 2005; Khan 2011; Krol 2004; Mazonson 1996; Mouland 1997; Quinn 2008; Thomas 2003; Turner 1990; Wright 2012). We judged one study (Herman 1995) to have high risk of bias and 10 to have of low risk of bias (Aragones 2010; Christy 2013; Goldberg 2012; Kravitz 2012; Leveille 2009; McAlister 2005; McKinstry 2006; Miaskowski 2004; Nagykaldi 2012; Thiboutot 2013).
Other potential sources of bias
We inspected all the studies for potential bias due to baseline imbalance in key characteristics and baseline outcome imbalance. We found high risk of baseline imbalance in key charcteristics in two studies (Alder 2005;Wright 2012). We judged 11 studies to have low risk of bias (Aragones 2010; Brody 1990; Christy 2013; Kenealy 2005; Khan 2011; Leveille 2009; Mazonson 1996; McAlister 2005; McKinstry 2006; Miaskowski 2004; Nagykaldi 2012) and 12 to have unclear risk of baseline imbalance (Caskey 2011; Goldberg 2012; Herman 1995; Jacobson 1999; Kattan 2006; Kravitz 2012; Krol 2004; Mouland 1997; Quinn 2008; Thiboutot 2013; Thomas 2003; Turner 1990). For baseline outcome imbalance, five out of 25 had low risk (Khan 2011; McAlister 2005; McKinstry 2006; Miaskowski 2004; Mouland 1997), while the remaining 20 had unclear risk. Only two (McAlister 2005; McKinstry 2006) of the 25 studies reported the relevant primary outcome at baseline, one reported one of the primary outcomes, but not the one used for the meta‐analysis (Mouland 1997) while three studies reported secondary outcomes at baseline (Khan 2011; McKinstry 2006; Miaskowski 2004).
Ten studies were cluster‐randomised studies (Brody 1990; Caskey 2011; Herman 1995; Kenealy 2005; Krol 2004; Mazonson 1996; McAlister 2005; Nagykaldi 2012; Thiboutot 2013; Wright 2012) and we searched for information about five additional sources of potential biases. There was high risk of bias in three of the ten studies (Nagykaldi 2012; Thiboutot 2013; Wright 2012) and low risk of bias in six studies (Brody 1990; Herman 1995; Kenealy 2005; Krol 2004; Mazonson 1996; McAlister 2005). The remaining study was judged to be unclear (Caskey 2011). The rationale for all the judgements are presented in the table of Risk of bias in included studies.
Among the 15 individual randomised studies (Alder 2005; Aragones 2010; Christy 2013; Goldberg 2012; Jacobson 1999; Kattan 2006; Khan 2011; Kravitz 2012; Leveille 2009; McKinstry 2006; Miaskowski 2004; Mouland 1997; Quinn 2008; Thomas 2003; Turner 1990) we found no indication of other risk of bias in five of these studies (Aragones 2010; Kravitz 2012; Leveille 2009; McKinstry 2006; Miaskowski 2004,) but the remaining ten studies were unclear (Alder 2005; Christy 2013; Goldberg 2012; Jacobson 1999; Kattan 2006; Khan 2011; Mouland 1997; Quinn 2008; Thomas 2003; Turner 1990).
Thus all in all, we found no indication of other risk of bias in 11 studies (Aragones 2010; Brody 1990; Herman 1995; Kenealy 2005; Kravitz 2012; Krol 2004; Leveille 2009; Mazonson 1996; McAlister 2005; McKinstry 2006; Miaskowski 2004), high risk of bias in three studies (Nagykaldi 2012; Thiboutot 2013; Wright 2012), and unclear risk in eleven studies (Alder 2005; Caskey 2011; Christy 2013; Goldberg 2012; Jacobson 1999; Kattan 2006; Khan 2011; Mouland 1997; Quinn 2008; Thomas 2003; Turner 1990).
Effects of interventions
See: Summary of findings for the main comparison Patient‐reported health information interventions versus comparisons to improve professional performance; Summary of findings 2 Patient information interventions versus comparisons to improve professional performance; Summary of findings 3 Patient education interventions versus comparisons to improve professional performance; Summary of findings 4 Patient decision aid interventions versus comparisons to improve professional performance
See summary of findings Table for the main comparison; summary of findings Table 2; summary of findings Table 3, and summary of findings Table 4 for patient‐mediated interventions versus comparisons. The comparisons were categorised as "no intervention" and "usual care" (see Types of interventions) and these comparisons were merged for analysis and reporting because they appeared quite similar.
Adherence to recommended clinical practice was our primary outcome. We included 20 studies and a total of 8749 patients in our meta‐analyses. Our meta‐analyses show that patient‐reported health information interventions and patient education interventions probably improve professional performance and the two other types of patient‐mediated interventions may improve professional performance (patient information) or may have little or no impact (patient decision aids) (Analysis 1.1; Analysis 2.1; Analysis 3.1; Analysis 4.1).
Patient‐reported health information interventions
Primary outcome
Adherence to recommended clinical practice
Six studies about patient‐reported health information interventions reported on our primary outcome (Brody 1990; Goldberg 2012; Kattan 2006; Kenealy 2005; Mazonson 1996; Quinn 2008). We included four studies (Goldberg 2012; Kenealy 2005; Mazonson 1996; Quinn 2008) in our meta‐analysis (Analysis 1.1). We report on two studies narratively (Table 2) due to incomplete outcome reporting (Kattan 2006) or because the outcome was reported as a continuous variable (Brody 1990).The effect estimate expressed as risk ratio (RR), is 1.59 (95% confidence interval (CI) 1.41 to 1.81; 4 studies, 3865 patients) (Analysis 1.1).
In absolute numbers: for every 100 patients consulted or treated in the patient‐reported health information group there probably are 26 (95% CI 23 to 30) that are in accordance with recommended clinical practice compared to 17 per 100 in the comparison group (no intervention or usual care). We judged the certainty of the evidence as moderate. We can thus conclude that patient‐reported health information interventions probably improve healthcare professionals' adherence to recommended clinical practice compared to no intervention, usual care, or other interventions.
The two studies not included in the meta‐analysis reported findings in favour of the patient‐reported health information intervention (Kattan 2006) or no effect (Brody 1990) ‐ see Table 2.
Secondary outcomes
Patient outcomes
Desirable patient health outcomes
One study (Brody 1990), reported on desirable health outcomes dichotomously (increase in control over stress) for patient‐reported health information interventions. The result for this outcome is presented in Analysis 1.2. The relative effect estimate, RR, is 1.62 (95% CI 0.95 to 2.76; 1 study, 79 patients). We judged the certainty of the evidence as very low. We are thus uncertain about the effect of patient‐reported health information interventions on desirable patient health outcomes because the certainty of the evidence is very low.
Undesirable patient health outcomes
None of the included studies reported on this outcome.
Patient satisfaction
One study (Quinn 2008), reported on patient satisfaction dichotomously for patient‐reported health information interventions and is presented in Analysis 1.3. The relative effect estimate, RR, is 2.45 (95% CI 1.27 to 4.74; 1 study, 26 patients). We judged the certainty of the evidence as very low. We are thus uncertain about the effect of patient‐reported health information interventions on the number of satisfied patients because the certainty of the evidence is very low.
Another study (Brody 1990) reported on patient satisfaction continuously for patient‐reported health information interventions and is presented in Analysis 1.4. Our summary shows that the mean difference (MD) in the degree of satisfaction is 0.40 points higher (95% CI 0.12 to 0.68 higher; 1 study, 79 patients). We judged the certainty of the evidence as very low. We are thus uncertain about the effect of patient‐reported health information interventions on the degree of patient satisfaction because the certainty of the evidence is very low.
Other patient outcomes
None of the included studies reported on other patient outcomes (patients' acceptance, confidence in, or satisfaction with the intervention; patients' experiences / perceptions of healthcare professionals acceptance, confidence in or satisfaction with the intervention).
Healthcare professional outcomes
None of the included studies reported on any healthcare professional outcomes.
Resource use
One study reported on cost‐effectiveness (Kattan 2006), and is narratively presented in Table 3. The researchers in this study reported a total cost of 69.20 US $ per child per year. When this cost was added to the cost of healthcare services use for the year by intervention children and compared with the cost of healthcare service use by children in the comparison group, there was a saving of $337.00 per child in the intervention group. The researchers reported that the intervention had a 97% chance of being cost saving. We did not judge the certainty of the evidence for this outcome.
Adverse events
None of the included studies reported on this outcome.
Equity
None of the included studies reported on this outcome.
Patient information interventions
Primary outcome
Adherence to recommended clinical practice
Thirteen studies about patient information interventions (Aragones 2010; Caskey 2011; Christy 2013; Herman 1995; Jacobson 1999; Krol 2004; Leveille 2009; McKinstry 2006; Mouland 1997; Nagykaldi 2012; Thomas 2003; Turner 1990; Wright 2012) reported on our primary outcome. Eleven studies (Aragones 2010; Christy 2013; Herman 1995; Jacobson 1999; Krol 2004; Leveille 2009; McKinstry 2006; Mouland 1997; Thomas 2003; Turner 1990; Wright 2012) were included in our meta‐analysis (Analysis 2.1) and two studies(Caskey 2011; Nagykaldi 2012) narratively (Table 2) due to incomplete outcome reporting. The effect estimate expressed as RR, is 1.60 (95% CI 1.20 to 2.13; 11 studies, 3502 patients) (Analysis 2.1).
In absolute numbers: for every 100 patients consulted or treated in the patient information group there may be 32 (95% CI 24 to 42) that are in accordance with recommended clinical practice compared to 20 per 100 in the comparison group (no intervention or usual care). We judged the certainty of the evidence as low. We can thus conclude that patient information interventions may improve healthcare professionals' adherence to recommended clinical practice compared to no intervention, usual care, or other interventions.
The two studies not included in the meta‐analysis (Caskey 2011; Nagykaldi 2012) reported findings in favour of the patient information intervention intervention ‐ see Table 2.
There was statistical heterogeneity (I2 = 79%) for the pooled primary outcome for patient information interventions (see Analysis 2.1). The planned subgroup analyses of explanatory factors (risk of bias, direction of change required, type of recipient, and baseline clinical performance) were carried out for two of the predetermined factors; risk of bias (see Analysis 2.2 ) and the direction of change required (see Analysis 2.3). Since the target group (recipients) in all the studies were physicians, 'type of recipient' could not explain the observed statistical heterogeneity. The baseline clinical performance was generally poorly reported so we decided not to carry out a subgroup analysis for this variable either. The two subgroup analyses we carried out did not provide any explanation for the observed statistical heterogeneity.
Secondary outcomes
Patient outcomes
Desirable patient health outcomes
One study (McKinstry 2006) reported on desirable health outcomes (controlled blood pressure) for patient information interventions. The result for this outcome is presented in Analysis 2.4. The relative effect estimate, RR, is 0.99 (95% CI 0.79 to 1.24; 1 study, 261 patients). We judged the certainty of the evidence as low. We can thus conclude that there may be little or no difference in the number of people with desirable health outcomes among people in the patient information intervention group compared to those in the comparison group (usual care).
Undesirable patient health outcomes
Two studies (Krol 2004; Leveille 2009) reported on undesirable health outcomes (high dyspepsia severity or fair to poor health) for patient information interventions. The result is presented in Analysis 2.5. The relative effect estimate, RR, is 0.94 (95% CI 0.53 to 1.67; 2 studies, 246 patients). We judged the certainty of the evidence as very low. We are thus uncertain about the effect of patient information interventions on undesirable patient outcomes because the certainty of the evidence is very low.
Patient satisfaction
One study (Leveille 2009) report on patient satisfaction dichotomously for patient information interventions and is presented in Analysis 2.6. The relative effect estimate, RR, is 1.03 (95% CI 0.93 to 1.13; 1 study, 186 patients). We judged the certainty of the evidence as low. We can thus conclude that there may be little or no difference in the number of satisfied patients among those in the patient information intervention group compared to those in the comparison group (usual care).
The same study (Leveille 2009) reported on patient satisfaction continuously for patient information interventions and is presented in Analysis 2.7. Our summary shows that the in the degree of satisfaction is 0.30 points higher (95% CI 0.01 to 0.59 higher; 1 study, 186 patients) on a scale from one to ten (in which ten is best). We judged the certainty of the evidence as low. We can thus conclude that there may be little or no difference in the degree of satisfaction among patients in the patient information intervention group compared to those in the comparison group (usual care).
Other patient outcomes
None of the included studies reported on other patient outcomes (patients' acceptance, confidence in, or satisfaction with the intervention; patients' experiences/perceptions of healthcare professionals acceptance, confidence in or satisfaction with the intervention).
Healthcare professional outcomes
None of the included studies reported on any healthcare professional outcomes.
Resource use
None of the included studies reported on this outcome.
Adverse events
None of the included studies reported on this outcome.
Equity
None of the included studies reported on this outcome.
Patient education interventions
Primary outcome
Adherence to recommended clinical practice
Five studies about patient education interventions reported on our primary outcome (Alder 2005; Khan 2011; Kravitz 2012; Miaskowski 2004; Thiboutot 2013). Four studies (Khan 2011; Kravitz 2012; Miaskowski 2004; Thiboutot 2013) were included in our meta‐analysis (Analysis 3.1) and one study (Alder 2005) was reported descriptively (Table 2) due to incomplete outcome reporting. The effect estimate expressed as RR, is 1.31 (95% CI 1.12 to 1.54; 4 studies, 1029 patients) (Analysis 3.1) .
In absolute numbers: for every 100 patients consulted or treated in the patient education group there may be 46 (95% CI 39 to 54) that are in accordance with recommended clinical practice compared to 35 per 100 in the comparison group (no intervention or usual care). We judged the certainty of the evidence as moderate. Thus we can conclude that patient education interventions probably improve healthcare professionals' adherence to recommended clinical practice compared no intervention or usual care.
The study not included in the meta‐analysis (Alder 2005) reported findings in favour of the patient education intervention and is summarised in Table 2.
Secondary outcomes
Patient outcomes
Desirable patient health outcomes
One study (Thiboutot 2013) reported on desirable health outcomes (controlled blood pressure) for patient education interventions. The result for this outcome is presented in Analysis 3.2. The relative effect estimate, RR, is 1.09 (95% CI 0.96 to 1.23; 1 study, 500 patients). We judged the certainty of the evidence as low. We can thus conclude that patient education interventions may slightly increase the number of people with desirable health outcomes compared to usual care.
Undesirable patient health outcomes
None of the included studies reported on this outcome.
Patient satisfaction
None of the included studies reported on this outcome.
Other patient outcomes
None of the included studies reported on other patient outcomes (patients' acceptance, confidence in, or satisfaction with the intervention; patients' experiences/perceptions of healthcare professionals acceptance, confidence in or satisfaction with the intervention).
Healthcare professional outcomes
None of the included studies reported on any healthcare professional outcomes.
Resource use
None of the included studies reported on this outcome.
Adverse events
None of the included studies reported on this outcome.
Equity
None of the included studies reported on this outcome.
Patient decision aid interventions
Primary outcome
Adherence to recommended clinical practice
One study about patient decision aid interventions reported on our primary outcome (McAlister 2005). The result for this outcome is presented in Analysis 4.1. The effect estimate expressed as RR, is 0.86 (95% CI 0.65 to 1.15; 1 study, 353 patients).
In absolute numbers: for every 100 patients consulted or treated in the patient education group there may be 32 (95% CI 24 to 43) that are in accordance with recommended clinical practice compared to 37 per 100 in the comparison group (usual care). We judged the certainty of the evidence as low. Thus patient decision aid interventions may make little or no difference to healthcare professionals' adherence to recommended clinical practice compared to usual care.
Discussion
Summary of main results
We included 25 studies assessing a range of patient‐mediated interventions to improve professional practice, compared to no intervention or usual care. The patient‐mediated interventions in the included studies all fell within the predefined categories in the review protocol and are shown in Table 1. The interventions in the included studies were categorised as patient‐reported health information, patient information, patient education, or patient decision aids and are presented as separate analyses (Analysis 1.1; Analysis 2.1; Analysis 3.1; Analysis 4.1). Most of the studies were carried out in a primary care setting, and about half of the studies focused on the identification, treatment or management of common long‐term conditions (such as diabetes, asthma or depression) while the other half focused on preventive care (such as cancer screening or vaccination).
We found that patient‐reported health information interventions and patient education interventions probably improve professional performance compared to no intervention or usual care (moderate certainty of the evidence). Other patient‐mediated interventions, such as patient information, may also improve professional practice (low certainty of the evidence). Patient decision aids may have little or no impact on professional performance compared to usual care (low certainty of the evidence).
The impacts of these four types of patient‐mediated intervention on health and satisfaction outcomes among patients varies.
The effects of patient‐mediated interventions on the remaining predefined secondary outcomes (healthcare professionals' satisfaction with the care they provide, resource use, patients' acceptance, confidence in, or satisfaction with the intervention, patients' experiences/perceptions of healthcare professionals acceptance, confidence in or satisfaction with the intervention, healthcare professionals' acceptance, confidence in or satisfaction with the intervention, adverse events, and equity) were either not reported or were poorly reported. We therefore cannot conclude regarding these effects.
Overall completeness and applicability of evidence
We did not find any studies that had tested the effect of the other types of patient‐mediated interventions that we had pre‐defined, including patient feedback about clinical practice, patient‐led training of healthcare professionals, or having patients as members of committees or boards.
The majority of the studies were carried out in USA (20 of 25 studies), which may limit the applicability of the findings to other settings. Also, most studies aimed at improving professional practice among physicians, usually in a primary care setting and the applicability to other types of health care providers and other care settings is unclear.
Improved professional practice should translate into improvements in patient outcomes. The combination of low‐certainty evidence for many professional practice‐outcomes and the scarcity of data on patient health outcomes hindered us from drawing any inferences on the association between the two.
Certainty of the evidence
We used the GRADE approach to assess the certainty of the evidence. The certainty of the evidence was judged to be moderate and low for our primary outcome, adherence to recommended clinical practice; very low to low for patient health outcomes; and very low to low for patient satisfaction outcomes. See summary of findings Table for the main comparison; summary of findings Table 2; summary of findings Table 3; and summary of findings Table 4 for GRADE judgements.
Potential biases in the review process
Due to wide variation in the terms and definitions used in this field of research, we performed comprehensive literature searches that covered as many of the potentially relevant terms as possible. These searches identified a very large number of primary studies (over 12, 000) which we assessed in order to identify the 25 included studies. Given the comprehensive nature of the searches that we used, we are fairly confident that the risk that we have missed important relevant published studies is low. The decision to merge 'no intervention' and 'usual care' comparisons is based on our interpretation of the comparison group descriptions in the studies. These descriptions varied greatly and made the grouping challenging. However, we are fairly confident that the two comparisons are sufficiently similar to be merged. Two review authors independently screened potentially eligible studies for inclusion and assessed risk of bias in the included studies. None of the review authors had any conflicts of interest.
Agreements and disagreements with other studies or reviews
The effect size for the primary outcome is considered small to moderate, and is in agreement with findings of previous systematic reviews assessing the effects of different interventions to improve professional practice. Audit and feedback probably improves professional practice, but the effectiveness ranges from little or no effect to a substantial effect (Ivers 2012). Reminders, such as computer‐generated reminders delivered on paper to healthcare professionals, probably improve professional practice (Arditi 2017). Printed educational material may also improve professional practice, but the effect seems small, and the certainty of the evidence is low (Giguère 2012). Educational meetings or educational outreach visits may result in modest improvements in professional practice (Forsetlund 2009; O'Brien 2007). Using local opinion leaders may improve professional practice (Flodgren 2011a), as may financial incentives (Flodgren 2011b). Another recent Cochrane review shows that clinical practice guidelines accompanied by tools intended to improve the use of the guideline probably improve adherence to clinical practice (Flodgren 2016). Organisational interventions, such as provision of pharmaceutical care, medication reviews, follow‐up visits by a healthcare professional including a pharmacist, nurse or physician, probably make little or no difference in medication errors by primary healthcare professionals in adult patients that lead to hospital admissions, emergency department visits, and death (Khalil 2017).
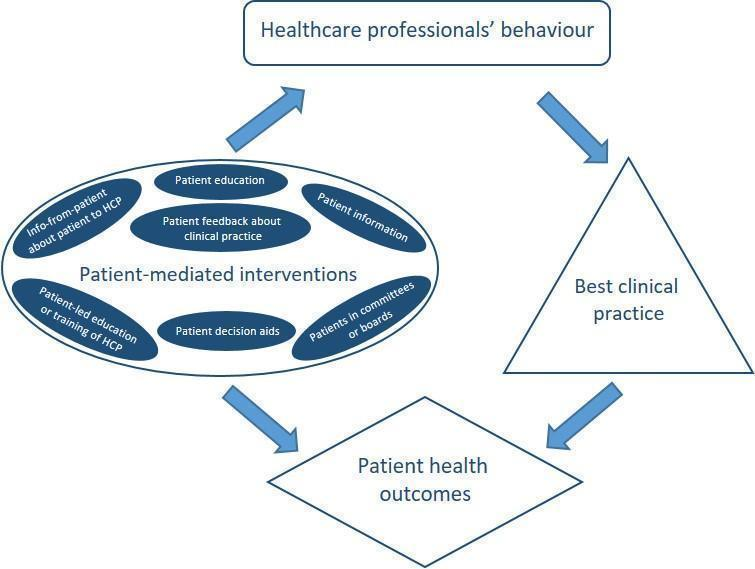
Summary figure of different examples of patient‐mediated interventions and proposal of where within the healthcare system the direct interaction may take place.

Study flow diagram.
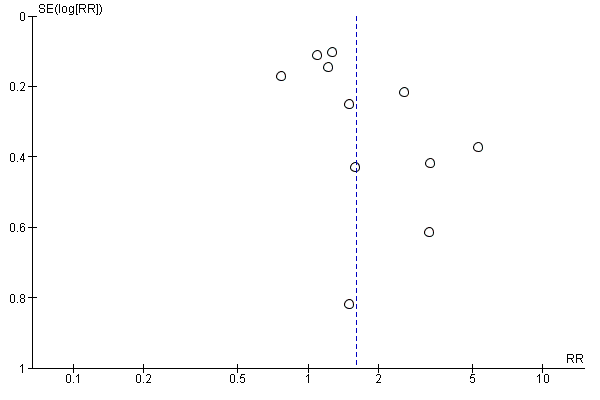
Funnel plot of comparison: 2 Patient information interventions versus comparisons, outcome: 2.1 Adherence to recommended practice.

'Risk of bias' graph: review authors' judgements about each risk of bias item presented as percentages across all included studies.

'Risk of bias' summary: review authors' judgements about each risk of bias item for each included study.

Comparison 1 Patient‐reported health information interventions versus comparisons, Outcome 1 Adherence to recommended practice.
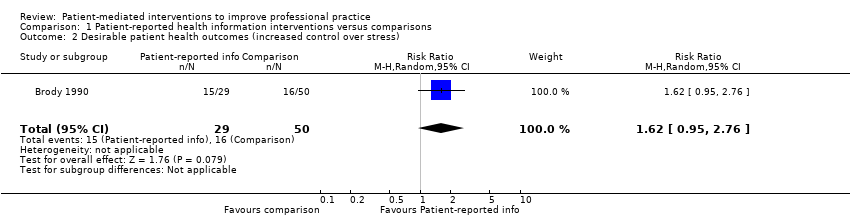
Comparison 1 Patient‐reported health information interventions versus comparisons, Outcome 2 Desirable patient health outcomes (increased control over stress).

Comparison 1 Patient‐reported health information interventions versus comparisons, Outcome 3 Patient satisfaction (with care). Number of satisfied patients.
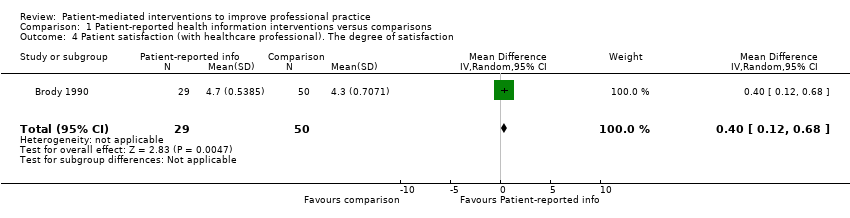
Comparison 1 Patient‐reported health information interventions versus comparisons, Outcome 4 Patient satisfaction (with healthcare professional). The degree of satisfaction.
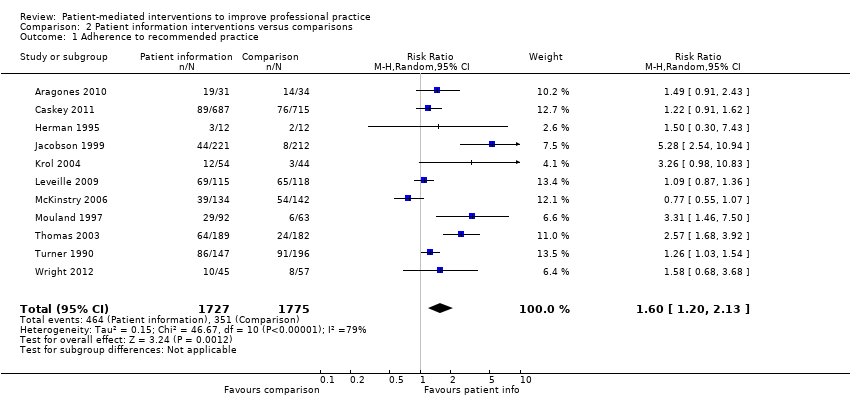
Comparison 2 Patient information interventions versus comparisons, Outcome 1 Adherence to recommended practice.

Comparison 2 Patient information interventions versus comparisons, Outcome 2 Adherence to recommended practice. Risk of bias.
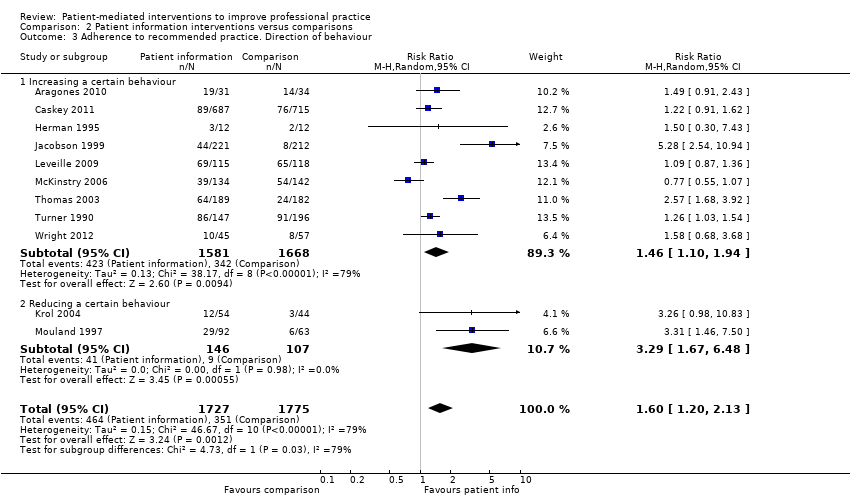
Comparison 2 Patient information interventions versus comparisons, Outcome 3 Adherence to recommended practice. Direction of behaviour.

Comparison 2 Patient information interventions versus comparisons, Outcome 4 Desirable patient health outcomes (controlled blood pressure).
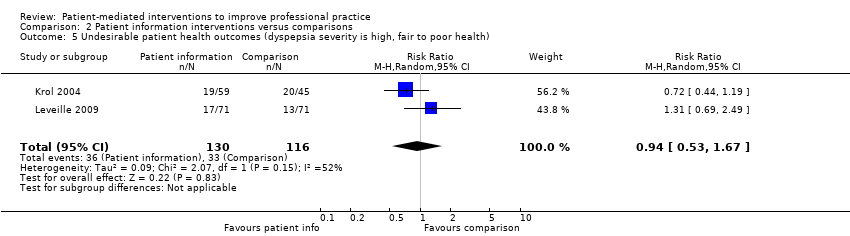
Comparison 2 Patient information interventions versus comparisons, Outcome 5 Undesirable patient health outcomes (dyspepsia severity is high, fair to poor health).

Comparison 2 Patient information interventions versus comparisons, Outcome 6 Patient satisfaction (with healthcare professional). Number of satisfied patients.
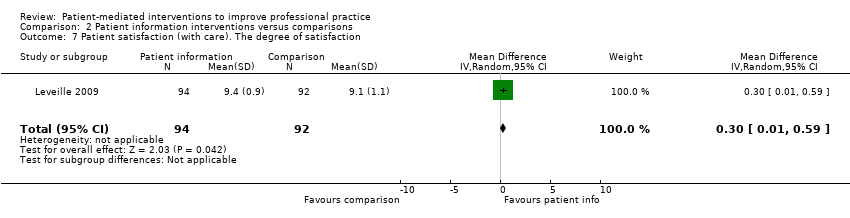
Comparison 2 Patient information interventions versus comparisons, Outcome 7 Patient satisfaction (with care). The degree of satisfaction.

Comparison 3 Patient education interventions versus comparisons, Outcome 1 Adherence to recommended practice.
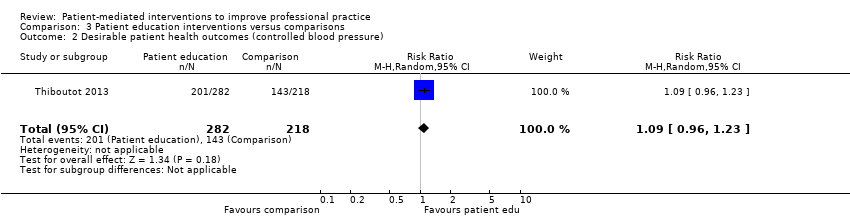
Comparison 3 Patient education interventions versus comparisons, Outcome 2 Desirable patient health outcomes (controlled blood pressure).
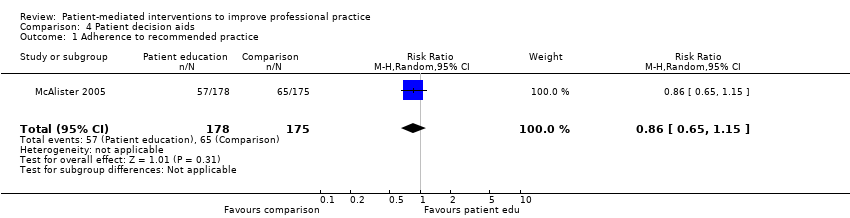
Comparison 4 Patient decision aids, Outcome 1 Adherence to recommended practice.
| Patient‐reported health information interventions versus comparisons to improve professional performance | ||||||
| Patient or population: general patient population, "at risk" patient population and patient population with a specific condition or disease | ||||||
| Outcomes | Anticipated absolute effects* (95% CI) | Relative effect | № of participants | Certainty of the evidence | What happens? | |
| Risk with comparisons | Risk with patient‐reported health information interventions | |||||
| Adherence to recommended clinical practice (0‐3 months follow‐up) | 17 per 100 | 26 per 100 | RR 1.59 | 3865 | ⊕⊕⊕⊝ | Patient‐reported health information interventions probably improve healthcare professionals' adherence to recommended clinical practice compared to no intervention or usual care |
| Desirable patient health outcomes (0‐3 months follow‐up) | 32 per 100 | 52 per 100 | RR 1.62 | 79 | ⊕⊝⊝⊝ | We are uncertain about the effect of patient‐reported health information interventions on desirable patient health outcomes because the certainty of the evidence is very low |
| Undesirable patient health outcomes | Not reported | ‐ | ‐ | ‐ | ‐ | None of the included studies reported on undesirable patient health outcomes |
| Patient satisfaction Number of satisfied patients (0‐3 months follow‐up) | 38 per 100 | 94 per 100 | RR 2.45 | 26 | ⊕⊝⊝⊝ | We are uncertain about the effect of patient‐reported health information interventions on the number of satisfied patients because the certainty of the evidence is very low |
| Patient satisfaction The degree of satisfaction (unknown scale, but higher score means higher degree of satisfaction) (0‐3 months follow‐up) | The mean patient satisfaction score was 4.3 points | The mean patient satisfaction was 0.40 points higher (0.12 higher to 0.68 higher) | ‐ | 79 | ⊕⊝⊝⊝ | We are uncertain about the effect of patient‐reported health information interventions on the degree of patient satisfaction because the certainty of the evidence is very low |
| Adverse events | Not reported | ‐ | ‐ | ‐ | ‐ | None of the included studies reported on adverse events |
| Resource use (0‐3 months follow‐up) | The findings are narratively presented in Table 3. The researchers in this study reported a total cost of 69.20 US $ per child | We did not judge the certainty of the evidence for this outcome | ||||
| *The risk in the intervention group (and its 95% confidence interval) is based on the assumed risk in the comparison group and the relative effect of the intervention (and its 95% CI). | ||||||
| GRADE Working Group grades of evidence ** Substantially different = a large enough difference that it might affect a decision | ||||||
| 1 Downgraded one level because we judged only 1 of 4 studies to have low risk of bias 2 Downgraded one level because we judged the study to have potential risk of bias 3 Downgraded two levels for imprecision because of very few events (and one small study only) 4 Downgraded two levels for imprecision because of a very small sample size (and one small study only) A Goldberg 2012; Kenealy 2005; Mazonson 1996; Quinn 2008 B Brody 1990 C Quinn 2008 | ||||||
| Patient information interventions versus comparisons to improve professional performance | ||||||
| Patient or population: general patient population, "at risk" patient population and patient population with a specific condition or disease | ||||||
| Outcomes | Anticipated absolute effects* (95% CI) | Relative effect | № of participants | Certainty of the evidence | What happens? | |
| Risk with comparisons | Risk with patient information interventions | |||||
| Adherence to recommended clinical practice (0‐12 months follow‐up) | 20 per 100 | 32 per 100 | RR 1.60 | 3502 | ⊕⊕⊝⊝ | Patient information interventions may improve healthcare professionals' adherence to recommended clinical practice compared to no intervention or usual care |
| Desirable patient health outcomes (3‐12 months follow‐up) | 55 per 100 | 54 per 100 | RR 0.99 | 261 | ⊕⊕⊝⊝ | There may be little or no difference in the number of people with desirable health outcomes among people in the patient information intervention group compared to those in the usual care group |
| Undesirable patient health outcomes (0‐12 months follow‐up) | 28 per 100 | 27 per 100 | RR 0.94 | 246 | ⊕⊝⊝⊝ | We are uncertain about the effect of patient information interventions on undesirable patient outcomes because the certainty of the evidence is very low |
| Patient satisfaction Number of satisfied patients (0‐3 months follow‐up) | 89 per 100 | 92 per 100 | RR 1.03 | 186 | ⊕⊕⊝⊝ | There may be little or no difference in the number of satisfied patients among those in the patient information intervention group compared to those in the usual care group |
| Patient satisfaction The degree of satisfaction (on a 1‐10 scale where 10 is highest degree of satisfaction) (0‐3 months follow‐up) | The mean patient satisfaction score was 9.1 points | The mean patient satisfaction was 0.30 points higher (0.01 higher to 0.59 higher) | ‐ | 186 | ⊕⊕⊝⊝ | There may be little or no difference in the degree of satisfaction among patients in the patient information intervention group compared to those in the usual care group |
| Adverse events | Not reported | ‐ | ‐ | ‐ | ‐ | None of the included studies reported on adverse events |
| Resource use | Not reported | ‐ | ‐ | ‐ | ‐ | None of the included studies reported on resource use |
| *The risk in the intervention group (and its 95% confidence interval) is based on the assumed risk in the comparison group and the relative effect of the intervention (and its 95% CI). | ||||||
| GRADE Working Group grades of evidence ** Substantially different = a large enough difference that it might affect a decision | ||||||
| 1 Downgraded one level because all the studies were judged to have potential risk of bias, 2 Downgraded one level for inconsistency because of statistical heterogeneity (I2 is 79%) 3 Downgraded two levels for imprecision because of few events and a 95% CI that crosses the line of "no effect" 4 Downgraded one level for imprecision because of small study sample 5 Downgraded one level because we judged the study to have potential risk of bias 6 Downgraded one level for imprecision because of few events A Aragones 2010; Caskey 2011; Herman 1995; Jacobson 1999; Krol 2004; Leveille 2009; McKinstry 2006; Mouland 1997; Thomas 2003; Turner 1990; Wright 2012 B McKinstry 2006 C Krol 2004; Leveille 2009 D Leveille 2009 (patient satisfaction was assessed using both a dichotomous and a continuous outcome in this study) | ||||||
| Patient education interventions versus comparisons to improve professional performance | ||||||
| Patient or population: general patient population, "at risk" patient population and patient population with a specific condition or disease | ||||||
| Outcomes | Anticipated absolute effects* (95% CI) | Relative effect | № of participants | Certainty of the evidence | What happens? | |
| Risk with comparisons | Risk with patient education interventions | |||||
| Adherence to recommended clinical practice (0‐3 months follow‐up) | 35 per 100 | 46 per 100 | RR 1.31 | 1029 | ⊕⊕⊕⊝ | Patient education interventions probably improve healthcare professionals' adherence to recommended clinical practice compared to no intervention or usual care |
| Desirable patient health outcomes (0‐3 months follow‐up) | 66 per 100 | 72 per 100 | RR 1.09 | 500 | ⊕⊕⊕⊝ | Patient education interventions may slightly increase the number of people with desirable health outcomes compared to usual care |
| Undesirable patient health outcomes | Not reported | ‐ | ‐ | ‐ | ‐ | None of the included studies reported on undesirable patient health outcomes |
| Patient satisfaction Number of satisfied patients | Not reported | ‐ | ‐ | ‐ | ‐ | None of the included studies reported on patient satisfaction |
| Patient satisfaction The degree of satisfaction | Not reported | ‐ | ‐ | ‐ | ‐ | None of the included studies reported on patient satisfaction |
| Adverse events | Not reported | ‐ | ‐ | ‐ | ‐ | None of the included studies reported on adverse events |
| Resource use | Not reported | ‐ | ‐ | ‐ | ‐ | None of the included studies reported on resource use |
| GRADE Working Group grades of evidence ** Substantially different = a large enough difference that it might affect a decision | ||||||
| 1 Downgraded one level because most of the studies were assessed as having potential risk of bias 2 Downgraded one level for imprecision because the 95% CI crosses the line of "no effect" 3 Downgraded one level because the study has potential risk of bias (allocation concealment and other biases related to cluster issues) A Khan 2011; Kravitz 2012; Miaskowski 2004; Thiboutot 2013 B Thiboutot 2013 | ||||||
| Patient decision aid interventions versus comparisons to improve professional performance | ||||||
| Patient or population: patient population with a specific condition or disease | ||||||
| Outcomes | Anticipated absolute effects* (95% CI) | Relative effect | № of participants | Certainty of the evidence | What happens? | |
| Risk with comparisons | Risk with patient‐reported health information interventions | |||||
| Adherence to recommended clinical practice (12 months follow up) | 37 per 100 | 32 per 100 | RR 0.86 | 353 | ⊕⊕⊕⊝ | There may be little or no difference in the number of healthcare professionals' adhering to recommended clinical practice in the patient decision aid group compared to usual care |
| Desirable patient health outcomes | Not reported | ‐ | ‐ | ‐ | ‐ | The included study did not report on desirable patient health outcomes |
| Undesirable patient health outcomes | Not reported | ‐ | ‐ | ‐ | ‐ | The included study did not report on undesirable patient health outcomes |
| Patient satisfaction Number of satisfied patients | Not reported | The included study did not report on patient satisfaction outcomes | ||||
| Patient satisfaction The degree of satisfaction (unknown scale, but higher score means higher degree of satisfaction) | Not reported | ‐ | ‐ | ‐ | ‐ | The included study did not report on patient satisfaction outcomes |
| Adverse events | Not reported | ‐ | ‐ | ‐ | ‐ | None of the included studies reported on adverse events |
| Resource use | Not reported | ‐ | ‐ | ‐ | ‐ | None of the included studies reported on resource use |
| *The risk in the intervention group (and its 95% confidence interval) is based on the assumed risk in the comparison group and the relative effect of the intervention (and its 95% CI). | ||||||
| GRADE Working Group grades of evidence ** Substantially different = a large enough difference that it might affect a decision | ||||||
| 1 Downgraded one level because the study was assessed as having high risk of performance bias (no blinding of patients or healthcare professionals) 2 Downgraded one level for imprecision because of few events and because the 95% CI crosses the line of "no effect" A McAlister 2005 | ||||||
| Examples of different types of patient‐mediated interventions | An example | Possible mechanisms of action | How it might have positive effects | How it might have adverse effects |
| Patient‐reported health information about own health/needs/concerns or other relevant outcomes (collecting information from patients and giving it to professionals before, or during a clinical encounter) | The patient or carer completes a questionnaire or form in the waiting area before a consultation. The doctor is then given this information before or during the consultation. | Information to healthcare professionals from patients → clinical encounter → impact on healthcare professionals' performance | Information from patients about own health/needs/concerns might ensure that professionals get important information that they might otherwise not have received. This information might prompt professionals to improve their practice and provide recommended health care. | This might distract healthcare professionals from focusing on other things or lead to longer consultations without measurable improvements in the quality of care, if the information that is collected turns out not to be important. |
| Patient information where patients are informed about recommended care | The patient is given a brochure with information about cancer screening. | Information to patient from others → clinical encounter → impact on healthcare professionals' performance | Giving recommendations or evidence to patients might lead them to ask for recommended care, and professionals might respond by providing it. | Healthcare professionals might feel threatened by this or disagree with the information given to patients. Patients might become distrustful of the healthcare professionals. |
| Patient education/ training/ counselling to increase patients' knowledge about their condition | The patient signs up for a group‐based self‐management program where she is provided with information about her condition and becomes part of a patient group for sharing of experiences to increase self‐efficacy and coping. | Activation of patient by others → clinical encounter → impact on healthcare professionals' performance | Education/training/counselling to increase patients' knowledge about their condition, which can increasing their self‐efficacy and self‐care skills. This in turn, might encourage patients to get more involved in decisions about their treatment and management and professionals might respond by providing recommended health care. | Healthcare professionals might feel threatened by this or disagree with the patient. It might increase healthcare professionals' burden if they need to spend more time finding answers to patients' questions. Patients might feel more uncomfortable if they have more questions but do not feel comfortable asking them. Patients might not like the answers they are given. This might lead to longer consultations without measurable improvements in the quality of care. |
| Patient feedback about clinical practice (collecting information from patients after an encounter) | After the patient has used a healthcare service, she might be asked about her experience with the service or doctor. This information is then fed back to the doctors and/or hospital. | Information to healthcare professionals from patients → impact on healthcare professionals' performance | Clinical performance feedback from patients might ensure that professionals get important information that they might otherwise not have received. This information might prompt professionals to improve their practice and provide recommended health care. | This might distract healthcare professionals from focusing on other things or lead to longer consultations without measurable improvements in the quality of care, if the information that is collected turns out not to be important. |
| Patient decision aids to ensure that the choices about treatment and management reflect recommended care and the patients' values and preferences | The patient is provided with information about treatment options including risks and benefits. The patient considers this information, either alone or with a healthcare professional, to reach a decision in accordance with her values and preferences. | Activation of patient by others → clinical encounter → impact on healthcare professionals' performance | Giving recommendations or evidence to patients and encouraging them to engage with their own values and preferences for treatment options might encourage healthcare professionals to provide recommended health care. | Healthcare professionals might feel threatened by this or disagree with the patient. It might increase healthcare professionals' burden if they need to spend more time finding answers to patients' questions. Patients might feel more uncomfortable if they have more questions but do not feel comfortable asking them. Patients might not like the answers they are given. This might lead to longer consultations without measurable improvements in the quality of care. |
| Patients, or patient representatives, being members of a committee or board | A patient representative from a patient organisation is, on behalf of a patient group, part of a hospital board. The board may discuss patient care and make decisions about professional practice within the hospital. | Information to healthcare professionals from patients → committee or board meeting→ impact on healthcare professionals' performance | Patients being part of a prioritisation or agenda deciding process at the health system level might influence professional practice and result in giving patients the recommended health care | Healthcare professionals on the committee or board might feel threatened by this or disagree with the patients' prioritisation or decisions. This might in turn, lead to poor implementation of recommendations or guidelines made within this format. |
| Patient‐led training or education of healthcare professionals | Patients taking part in training of doctors, e.g. to improve communication skills, how to perform physical examinations or the importance of certain clinical procedures. | Information and/or activation of healthcare professionals by patients → impact on healthcare professionals' performance | Patients being part of the education or training of healthcare professional might influence professional practice and result in providing recommended health care | Healthcare professionals might feel threatened by this or disagree with the patient trainer or educator. This might result in non‐adherence to the care recommended in this training or education. |
| Study | Primary outcomes | Findings |
| Antibiotic prescriptions (Recommended clinical practice is less antibiotic prescriptions to children with ear‐nose‐throat infections) | Author’s quote: “A significant protective effect is demonstrated for the SCT‐based communication intervention (OR = 0.171, p = 0.042)” N= 40 (20 patients in each comparison group). | |
| Physician recommendation of colorectal cancer screening (Recommended clinical practice is to increase screening) | Intervention: 19/31 (61.3%) Comparison: 14/34 (41.2%) Outcome also included in meta‐analysis | |
| Number of counselling items done by healthcare professional (Desired practice is more counselling of people with mental problems) | Patient‐reported Intervention: 2.8 (se=1.62), N= 29 Comparison: 2.9 (se=1.41), N= 50 Healthcare professional reported Intervention: 2.8 (se=1.62), N= 29 Comparison: 2.9 (se=1.41), N= 50 ** did not attempt to accounting for clustering because the study was not pooled in a meta‐analysis | |
| Pertussis (Tdap) vaccination (Desired practice is to increase vaccination) | Intervention: 89/687 (13%) Comparison: 76/715 (10.6%) Outcome also included in meta‐analysis ** with accounting for clustering (ICC = 0.000), the effective total sample size remained the same | |
| 1. Primary care provider write an order for a colorectal cancer screening test 2. Doctor recommended fecal occult blood test (FOBT) 3. Doctor recommended colonoscopy (Desired practice is to increase screening) | 1. Doctor recommendation of FOBT: OR=1.15 (95% CI: 0.81, 1.63), p=0.420 | |
| 1. Correctly identified level of chronic asthma control 2. Correctly identified child’s asthma trajectory 3. Correctly identified level of medication adherence 4. Correctly identified degree of disease burden to the family (Desired practice is more accurate identification of asthma morbidity) | 1. Intervention: 17/40 (43%) Comparison: 7/37 (19%) 2.* Intervention: 29/40 (72%) Comparison: 17/37 (45%) 3. Intervention: 29/40 (72%) Comparison: 18/37 (48%) 4. Intervention: 30/40 (74%) Comparison: 13/37 (35%) * outcome also included in meta‐analysis (median outcome) | |
| 1. Number of women offered mammogram 2. Number of women offered clinical breast exam 3. Number of women offered mammogram among those not previously having a mammogram 4. Number of women with a documented clinical breast exam among those not previously having a clinical breast exam (Desired practice is to increase preventive services) | 1. Intervention: 28.4%, N=not reported Comparison: 19.4%, N=not reported 2. Intervention:25%, N=not reported Comparison: 17.9%, N=not reported 3. Intervention: 50/159 (31.4%) Comparison: 29/161 (18%) 4.* Intervention: 40/183 (21.9%) **3/13 when adjusted for clustering Comparison: 34/192 (17.9%) **2/13 when adjusted for clustering * outcome also included in meta‐analysis (median outcome of 3 and 4). ** with accounting for clustering (ICC=0.076), the effective total sample size was 39 patients (13 patients to each group, if evenly distributed between 3 arms). | |
| 1. Clinician recommended vaccine 2. Administration of the vaccine at that clinic visit (Desired practice is to increase vaccination) | 1. Intervention: 60/221 (27.1%) Comparison: 13/212 (6.1%) 2.* Intervention: 44/221 (19.9%) Comparison: 8/212 (3.8%) * outcome also included in meta‐analysis (primary outcome defined by study author) | |
| Change in medication when indicated by NAEPP guideline recommended practice (Change according to recommended clinical practice) | Intervention: 105 persons stepped up per 1332 step‐up letters* sent to providers Comparison: 49 persons stepped up per 1117 “non‐sent potential” step‐up letters* sent to providers *identified cases in need of stepping up medication (referred to as step‐up letters that could have been sent 1‐6 times per patient that needed step‐up) | |
| Diabetes screening of eligible patients who visited a family practitioner (Recommended clinical practice is to increase screening of eligible people) | Intervention: 392/1639 (23.9%) Comparison: 240/1550 (15.5%) Outcome also included in meta‐analysis ** with accounting for clustering (ICC = 0.000), the effective total sample size remained the same | |
| 1. Diabetes medication prescriptions 2. Hypertension medications (Desired practice is intensification of diabetes therapy) | 1.* Intervention: 51/53 (96.2%) Comparison: 35/47 (74.5%) 2. Intervention: 43/53 (81.1%) Comparison: 30/47 (63.8%) * outcome also included in meta‐analysis (median outcome) | |
| Physician‐directed adjustment in analgesia | Intervention: 75/125 (60%) Comparison: 48/132 (36.4%) Outcome also included in meta‐analysis | |
| 1. Stopped or reduced PPI dose 2. Stopped prescribed PPI 3. Had increased PPI dose (Desired practice is reduction in PPI medication) | 1.* Intervention: 12/54 (22.2%) Comparison: 3/44 (6.8%) 2. Intervention: 7/54 (13%) Comparison: 2/44 (4.5%) 3. Intervention: 3/54 (5.6%) Comparison: 6/44 (13.6%) * outcome also included in meta‐analysis (primary outcome defined by study author) ** with accounting for clustering (ICC = 0.000), the effective total sample size remained the same | |
| Screened condition identified at the index visit (Desired practice is to increase identification of mental problems) | Intervention: 69/115 (60%) Comparison: 65/118 (55.1%) Outcome also included in meta‐analysis | |
| Recognition of mental health problems (Desired practice is to increase identification of mental problems) | Intervention: 114/357 (31.9%) Comparison: 40/216 (18.5%) Outcome also included in meta‐analysis ** with accounting for clustering (ICC = 0.000), the effective total sample size remained the same | |
| 1. The proportion of patients whose therapy met the ACCP treatment recommendations – at 3 months 2. The proportion of patients whose therapy met the ACCP treatment recommendations – at 12 months | 1. Intervention: 89/219 (40.6%) Comparison: 79/215 (36.7%) 2.* Intervention: 70/219 (32%) Comparison: 80/215 (37.4%) * outcome also included in meta‐analysis (secondary outcome defined by study authors, but we predefined in our protocol that we would choose the outcome with the longest follow‐up as our primary outcome.) | |
| 1. Proportion of patients prescribed statins according to guideline 2. Proportion of patients prescribed aspirin according to guideline (Recommended clinical practice is adherence to hypertension treatment Guidelines) | 1.* Intervention: 39/134 (29%) Comparison: 54/142 (38%) 2. Intervention: 53/88 (60%) Comparison: 55/95 (58%) * outcome also included in meta‐analysis (median outcome) | |
| Appropriate analgesic prescription (around the clock plus as needed) | Intervention: 34/92 (37%) Comparison: 26/80 (32.5%) Outcome also included in meta‐analysis | |
| 1. No benzodiazepines prescription 2. 50‐90% reduction in benzodiazepines prescriptions 3. 0‐49% reduction in benzodiazepines prescriptions 4. Increase in benzodiazepines prescriptions 5. Average prescriptions of benzodiazepines (defined daily doses) (Recommended clinical practice is less benzodiazepines prescriptions in mental health) | 1.* Intervention: 29/92 (32%) Comparison: 6/63 (10%) 2. Intervention: Approximately 25%, N=92 Comparison: Approximately 22%, N=63 3. Intervention: Approximately 36%, N=92 Comparison: Approximately 47%, N=63 4. Intervention: Approximately 8%, N=92 Comparison: Approximately 20%, N=63 5. Intervention: Before: 24.63 DDD/month (range 5‐80). After: 12.40 DDD/ month (range 0‐70), N=92 Comparison: Before: 29.02 ODD/ month (range 4‐108). After: 22.39 DDD/ month (range 0 ‐ 102), N=63 * outcome also included in meta‐analysis (the only relevant outcome reported dichotomously with complete numbers) | |
| 1. Adults provided all recommended preventive services 2. Adults given low dose aspirin, if indicated 3. Adults given Pneumococcal vaccination because of chronic health conditions 4. Adults given Pneumococcal vaccination because of chronic health conditions 5. Children given all recommended immunizations (Desired practice is increased coverage of preventive services) | 1. Intervention: 84.4%, N=not reported Comparison: 67.6%, N=not reported 2. Intervention: 78.6%, N=not reported Comparison: 52.3%, N=not reported 3. Intervention: 82.5%, N=not reported Comparison: 53.9%, N=not reported 4. Intervention: 86.3%, N=not reported Comparison: 44.6%, N=not reported 5. Intervention: 95.5%, N=not reported Comparison: 87.2%, N=not reported ** did not attempt to accounting for clustering because the study was not pooled in a meta‐analysis | |
| 1. Medications titrated or changed by their healthcare professional 2. Medication errors identified by their healthcare professional (Desired practice is to follow prescribing guidelines) | 1.* Intervention: 11/13 (84.6%) Comparison: 3/63 (23.1%) 2. Intervention: 7/13 (53.4%) Comparison: 0/13 (0%) * outcome also included in meta‐analysis (median outcome) | |
| 1. Perform serum creatinine tests 2. Perform urine protein tests 3. Perform serum potassium tests 4. Doctor recommended starting a new blood pressure medication 5. Doctor recommended increasing dose of a blood pressure medication (Desired practice is medication intensification among patients whose blood pressure was not at target) | 1. Intervention: 211/282 (74.8%) Comparison: 156/218 (71.6%) 2.* Intervention: 86/282 (30.5%) Comparison: 58/218 (26.6%) 3. Intervention: 209/282 (74.1%) Comparison: 153/218 (70.2%) 4. Intervention: 21/179 (11.7%) Comparison: 13/149 (8.7%) 5. Intervention: 18/168 (10.7%) Comparison: 13/144 (9%) * outcome also included in meta‐analysis (median outcome) ** with accounting for clustering (ICC = 0.000), the effective total sample size remained the same | |
| Primary care physician recommended vaccine (Recommended clinical practice is to increase vaccination) | Intervention: 64/189 (33.9%) Comparison: 24/182 (13.2%) Outcome also included in meta‐analysis | |
| 1. Perform pap‐smear 2. Perform breast exam 3. Schedule mammography 4. Stool occult test 5. Give influenza vaccine 6. Give pneumococcal vaccine (Recommended clinical practice is to increase vaccination) | 1. Intervention: 28/94 indicated (29.8%) Comparison: 30/151 indicated (19.9%) 2. Intervention: 44/84 indicated (52.4%) Comparison: 58/118 indicated (49.2%) 3. Intervention: 18/147 indicated (12.2%) Comparison: 25/130 indicated (19.2%) 4.* Intervention: 86/132 indicated (65.2%) Comparison: 91/196 indicated (46.4%) 5. Intervention: 59/86 indicated (68.6%) Comparison: 51/177 indicated (28.8%) 6. Intervention: 19/86 indicated (22.1%) Comparison: 29/118 indicated (24.6%) * outcome also included in meta‐analysis (median outcome) | |
| 1. Give influenza vaccines 2. Perform mammography 3. Perform pap smears 4. Give pneumococcal vaccine 5. Test bone density 6. Test cholesterol (Recommended clinical practice is to increase vaccination) | 1.* Intervention: 50/227 (22%) Comparison: 40/285 (14%) 2. Intervention: 51/105 (48.6%) Comparison: 28/95 (29.5%) 3. Intervention: 25/61 (41%) Comparison: 7/67 (10.4%) 4. Intervention: 11/86 (12.8%) Comparison: 10/113 (8.9%) 5. Intervention: 2/24 (8.3%) Comparison: 3/132 (2.3%) 6. Intervention: 20/43 (46.5%) Comparison: 14/48 (29.2%) * outcome also included in meta‐analysis (median outcome) |
| Study | Secondary outcomes | Findings |
| Patient satisfaction with the care they receive 1. General satisfaction 2. Interpersonal manner 3. Time spent with doctor | Author’s quote: “Significant associations were observed for General Satisfaction (p = 0.002), Interpersonal Manner (p = 0.010), and Time Spent with Doctor (p = 0.002)”. | |
| No relevant secondary outcomes reported | ||
| Patient health outcomes 1. Patients with a psychological disorder (outcome could not be categorised into our categories because desired direction not provided) 2. Control over stress Patient satisfaction with the care they receive 3. Patient report of rating of amount of time spent counselling (1=no time, 5= >15 minutes) 4. Patient report of rating of satisfaction with physician (scale range not reported, higher score means better) | 1. Intervention: 71%, N= 29 Comparison: 56%, N=50 2. Authors quote: “…52% felt they experienced some increase in their sense of control over stress following the medical visit.” “… 32% of control patients who indicated some beneficial changes in their control over stress. 3. Intervention: 2.9 (se=0.2), N= 29 Comparison: 2.5 (se=0.1), N=50 4. Intervention: 4.7 (se=0.1), N= 29 Comparison: 4.3 (se=0.1), N=50 | |
| No relevant secondary outcomes reported | ||
| No relevant secondary outcomes reported | ||
| No relevant secondary outcomes reported | ||
| No relevant secondary outcomes reported | ||
| No relevant secondary outcomes reported | ||
| Patient health outcomes Maximum symptom days (outcome could not be categorised into our categories) Resource use Intervention cost and cost effectiveness | Author’s quote: “It took 40 minutes per child to reach the caretaker and make the assessment call, enter the data, and mail the letter. In calculating the costs, we used an hourly wage of $15 for a clerical employee. There were 6 calls per child per year resulting in a cost of $60. We estimated $10 for supplies and informational materials for the PCP. Because some PCPs had 1 child in the study, the cost for these materials on a per child basis was $9.20. The intervention was estimated to cost $69.20 per child over the year. When this cost was added to the cost of health services use for the year by intervention children and compared with the cost of health service use by control children, there was a savings of $337.00 per child in the intervention group. The Monte Carlo simulations, using the observed distributions of symptom days and resource use, showed that the intervention had a 97% chance of being cost saving.” | |
| No relevant secondary outcomes reported | ||
| Patient health outcomes HbA1c (outcome could not be categorised into our categories) | Intervention: Before: 9.1 (sd=2.5). After: 7.6 (sd=1.8), N= 53 Comparison: Before: 9.4 (sd=2.7). After: 8.6 (sd=2.5), N=47 | |
| Patient health outcomes 1. Pain severity 2. Pain‐related impairment | 1. Pain severity. Coefficient 0.05 (95% CI ‐0.39, 0.49) p=0.81. Pain severity is the mean of worst and average pain, scaled 0‐10, with 10 representing maximal pain (Intervention group N= 126, comparison group N= 132) 2. Pain‐related impairment. Coefficient ‐0.08 (95% CI ‐0.28, 0.12) p=0.44. Pain impairment is scaled 1‐5, with 5 representing maximal impairment (Intervention group N= 126, comparison group N= 132) | |
| Patient health outcomes 1. Dyspesia severity is high 2. Mental health (RAND‐36, higher score means a more favourable health state) 3. Vitality (RAND‐36, higher score means a more favourable health state) | 1. Intervention: Before: 29/63. After: 19/59 Comparison: Before 23/50. After: 20/45 2.* Intervention: Before: 23.5, N=63. After: 22.6, N= 59 Comparison: Before: 24, N=50. After: 23.1, N=45 3.* Intervention: Before: 17, N=63. After: 16.5, N= 59 Comparison: Before: 16, N=50. After: 16.4, N=45 | |
| Patient satisfaction with the care they receive (at 1 week) 1. Rate the medical care in visit (on a 1‐10 scale, 10 is best) 2. Doctor definitely showed concern about health/feelings 3. Doctor definitely spent enough time Patient health outcomes (at 3 months) 4. Fair to poor health 5. Pain subscale SF‐36 (moderate‐severe) 6. Average pain rating (on a 1‐10 scale, 10 is most) (outcome could not be categorised into our categories) | 1. Intervention: 9.4 (sd=0.9), N=94 Comparison: 9.1 (sd=1.1), N=92 2. Intervention: 86/94 Comparison: 82/92 3. Intervention: 75/94 Comparison: 68/92 4. Intervention: Before: 19/71. After: 17/71 Comparison: Before: 15/71. After: 13/71 5. Intervention: Before: 40/64. After: 36/64 Comparison: Before: 38/59. After: 35/59 6. Intervention: Before: 4.5 (sd=2.2). After: 3.3 (sd=2.9), N= 64 Comparison: Before: 5.1 (sd=2.0). After: 3.8 (sd=3.1), N=59 | |
| No relevant secondary outcomes reported | ||
| No relevant secondary outcomes reported | ||
| Patient health outcomes 1. Blood pressure (controlled, systolic and diastolic) 2. Cholesterol (outcome could not be categorised into our categories) | 1. Intervention: Controlled: Before: 64/148, after: 71/131. Systolic: Before: 147 mmHg (sd=19), N=148, after: 148 mmHg (sd=22), N= 131. Diastolic: after: 84 mmHg (sd=10), after: 80 mmHg (sd=12), N=131 Controlled: Before: 69/146, after: 71/130 Systolic: Before: 146 mmHg (sd=19), N=146, after: 148 mmHg mmHg (sd=21), N=130 Diastolic: Before: 82 mmHg (sd=11), N=146, after: 80 mmHg (sd=12), N=130 2. Intervention: Before: 5.4 (sd=1.2), N= 148, after: 5.2 mmol/L (sd=1.0), N=131 Comparison: Before: 5.4 (sd=1.1), N= 146, 5.2 mmol/L (sd=1.1), N=130 | |
| Patient health outcomes (average pain) | Author’s quote: “For average pain, a significant group time interaction (P < 0.0001) as well as significant main effects of group (P < 0.026) and time (P < 0.0001) were found. Tests of simple effects within the two groups showed a significant decrease in average pain scores over time in the intervention group (P < 0.0001) but not in the standard care group (P = 0.857).” Self‐report before bedtime for 6 weeks using a descriptive numeric rating scale that ranged from 0 (none) to 10 (excruciating). | |
| No relevant secondary outcomes reported | ||
| No relevant secondary outcomes reported | ||
| Patient health outcomes 1. HbA1c 2. Depression diagnosis (outcome could not be categorised into our categories because desired direction not provided) Patient satisfaction with the care they receive 3. Healthcare provider's diabetes management improved by receipt of blood sugar measurements (patient survey) | 1.* Intervention: Before: 9.51%. After: 7.48%, N=13 2. Intervention: 1/13 (9.1%) Comparison: 3/13 (20%) 3. Intervention: 13/13 (100%) Comparison: 5/13 (27.5%) *No sd (standard deviation) provided | |
| Patient health outcomes (controlled blood pressure) | Intervention: 201/282 (71.3%) Comparison: 143/218 (65.6%) | |
| No relevant secondary outcomes reported | ||
| No relevant secondary outcomes reported | ||
| No relevant secondary outcomes reported |
| Outcome or subgroup title | No. of studies | No. of participants | Statistical method | Effect size |
| 1 Adherence to recommended practice Show forest plot | 4 | 3865 | Risk Ratio (M‐H, Random, 95% CI) | 1.59 [1.41, 1.81] |
| 2 Desirable patient health outcomes (increased control over stress) Show forest plot | 1 | 79 | Risk Ratio (M‐H, Random, 95% CI) | 1.62 [0.95, 2.76] |
| 3 Patient satisfaction (with care). Number of satisfied patients Show forest plot | 1 | 26 | Risk Ratio (M‐H, Random, 95% CI) | 2.45 [1.27, 4.74] |
| 4 Patient satisfaction (with healthcare professional). The degree of satisfaction Show forest plot | 1 | 79 | Mean Difference (IV, Random, 95% CI) | 0.40 [0.12, 0.68] |
| Outcome or subgroup title | No. of studies | No. of participants | Statistical method | Effect size |
| 1 Adherence to recommended practice Show forest plot | 11 | 3502 | Risk Ratio (M‐H, Random, 95% CI) | 1.60 [1.20, 2.13] |
| 2 Adherence to recommended practice. Risk of bias Show forest plot | 11 | 3502 | Risk Ratio (M‐H, Random, 95% CI) | 1.60 [1.20, 2.13] |
| 2.1 Low risk | 0 | 0 | Risk Ratio (M‐H, Random, 95% CI) | 0.0 [0.0, 0.0] |
| 2.2 Unclear risk | 10 | 3131 | Risk Ratio (M‐H, Random, 95% CI) | 1.48 [1.12, 1.95] |
| 2.3 High risk | 1 | 371 | Risk Ratio (M‐H, Random, 95% CI) | 2.57 [1.68, 3.92] |
| 3 Adherence to recommended practice. Direction of behaviour Show forest plot | 11 | 3502 | Risk Ratio (M‐H, Random, 95% CI) | 1.60 [1.20, 2.13] |
| 3.1 Increasing a certain behaviour | 9 | 3249 | Risk Ratio (M‐H, Random, 95% CI) | 1.46 [1.10, 1.94] |
| 3.2 Reducing a certain behaviour | 2 | 253 | Risk Ratio (M‐H, Random, 95% CI) | 3.29 [1.67, 6.48] |
| 4 Desirable patient health outcomes (controlled blood pressure) Show forest plot | 1 | 261 | Risk Ratio (M‐H, Random, 95% CI) | 0.99 [0.79, 1.24] |
| 5 Undesirable patient health outcomes (dyspepsia severity is high, fair to poor health) Show forest plot | 2 | 246 | Risk Ratio (M‐H, Random, 95% CI) | 0.94 [0.53, 1.67] |
| 6 Patient satisfaction (with healthcare professional). Number of satisfied patients Show forest plot | 1 | 186 | Risk Ratio (M‐H, Random, 95% CI) | 1.03 [0.93, 1.13] |
| 7 Patient satisfaction (with care). The degree of satisfaction Show forest plot | 1 | 186 | Mean Difference (IV, Random, 95% CI) | 0.30 [0.01, 0.59] |
| Outcome or subgroup title | No. of studies | No. of participants | Statistical method | Effect size |
| 1 Adherence to recommended practice Show forest plot | 4 | 1029 | Risk Ratio (M‐H, Random, 95% CI) | 1.31 [1.12, 1.54] |
| 2 Desirable patient health outcomes (controlled blood pressure) Show forest plot | 1 | 500 | Risk Ratio (M‐H, Random, 95% CI) | 1.09 [0.96, 1.23] |
| Outcome or subgroup title | No. of studies | No. of participants | Statistical method | Effect size |
| 1 Adherence to recommended practice Show forest plot | 1 | 353 | Risk Ratio (M‐H, Random, 95% CI) | 0.86 [0.65, 1.15] |