Les interventions médicamenteuses pour le traitement de l'obésité chez les enfants et les adolescents
Appendices
Appendix 1. Search strategies
| Cochrane Central Register of Controlled Trials (Cochrane Register of Studies) |
| Part I: Obesity 1. MESH DESCRIPTOR Obesity 2. MESH DESCRIPTOR Obesity, Morbid 3. MESH DESCRIPTOR Obesity, Abdominal 4. MESH DESCRIPTOR Pediatric Obesity 5. MESH DESCRIPTOR Overweight 6. MESH DESCRIPTOR Weight Loss 7. (adipos* or obes*):TI,AB,KY 8. (overweight* or over weight*):TI,AB,KY 9. (weight adj2 (reduc* or los* or control* or gain*)):TI,AB,KY 10. #1 or #2 or #3 or #4 or #5 or #6 or #7 or #8 or #9 Part II: Anti‐obesity drugs 11. MESH DESCRIPTOR Anti‐Obesity Agents 12. MESH DESCRIPTOR Appetite Depressants 13. ((anti obes* or antiobes* or weight loss) adj3 (agent* or drug* or medicine* or pharmac*)):TI,AB,KY 14. (appetite adj3 (suppress* or depress*)):TI,AB,KY 15. ((anorexi* or anorectic*) adj3 (agent* or drug*)):TI,AB,KY 16. anorectics:TI,AB,KY 17. metformin*:TI,AB,KY 18. exenatide*:TI,AB,KY 19. liraglutid*:TI,AB,KY 20. dulaglutid*:TI,AB,KY 21. albiglutid*:TI,AB,KY 22. taspoglutid*:TI,AB,KY 23. lixisenatid*:TI,AB,KY 24. semaglutid*:TI,AB,KY 25. orlistat*:TI,AB,KY 26. cetilistat*:TI,AB,KY 27. sibutramin*:TI,AB,KY 28. fluoxetin*:TI,AB,KY 29. rimonabant*:TI,AB,KY 30. lorcaserin*:TI,AB,KY 31. benzphetamin*:TI,AB,KY 32. diethylpropion*:TI,AB,KY 33. phendimetrazin*:TI,AB,KY 34. mazindol*:TI,AB,KY 35. (phentermin* or chlorphentermin* or mephentermin*):TI,AB,KY 36. (phentermin* adj3 topiramat*):TI,AB,KY 37. (bupropion* adj3 naltrexon*):TI,AB,KY 38. (bupropion* adj3 zonisamid*):TI,AB,KY 39. beloranib*:TI,AB,KY 40. velneperit*:TI,AB,KY 41. tesofensin*:TI,AB,KY 42. #11 or #12 or #13 or #14 or #15 or#16 or #17 or #18 or #19 or #20 or #21 or #22 or #23 or #24 or #25 or #26 or #27 or #28 or #29 or #30 or #31 or #32 or #33 or #34 or #35 or #36 or #37 or #38 or #39 or #40 or #41 Part III: Part I + Part II 43. #10 and #42 44. MESH DESCRIPTOR Obesity WITH QUALIFIERS DT 45. MESH DESCRIPTOR Obesity, Morbid WITH QUALIFIERS DT 46. MESH DESCRIPTOR Weight Loss WITH QUALIFIERS DT 47. MESH DESCRIPTOR Overweight WITH QUALIFIERS DT 48. #43 or #44 or #45 or #46 or #47 Part IV: Population 49. MESH DESCRIPTOR Adolescent 50. MESH DESCRIPTOR Child 51. MESH DESCRIPTOR Pediatrics 52. minors:TI,AB,KY 53. (boy or boys or boyhood):TI,AB,KY 54. girl*:TI,AB,KY 55. (kid or kids):TI,AB,KY 56. (child* or schoolchild*):TI,AB,KY 57. adolescen*:TI,AB,KY 58. juvenil*:TI,AB,KY 59. youth*:TI,AB,KY 60. (teen* or preteen*):TI,AB,KY 61. (underage* or under age*):TI,AB,KY 62. pubescen*:TI,AB,KY 63. p?ediatric*:TI,AB,KY 64. #49 or #50 or #51 or #52 or #53 or #54 or #55 or #56 or #57 or #58 or #59 or #60 or #61 or #62 or #63 Part V: Part III AND IV 65. #48 and #64 66. MESH DESCRIPTOR Pediatric Obesity WITH QUALIFIERS DT 67. #65 or #66 |
| MEDLINE (OvidSP) |
| Part I: Obesity 1 Obesity/ 2 Obesity, Morbid/ 3 Obesity, Abdominal/ 4 Pediatric Obesity/ 5 Overweight/ 6 Weight Loss/ 7 (adipos* or obes*).tw. 8 (overweight* or over weight*).tw. 9 (weight adj2 (reduc* or los* or control* or gain*)).tw. 10 or/1‐9 Part II: Anti‐obesity drugs 11 Anti‐Obesity Agents/ 12 Appetite Depressants/ 13 ((anti obes* or antiobes* or weight loss) adj3 (agent* or drug* or medicine* or pharmac*)).tw. 14 (appetite adj3 (suppress* or depress*)).mp. 15 ((anorexi* or anorectic*) adj (agent* or drug*)).tw. 16 anorectics.tw. 17 metformin*.mp. 18 exenatide*.mp. 19 liraglutid*.mp. 20 dulaglutid*.mp. 21 albiglutid*.mp. 22 taspoglutid*.mp. 23 lixisenatid*.mp. 24 semaglutid*.mp. 25 orlistat*.mp. 26 cetilistat*.mp. 27 sibutramin*.mp. 28 fluoxetin*.mp. 29 rimonabant*.mp. 30 lorcaserin*.mp. 31 benzphetamin*.mp. 32 diethylpropion*.mp. 33 phendimetrazin*.mp. 34 mazindol*.mp. 35 (phentermin* or chlorphentermin* or mephentermin*).mp. 36 ((phentermin* adj3 topiramat*) or phentermine?topiramat*).mp. 37 ((bupropion* adj3 naltrexon*) or bupropion?naltrexon*).mp. 38 ((bupropion* adj3 zonisamid*) or bupropion?zonisamid*).mp. 39 beloranib*.mp. 40 velneperit*.mp. 41 tesofensin*.mp. 42 or/11‐41 Part III: Part I + Part II and additional MeSH/subheading combination 43 10 and 42 44 Obesity/dt [drug therapy] 45 Obesity, Morbid/dt [drug therapy] 46 Weight Loss/dt [drug therapy] 47 Overweight/dt [drug therapy] 48 or/43‐47 Part IV: Population [based on Leclercq 2013] 49 Adolescent/ 50 Child/ 51 Pediatrics/ 52 minors.tw. 53 (boy or boys or boyhood).tw. 54 girl*.tw. 55 (kid or kids).tw. 56 (child* or schoolchild*).tw. 57 adolescen*.tw. 58 juvenil*.tw. 59 youth*.tw. 60 (teen* or preteen*).tw. 61 (underage* or under age*).tw. 62 pubescen*.tw. 63 p?ediatric*.tw. 64 or/49‐63 Part V: Part III AND IV and additional MeSH/subheading combination 65 48 and 64 66 Pediatric Obesity/dt 67 65 or 66 Part VI: Study filter [Cochrane Handbook 2008 RCT filter ‐ sensitivity max. version] 68 randomized controlled trial.pt. 69 controlled clinical trial.pt. 70 randomi?ed.ab. 71 placebo.ab. 72 drug therapy.fs. 73 randomly.ab. 74 trial.ab. 75 groups.ab. 76 or/68‐75 77 exp animals/ not humans/ 78 76 not 77 Part VII: Part V + Part VI 79 67 and 78 |
| Embase (OvidSP) |
| Part I: Obesity 1 obesity/ 2 morbid obesity/ 3 abdominal obesity/ 4 childhood obesity/ 5 weight reduction/ 6 (adipos* or obes*).tw. 7 (overweight* or over weight*).tw. 8 (weight adj2 (reduc* or los* or control* or gain*)).tw. 9 or/1‐8 Part II: Anti‐obesity drugs 10 antiobesity agent/ 11 anorexigenic agent/ 12 ((anti obes* or antiobes* or weight loss) adj3 (agent* or drug* or medicine* or pharmac*)).tw. 13 (appetite adj3 (suppress* or depress*)).tw. 14 ((anorexi* or anorectic*) adj (agent* or drug*)).tw. 15 anorectics.tw. 16 metformin*.mp. 17 exenatide*.mp. 18 liraglutid*.mp. 19 dulaglutid*.mp. 20 albiglutid*.mp. 21 taspoglutid*.mp. 22 lixisenatid*.mp. 23 semaglutid*.mp. 24 orlistat*.mp. 25 cetilistat*.mp. 26 sibutramin*.mp. 27 fluoxetin*.mp. 28 rimonabant*.mp. 29 lorcaserin*.mp. 30 benzphetamin*.mp. 31 diethylpropion*.mp. 32 phendimetrazin*.mp. 33 mazindol*.mp. 34 (phentermin* or chlorphentermin* or mephentermin*).mp. 35 ((phentermin* adj3 topiramat*) or phentermine?topiramat*).mp. 36 ((bupropion* adj3 naltrexon*) or bupropion?naltrexon*).mp. 37 ((bupropion* adj3 zonisamid*) or bupropion?zonisamid*).mp. 38 beloranib*.mp. 39 velneperit*.mp. 40 tesofensin*.mp. 41 or/10‐40 Part III: Part I + Part II and additional MeSH/subheading combination 42 9 and 41 43 obesity/dt [drug therapy] 44 morbid obesity/dt [drug therapy] 45 weight reduction/dt [drug therapy] 46 or/42‐45 Part IV: Population [adapted from Leclercq 2013] 47 juvenile/ 48 adolescent/ 49 child/ 50 preschool child/ 51 schoolchild/ 52 pediatrics/ 53 minors.tw. 54 (boy or boys or boyhood).tw. 55 girl*.tw. 56 (kid or kids).tw. 57 (child* or schoolchild*).tw. 58 adolescen*.tw. 59 juvenil*.tw. 60 youth*.tw. 61 (teen* or preteen*).tw. 62 (underage* or under age*).tw. 63 pubescen*.tw. 64 p?ediatric*.tw. 65 or/47‐64 Part V: Part III AND IV and additional MeSH/subheading combination 66 46 and 65 67 childhood obesity/dt 68 66 or 67 Part VI: Study filter [ Wong 2006afilter – BS version] 69 random*.tw. or clinical trial*.mp. or exp health care quality/ Part VII: Part V + Part VI 70 68 and 69 71 limit 70 to embase |
| LILACS (IAHx) |
| ((MH:"Obesity" OR MH:"Obesity, Morbid" OR MH:"Obesity, Abdominal" OR MH:"Pediatric Obesity" OR MH:"Overweight" OR MH:"Weight Loss" OR adipos$ OR obes$ OR overweight$ OR "over weight" OR sobrepes$ OR "exceso de peso" OR "excesso de peso" OR "weight reduction" OR "weight loss" OR "weight control") AND (MH:"Obesity/drug therapy" OR MH:"Obesity, Morbid/drug therapy" OR MH:"Overweight/drug therapy" OR MH:"Weight Loss/drug therapy" OR MH:"Anti‐Obesity Agents" OR MH:"Appetite Depressants" OR "farmacos antiobesidad" OR "farmacos antiobesidade" OR "depresores del apetito" OR "depressores do apetite" OR metformin$ OR exenatide$ OR liraglutid$ OR dulaglutid$ OR albiglutid$ OR taspoglutid$ OR lixisenatid$ OR semaglutid$ OR orlistat$ OR cetilistat$ OR sibutramin$ OR fluoxetin$ OR rimonabant$ OR lorcaserin$ OR benzphetamin$ OR diethylpropion$ OR phendimetrazin$ OR mazindol$ OR phentermin$ or chlorphentermin$ or mephentermin$ OR (phentermin$ AND topiramat$) OR (bupropion$ AND (naltrexon$ OR zonisamid$)) OR beloranib$ OR velneperit$ OR tesofensin$) AND (MH:"Adolescent" OR MH:"Child" OR MH:"Pediatrics" OR minors OR boy OR boys OR girl$ OR kid OR kids OR child$ OR schoolchild$ OR escolar$ OR adolescen$ OR preadolescen$ OR juvenil$ OR juventud$ OR youth$ OR teen$ OR preteen$ OR underage$ OR pubescen$ OR paediatri$ OR pediatri$ OR joven$ OR jovem$ OR niños OR niñas OR crianca$ OR menin$ OR "menor de edad" OR "menores de edad" OR "menor de idade" OR "menores de idade") OR MH:"Pediatric Obesity/drug therapy") + Controlled Clinical Trial |
| PubMed (only subsets not available on Ovid) |
| #1 Part I: Obesity adipos*[tw] OR obes*[tw] OR overweight*[tw] OR over weight*[tw] OR weight reduc*[tw] OR weight los*[tw] OR weight control*[tw] OR weight gain*[tw] #2 Part II: Antiobesity drugs anti obesity agent*[tw] OR antiobesity agent*[tw] OR anti obesity drug*[tw] OR antiobesity drug*[tw] OR weight loss agent[tw] OR weight loss drug[tw] OR appetite suppress*[tw] OR appetite depress*[tw] OR anorexigenic agent*[tw] OR anorexigenic drug*[tw] OR anorectics[tw] OR metformin*[tw] OR exenatide*[tw] OR liraglutid*[tw] OR dulaglutid*[tw] OR albiglutid*[tw] OR taspoglutid*[tw] OR lixisenatid*[tw] OR semaglutid*[tw] OR orlistat*[tw] OR cetilistat*[tw] OR sibutramin*[tw] OR fluoxetin*[tw] OR rimonabant*[tw] OR lorcaserin*[tw] OR benzphetamin*[tw] OR diethylpropion*[tw] OR phendimetrazin*[tw] OR mazindol*[tw] OR phentermin*[tw] OR chlorphentermin*[tw] OR mephentermin*[tw] OR topiramat*[tw] OR bupropion*[tw] OR naltrexon*[tw] OR zonisamid*[tw] OR beloranib*[tw] OR velneperit*[tw] OR tesofensin*[tw] #3 Part III: Part I + Part II #1 AND #2 #4 Part IV: Population minors[tw] OR boy[tw] OR boys[tw] OR boyhood[tw] OR girl*[tw] OR kid[tw] OR kids[tw] OR child*[tw] OR schoolchild*[tw] OR adolescen*[tw] OR juvenil*[tw] OR youth*[tw] OR teen*[tw] OR preteen*[tw] OR underage*[tw] OR under age*[tw] OR pubescen*[tw] OR paediatric*[tw] OR pediatric*[tw] #5 Part V: Part III AND IV #3 AND #4 #6 Part VI: Limiting to subsets not available on Ovid #5 not medline[sb] not pmcbook |
| ICTRP Search Portal (Standard search) |
| obes* AND child* OR obes* AND schoolchild* OR obes* AND adolesc* OR obes* AND young* OR obes* AND pediatric* OR obes* AND teen* OR obes* AND preteen* OR obes* AND juvenil* OR obes* AND minors OR obes* AND boy* OR obes* AND girl* OR obes* AND kids OR obes* AND youth* OR obes* AND underage* OR obes* AND pube* OR overweight* AND child* OR overweight* AND schoolchild* OR overweight* AND adolesc* OR overweight* AND young* OR overweight* AND pediatric* OR overweight* AND teen* OR overweight* AND preteen* OR overweight* AND juvenil* OR overweight* AND minors OR overweight* AND boy* OR overweight* AND girl* OR overweight* AND kids OR overweight* AND youth* OR overweight* AND underage* OR overweight* AND pube* |
| ClinicalTrials.gov (Expert search) |
| ( obese OR overweight OR obesity ) [DISEASE] AND ( drug or drugs OR agent OR agents OR appetite OR metformin OR exenatide OR liraglutide OR dulaglutide OR albiglutide OR taspoglutide OR lixisenatide OR semaglutide OR orlistat OR cetilistat OR sibutramine OR fluoxetine OR rimonabant OR lorcaserin OR benzphetamine OR diethylpropion OR phendimetrazine OR mazindol OR phentermine OR chlorphentermine OR mephentermine OR topiramate OR bupropion OR naltrexone OR zonisamide OR beloranib OR velneperit OR tesofensine ) [TREATMENT] AND INFLECT EXACT "Child" [AGE‐GROUP] |
Appendix 2. Description of interventions
| Trial | Intervention(s): drug component (route, frequency, total dose/day), behaviour changing component | Comparator(s): drug component (route, frequency, total dose/day), behaviour changing component |
| Atabek 2008 | Metformin: oral, twice daily, 500 mg x 2 (1 g)/d, 6 months Diet and physical activity advice: individual consultation sessions with a nutritionist, completed food diary at beginning and end of trial, advised to perform 30 min of aerobic physical activity per day, 6 months | Placebo: oral, twice daily, 2 tablets/d, 6 months Diet and physical activity advice: same as the intervention group |
| Berkowitz 2003 | Sibutramine: oral, 1 dose per day, placebo (week 1) 5 mg/d sibutramine (week 2) 10 mg/d (weeks 3 to 6) 15 mg/d (week 7 to month 6), length = 6 months (plus an open‐label phase for additional 6 months) Behavioural programme: in phase 1 (drug‐placebo phase) participants attended 13 weekly group sessions while in phase 2 (drug, open label) group sessions were held biweekly then monthly. Parents met separately from participants. Instructed to consume 1200 kcal/d to 1500 kcal/d and to engage in 120 min of walking or similar activity per week. Eating and activity logs kept daily. Length = 12 months | Placebo: oral, 1 dose per day, (months 1 to 6), 6 months Behavioural programme: same as intervention group |
| Berkowitz 2006 | Sibutramine: oral, 1 dose per day, 10 mg/d (baseline to month 6), 15 mg/d from month 6 in participants who had not lost more than 10% of their initial BMI, 12 months Behavioural therapy programme: each individual centre implemented flexible lifestyle modification approaches that were specific to participants' needs. This included self‐monitoring of eating habits and physical activity, stress management, stimulus control, problem solving, contingency management, cognitive restructuring and social support. Participants were given counselling at each visit and nutritional counselling. Length = 12 months | Placebo: oral, 1 dose per day, placebo (baseline to month 6), uptitrated after 6 months in participants who had not lost more than 10% of their initial BMI, 12 months Behavioural therapy programme: same as intervention group |
| Chanoine 2005 | Orlistat: oral, dose 3 times per day, 120 mg x 3 (360 mg)/d, 1 year Behavioural therapy: participants were prescribed a nutritionally balanced, hypocaloric diet and at each trial visit the dietitian spoke about compliance. Behavioural modification involved techniques to limit calorie and fat intake, eating more slowly, avoiding snacks and avoiding overeating. Guidelines were given to encourage regular physical activity and reduce sedentary behaviour; compliance was monitored by a behavioural psychologist at each visit. Length = 54 weeks | Placebo: oral, dose 3 times per day, 1 year Behavioural therapy: same as intervention group |
| Clarson 2009 | Metformin: oral, 3 times daily, 500 mg x 3 (1.5 g), 6 months Behaviour changing intervention: monthly individual visits and 2 group sessions. Fitness specialist supervised participants in an individual 30‐min exercise sessions every 2 months. Diet advice and physical activity advice given. Progress monitored by weekly telephone calls and monthly visits. Length = 6 months | No placebo (N/A) Behaviour changing intervention: same as intervention group |
| Franco 2014 | Sibutramine: oral, once daily, 10 mg, 6 months Dietary guidance: the dietary guideline proposal was of a low‐calorie diet with restriction of 25% of the total recommended calories for a teenager | Placebo: oral, once daily, 10 mg, 6 months Dietary guidance: same as intervention group |
| Freemark 2001 | Metformin: oral, 2 doses per day, 500 mg x 2 (1g)/d, 6 months No behaviour changing intervention | Placebo: oral, 2 doses per day, 6 months No behaviour changing intervention |
| Garcia‐Morales 2006 | Sibutramine: oral, 1 dose per day, 10 mg/d, 6 months Diet + exercise: diet and exercise advice was tailored to each participant. Advice was given on recommended food portions and possible combinations, and all participants were advised to perform at least 30 min of aerobic physical activity per day. Each participant also attended individual consultation sessions with a registered paediatric nutritionist. A detailed food consumption questionnaire was completed at the beginning and end of trial medication period. Length = 6 months | Placebo: oral, 1 dose per day, 6 months Diet + exercise: same as intervention group |
| Godoy‐Matos 2005 | Sibutramine: oral, 1 dose per day, 10 mg/d, 6 months Hypocaloric diet + exercise: participants were given dietary counselling to achieve an energy deficit of 500 kcal/d at the start of the run‐in phase (no further visits after). Physical activity instructions were delivered by the attendant doctors in a brief written protocol aimed to obtain mainly aerobic moderate exercises for at least 30 min/d. A lifestyle intervention was not given during 6‐month trial | Placebo: oral, 1 dose per day, 6 months Hypocaloric diet + exercise: same as intervention group |
| Kendall 2013 | Metformin: oral, twice daily, 500 mg x 2 + 500 mg (1.5 g), 6 months Healthy lifestyle advice: participants provided with a standardised healthy lifestyle advice at the start in a 1‐to‐1 sessions, including a healthy diet advice sheet and increased levels of exercise (available upon request). A lifestyle intervention was not given during the 6‐month trial | Placebo: oral, twice daily, 2 + 1 (3) tablets/d, 6 months Healthy lifestyle advice : same as intervention group |
| Maahs 2006 | Orlistat: oral, 3 doses per day, 120 mg x 3 (360 mg)/d, 6 months Diet + exercise therapy: the goal caloric intake was calculated using the Harris‐Benedict equation with ambulating activity factor (500 calories was subtracted from the final number to obtain daily calorie level). Participants were instructed to increase activity using a paediatric activity pyramid and encouraged to exercise for at least 30 min, 3 times per week. Monthly follow‐up visits with a dietitian reinforced this advice. Log sheets and diet records were also completed. Length = 6 months | Placebo: oral, 3 doses per day, 6 months Diet + exercise therapy: same as intervention group |
| Mauras 2012 | Metformin: oral, twice daily, 500 mg or 1000 mg (dependent on age), 6 months Diet + exercise intervention: dietary counselling provided with recommended decrease of 250 calories/d to 500 calories/d. Intense follow‐up provided by dietitian. Participants given free membership to YMCA or gym. Encouraged to exercise at least 3 times per week for 30 min per sessions. Activity diary kept and pedometer worn. Length = 6 months | No placebo Diet + exercise intervention: same as intervention group |
| NCT00001723 | Orlistat: 120 mg 3 times daily for 6 months Behavioural weight loss programme: 12‐week intensive programme | Placebo: 120 mg 3 times daily for 6 months Behavioural weight loss programme: same as intervention group |
| Ozkan 2004 | Orlistat: oral, 3 doses per day, 120 mg x 3 (360 mg)/d, mean 11.7 months ‐ length of treatment was not consistent across participants Conventional treatment: the lifestyle modification programme included reducing daily calories. Was administered by a team comprising of a paediatric endocrinologist, paediatrician and a dietitian. Participants seen by dietitian monthly and in the outpatient clinic every 2 months. Length = between 6 and 17 months | No placebo Conventional treatment: same as intervention group; length between 6 and 17 months |
| Prado 2012 | Metformin: oral, once daily, 500 mg, 3 months Nutritional guide and exercise programme: according to pattern 1500 kcal/d. Exercise classes once per week and exercise guide to be practiced twice per week. Length = 3 months | Placebo: oral, once daily, 3 months Nutritional guide and exercise programme: same as intervention group |
| Rezvanian 2010 | Metformin: oral, once daily, 1500 mg/d, 12 weeks Healthy eating and physical activity advice: physical activity advice included reducing sedentary time and taking part in 30 min of enjoyable, moderate‐intensity physical activity per day. A registered dietitian conducted a nutrition education session with recommendations on diet such as increasing consumption of fruit and vegetables and not using hydrogenated fat | Placebo: oral, once daily, 12 weeks Healthy eating and physical activity advice: same as intervention group |
| Fluoxetine: oral, once daily, 20 mg/d, 12 weeks Healthy eating and physical activity advice: same as the other intervention groups | ||
| Metformin + fluoxetine: oral, once daily, dosage not given, 12 weeks Healthy eating and physical activity advice: same as the other intervention groups | ||
| Srinivasan 2006 | Metformin: oral, 2 doses per day, dose gradually built up to 1g x 2 (2 g)/d, 6 months "Standardised information on healthy eating and exercise": no further information given | Placebo: oral, 2 doses per day, dose gradually built up to 1 g x 2 (2 g)/d, 6 months "Standardised information on healthy eating and exercise": same as intervention group |
| Van Mil 2007 | Sibutramine: oral, once daily, 5 mg/d, 12 weeks Energy‐restricted diet and exercise plan: the energy prescription calculated from measured basal metabolic rate multiplied by an estimated physical activity level minus 500 kcal. Physical activity prescribed based on individual preferences and information obtained by physical activity questionnaire. It contained a daily bout of exercise of at least 30 min. Length = 12 weeks | Placebo: oral, once daily, 5 mg/d, 12 weeks Energy‐restricted diet and exercise plan: same as intervention group |
| Wiegand 2010 | Metformin: oral, twice daily, 2 x 500 mg (1 g)/d, 6 months Multiprofessional behaviour changing intervention: an interview was performed before randomisation to determine 1 to 3 individually chosen tasks (goals). Multiprofessional reinforcement sessions took place every 4 to 8 weeks. Regarding physical activity, participants and their families attended specialised sport classes (2 sport classes per week, 45 min each, was recommended) in addition to regular sport classes at school. Length = 6 months | Placebo: oral, twice daily, 6 months Multiprofessional behaviour changing intervention: same as intervention group |
| Wilson 2010 | Metformin: oral, 4 times daily, 4 x 500 mg (2 g)/d, 48 weeks Behaviour changing intervention: used the Weigh of Life LITE programme developed at Texas Children's Hospital, Houston. There were 10 individualised "intensive" sessions at weekly intervals and monthly follow‐up sessions for the reminder of the trial. Sessions led by trained health specialist and parent/guardians were invited. Length = 48 weeks | Placebo: oral, 4 times daily, 48 weeks Behaviour changing intervention: same as intervention group |
| Yanovski 2011 | Metformin: oral, twice daily, 2 x 1000 mg (2000 mg)/d, 6 months Dietitian‐administered weight‐reduction programme: each participant and parent/guardian met with a dietitian monthly, who promoted a reduced‐energy diet, increased physical activity and decreased inactivity. Participants trained to completed a 7‐day food diary which was used to prescribe a "traffic light" style 500 kcal/d deficit diet, and exercise was encouraged for 30 min/d, monitored by pedometers readings. Length = 6 months | Placebo: oral, twice daily, 6 months Dietitian‐administered weight‐reduction programme: same as intervention group |
| "‐" denotes not reported. BMI: body mass index; /d: per day; kcal: kilocalories; min: minute; N/A: not applicable; YMCA: Young Men's Christian Association. | ||
Appendix 3. Baseline characteristics (I)
| Trial | Intervention(s) and comparator(s) | Duration of intervention | Description of participants | Trial period | Country | Setting | Ethnic groups | Duration of obesity |
| Atabek 2008 | I: metformin + diet and physical activity advice | 6 months (6 months) | Obese adolescents with hyperinsulinaemia | ‐ | Turkey | Hospital in/outpatient clinic/other based in University School of Medicine | ‐ | ‐ |
| C: placebo + diet and physical activity advice | ||||||||
| Berkowitz 2003 | I: behavioural programme + sibutramine | 6 months (6 months) | Obese adolescent boys and postmenarchal girls | March 1999 to August 2002 | USA | University of Pennsylvania School of Medicine | White 49, black 49, other 2 | ‐ |
| C: behavioural programme + placebo | White 62, black 33, other 5 | |||||||
| Berkowitz 2006 | I: behavioural therapy programme + sibutramine | 12 months (12 months) | Obese adolescents | July 2000 to February 2002 | USA | 33 weight loss clinics and outpatient clinic based in a University School of Medicine | White 56, African‐American 22, Hispanic or Mexican American 16, other 6 | ‐ |
| C: behavioural therapy programme + placebo | White 59, African‐American 19, Hispanic or Mexican‐American 14, other 9 | |||||||
| Chanoine 2005 | I: orlistat + diet + exercise + behavioural therapy | 54 weeks (54 weeks) | Obese adolescents | August 2000 to October 2002 | USA and Canada | 32 clinical centres | White 75, black 19, other 6 | ‐ |
| C: placebo + diet + exercise + behavioural therapy | White 78, black 14, other 8 | |||||||
| Clarson 2009 | I: metformin + lifestyle intervention | 6 months (6 months) | Obese adolescents with insulin resistance | Enrolled 2005 to 2007 | Canada | Participants assessed in community clinic and there were monthly visits to clinic during intervention. Intervention carried out in community ‐ at adolescent's home ‐ unclear where group sessions took place | ‐ | ‐ |
| C: lifestyle intervention only | ||||||||
| Franco 2014 | I: sibutramine + dietary guidance | 6 months (6 months) | Obese adolescents | ‐ | Brazil | Paediatric endocrinology outpatient clinic in childhood obesity group of the Instituto da Crianca do Hospital das Clinicas de Faculdade de Medicina de Universidade de Sao Paulo | ‐ | ‐ |
| C: placebo + dietary guidance | ||||||||
| Freemark 2001 | I: metformin | 6 months (6 months) | Obese adolescents with fasting hyperinsulinaemia and a family history of type 2 diabetes | ‐ | USA | Inpatient and outpatient clinic of a university | White 64, black 36 | ‐ |
| C: placebo | White 47, black 53 | |||||||
| Garcia‐Morales 2006 | I: sibutramine + diet + exercise | 6 months (6 months) | Obese Mexican adolescents | August 2001 to August 2003 | Mexico | Outpatients attending the endocrinology department of the Federico Gomez Children's Hospital of Mexico | ‐ | ‐ |
| C: placebo + diet + exercise | ||||||||
| Godoy‐Matos 2005 | I: sibutramine + hypocaloric diet + exercise | 7 months (7 months) | Obese adolescents | January 2002 to April 2003 | Brazil | Regular clinical setting | ‐ | ‐ |
| C: placebo + hypocaloric diet + exercise | ||||||||
| Kendall 2013 | I: metformin + healthy lifestyle advice | 6 months (6 months) | Obese children and adolescents with hyperinsulinaemia or impaired fasting glucose or impaired glucose tolerance (or both) | ‐ | UK | UK paediatric endocrine centres | White 80, Asian 19, Afro‐Caribbean 11 | ‐ |
| C: placebo + healthy lifestyle advice | White 72, Asian 26, Afro‐Caribbean 1 | |||||||
| Maahs 2006 | I: orlistat + diet and exercise therapy | 26 weeks (26 weeks) | Obese adolescents | December 2002 to September 2003 | USA | General clinical research centre at University of New Mexico Hospital | Hispanic 60 | ‐ |
| C: placebo + diet and exercise therapy | Hispanic 65 | |||||||
| Mauras 2012 | I: metformin + diet/exercise intervention | 6 months (6 months) | Obese children with normal glucose tolerance but elevated hsCRP or fibrinogen concentrations (or both) | ‐ | USA | ‐ | White 51, African‐American 37, other 11 | Uncomplicated (exogenous) obesity for < 5 years |
| C: diet/exercise intervention | White 39, African‐American 42, other 19 | |||||||
| NCT00001723 | I: orlistat + behavioural weight loss programme | 6 months (6 months) | Obese children and adolescents with obesity‐related diseases | RCT began in 1999 and ended in 2008 | USA | National Institutes of Health Clinical Center | Non‐Hispanic black 63, non‐Hispanic white 37 | ‐ |
| C: placebo + behavioural weight loss programme | Non‐Hispanic black 60, non‐Hispanic whites 40 | |||||||
| Ozkan 2004 | I: conventional treatment + orlistat | Intervention group was followed for 5 to 15 months (mean duration of treatment 11.7, SD 3.7 months) | Adolescents with severe exogenous obesity | ‐ | Turkey | Outpatient clinic | ‐ | ‐ |
| C: conventional treatment | Control group was followed for 6 to 17 months (mean 10.2, SD 3.7 months) | |||||||
| Prado 2012 | I: metformin + nutritional guide and exercise programme | 3 months (6 months) | Obese female adolescents at risk of developing type 2 diabetes | June 2009 to July 2010 | Chile | Conducted at Center of Adolescent Health Serjoven | ‐ | ‐ |
| C: placebo + nutritional guide and exercise programme | ||||||||
| Rezvanian 2010 | I1: metformin + healthy eating and physical activity advice | 12 weeks (24 weeks) | Obese children and adolescents | ‐ | Iran | Pediatric Obesity and Metabolic Syndrome Research Clinic of the Pediatric Preventive Cardiology Department, Isfahan Cardiovascular Research Center | ‐ | ‐ |
| I2: fluoxetine + healthy eating and physical activity advice | ||||||||
| I3: metformin and fluoxetine + healthy eating and physical activity advice | ||||||||
| C: placebo + healthy eating and physical activity advice | ||||||||
| Srinivasan 2006 | I: metformin first then placebo + standardised information on healthy eating and exercise | 6 months (12 months) | Obese children and adolescents (aged 9 to 18) with suspected insulin resistance | ‐ | Australia | Outpatient clinic of a tertiary paediatric hospital (university teaching hospital) | 64% were from ethnic backgrounds with high prevalence of insulin resistance and the metabolic syndrome (e.g. Indian subcontinent, Pacific Islands), 25% were from a northern European background, and 11% were from a mixed background | ‐ |
| C: placebo first then metformin + standardised information on healthy eating and exercise | ||||||||
| Van Mil 2007 | I: sibutramine + energy‐restricted diet and exercise plan | 12 weeks (24 weeks) | Obese adolescents | ‐ | The Netherlands | Outpatient clinic | ‐ | ‐ |
| C: placebo + energy‐restricted diet and exercise plan | ||||||||
| Wiegand 2010 | I: metformin + multiprofessional lifestyle intervention | 6 months (6 months) | Obese insulin‐resistant adolescents | May 2006 to December 2006 | Germany and Switzerland | Paediatric obesity centre | White 87, other 13 | ‐ |
| C: placebo + multiprofessional lifestyle intervention | White 92, other 9 | |||||||
| Wilson 2010 | I: metformin + lifestyle intervention programme | 52 weeks (100 weeks) | Obese adolescents | October 2003 to August 2007 | USA | 6 Glaser paediatric research centres | White 56, African‐American 21, Asian 8, other 15, Hispanic ethnicity 18 | ‐ |
| C: placebo + lifestyle intervention programme | White 71, African‐American 16, Asian 0, other 13, Hispanic ethnicity 29 | |||||||
| Yanovski 2011 | I: metformin + dietitian‐administered weight‐reduction programme | 6 months (12 months) | Obese insulin‐resistant children | September 2000 to August 2008 | USA | Trial took place at the NIH clinical research centre | Non‐Hispanic white 42, Non‐Hispanic black 42, Hispanic white 11, other 5 | ‐ ‐ |
| C: placebo + dietitian‐administered weight‐reduction programme | Non‐Hispanic white 49, Non‐Hispanic black 38, Hispanic white 11, other 2 | |||||||
| "‐" denotes not reported. C: comparator; hsCRP: high sensitivity C‐reactive protein; I: intervention; RCT: randomised controlled trial; SD: standard deviation. | ||||||||
Appendix 4. Baseline characteristics (II)
| Trial | Intervention(s) and comparator(s) | Sex | Age | HbA1c | BMI | Bodyweight | Comedications/cointerventions | Comorbidities |
| Atabek 2008 | I: metformin + diet and physical activity advice | 50 | 11.8 (2.8) | ‐ | 28.5 (3.4) | 67.16 (16.8) | Diet and physical activity advice. Individual consultation sessions with a registered paediatric nutritionist | All participants had hyperinsulinaemia |
| C: placebo + diet and physical activity advice | 50 | 11.6 (2.7) | ‐ | 28.0 (3.4) | 66.27 (16.9) | |||
| Berkowitz 2003 | I: behavioural programme + sibutramine | 72 | 14.1 (1.3) | ‐ | 37.5 (4.0) | 102 (14.7) | Behavioural therapy | ‐ |
| C: behavioural programme + placebo | 62 | 14.1 (1.2) | ‐ | 38.0 (3.6) | 105.3 (16.2) | |||
| Berkowitz 2006 | I: behavioural therapy programme + sibutramine | 66 | 13.6 (1.3) | ‐ | 35.9 (4.1) | 97.9 (14.7) | Behavioural therapy | 50.5% had dyslipidaemia, 1.4% had hypertension |
| C: behavioural therapy programme + placebo | 62 | 13.7 (1.3) | ‐ | 36.1 (3.8) | 97.8 (14.6) | 57.4% had dyslipidaemia, 2.3% had hypertension | ||
| Chanoine 2005 | I: orlistat + diet + exercise + behavioural therapy | 65 | 13.6 (1.3) | ‐ | 35.7 (4.2) | 97.7 (15.0) | Behavioural modification + diet + exercise counselling | In the orlistat group, 14 participants had a baseline abnormality revealed by gallbladder ultrasound, including 8 participants with fatty liver infiltration or hepatomegaly and 3 participants with gallstones; 25.3% of participants had the metabolic syndrome at baseline |
| C: placebo + diet + exercise + behavioural therapy | 71 | 13.5 (1.2) | ‐ | 35.4 (4.1) | 95.1 (14.2) | ‐ | ||
| Clarson 2009 | I: metformin + lifestyle intervention | ‐ | 13.1 | ‐ | 36.4 (1.8) | ‐ | Lifestyle intervention | All participants insulin resistant. 15 participants had acanthosis nigricans |
| C: lifestyle intervention only | ‐ | 13.1 | ‐ | 33.9 (1.1) | ‐ | |||
| Franco 2014 | I: sibutramine + dietary guidance | 56 | 13.3 (1.8) | ‐ | 33.9 (7.2) | 85.5 (23.2) | Dietary guidance | ‐ |
| C: placebo + dietary guidance | 12.3 (1.7) | ‐ | 32.8 (5.8) | 83.1 (19.6) | ||||
| Freemark 2001 | I: metformin | 79 | 14.4 (0.6) | 5.6 (0.1) | 41.5 (0.9) | ‐ | ‐ | All participants had fasting hyperinsulinaemia. 8 participants had acanthosis nigricans |
| C: placebo | 46 | 15.4 (0.5) | 5.5 (0.1) | 38.7 (1.3) | ‐ | |||
| Garcia‐Morales 2006 | I: sibutramine + diet + exercise | 61 | 15.2 (1.3) | ‐ | 35.1 (5.3) | 92.6 (14.6) | Diet and exercise advice | 8.7% high blood pressure, 8.7% glucose, 43.5% high triglycerides, 8.7% high cholesterol, 4.3% high LDL, 13% high HDL |
| C: placebo + diet + exercise | 52 | 14.7 (1.1) | ‐ | 36.6 (5.2) | 98.9 (22.7) | 30.4% high blood pressure, 8.7% glucose, 52.2% high triglycerides, 34.8% high cholesterol, 17.4% high LDL | ||
| Godoy‐Matos 2005 | I: sibutramine + hypocaloric diet + exercise | 83 | Females: 15.9 (1.1) Males: 16.7 (0.6) | ‐ | Females: 37.5 (3.8) Males: 37.6 (4.3) | Females: 100.5 (14.2) Males: 117.1 (11.7) | Exercise advice | ‐ |
| C: placebo + hypocaloric diet + exercise | 80 | Females: 16.3 (1.2) Males: 16.7 (0.6) | ‐ | Females: 35.8 (4.2) Males: 37.4 (1.9) | Females: 94.0 (13.6) Males: 113.4 (10.0) | ‐ | ||
| Kendall 2013 | I: metformin + healthy lifestyle advice | 66 | 13.7 (2.3) | ‐ | 37.1 (6.4) | 100.3 (24.1) | Standardised healthy lifestyle advice | All participants had hyperinsulinaemia or impaired fasting glucose or impaired glucose tolerance (or both) |
| C: placebo + healthy lifestyle advice | 69 | 13.6 (2.2) | ‐ | 36 (6.3) | 96.4 (21.8) | |||
| Maahs 2006 | I: orlistat + diet and exercise therapy | 60 | 15.8 (1.5) | 5.4 (0.1) | 39.2 (5.3) | 111.1 (22.9) | Dietary and exercise counselling | ‐ |
| C: placebo + diet and exercise therapy | 75 | 15.8 (1.4) | 5.4 (0.1) | 41.7 (11.7) | 114.3 (38.4) | ‐ | ||
| Mauras 2012 | I: metformin + diet/exercise intervention | 57 | 12.3 (0.5) | ‐ | 32 (1) | ‐ | Dietary counselling and free membership to a sports club/gym | Elevated hsCRP or fibrinogen (or both) concentrations |
| C: diet/exercise intervention | 52 | 12.0 (0.4) | ‐ | 33.2 (0.7) | ‐ | |||
| NCT00001723 | I: orlistat + behavioural weight loss programme | 65 | 14.65 (1.38) | ‐ | 41.7 (0.6) | ‐ | Behavioural therapy and a multivitamin for 6 months | All participants had at least 1 of the following: systolic or diastolic hypertension (determined by age‐specific charts); frank type 2 diabetes, impaired glucose tolerance assessed by oral glucose tolerance testing; hyperinsulinaemia (defined as a fasting insulin > 15 IU/mL); significant hyperlipidaemia (total cholesterol > 200 mg/dL, LDL cholesterol > 129 mg/dL or fasting triglycerides > 200 mg/dL); hepatic steatosis (ALT or AST above normal range with negative hepatitis studies) or sleep apnoea documented by a sleep trial |
| C: placebo + behavioural weight loss programme | 66 | 14.52 (1.46) | ‐ | ‐ | ||||
| Ozkan 2004 | I: conventional treatment + orlistat | 67 | 12.9 (2.4) | ‐ | 32.5 | 82.1 (20.9) | Daily oral multivitamin preparation, lifestyle modification programme | ‐ |
| C: conventional treatment | 12.5 (2.2) | ‐ | 31.2 | 73.9 (15.3) | Lifestyle modification programme | ‐ | ||
| Prado 2012 | I: metformin + nutritional guide and exercise programme | 100 | 15.6 (1.9) | ‐ | 33.6 | ‐ | Nutritional guide and exercise programme | 30% of participants had psychiatric comorbidities |
| C: placebo + nutritional guide and exercise programme | 100 | ‐ | 33.3 | ‐ | 11.1% of participants had psychiatric comorbidities | |||
| Rezvanian 2010 | I1: metformin + healthy eating and physical activity advice | ‐ | 13.1 (1.4) | ‐ | 26.4 (0.5) | ‐ | Physical activity advice; nutritional education session and dietary advice | ‐ |
| I2: fluoxetine + healthy eating and physical activity advice | ‐ | 13.5 (1.2) | ‐ | 26.5 (0.7) | ‐ | ‐ | ||
| I3: metformin and fluoxetine + healthy eating and physical activity advice | ‐ | 13.7 (1.1) | ‐ | 26.6 (0.8) | ‐ | ‐ | ||
| C: placebo + healthy eating and physical activity advice | ‐ | 13.4 (1.4) | ‐ | 26.2 (0.6) | ‐ | ‐ | ||
| Srinivasan 2006 | I: metformin first then placebo + standardised information on healthy eating and exercise | 54 | 12.5 (2.2) | ‐ | ‐ | ‐ | Information on healthy eating and exercise | Suspicion of insulin resistance; 89% participants had acanthosis nigricans |
| C: placebo first then metformin + standardised information on healthy eating and exercise | ‐ | ‐ | ‐ | |||||
| Van Mil 2007 | I: sibutramine + energy‐restricted diet and exercise plan | 45 | 14.1 (1.0) | ‐ | 30.1 (4.5) | 80.8 (15.6) | Diet and exercise plan | ‐ |
| C: placebo + energy‐restricted diet and exercise plan | 58 | 13.8 (1.5) | ‐ | 33.3 (5.0) | 89.2 (16.4) | ‐ | ||
| Wiegand 2010 | I: metformin + multiprofessional lifestyle intervention | 72 | 15.1 | ‐ | 34.3 (5) | ‐ | Lifestyle intervention | All had risk factors for developing type 2 diabetes: acanthosis nigricans, signs of the metabolic syndrome, impaired fasting glucose, and positive family history of type 2 diabetes, or with impaired glucose tolerance |
| C: placebo + multiprofessional lifestyle intervention | 62 | 15 | ‐ | 35.5 (5.8) | ‐ | |||
| Wilson 2010 | I: metformin + lifestyle intervention programme | 67 | 14.8 (1.3) | 5.4 (0.3) | 35.9 (5.7) | 95.9 (16.6) | Lifestyle intervention given during run‐in period and follow‐up sessions provided monthly for the remainder of the trial; a multivitamin tablet and calcium carbonate 1000 mg was taken daily | ‐ |
| C: placebo + lifestyle intervention programme | 66 | 15.0 (1.5) | 5.3 (0.3) | 35.9 (4.7) | 101.8 (15.7) | ‐ | ||
| Yanovski 2011 | I: metformin + dietitian‐administered weight‐reduction programme | 57 | 10.1 (1.6) | ‐ | 34.2 (6.8) | 76.4 (23.1) | A monthly dietitian administered weight‐reduction programme; a daily chewable multivitamin containing cyanocobalamin 6 mg was also prescribed | 26.4% had paediatric metabolic syndrome. 64% showed a presence of acanthosis nigricans; all participants had fasting hyperinsulinaemia. |
| C: placebo + dietitian‐administered weight‐reduction programme | 64 | 10.4 (1.4) | ‐ | 34.6 (6.2) | 80.1 (20.5) | 31.9% had paediatric metabolic syndrome. 68% showed a presence of acanthosis nigricans; all participants had fasting hyperinsulinaemia | ||
| "‐" denotes not reported. ALT: alanine transaminase; AST: aspartate transaminase; BMI: body mass index; C: comparator; HbA1c: glycosylated haemoglobin A1c; HDL: high‐density lipoprotein; HsCRP: high sensitivity C‐reactive protein; I: intervention; LDL: low‐density lipoprotein; SD: standard deviation. | ||||||||
Appendix 5. Matrix of study endpoints (publications and trial documents)
| Trial | Endpoints quoted in trial document(s) | Endpoints quoted in publication(s)b | Time of measurement | |
| Atabek 2008 | N/T | Primary outcome measures: ‐ | 6 months | |
| Secondary outcome measures : ‐ | ||||
| Other outcome measures: % change in BMI, DBP, SBP, pulse rate, lipids, triglycerides, serum insulin, serum glucose, HOMA, HDL, BMI z score, LDL, total cholesterol, weight change, adverse events | ||||
| Berkowitz 2003 | Source:NCT00212173 (added 13 September 2005) Primary outcome measure(s): BMI, weight | No trial results posted. No link to Berkowitz 2003 publication but links to 2 additional publications. A second protocol for an adolescent lifestyle intervention also included | Primary outcome measure: % change in BMI | 3, 6, 9, 12 months |
| Secondary outcome measure(s): BP, lipids, glucose, insulin | Secondary outcome measures: BP, pulse, hunger | |||
| Other outcome measure(s): ‐ | Other outcome measures: lipids, triglycerides, serum insulin, serum glucose, HOMA, HDL, BMI z score, LDL, total cholesterol, weight change, waist circumference, adverse events | |||
| Berkowitz 2006 | Source:NCT00261911 Primary outcome measure(s): absolute change in BMI from baseline to endpoint (12 months) | No trial results posted, publications specified | Primary outcome measures: absolute change from baseline in BMI | 0.25, 0.5, 1, 1.5, 2, 2.5, 3, 4, 5, 6, 7, 8, 9, 10, 11, 12 months |
| Secondary outcome measure(s): % change from baseline in BMI, proportions of participants achieving ≥ 5% and ≥ 10% BMI and bodyweight reduction, absolute and % change from baseline in waist circumference, body composition (DEXA), lipid and glycaemic variables (all: 12 months) | Secondary outcome measures: % change in BMI, proportion of participants achieving reductions in BMI of ≥ 5% or ≥ 10%, absolute and % changes in bodyweight and lipid and glycaemic variables, absolute change in waist circumference | |||
| Other outcome measure(s): ‐ | Other outcome measures: DBP, SBP, pulse rate, QTc interval, maturation (Tanner staging), adverse events | |||
| Chanoine 2005 | N/T | Primary outcome measures: change in BMI from baseline to trial end (or trial exit) | ‐0.5, 0.5, 1, 1.5, 2, 2.5, 3, 3.5, 4, 5, 6, 7, 8, 9, 10, 11, 12 months | |
| Secondary outcome measures: change in bodyweight, levels of total, HDL and LDL cholesterol, LDL‐to‐HDL cholesterol ratio, triglyceride levels, SBP and DBP, | ||||
| Other outcome measures: beta carotene, vitamin A, 25‐hydroxyvitamin D, vitamin E, Tanner staging, adverse events | ||||
| Clarson 2009 | N/T | Primary outcome measures: change in BMI and modification of metabolic risk factors, including insulin resistance, plasma lipids and adipocytokines, assessment of metformin on the attainment of a target metabolic profile | 6 months | |
| Secondary outcome measures: ‐ | ||||
| Other outcome measures: BMI z score, BP, adverse events, waist circumference | ||||
| Franco 2014 | N/T | Primary outcome measures: ‐ | On average every 40 days for 13 months | |
| Secondary outcome measures: ‐ | ||||
| Other outcome measures: % of participants loosing 10% of their initial weight, weight, BMI, SBP, DBP, cholesterol, LDL, HDL, triglycerides, leptin, CRP, transaminases, blood glucose, insulin, adverse events, waist circumference | ||||
| Freemark 2001 | N/T | Primary outcome measures: ‐ | 6 months | |
| Secondary outcome measures: ‐ | ||||
| Other outcome measures: BMI SDS, insulin, glucose tolerance, leptin, serum lipids, HbA1c, IGF‐1, lactate, cholesterol, LDL, HDL, LDL/HDL, triglycerides, adverse events, ALT, AST | ||||
| Garcia‐Morales 2006 | N/T | Primary outcome measures: baseline versus endpoint absolute values for bodyweight, BMI, and % of the initial BMI (%BMI) | ‐15, 30, 60, 90, 120, 150, 180 days | |
| Secondary outcome measures: waist circumference and % of the initial waist circumference (%waist) | ||||
| Other outcome measures: health‐related quality of life, white blood cells, monocytes, eosinophils, glucose, uric acid, creatinine, albumin, chloride, total cholesterol, LDL, AST, alkaline phosphatase, SBP, DBP, heart rate, ST segment, adverse events | ||||
| Godoy‐Matos 2005 | N/T | Primary outcome measures: change in weight and BMI | ‐4, 4, 8, 12, 16, 20, 24 weeks | |
| Secondary outcome measures: change in waist, hip, and waist‐to‐hip ratio | ||||
| Other outcome measures: SBP, DBP, heart rate, glucose, total cholesterol, triglycerides, HDL, LDL, VLDL, insulin, total cholesterol/HDL cholesterol, left atrium diameter, left ventricular mass, adverse events, satiety score | ||||
| Kendall 2013 | Source:ISRCTN19517475 Primary outcome measure: reduction in BMI SDS | Prior to 16 December 2008: 80 participants aged 9 to 18 years As of 16 December 2008:
| Primary outcome measure: reduction of BMI SDS | 3, 6 months |
| Secondary outcome measures: Added 16 December 2008: fasting and 2‐hour insulin and glucose levels on OGTT, measures of insulin resistance, fasting lipids, CRP, adiponectin, leptin, resistin, BP | Secondary outcome measures: BMI and waist‐to‐hip ratio, fasting and postprandial insulin and glucose levels, metabolic risk factors, adipokines | |||
| Other outcome measure(s): ‐ | Other outcome measures: weight, height, SBP, DBP, cholesterol, HDL, LDL, triglycerides, bilirubin, CRP, lactate, resistin, adverse events | |||
| Maahs 2006 | N/T | Primary outcome measures: change in BMI from baseline to 6 months | 1, 2, 3, 4, 5, 6 months | |
| Secondary outcome measures: changes in weight, lean body mass, results of blood chemistry studies | ||||
| Other outcome measures: health‐related quality of life, all‐cause mortality, vitamin A, vitamin D, vitamin E, adverse events | ||||
| Mauras 2012 | Source:NCT00139477 Primary outcome measures: change from baseline in hsCRP at 6 months, change from baseline in fibrinogen at 6 months, change from baseline in IL‐6 at 6 months, change from baseline in PAI‐1 at 6 months | Trial results posted, publications specified | Primary outcome measures: hsCRP and fibrinogen concentrations at 6 months | 3, 6 months |
| Secondary outcome measure(s): ‐ | Secondary outcome measures: ‐ | |||
| Other outcome measure(s): ‐ | Other outcome measures: weight, BMI percentile, systolic BP, diastolic BP, IL‐6, PAI‐1, adiponectin, IGF‐1, insulin, total cholesterol, LDL‐cholesterol, HDL‐cholesterol, triglycerides, free fatty acids, glucose tolerance, resting energy expenditure rates, adverse events, waist circumference | |||
| NCT00001723 | Source:NCT00001723 Primary outcome measure: change in BMI SDS (time frame: baseline to 6 months) | Trial results posted, linked to pilot trial but no link to publication | No publication available | 6 months |
| Secondary outcome measures: change in bodyweight (time frame: baseline to 6 months), weight, change in BMI (time frame: baseline to 6 months), change in body fat (time frame: baseline to 6 months), body fat distribution measures obtained DEXA, effect of race on change in weight (time frame: baseline to 6 months), difference in change of weight according to race (non‐Hispanic white versus non‐Hispanic black) | ||||
| Other outcome measure(s): ‐ | ||||
| Ozkan 2004 | N/T | Primary outcome measures: ‐ | 1 to 15 months | |
| Secondary outcome measures: ‐ | ||||
| Other outcome measures: weight change, % weight change, BMI, adverse events | ||||
| Prado 2012 | N/T | Primary outcome measures: weight | 1, 2, 3, 4, 5, 6 months | |
| Secondary outcome measures: ‐ | ||||
| Other outcome measures: BMI, motivational survey results, glycaemia, afterload glucose, HDL, adverse events, waist circumference | ||||
| Rezvanian 2010 | N/T | Primary outcome measures: ‐ | 12, 24 weeks | |
| Secondary outcome measures: ‐ | ||||
| Other outcome measures: BMI, BMI SDS, waist circumference, waist‐to‐height ratio, adverse events | ||||
| Srinivasan 2006 | Source:ISRCTN43267711 Primary outcome measures: ‐ | No results posted or links to publication Retrospectively registered | Primary outcome measures: ‐ | 6, 12 months |
| Secondary outcome measures: ‐ | Secondary outcome measures: ‐ | |||
| Other outcome measures: ‐ | Other outcome measures: BMI, waist circumference z score, fasting insulin, fasting glucose, glucose effectiveness, acute insulin response, disposition index, glucose disposal, acanthosis nigricans neck score, Tanner staging, weight loss, weight z score, BMI z score, adverse events | |||
| Van Mil 2007 | N/T | Primary outcome measure: change in BMI between the 2 periods (12 weeks' randomised treatment period and 12 weeks' follow‐up) | 1, 2, 3, 4, 5, 6, 7, 8, 9, 10, 11, 12, 13, 14, 16, 18, 20, 22, 24 weeks | |
| Secondary outcome measures: ‐ | ||||
| Other outcome measures: height, weight, sleeping metabolic rate, basal metabolic rate, total energy expenditure, physical activity level, basal metabolic rate adjusted, total energy expenditure residuals, adverse events | ||||
| Wiegand 2010 | Found in the references of included trials section: EudraCT Nr. 2004‐003816‐47 (but currently not available at EU CTR. We contacted EMA and received the following answer "Note that this trial is not in the public domain due to missing information from Ethics Committee therefore we recommend you to contact the National Competent Authority concerned by this application."; in the dissertation by Hübel it is specified "Vor Beginn der Studie wurde die Zustimmung der jeweils zuständigen Ethikkommissionen eingeholt (Charité Berlin, Deutschland; St. Gallen, Schweiz)" ‐ "before start of the study approval of the appropriate ethics committees was obtained (Charité Berlin, Germany; St. Gallen, Switzerland)) | Primary outcome measures: HOMA‐IR | ‐6, 3, 6 months | |
| Secondary outcome measures: anthropometric measurements (BMI and waist‐to‐hip ratio), cardiovascular risk parameters (SBP and DBP), lipid profile (total, LDL, HDL cholesterol and triglycerides), and other metabolic parameters (glucose tolerance and fasting insulin) | ||||
| Other outcome measures: adverse events | ||||
| Wilson 2010 | Source:NCT00209482 and NCT00120146 Primary outcome measures: NCT00209482: mean change from baseline in individual BMIs between the 2 groups (compared at 2 time points: at week 52 and week 100) | No trial results posted, publications specified | Primary outcome measures: BMI change, BMI z score | ‐4, 12, 24, 36, 48, 60, 72, 84, 96 weeks |
| Secondary outcome measures: NCT00209482: ‐ | Secondary outcome measures: fat mass, lean mass, fat area, HOMA‐IR, area under insulin curve, area under glucose curve, corrected insulin release at glucose peak, LDL cholesterol, HDL cholesterol, triglycerides, triglyceride‐to‐HDL cholesterol ratio, adverse events | |||
| Other outcome measures: NCT00209482: ‐ | Other outcome measures: waist circumference | |||
| Yanovski 2011 | Source:NCT00005669 Primary outcome measures: changes in bodyweight as determined by BMI SDS (6 months) | Trial results posted, publications specified | Primary outcome measures: change in BMI SD score (BMI z score), as determined at the end of the 6‐month randomised treatment phase | 1, 2, 3, 4, 5, 6 months |
| Secondary outcome measures: change in bodyweight as determined by BMI (6 months), change in bodyweight (6 months), change in body fat by DEXA (6 months), change in body fat by Bod Pod (6 months) | Secondary outcome measures: changes in BMI, bodyweight and fat mass at the conclusion of the randomised phase | |||
| Other outcome measures: ‐ | Other outcome measures: changes in skinfold thickness, body circumferences, visceral adipose tissue, insulin resistance and laboratory components of the metabolic syndrome ‐ SBP, DBP, serum insulin, plasma glucose, total cholesterol, HDL cholesterol, LDL cholesterol, LDL‐to‐HDL cholesterol ratio, triglycerides, ALT, AST, hsCRP, vitamin B12, adverse events | |||
| ‐ denotes not reported. aTrial document(s) refers to all available information from published design papers and sources other than regular publications (e.g. FDA/EMA documents, manufacturer's websites, trial registers). ALT: alanine transaminase; AST: aspartate transaminase; BMI: body mass index; BMI SDS: body mass index standardised deviation score; BP: blood pressure; CDC: Centers for Disease Control and Prevention; CRP: C‐reactive protein; CT: computed tomography; DBP: diastolic blood pressure; DEXA: dual‐energy X‐ray absorptiometry; EMA: European Medicines Agency; EU CTR: European Clinical Trials Register; FDA: Food and Drug Administration (US); HbA1c: glycosylated haemoglobin A1c; HDL: high‐density lipoprotein; HOMA(‐IR): homeostasis model assessment (insulin resistance); hsCRP: high sensitivity C‐reactive protein; IGF‐1: insulin‐like growth factor 1; IL‐6: interleukin‐6; LDL: low‐density lipoprotein; N/T: no trial document available; OGTT: oral glucose tolerance test; PAI‐1: plasminogen activator inhibitor‐1; QTc: heart‐rate corrected QT interval; SBP: systolic blood pressure; VLDL: very low density lipoprotein; XR: extended release. | ||||
Appendix 6. Examination of outcome reporting bias
| Trial | Outcome | Clear that outcome was measured and analyseda (trial report states that outcome was analysed but only reports that result was not significant) | Clear that outcome was measured and analysedb (trial report states that outcome was analysed but no results reported) | Clear that outcome was measuredc (clear that outcome was measured but not necessarily analysed (judgement says likely to have been analysed but not reported because of nonsignificant results)) | Unclear whether the outcome was measuredd (not mentioned but clinical judgement says likely to have been measured and analysed but not reported on the basis of nonsignificant results) |
| Atabek 2008 | Behaviour change | ‐ | ‐ | Yes | ‐ |
| Berkowitz 2003 | N/A | ||||
| Berkowitz 2006 | N/A | ||||
| Chanoine 2005 | N/A | ||||
| Clarson 2009 | Body fat distribution | Yes | ‐ | ‐ | ‐ |
| Franco 2014 | Body fat distribution | ‐ | ‐ | Yes | ‐ |
| Freemark 2001 | N/A | ||||
| Garcia‐Morales 2006 | Behaviour change | ‐ | ‐ | Yes | ‐ |
| Godoy‐Matos 2005 | N/A | ||||
| Kendall 2013 | Behaviour change | ‐ | ‐ | Yes | ‐ |
| Maahs 2006 | Behaviour change | ‐ | ‐ | Yes | ‐ |
| Health‐related quality of life and self esteem | Yes | ‐ | ‐ | ‐ | |
| Mauras 2012 | N/A | ||||
| NCT00001723 | N/A | ||||
| Ozkan 2004 | N/A | ||||
| Prado 2012 | Measured BMI | Yes | ‐ | ‐ | ‐ |
| Body fat distribution | Yes | ‐ | ‐ | ‐ | |
| Rezvanian 2010 | N/A | ||||
| Srinivasan 2006 | Measured BMI | ‐ | Yes | ‐ | ‐ |
| Body fat distribution | ‐ | Yes | ‐ | ‐ | |
| Van Mil 2007 | N/A | ||||
| Wiegand 2010 | Body fat distribution | Yes | ‐ | ‐ | ‐ |
| Wilson 2010 | Body fat distribution | ‐ | Yes | ‐ | ‐ |
| Yanovski 2011 | N/A | ||||
| BMI: body mass index; N/A: not applicable. | |||||
Appendix 7. Definition of endpoint measurementa (I)
| Trial | Measured BMI | Adverse events | Health‐related quality of life and self‐esteem | All‐cause mortality | Morbidity |
| Atabek 2008 | Expressed as BMI (kg/m2). Obesity defined as ≥ the 95th percentile for age and sex based on the standards of the CDC (IO) | Participants were asked to report any adverse effects every month. Serious adverse events defined as vomiting or lactic acidosis (SO) | N/I | N/I | Hyperinsulinaemia was defined from norms for pubertal stages 2 to 4: mid‐puberty > 30 mU/L, and postpubertal hyperinsulinism was defined by adult WHO criteria (> 20 mU/L). Insulin sensitivity was estimated using FGIR, HOMA‐IR and QUICKI (IO) |
| Berkowitz 2003 | The change in raw BMI is not given. Instead it is expressed as % reduction in BMI (kg/m2). BMI also used to calculate BMI z score (calculated using CDC standards) Obesity defined as BMI 32 to 44 kg/m2 (IO) | Adverse events were recorded at each medical visit. In addition, blood pressure and heart rate were monitored closely, and any abnormalities were considered as adverse events. A serious adverse event was not defined (AO, IO, SO) | N/I | N/I | N/I |
| Berkowitz 2006 | Expressed as BMI (kg/m2) in graphical format and % change in BMI in text and tabular format. Used Rosner 1998 to define obesity (IO) | The investigator recorded all adverse events, both observed and volunteered. The only serious event defined as excessive nausea and vomiting. Unclear whether suicide attempt and depression were defined as serious (AO, IO, SO) | N/I | 2 suicide attempts ‐ did not result in mortality (AO, IO) | N/I |
| Chanoine 2005 | Expressed as BMI (kg/m2). Used Barlow 1998 to define obesity (IO) | Gastrointestinal tract adverse effects assessed at each visit by a specially designed dictionary of standard terms for defecation patterns for reproducibility and consistency of reporting. Other adverse events were noted and followed by questioning. Serious adverse events included acute demyelinating encephalomyelitis, facial palsy, pneumonia, worsening of asthma, pain in the right side, pilonidal abscess, depression, asthma attack, seizure, admission for repair of deviated nasal septum, appendicitis, cholelithiasis, gallbladder disorder followed by cholecystectomy, adenoidal hypertrophy and aseptic meningitis. The trial also used electrocardiograms to detect abnormalities and measured gallbladder ultrasounds to detect gallstones (AO, IO, SO) | N/I | N/I | Gallstones and fatty liver infiltration or hepatomegaly identified by gallbladder ultrasound (IO) |
| Clarson 2009 | Expressed as BMI (kg/m2). Obesity defined as BMI > 95th percentile for age and sex (no reference). BMI z scores calculated using the CDC reference data (IO) | No adverse events reported, trial highlights that metformin was well tolerated by all participants ‐ unclear how this was assessed | N/I | N/I | Insulin resistance was defined using HOMA > 3 (IO) |
| Franco 2014 | Weight and height used to calculate BMI. Obesity defined by WHO classification (IO) | Adverse effects were investigated on a preset questionnaire and described voluntarily by the participant at each consultation (on average every 40 days). A serious adverse event was not defined (AO, SO) | N/I | N/I | N/I |
| Freemark 2001 | Expressed change in BMI. Also expressed as BMI SDS. Used Rosner 1998 to adjusting for age, sex and race (IO) | Unclear how and when adverse events were assessed | N/I | N/I | Hyperinsulinaemia defined as fasting insulin concentration exceeding 15 μU/mL. Insulin sensitivity assessed by fasting insulin‐to‐glucose concentration ratio, QUICKI and HOMA‐IR (IO) |
| Garcia‐Morales 2006 | Expressed as BMI (kg/m2). Used CDC growth charts (Kuczmarski 2000) (IO) | Adverse events were reported as they were detected by the participant or investigator. They were also assessed during visits. Severe adverse events defined as life‐threatening or those resulting in hospitalisation or producing long‐term disabilities (AO, IO, SO) | Health‐related quality of life assessed by a 36‐item Short‐Form Health Survey (SF‐36) questionnaire (Alonso 1995) (SO) | N/I | Comorbidities were accessed at baseline and follow‐up. These included high blood pressure, high glucose, high triglycerides, high cholesterol, high LDL and high HDL (IO) |
| Godoy‐Matos 2005 | Expressed as BMI (kg/m2). Obesity defined as BMI between 30 and 45 (no reference) (IO) | Adverse events were assessed and recorded at each visit. A significant event was defined as a serious or rare event ‐ serious event not defined (AO, IO, SO) | N/I | N/I | N/I |
| Kendall 2013 | Expressed as BMI (kg/m2). Obesity defined by UK BMI centile charts. No reference for how BMI SDS was calculated (IO) | How and when trial authors assessed adverse events was not described. No explanation to how they defined a severe/series event | N/I | N/I | Participants had hyperinsulinaemia, impaired fasting glucose or impaired glucose tolerance Insulin resistance/sensitivity was assessed using: HOMA‐IR, QUICKI, whole‐body insulin sensitivity index, adiponectin‐to‐leptin ratio (IO) |
| Maahs 2006 | Expressed as BMI (kg/m2). Obesity defined as BMI that exceeded the 85th percentile for age and sex (assume this from the CDC standards) (IO) | Adverse events assessed at each monthly visit. Serious/severe adverse events not defined (AO, IO, SO) | Health‐related quality of life assessed by 4 questionnaires: Brief Symptom Inventory (Derogatis 1983), Parents and Children's KINDL (Ravens‐Sieberer 2001), IWQOL‐Kids (Kolotkin 1997; Kolotkin 2001), and a global ratings scale (SO) | Defined as suicide ‐ 1 participant in the orlistat group (AO, IO) | N/I |
| Mauras 2012 | Expressed as BMI (kg/m2). BMI % determined using CDC standards (Kuczmarski 2000) (IO) | Trial authors did not describe how and when adverse events were assessed. Did not report number or type of adverse events | N/I | N/I | Elevated hsCRP and fibrogen concentrations were measured by immuno‐nephelometry (IO) |
| NCT00001723 | BMI SDS calculated for age and sex according to CDC standards (IO) | Events were collected by systematic assessment. Trial authors did not define what a serious adverse event was (IO, SO) | N/I | N/I | N/I |
| Ozkan 2004 | Expressed as BMI (kg/m2). Severe obesity defined as weight for height index > 140% (no reference) (IO) | Unclear how and when adverse events were assessed. All with mild gastrointestinal complaints apart from 2 (mild diffuse hair loss and another with muscle cramps). A serious/severe event was not defined | N/I | N/I | N/I |
| Prado 2012 | Expressed as BMI (kg/m2). Obesity defined as BMI > 95th percentile for age and sex (no reference) (IO) | Adverse events monitored by ALT, AST and haemoglobin levels (IO) | N/I | N/I | Risk factors for diabetes mellitus type 2: high glycaemia fasting, high postload glucose or high insulin sensitivity. Insulin sensitivity accessed by HOMA |
| Rezvanian 2010 | Expressed as BMI (kg/m2). Gave baseline BMI SDS (calculated using revised CDC growth charts: Kuczmarski 2000 but did not give follow‐up measurements (IO) | Participants and parents educated on possible signs of symptoms of hypoglycaemia. They were also given a 24‐hour mobile phone number to call if any adverse events occurred. No definition of severe/serious adverse events (SO) | N/I | N/I | N/I |
| Srinivasan 2006 | Raw BMI (kg/m2) data not provided BMI z score (presented only on a graph) was calculated from the CDC reference data 2000. Obesity defined by the International Obesity Task Force (Cole 2000) (IO) | Unclear how and when adverse events were assessed. No definition for serious/severe events | N/I | N/I | Clinical suspicion of insulin resistance defined by fasting insulin‐to‐glucose ratio or presence of acanthosis nigricans (assessed by severity at the neck by a validated scale) Insulin sensitivity was accessed by SI clamp (minimal model), fasting insulin and fasting glucose (IO) |
| Van Mil 2007 | Expressed as BMI (kg/m2). BMI SDS was determined using the Dutch age‐ and sex‐adjusted BMI curves (Hansen 1998). Obesity defined as ≥ 97th percentile (no reference) (IO) | Adverse events were determined at each visit. Heart rate, DBP, SBP were monitored throughout the trial. No definition of a serious/severe event (AO, IO, SO) | N/I | N/I | N/I |
| Wiegand 2010 | Expressed as BMI (kg/m2) ‐ reference: Park 2009. Also provided BMI SDS, no reference (IO) | Adverse events determined at the 3‐month and 6‐month visit by a clinical and biochemical assessment. No definition of a serious/severe event (AO, IO, SO) | N/I | N/I | Risk factors for type 2 diabetes: acanthosis nigricans, signs of metabolic syndrome and impaired fasting glucose Insulin sensitivity was assessed by HOMA‐IR and insulin sensitivity index (IO) |
| Wilson 2010 | Expressed as BMI (kg/m2). Used CDC charts to convert BMI to BMI z score (Kuczmarski 2000) (IO) | Adverse events assessed at each visit. An appendectomy was defined as a serious/severe event (AO, IO, SO) | N/I | N/I | N/I |
| Yanovski 2011 | Expressed as BMI (kg/m2). Also expressed as BMI SDS (no reference) (IO) | Adverse events accessed at each visit and by laboratory analysis. A serious/severe event was not defined (AO, IO, SO) | N/I | N/I | Insulin sensitivity was calculated (from a SI clamp) using the metabolic rate‐to‐steady‐state insulin ratio. Insulin resistance estimated using HOMA‐IR (IO) |
| aIn addition to definition of endpoint measurement, description who measured the outcome (AO: adjudicated outcome measurement; IO: investigator‐assessed outcome measurement; SO: self‐reported outcome measurement). ALT: alanine transaminase; AST: aspartate transaminase; BMI: body mass index; BMI SDS: body mass index standard deviation score; CDC: Centers for Disease Control and Prevention; DBP: diastolic blood pressure; FGIR: fasting insulin concentration/fasting glucose concentration; HbA1c: glycosylated haemoglobin A1c; HDL: high‐density lipoprotein; HOMA(‐IR): homeostasis model assessment (insulin resistance); hsCRP: high sensitivity C‐reactive protein; IWQOL: Impact of Weight on Quality of Life questionnaire; LDL: low‐density lipoprotein; N/I: not investigated; OGTT: oral glucose tolerance test; QUICKI: quantitative insulin check index; SBP: systolic blood pressure; SI clamp: insulin sensitivity clamp; WHO: World Health Organization. | |||||
Appendix 8. Definition of endpoint measurementa (II)
| Trial | Body fat distribution | Behaviour change | Participants views of the intervention | Socioeconomic effects |
| Atabek 2008 | N/I | Food consumption was assessed by the completion of a detailed questionnaire at the beginning and end of the trial (no reference or results given) (SO) | N/I | N/I |
| Berkowitz 2003 | Waist circumference measured using reference: Calloway 1988 (IO) | Hunger was evaluated by the Eating Inventory (range 0 to 14) (Stunkard 1985) (SO) | N/I | N/I |
| Berkowitz 2006 | Waist circumference ‐ no description (IO) | N/I | N/I | N/I |
| Chanoine 2005 | Waist circumference ‐ no description on how it was measured. Body composition measured by whole body DEXA (IO) | N/I | N/I | N/I |
| Clarson 2009 | Waist circumference was measured in the standing position at the level of the umbilicus to the nearest 0.1 cm using a constant tension tape (no reference) (IO) | N/I | N/I | N/I |
| Franco 2014 | Waist circumference and hip circumference measured at the smallest and largest diameter. Arm circumference at the middle third of the left arm (no reference) (IO) | N/I | N/I | N/I |
| Freemark 2001 | N/I | N/I | N/I | N/I |
| Garcia‐Morales 2006 | Waist circumference ‐ measured with a flexible tape between the highest point of the iliac crest and the lowest part of the costal margin at the midaxillary line (no reference) (IO) | A detailed questionnaire on food consumption was completed at the beginning and end of the trial (no reference) (SO) | N/I | N/I |
| Godoy‐Matos 2005 | Waist circumference ‐ measured at the minimal circumference between iliac crest and last rib edge. Hip circumference assessed at the greatest circumference through the major trochanters (no reference) (IO) | N/I | N/I | N/I |
| Kendall 2013 | Waist‐to‐hip ratio (no reference) (IO) | 3 previously validated questionnaires (food frequency, diet and eating behaviour, and physical activity) were completed by each child at the start and end of the trial. No results presented (SO) | N/I | N/I |
| Maahs 2006 | BIA | Diet records recorded before enrolment and at 3 and 6 months. No reference or results provided (SO) | N/I | N/I |
| Mauras 2012 | Waist circumference measured at umbilicus (no reference). Intrahepatic fat content measured using fast MRI. References: Fishbein 2001; Fishbein 2003. Body composition was measured DEXA. Also measured waist‐to‐height ratio (no reference) (IO) | N/I | N/I | N/I |
| NCT00001723 | N/I | N/I | N/I | N/I |
| Ozkan 2004 | N/I | N/I | N/I | N/I |
| Prado 2012 | Waist circumference ‐ measured with a central flexible tape, corresponding to the perimeter less between the iliac crest and the bottom edge last rib, then exhale with arms relaxed on both sides (no reference) (IO) | N/I | N/I | N/I |
| Rezvanian 2010 | Waist circumference ‐ measured at a point midway between the lower border of the rib cage and the iliac crest at the end of normal expiration (no reference) (IO) | N/I | N/I | N/I |
| Srinivasan 2006 | Raw waist circumference data not reported. Waist circumference was calculated from the mean of 3 measures at the level of the umbilicus (no reference). Waist circumference z scores calculated from recent multiracial American reference data (Fernandez 2004). Raw body composition data were not reported. DEXA scans also used. MRI whole‐body scans (IO) | N/I | N/I | N/I |
| Van Mil 2007 | Body composition was assessed using a 4‐component reference model: total bodyweight = fat mass + total body water + total bone mineral content and remaining fat‐free mass (references: Fuller 1992; Van Marken Lichtenbelt 1999). To calculate this they used densitometry, deuterium dilution (Maastricht protocol) with labelled water test and DEXA (IO) | Physical activity level was estimated using an activity questionnaire. A 7‐day dietary record was given to each participant. Only the food quotient used in the assessment (respiratory exchange ratio to calculate TEE). Rest of the data not presented (IO, SO) | N/I | N/I |
| Wiegand 2010 | Waist‐to‐hip ratio and body composition (BIA) were measured but no explanation to how and no results given (apart from saying they were not significant) (IO) | N/I | N/I | N/I |
| Wilson 2010 | Abdominal CT scans evaluated abdominal fat content and distribution (Borkan 1982). Whole body DEXA used to measure % body fat and lean body mass (von Scheven 2006). Waist circumference measured at the smallest circumference below the rib cage and above the umbilicus (Wang 2003) (IO) | N/I | N/I | N/I |
| Yanovski 2011 | Abdominal and hip circumferences (assessed in triplicate) and triceps skinfold thickness. Whole‐body fat mass by DEXA and by air displacement plethysmography; and intra‐abdominal and subcutaneous abdominal adipose tissue by MRI at L2 to L3 and L4 to L5 (IO) | N/I | N/I | N/I |
| aIn addition to definition of endpoint measurement, description who measured the outcome (AO: adjudicated outcome measurement; IO: investigator‐assessed outcome measurement; SO: self‐reported outcome measurement). BIA: bioelectrical impedance analysis; CT: computed tomography; DEXA: dual‐energy X‐ray absorptiometry; MRI: magnetic resonance imaging; n: number of participants; N/I: not investigated; TEE: total energy expenditure. | ||||
Appendix 9. Adverse events (I)
| Trial | Intervention(s) and comparator(s) | Participants included in analysis | Deaths | Deaths | Participants with at least one adverse event | Participants with at least one adverse event | Participants with at least one severe/serious adverse event | Participants with at least one severe/serious adverse event |
| Atabek 2008 | I: metformin + diet and physical activity advice | 90 | 0 | 0 | 2 | 2.2 | 0 | 0 |
| C: placebo + diet and physical activity advice | 30 | 0 | 0 | 0 | 0.0 | 0 | 0 | |
| Berkowitz 2003 | I: behavioural programme + sibutramine | 43 | 0 | 0 | 6 | 14.0 | ‐ | ‐ |
| C: behavioural programme + placebo | 39 | 0 | 0 | 3 | 7.7 | ‐ | ‐ | |
| Berkowitz 2006 | I: behavioural therapy programme + sibutramine | 368 | 0 | 0 | 327 | 88.9 | 10 | 2.7 |
| C: behavioural therapy programme + placebo | 130 | 0 | 0 | 111 | 85.4 | 1 | 0.8 | |
| Chanoine 2005 | I: orlistat + diet + exercise + behavioural therapy | 352 | 0 | 0 | 341 | 97 | 11 | 3 |
| C: placebo + diet + exercise + behavioural therapy | 181 | 0 | 0 | 170 | 94 | 5 | 3 | |
| Clarson 2009 | I: metformin + lifestyle intervention | 14 | 0 | 0 | 0 | 0 | 0 | 0 |
| C: lifestyle intervention only | 17 | 0 | 0 | 0 | 0 | 0 | 0 | |
| Franco 2014 | I: sibutramine + dietary guidance | 63 | ‐ | ‐ | 8 | 13.4 | 0 | 0 |
| C: placebo + dietary guidance | 63 | ‐ | ‐ | 3 | 4.9 | 0 | 0 | |
| Freemark 2001 | I: metformin | 15 | 0 | 0 | 4 | 26.7 | 0 | 0 |
| C: placebo | 17 | 0 | 0 | 1 | 5.9 | 0 | 0 | |
| Garcia‐Morales 2006 | I: sibutramine + diet + exercise | 23 | 0 | 0 | 10 | 43.5 | 0 | 0 |
| C: placebo + diet + exercise | 23 | 0 | 0 | 10 | 43.5‐ | 0 | 0 | |
| Godoy‐Matos 2005 | I: sibutramine + hypocaloric diet + exercise | 30 | 0 | 0 | ‐a | ‐ | 0 | 0 |
| C: placebo + hypocaloric diet + exercise | 30 | 0 | 0 | ‐a | ‐ | 0 | 0 | |
| Kendall 2013 | I: metformin + healthy lifestyle advice | 74 | 0 | 0 | 20 | 27.0 | 0 | 0 |
| C: control + healthy lifestyle advice | 77 | 0 | 0 | 8 | 10.4 | 0 | 0 | |
| Maahs 2006 | I: orlistat + diet and exercise therapy | 20 | 1 | 5.0 | ‐ | ‐ | 1 | 5.0 |
| C: placebo + diet and exercise therapy | 20 | 0 | 0 | ‐ | ‐ | 0 | 0 | |
| Mauras 2012 | I: metformin + diet/exercise intervention | 35 | 0 | 0 | ‐ | ‐ | 0 | 0 |
| C: diet/exercise intervention | 31 | 0 | 0 | ‐ | ‐ | 0 | 0 | |
| NCT00001723 | I: orlistat + behavioural weight loss programme | 100 | 0 | 0 | 95 | 95 | 0 | 0 |
| C: placebo + behavioural weight loss programme | 100 | 0 | 0 | 94 | 94 | 2 | 2 | |
| Ozkan 2004 | I: conventional treatment + orlistat | 22 | 0 | 0 | 22 | 100 | ‐ | ‐ |
| C: conventional treatment | 20 | 0 | 0 | 0 | 0 | ‐ | ‐ | |
| Prado 2012 | I: metformin + nutritional guide and exercise programme | 10 | 0 | 0 | ‐ | ‐ | 0 | 0 |
| C: placebo + nutritional guide and exercise programme | 9 | 0 | 0 | ‐ | ‐ | 0 | 0 | |
| Rezvanian 2010 | I1: metformin + healthy eating and physical activity advice | 45 | 0 | 0 | 7 | 15.6 | 0 | 0 |
| I2: fluoxetine + healthy eating and physical activity advice | 45 | 0 | 0 | ‐ | ‐ | 0 | 0 | |
| I3: metformin and fluoxetine + healthy eating and physical activity advice | 45 | 0 | 0 | ‐ | ‐ | 0 | 0 | |
| C: placebo + healthy eating and physical activity advice | 45 | 0 | 0 | ‐ | ‐ | 0 | 0 | |
| Srinivasan 2006 | I: metformin first then placebo + "standardised information on healthy eating and exercise" | 13 | 0 | 0 | ‐b | ‐ | 0 | 0 |
| C: placebo first then metformin + "standardised information on healthy eating and exercise" | 15 | 0 | 0 | ‐b | ‐ | 0 | 0 | |
| Van Mil 2007 | I: sibutramine + energy‐restricted diet and exercise plan | 12 | 0 | 0 | 12 | 100 | ‐ | ‐ |
| C: placebo + energy‐restricted diet and exercise plan | 12 | 0 | 0 | 9 | 75 | ‐ | ‐ | |
| Wiegand 2010 | I: metformin + multiprofessional lifestyle intervention | 36 | 0 | 0 | 8 | 22.2 | ‐ | ‐ |
| C: placebo + multiprofessional lifestyle intervention | 34 | 0 | 0 | 13 | 38.2 | ‐ | ‐ | |
| Wilson 2010 | I: metformin + lifestyle intervention | 38 | 0 | 0 | ‐c | ‐ | 2 | 5.3 |
| C: placebo + lifestyle intervention | 38 | 0 | 0 | ‐c | ‐ | 0 | 0 | |
| Yanovski 2011 | I: metformin + dietitian‐administered weight‐reduction programme | 53 | 0 | 0 | ‐d | ‐ | 0 | 0 |
| C: placebo + dietitian‐administered weight‐reduction programme | 47 | 0 | 0 | ‐d | ‐ | 0 | 0 | |
| "‐" denotes not reported. aNumber of participants with one or multiple adverse events: sibutramine group 47 events in 30 participants; placebo group 45 events in 30 participants. C: comparator; I: intervention; n: number pf participants. | ||||||||
Appendix 10. Adverse events (II)
| Trial | Intervention(s) and comparator(s) | Participants included in analysis | Participants discontinuing trial due to an adverse event | Participants discontinuing trial due to an adverse event | Participants with at least one hospitalisation | Participants with at least one hospitalisation | Participants with at least one outpatient treatment | Participants with at least one outpatient treatment |
| Atabek 2008 | I: metformin + diet and physical activity advice | 90 | 0 | 0 | 0 | 0 | 0 | 0 |
| C: placebo + diet and physical activity advice | 30 | 0 | 0 | 0 | 0 | 0 | 0 | |
| Berkowitz 2003 | I: behavioural programme + sibutramine | 42 | 0 | 0 | ‐ | ‐ | ‐ | ‐ |
| C: behavioural programme + placebo | 39 | 1 | 2.5 | ‐ | ‐ | ‐ | ‐ | |
| Berkowitz 2006 | I: behavioural therapy programme + sibutramine | 368 | 23 | 6 | ‐ | ‐ | ‐ | ‐ |
| C: behavioural therapy programme + placebo | 130 | 7 | 5 | ‐ | ‐ | ‐ | ‐ | |
| Chanoine 2005 | I: orlistat + diet + exercise + behavioural therapy | 352 | 12 | 3 | 10 | 2.8 | 0 | 0 |
| C: placebo + diet + exercise + behavioural therapy | 181 | 3 | 2 | 5 | 2.8 | 0 | 0 | |
| Clarson 2009 | I: metformin + lifestyle intervention | 14 | 0 | 0 | 0 | 0 | 0 | 0 |
| C: lifestyle intervention only | 17 | 0 | 0 | 0 | 0 | 0 | 0 | |
| Franco 2014 | I: sibutramine + dietary guidance | 63 | 0 | 0 | 0 | 0 | 0 | 0 |
| C: placebo + dietary guidance | 63 | 0 | 0 | 0 | 0 | 0 | 0 | |
| Freemark 2001 | I: metformin | 15 | 0 | 0 | 0 | 0 | 0 | 0 |
| C: placebo | 17 | 0 | 0 | 0 | 0 | 0 | 0 | |
| Garcia‐Morales 2006 | I: sibutramine + diet + exercise | 23 | 0 | 0 | ‐ | ‐ | ‐ | ‐ |
| C: placebo + diet + exercise | 23 | 0 | 0 | ‐ | ‐ | ‐ | ‐ | |
| Godoy‐Matos 2005 | I: sibutramine + hypocaloric diet + exercise | 30 | 0 | 0 | 0 | 0 | 0 | 0 |
| C: placebo + hypocaloric diet + exercise | 30 | 0 | 0 | 0 | 0 | 0 | 0 | |
| Kendall 2013 | I: metformin + healthy lifestyle advice | 74 | 0 | 0 | ‐ | ‐ | ‐ | ‐ |
| C: control + healthy lifestyle advice | 77 | 0 | 0 | ‐ | ‐ | ‐ | ‐ | |
| Maahs 2006 | I: orlistat + diet and exercise therapy | 20 | 3 | 15 | ‐ | ‐ | ‐ | ‐ |
| C: placebo + diet and exercise therapy | 20 | 0 | 0 | ‐ | ‐ | ‐ | ‐ | |
| Mauras 2012 | I: metformin + diet/exercise intervention | 35 | 0 | 0 | 0 | 0 | 0 | 0 |
| C: diet/exercise intervention | 31 | 0 | 0 | 0 | 0 | 0 | 0 | |
| NCT00001723 | I: orlistat + behavioural weight loss programme | 100 | 1 | 1 | ‐ | ‐ | ‐ | ‐ |
| C: placebo + behavioural weight loss programme | 100 | 2 | 2 | ‐ | ‐ | ‐ | ‐ | |
| Ozkan 2004 | I: conventional treatment + orlistat | 22 | 7 | 32 | ‐ | ‐ | ‐ | ‐ |
| C: conventional treatment | 20 | 0 | 0 | ‐ | ‐ | ‐ | ‐ | |
| Prado 2012 | I: metformin + nutritional guide and exercise programme | 10 | 0 | 0 | 0 | 0 | 0 | 0 |
| C: placebo + nutritional guide and exercise programme | 9 | 0 | 0 | 0 | 0 | 0 | 0 | |
| Rezvanian 2010 | I1: metformin + healthy eating and physical activity advice | 45 | 0 | 0 | 0 | 0 | 0 | 0 |
| I2: fluoxetine + healthy eating and physical activity advice | 45 | 0 | 0 | 0 | 0 | 0 | 0 | |
| I3: metformin and fluoxetine + healthy eating and physical activity advice | 45 | 0 | 0 | 0 | 0 | 0 | 0 | |
| C: placebo + healthy eating and physical activity advice | 45 | 0 | 0 | 0 | 0 | 0 | 0 | |
| Srinivasan 2006 | I: metformin first then placebo + "standardised information on healthy eating and exercise" | 13 | 0 | 0 | 0 | 0 | 0 | 0 |
| C: placebo first then metformin + "standardised information on healthy eating and exercise" | 15 | 0 | 0 | 0 | 0 | 0 | 0 | |
| Van Mil 2007 | I: sibutramine + energy‐restricted diet and exercise plan | 12 | 1 | 8 | 0 | 0 | 0 | 0 |
| C: placebo + energy‐restricted diet and exercise plan | 12 | 0 | 0 | 0 | 0 | 0 | 0 | |
| Wiegand 2010 | I: metformin + multiprofessional lifestyle intervention | 36 | 3 | 8.3 | ‐ | ‐ | ‐ | ‐ |
| C: placebo + multiprofessional lifestyle intervention | 34 | 1 | 2.9 | ‐ | ‐ | ‐ | ‐ | |
| Wilson 2010 | I: metformin + lifestyle intervention | 38 | 3 | 7.9 | ‐ | ‐ | ‐ | ‐ |
| C: placebo + lifestyle intervention | 38 | 1 | 2.6 | ‐ | ‐ | ‐ | ‐ | |
| Yanovski 2011 | I: metformin + dietitian‐administered weight‐reduction programme | 53 | 1 | 1.9 | ‐ | ‐ | ‐ | ‐ |
| C: placebo + dietitian‐administered weight‐reduction programme | 47 | 0 | 0 | ‐ | ‐ | ‐ | ‐ | |
| "‐" denotes not reported. C: comparator; I: intervention; n: number of participants. | ||||||||
Appendix 11. Adverse events (III)
| Trial | Intervention(s) and comparator(s) | Participants included in analysis | Participants with a specific adverse event | Participants with at least one specific adverse events | Participants with at least one specific adverse event |
| Atabek 2008 | I: metformin + diet and physical activity advice | 90 | 1. Diarrhoea and mild abdominal pain 2. Mild discomfort from the abdomen | 1. 1 2. 1 | 1. 1.1 2. 1.1 |
| C: placebo + diet and physical activity advice | 30 | ‐ | ‐ | ‐ | |
| Berkowitz 2003 | I: behavioural programme + sibutramine | 42 | 1. High blood pressure and pulse rate 2. High blood pressure only 3. High pulse rate only 4. Knee surgery 5. Ventricular premature beats 6. Cholelithiasis/cholecystectomy 7. Rash, viral | 1. 3 2. 1 3. 1 4. 1 5. 1 6. 1 7. 1 | 1. 7.1 2. 2.4 3. 2.4 4. 2.4 5. 2.4 6. 2.4 7. 2.4 |
| C: behavioural programme + placebo | 39 | 1. Elevated blood pressure and pulse rate* 2. Elevated pulse rate only* 3. Atrial premature beats 4. Tonsillectomy 5. Ventricular premature beats* 6. Ecchymoses* | 1. 1 2. 1 3. 1 4. 2 5. 1 6. 2 | 1. 2.6 2. 2.6 3. 2.6 4. 5.1 5. 2.6 6. 5.1 | |
| Berkowitz 2006 | I: behavioural therapy programme + sibutramine | 368 | 1. Infection 2. Headache 3. Pharyngitis 4. Tachycardia 5. Accidental injury 6. Dry mouth 7. Pain 8. Hypertension 9. Rhinitis 10. Abdominal pain 11. Dysmenorrhoea 12. Vomiting 13. Cough increased 14. Nausea 15. Dizziness 16. Rash 17. Sinusitis 18. Constipation 19. Flu syndrome 20. Insomnia 21. Viral infection 22. Allergic reaction 23. Suicide attempt 24. Depression 25. Syncope 26. Chest pain 27. Arrhythmia 28. Extra systoles | 1. 167 2. 113 3. 49 4. 46 5. 41 6. 41 7. 42 8. 39 9. 41 10. 37 11. 21 12. 32 13. 28 14. 31 15. 28 16. 25 17. 24 18. 24 19. 23 20. 23 21. 20 22. 18 23. 1 24. 5 25. ‐ 26. ‐ 27. ‐ 28. ‐ | 1. 45.3 2. 30.7 3. 13.3 4. 12.5 5.11.1 6.11.1 7. 11.4 8. 10.6 9. 11.1 10. 10.1 11. 5.7 12. 8.7 13. 7.6 14. 8.4 15. 7.6 16. 6.8 17. 6.5 18. 6.5 19. 6.3 20. 6.3 21. 5.4 22. 4.9 23. 0.3 24. 1.4 25. ≤ 1.5 26. ≤ 1.5 27. ≤ 1.5 28. ≤ 1.5 |
| C: behavioural therapy programme + placebo | 130 | 1. Infection 2. Headache 3. Pharyngitis 4. Tachycardia 5. Accidental injury 6. Dry mouth 7. Pain 8. Hypertension 9. Rhinitis 10. Abdominal pain 11. Dysmenorrhoea 12. Vomiting 13. Cough increased 14. Nausea 15. Dizziness 16. Rash 17. Sinusitis 18. Constipation 19. Flu syndrome 20. Insomnia 21. Viral infection 22. Allergic reaction 23. Suicide attempt 24. Depression 25. Syncope 26. Chest pain 27. Arrhythmia 28. Extra systoles | 1. 53 2. 39 3. 23 4. 8 5. 8 6. 8 7. 12 8. 11 9. 17 10. 12 11. 13 12. 7 13. 12 14. 12 15. 5 16. 7 17. 6 18. 3 19. 7 20. 4 21. 2 22. 7 23. 1 24. 1 25. ‐ 26. ‐ 27. ‐ 28. ‐ | 1. 41 2. 30 3. 18 4. 6.2 5. 6.2 6. 6.2 7. 9.2 8. 8.5 9. 13.1 10. 9.2 11. 10 12. 5.4 13. 9.2 14. 9.2 15. 3.8 16. 5.4 17. 4.6 18. 2.3 19. 5.4 20. 3.1 21. 1.5 22. 5.4 23. 0.8 24. 0.8 25. ≤ 1.5 26. ≤ 1.5 27. ≤ 1.5 28. ≤ 1.5 | |
| Chanoine 2005 | I: orlistat + diet + exercise + behavioural therapy | 352 | 1. Fatty/oily stool 2. Oily spotting 3. Oily evacuation 4. Abdominal pain 5. Fecal urgency 6. Flatus with discharge 7. Soft stool 8. Nausea 9. Increased defecation 10. Flatulence 11. Fecal incontinence 12. Headache 13. Upper respiratory tract infection 14. Nasopharyngitis 15. Sore throat 16. Sinusitis 17. Joint sprain 18. Nasal congestion 19. Back pain 20. Gastroenteritis 21. Seasonal rhinitis 22. Limb injury 23. Asymptomatic gallstones 24. Pilonidal abscess 25. Depression 26. Asthma attack 27. Seizure 28. Admission for repair of deviated nasal septum 29. Appendicitis 30. Cholelithiasis 31. Gallbladder disorder followed by cholecystectomy 32. Adenoidal hypertrophy 33. Aseptic meningitis 34. Electrocardiogram abnormalities | 1. 177 2. 102 3. 82 4. 77 5. 73 6. 70 7. 53 8. 52 9. 48 10. 32 11. 31 12. 134 13. 114 14. 99 15. 59 16. 40 17. 35 18. 31 19. 28 20. 23 21. 21 22. 18 23. 6 24. 1 25. 2 26. 1 27. 1 28. 1 29. 1 30. 1 31. 1 32. 1 33. 1 34. 10 | 1. 50.3 2. 29.0 3. 23.3 4. 21.9 5. 20.7 6. 19.9 7. 15.1 8. 14.8 9. 13.6 10. 9.1 11. 8.8 12. 38.1 13. 32.4 14. 28.1 15. 16.8 16. 11.4 17. 9.9 18. 8.8 19. 8.0 20. 6.5 21. 6.0 22. 5.1 23. 1.7 24. 0.3 25. 0.6 26. 0.3 27. 0.3 28. 0.3 29. 0.3 30. 0.3 31. 0.3 32. 0.3 33. 0.3 34. 2.8 |
| C: placebo + diet + exercise + behavioural therapy | 181 | 1. Fatty/oily stool 2. Oily spotting 3. Oily evacuation 4. Abdominal pain 5. Fecal urgency 6. Flatus with discharge 7. Soft stool 8. Nausea 9. Increased defecation 10. Flatulence 11. Fecal incontinence 12. Headache 13. Upper respiratory tract infection 14. Nasopharyngitis 15. Sore throat 16. Sinusitis 17. Joint sprain 18. Nasal congestion 19. Back pain 20. Gastroenteritis 21. Seasonal rhinitis 22. Limb injury 23. Acute demyelinating encephalomyelitis 24. Facial palsy 25. Pneumonia 26. Worsening of asthma 27. Pain in the right side 28. Electrocardiogram abnormalities | 1.15 2. 7 3. 3 4. 20 5. 20 6. 5 7. 19 8. 23 9. 16 10. 8 11. 1 12. 56 13. 48 14. 46 15. 29 16. 19 17. 17 18. 11 19. 11 20. 8 21. 9 22. 5 23. 1 24. 1 25. 1 26. 1 27. 1 28. 1 | 1. 8.3 2. 3.9 3. 1.7 4. 11.0 5. 11.0 6. 2.8 7. 10.5 8. 12.7 9. 8.8 10. 4.4 11. 0.6 12. 30.9 13. 26.5 14. 25.4 15. 16.0 16. 10.5 17. 9.4 18. 6.1 19. 6.1 20. 4.4 21. 5.0 22. 2.8 23. 0.6 24. 0.6 25. 0.6 26. 0.6 27. 0.6 28. 0.6 | |
| Clarson 2009 | I: metformin + lifestyle intervention | 14 | ‐ | ‐ | ‐ |
| C: lifestyle intervention only | 17 | ‐ | ‐ | ‐ | |
| Franco 2014 | I: sibutramine + dietary guidance | 63 | 1. Anorexia 2. Dry mouth 3. Headache 4. Constipation 5. Changing the mood 6. Dyspnoea 7. Epigastralgia 8. Hypertension 9. Insomnia 10. Nausea 11. Tachycardia 12. Dizziness 13. Tremors 14. Vomiting | ‐ | 1. 0.9 2. 1.7 3. 6.8 4. 3.8 5. 1.3 6. 0.4 7. 0.9 8. 0.9 9. 1.3 10. 2.1 11. 1.3 12. 3.4 13. 0.4 14. 0.4 |
| C: placebo + dietary guidance | 63 | 1. Change in taste 2. Headache 3. Diarrhoea 4. Hypertension 5. Irritability 6. Tachycardia 7. Dizziness | ‐ | 1. 0.9 2. 3.3 3. 2.8 4. 0.5 5. 1.4 6. 0.5 7. 0.9 | |
| Freemark 2001 | I: metformin | 15 | 1. Transient abdominal discomfort or diarrhoea 2. Intermittent nausea | 1. 3 2. 1 | 1. 20 2. 6.7 |
| C: placebo | 17 | 1. Transient abdominal discomfort or diarrhoea | 1. 1 | 1. 5.9 | |
| Garcia‐Morales 2006 | I: sibutramine + diet + exercise | 23 | 1. Headache 2. Dry mouth 3. Headache with nausea 4. Headache with weakness 5. High DBP 6. High heart rate 7. High blood pressure (baseline) 8. High blood pressure (end of trial) | 1. 1 2. 1 3. 1 4. 1 5. 1 6. 3 7. 2 8. 2 | 1. 4.3 2. 4.3 3. 4.3 4. 4.3 5. 4.3 6. 13.0 7. 8.7 8. 8.7 |
| C: placebo + diet + exercise | 23 | 1. Headache 2. Headache with somnolence 3. Headache with dry mouth 4. High DBP 5. High heart rate 6. High blood pressure (baseline) 7. High blood pressure (end of trial) | 1. 2 2. 1 3. 1 4. 2 5. 2 6. 7 7. 2 | 1. 8.7 2. 4.3 3. 4.3 4. 8.7 5. 8.7 6. 30.4 7. 8.7 | |
| Godoy‐Matos 2005 | I: sibutramine + hypocaloric diet + exercise | 30 | 1. Dry mouth 2. Headache 3. Constipation 4. Abdominal pain 5. Cold 6. Dizzy 7. Tonsillitis 8. Menstrual cramp 9. Nausea 10. Toothache 11. Otitis 12. Hair loss 13. Rhinitis 14. Sinusitis 15. Sleepiness 16. Dry cough 17. Myalgia 18. Viral infection 19. Lumbago | 1. 7 2. 13 3. 12 4. 3 5. 9 6. 3 7. 2 8. 8 9. 3 10. 3 11. 3 12. 2 13. 1 14. 1 15. 1 16. 1 17. 1 18. 2 19. 2 | 1. 23.3 2. 43.3 3. 40.0 4. 10.0 5. 30.0 6. 10.0 7. 6.7 8. 26.7 9. 10.0 10. 10.0 11. 10.0 12. 6.7 13. 3.3 14. 3.3 15. 3.3 16. 3.3 17. 3.3 18. 6.7 19. 6.7 |
| C: placebo + hypocaloric diet + exercise | 30 | 1. Dry mouth 2. Headache 3. Constipation 4. Abdominal pain 5. Cold 6. Dizzy 7. Tonsillitis 8. Menstrual cramp 9. Nausea 10. Toothache 11. Otitis 12. Hair loss 13. Rhinitis 14. Sinusitis 15. Sleepiness 16. Dry cough 17. Myalgia 18. Bronchitis 19. Inguinal dermatitis 20. Fever | 1. 3 2. 21 3. 4 4. 4 5. 11 6. 2 7. 2 8. 6 9. 1 10. 1 11. 1 12. 1 13. 2 14. 2 15. 2 16. 2 17. 2 18. 2 19. 2 20. 2 | 1. 10.0 2. 70.0 3. 13.3 4. 13.3 5. 36.7 6. 6.7 7. 6.7 8. 20.0 9. 3.3 10. 3.3 11. 3.3 12. 3.3 13. 6.7 14. 6.7 15. 6.7 16. 6.7 17. 6.7 18. 6.7 19. 6.7 20. 6.7 | |
| Kendall 2013 | I: metformin + healthy lifestyle advice | 74 | ‐ | ‐ | ‐ |
| C: control + healthy lifestyle advice | 77 | ‐ | ‐ | ‐ | |
| Maahs 2006 | I: orlistat + diet and exercise therapy | 20 | ‐ | ‐ | ‐ |
| C: placebo + diet and exercise therapy | 20 | ‐ | ‐ | ‐ | |
| All: | 40 | 1. Soft stools 2. Oily spotting 3. Fatty or oily stools 4. Oily evacuation 5. Liquid stools 6. Cramping 7. Flatus with discharge 8. Fecal incontinence | ‐ | ‐ | |
| Mauras 2012 | I: metformin + diet/exercise intervention | 35 | ‐ | ‐ | ‐ |
| C: diet/exercise intervention | 31 | ‐ | ‐ | ‐ | |
| NCT00001723 | I: orlistat + behavioural weight loss programme | 100 | 1. Hypoglycaemia 2. Left lower quadrant pain and vomiting 3. Ear disorders (otitis, earache, ear pain) 4. Eye disorders (change in vision, conjunctivitis, styes) 5. Abdominal pain or cramping 6. Bloating or gas 7. Borborygmi 8. Constipation 9. Controlled discharge of oil without stool 10. Decreased frequency of bowel movements 11. Diarrhoea 12. Fatty‐appearing stools 13. Flatulence (passage of gas) 14. Flatus with discharge 15. Frequent urge for bowel movement 16. Hiccups 17. Increased frequency of bowel movements 18. Nausea 19. Oily spotting 20. Rectal bleeding ‐ haemorrhoids 21. Soft or deliquescent stools 22. Stomach pain or cramps 23. Stools almost all liquid with very few solid parts 24. Stools hard and in the shape of small pellets 25. Stools mixed with fat or with a separate oily layer 26. Uncontrolled passage of stool or oil 27. Urgent, but controlled, need to produce stools 28. Vomiting 29. Dizziness 30. Epistaxis 31. Feeling cold 32. Headache 33. Increased sweating 34. Increased thirst 35. Sinusitis, postnasal drip or nasal stuffiness 36. Unusual tiredness or weakness (fatigue) 37. Pharyngitis 38. Sinusitis, postnasal drip or nasal stuffiness 39. Decrease in appetite 40. Muscle pain, stiffness, cramps or ache 41. Migraine headaches 42. Mental depression 43. Dysuria or UTI 44. Nocturia 45. Asthma symptoms 46. Cough 47. Upper respiratory infection 48. Skin rash | 1. 0 2. 0 3. 7 4. 8 5.16 6. 18 7. 6 8. 1 9. 56 10. 25 11. 21 12. 61 13. 60 14. 43 15. 19 16. 1 17. 68 18. 10 19. 6 20. 4 21. 68 22. 8 23. 64 24. 11 25. 83 26. 60 27. 44 28. 7 29. 4 30. 5 31. 5 32. 14 33. 3 34. 5 35. 2 36. 1 37. 6 38. 1 39. 11 40. 16 41. 3 42. 1 43. 1 44. 0 45. 5 46. 0 47. 14 48. 5 | 1. 0 2. 0 3. 7 4. 8 5.16 6. 18 7. 6 8. 1 9. 56 10. 25 11. 21 12. 61 13. 60 14. 43 15. 19 16. 1 17. 68 18. 10 19. 6 20. 4 21. 68 22. 8 23. 64 24. 11 25. 83 26. 60 27. 44 28. 7 29. 4 30. 5 31. 5 32. 14 33. 3 34. 5 35. 2 36. 1 37. 6 38. 1 39. 11 40. 16 41. 3 42. 1 43. 1 44. 0 45. 5 46. 0 47. 14 48. 5 |
| C: placebo + behavioural weight loss programme | 100 | 1. Hypoglycaemia 2. Left lower quadrant pain and vomiting 3. Ear disorders (otitis, earache, ear pain) 4. Eye disorders (change in vision, conjunctivitis, styes) 5. Abdominal pain or cramping 6. Bloating or gas 7. Borborygmi 8. Constipation 9. Controlled discharge of oil without stool 10. Decreased frequency of bowel movements 11. Diarrhoea 12. Fatty‐appearing stools 13. Flatulence (passage of gas) 14. Flatus with discharge 15. Frequent urge for bowel movement 16. Hiccups 17. Increased frequency of bowel movements 18. Nausea 19. Oily spotting 20. Rectal bleeding ‐ haemorrhoids 21. Soft or deliquescent stools 22. Stomach pain or cramps 23. Stools almost all liquid with very few solid parts 24. Stools hard and in the shape of small pellets 25. Stools mixed with fat or with a separate oily layer 26. Uncontrolled passage of stool or oil 27. Urgent, but controlled, need to produce stools 28. Vomiting 29. Dizziness 30. Epistaxis 31. Feeling cold 32. Headache 33. Increased sweating 34. Increased thirst 35. Sinusitis, postnasal drip or nasal stuffiness 36. Unusual tiredness or weakness (fatigue) 37. Pharyngitis 38. Sinusitis, postnasal drip or nasal stuffiness 39. Decrease in appetite 40. Muscle pain, stiffness, cramps, or ache 41. Migraine headaches 42. Mental depression 43. Dysuria or UTI 44. Nocturia 45. Asthma symptoms 46. Cough 47. Upper respiratory infection 48. Skin rash | 1. 1 2. 1 3. 7 4. 9 5. 21 6. 5 7. 2 8. 7 9. 11 10. 22 11. 8 12. 6 13. 47 14. 11 15. 3 16. 3 17. 45 18. 9 19. 0 20. 2 21. 42 22. 9 23. 34 24. 10 25. 18 26. 11 27. 18 28. 7 29. 4 30. 2 31.2 32. 17 33. 4 34. 4 35. 5 36. 5 37. 12 38. 3 39. 9 40. 12 41. 0 42. 3 43. 5 44. 3 45. 3 46. 7 47. 17 48. 2 | 1. 1 2. 1 3. 7 4. 9 5. 21 6. 5 7. 2 8. 7 9. 11 10. 22 11. 8 12. 6 13. 47 14. 11 15. 3 16. 3 17. 45 18. 9 19. 0 20. 2 21. 42 22. 9 23. 34 24. 10 25. 18 26. 11 27. 18 28. 7 29. 4 30. 2 31.2 32. 17 33. 4 34. 4 35. 5 36. 5 37. 12 38. 3 39. 9 40. 12 41. 0 42. 3 43. 5 44. 3 45. 3 46. 7 47. 17 48. 2 | |
| Ozkan 2004 | I: conventional treatment + orlistat | 22 | 1. Frequent stools 2. Soiling, frequent defecation 3. Mild hair loss 4. Reported muscle cramps | 1. 22 2. 5 3. 1 4. 1 | 1. 100 2. 22.7 3. 4.5 4. 4.5 |
| C: conventional treatment | 20 | ‐ | ‐ | ‐ | |
| Prado 2012 | I: metformin + nutritional guide and exercise programme | 10 | 1. Increase levels of ALT 2. Increase levels of AST 3. Reduction in haemoglobin | ‐ | ‐ |
| C: placebo + nutritional guide and exercise programme | 9 | 1. Increase levels of ALT 2. Increase levels of AST 3. Reduction in haemoglobin | ‐ | ‐ | |
| Rezvanian 2010 | I1: metformin + healthy eating and physical activity advice | 45 | 1. Headache 2. Abdominal pain 3. Loose stool | 1. 2 2. 2 3. 3 | 1. 4.4 2. 4.4 3. 6.6 |
| I2: fluoxetine + healthy eating and physical activity advice | 45 | 1. Dry mouth 2. Loose stool | 1. 3 2. 2 | 1. 6.6 2. 4.4 | |
| I3: metformin and fluoxetine + healthy eating and physical activity advice | 45 | ‐ | ‐ | ‐ | |
| C: placebo + healthy eating and physical activity advice | 45 | ‐ | ‐ | ‐ | |
| Srinivasan 2006 | I: metformin first then placebo + "standardised information on healthy eating and exercise" | 13 | ‐ | ‐ | ‐ |
| C: placebo first then metformin + "standardised information on healthy eating and exercise" | 15 | ‐ | ‐ | ‐ | |
| Van Mil 2007 | I: sibutramine + energy‐restricted diet and exercise plan | 12 | 1. Clinical depression 2. Flu syndrome 3. Headache 4. Abdominal complaints 5. Agitation 6. Increased appetite 7. Rash 8. Dizziness 9. Dysmenorrhoea 10. Joint problem 11. Heart rate > 100 bpm on 2 occasions 12. DBP > 85 mmHg on 2 occasions | 1. 1 2. 6 3. 2 4. 7 5. 3 6. 4 7. 2 8. 3 9. 3 10. 2 11. 4 12. 1 | 1. 8.3 2. 50 3. 16.6 4. 58.3 5. 25 6. 33.3 7. 16.6 8. 25 9. 25 10. 16.6 11. 33.3 12. 8.3 |
| C: placebo + energy‐restricted diet and exercise plan | 12 | 1. Flu syndrome 2. Headache 3. Agitation 4. Increased appetite 5. Dizziness 6. Joint problem 7. DBP > 85 mmHg on 2 occasions | 1. 6 2. 3 3. 1 4. 2 5. 1 6. 2 7. 1 | 1. 50 2. 25 3. 8.3 4. 16.6 5. 8.3 6. 16.6 7. 8.3 | |
| Wiegand 2010 | I: metformin + multiprofessional lifestyle intervention | 36 | 1. Gastrointestinal symptoms 2. Unspecific (e.g. weakness or fatigue) | 1. 5 2. 3 | 1. 13.9 2. 8.3 |
| C: placebo + multiprofessional lifestyle intervention | 34 | 1. Gastrointestinal symptoms 2. Unspecific (e.g. weakness or fatigue) | 1. 9 2. 4 | 1. 26.5 2. 11.8 | |
| Wilson 2010 | I: metformin + lifestyle intervention | 38 | 1. Headache 2. Nausea 3. Vomiting 4. Upper respiratory tract infection 5. Musculoskeletal complaints 6. Elevated ALT levels 7. Appendectomy 8. Leg vein thrombosis | 1. 18 2. 9 3. 6 4. 18 5. 5 6. 2 7. 1 8. 1 | 1. 47 2. 24 3. 16 4. 47 5. 13 6. 5 7. 3 8. 3 |
| C: placebo + lifestyle intervention | 38 | 1. Headache 2. Nausea 3. Vomiting 4. Upper respiratory tract infection 5. Musculoskeletal complaints 6. Elevated ALT levels | 1. 13 2. 3 3. 1 4. 23 5. 7 6. 1 | 1. 34 2. 8 3. 3 4. 61 5. 18 6. 3 | |
| Yanovski 2011 | I: metformin + dietitian‐administered weight‐reduction programme | 53 | 1. Liquid or loose stools 2. Vomiting 3. Fatigue 4. Lost interest in usual pleasurable activities | 1. 22 2. 22 3. 20 4. 1 | 1. 41.5 2. 41.5 3. 37.7 4. 1.9 |
| C: placebo + dietitian‐administered weight‐reduction programme | 47 | 1. Liquid or loose stools 2. Vomiting 3. Fatigue | 1. 8 2. 10 3. 7 | 1. 17 2. 21.3 3. 14.9 | |
| *Berkowitz 2003: these adverse events occurred during the open‐label phase where all participants received sibutramine ALT: alanine transaminase; AST: aspartate transaminase; bpm: beats per minute; DBP: diastolic blood pressure; n: number of participants; UTI: urinary tract infection | |||||
Appendix 12. Survey of authors providing information on included trials
| Trial | Date trial author contacted | Date trial author replied | Date trial author was asked for additional information | Date trial author provided data |
| Atabek 2008 | 24 January 2014 15 May 2014 | No | 24 January 2014 ‐ asked for additional unpublished data and other ongoing trials 15 May 2014 ‐ asked for further details about the trial including funding, allocation concealment, randomisation method, dropout rates and adverse events | N/A |
| Berkowitz 2003 | 20 January 2014 15 May 2014 | No | 20 January 2014 ‐ asked for additional unpublished data and other ongoing trials 15 May 2014 ‐ asked for further details about the trial including randomisation method, allocation concealment and adverse events | N/A |
| Berkowitz 2006 | 20 January 2014 15 May 2014 | No | 20 January 2014 ‐ asked for additional unpublished data and other ongoing trials 15 May 2014 ‐ asked for further details on the trial's adverse events | N/A |
| Chanoine 2005 | 20 January 2014 25 March 2014 15 May 2014 | 20 January 2014 25 March 2014 15 May 2014 03/06/2014 | 20 January 2014 ‐ asked for additional unpublished data and other ongoing trials 25 March 2014 ‐ asked for raw BMI and SD values at 6 months' follow‐up 15 May 2014 ‐ asked for further details about the trial including blinding and adverse events | 20 January 2014 ‐ author replied with confirmation the data of the trial was correct and attached an addition paper for the trial 25 March 2014 ‐ author provided the raw data at 6 months 15 May 2014 ‐ provided further details on blinding 3 June 2014 ‐ gave additional results on adverse events |
| Clarson 2009 | 24 January 2014 15 May 2014 | 31 January 2014 19 May 2014 | 24 January 2014 ‐ asked for additional unpublished data and other ongoing trials 15 May 2014 ‐ asked for further details about the trial including allocation concealment, blinding and adverse events | 31 January 2014 ‐ author confirmed there was no further data for the trial and provided a protocol for an ongoing trial 19 May 2014 ‐ author provided further details about the trial |
| Franco 2014 | 24 February 2015 | 9 March 2015 | 24 February 2015 | 9 March 2015 ‐ authors replied with further details on the trial such as funding source, randomisation method and blinding |
| Freemark 2001 | 20 January 2014 25 March 2014 15 May 2014 | 16 May 2014 | 20 January 2014 ‐ asked for additional unpublished data and other ongoing trials 25 March 2014 ‐ asked for BMI raw data and associated SDs 15 May 2014 ‐ asked for further details about the trial including allocation concealment, blinding and adverse events | 16 May 2014 ‐ author provided further details about the trial |
| Garcia‐Morales 2006 | 21 January 2014 15 May 2014 | No | 21 January 2014 ‐ asked for additional unpublished data and other ongoing trials 15 May 2014 ‐ asked for further details about the trial including the run‐in period, blinding and adverse events | N/A |
| Godoy‐Matos 2005 | 20 January 2014 15 April 2014 | 17 May 2014 | 20 January 2014 ‐ asked for additional unpublished data and other ongoing trials 15 April 2014 ‐ asked for further details about the trial including allocation concealment, randomisation method, blinding and adverse events | 17 May 2014 ‐ author provided further details about the trial |
| Kendall 2013 | 24 January 2014 15 May 2014 | 29 January 2014 | 24 January 2014 ‐ asked for additional unpublished data and other ongoing trials 15 May 2014 ‐ asked for further details about the trial including blinding and adverse events | 29 January 2014 ‐ author confirmed no additional data were available for the trial Author did not reply to the follow‐up email (15 May 2014) |
| Maahs 2006 | 20 January 2014 09 May 2014 15 May 2014 | 20 January 2014 09 May 2014 15 May 2014 | 20 January 2014 ‐ asked for additional unpublished data and other ongoing trials 09 May 2014 ‐ asked to confirmed if the data presented were SDs or SEs 15 May 2014 ‐ asked for further details on the trial's adverse events | 20 January 2014 ‐ author confirmed no further data were available for the trial 09 May 2014 ‐ author confirmed the data were SDs 15 May 2014 ‐ author could not provide further information on the adverse events |
| Mauras 2012 | 24 January 2014 15 May 2014 16 May 2014 | 15 May 2014 27 May 2014 | 24 January 2014 ‐ asked for additional unpublished data and other ongoing trials 15 May 2014 ‐ asked for further details on the trial including allocation concealment, randomisation method, number of trial centres, blinding and adverse events 16 May 2014 ‐ asked for further information on adverse events | 15 May 2014 ‐ author provided further details on the trial 27 May 2014 ‐ author said she would try to obtain the data; however, we received no further emails |
| NCT00001723 | 30 October 2015 | 30 October 2015 | 30 October 2015 ‐ asked for further details on the trial: blinding, allocation concealment, randomisation process, funding, publications and lifestyle programme | 30 October 2015 ‐ author replied and gave further details |
| Ozkan 2004 | No ‐ was unable to send emails to the address given in the publication | N/A | N/A | N/A |
| Prado 2012 | 17 January 2014 24 January 2014 15 May 2014 | 28 January 2014 18 May 2014 | 17 January 2014 ‐ asked for raw BMI data 24 January 2014 ‐ asked for additional unpublished data and other ongoing trials 15 May 2014 ‐ asked for further details on the trial including blinding, allocation concealment and adverse events | 28 January 2014 ‐ author was unable to provide any unpublished data 18 May 2014 ‐ author provided further information about the trial |
| Rezvanian 2010 | 24 January 2014 15 May 2014 | 24 January 2014 15 May 2014 | 24 January 2014 ‐ asked for additional unpublished data and other ongoing trials 15 May 2014 ‐ asked for further details on the trial including allocation concealment and adverse events | 24 January 2014 ‐ author confirmed there were no further details to give on the trial and provided references to other potentially relevant trials 15 May 2014 ‐ author provided further details about the trial |
| Srinivasan 2006 | 20 January 2014 15 May 2014 | 15 May 2014 | 20 January 2014 ‐ asked for additional unpublished data and other ongoing trials 15 May 2014 ‐ asked for further details on the trial including allocation concealment and adverse events | 15 May 2014 ‐ author provided further details about the trial |
| Van Mil 2007 | 20 January 2014 15 May 2014 | 20 January 2014 30 May 2014 | 20 January 2014 ‐ asked for additional unpublished data and other ongoing trials 15 May 2014 ‐ asked for further details on the trial including randomisation, blinding and adverse events | 20 January 2014 ‐ author confirmed findings were correct and highlighted the main finding of their trial 30 May 2014 ‐ author provided further details about the trial |
| Wiegand 2010 | 24 January 2014 15/04/2014 | 27 January 2014 | 24 January 2014 ‐ asked for additional unpublished data and other ongoing trials 15 May 2014 ‐ asked for further details on the trial including allocation concealment, randomisation, blinding and adverse events | 27 January 2014 ‐ author confirmed there was no further data available for the trial Author did not reply to the follow‐up email |
| Wilson 2010 | 24 January 2014 15 May 2014 | 24 January 2014 15 May 2014 | 24 January 2014 ‐ asked for additional unpublished data and other ongoing trials 15 May 2014 ‐ asked for further details on the trial including dropouts and adverse events | 24 January 2014 ‐ author confirmed there was no unpublished data on the main outcomes of the trial 15 May 2014 ‐ author said he would try to obtain the data; however, I did not receive any further emails |
| Yanovski 2011 | 24 January 2014 15 May 2014 | 24 January 2014 | 24 January 2014 ‐ asked for additional unpublished data and other ongoing trials 15 May 2014 ‐ asked for further details on the trial's adverse events | 24 January 2014 ‐ author confirmed the trial was over and there is no further information available Author did not reply to the follow‐up email |
| BMI: body mass index; N/A: not applicable; SD: standard deviation; SE: standard error. | ||||
Appendix 13. Checklist to aid consistency and reproducibility of GRADE assessments
| Questions | BMI | Weight | Adverse events | Health‐related quality of life | All‐cause mortality | Morbidity | Socioeconomic effects | |
| Trial limitations | 1. Was random sequence generation used (i.e. no potential for selection bias)? | Yes | Yes | Yes / Yes | N/A | N/A | N/A | N/A |
| 2. Was allocation concealment used (i.e. no potential for selection bias)? | Yes | Yes | Yes / Yes | |||||
| 3. Was there blinding of participants and personnel (i.e. no potential for performance bias)? | Yes | Yes | Yes / Yes | |||||
| 4. Was there blinding of outcome assessment (i.e. no potential for detection bias)? | Yes | Yes | Yes / Yes | |||||
| 5. Was an objective outcome used? | Yes | Yes | Yes / Yes | |||||
| 6. Were more than 80% of participants enrolled in trials included in the analysis (i.e. no potential reporting bias)?e | Yes | Yes | Yes / No (↓) | |||||
| 7. Were data reported consistently for the outcome of interest (i.e. no potential selective reporting)? | Yes | Yes | No (↓) / No (↓) | |||||
| 8. No other biases reported (i.e. no potential of other bias)? | No (↓) | No (↓) | Unclear / Unclear | |||||
| 9. Did the trials end up as scheduled (i.e. not stopped early)? | Yes | Yes | Yes / Yes | |||||
| Inconsistencyb | 1. Point estimates did not vary widely? | Yes | Yes | Yes / Yes | ||||
| 2. To what extent did confidence intervals overlap (substantial: all confidence intervals overlap at least one of the included studies point estimate; some: confidence intervals overlap but not all overlap at least one point estimate; no: at least one outlier: where the confidence interval of some of the studies do not overlap with those of most included studies)? | Some | Some | Substantial / Substantial | |||||
| 3. Was the direction of effect consistent? | No (↓) | No (↓) | No (↓) / No (↓) | |||||
| 4. What was the magnitude of statistical heterogeneity (as measured by I2) ‐ low (I2 < 40%), moderate (I2 = 40% to 60%), high (I2 > 60%)? | High (↓) | High (↓) | Low / Low | |||||
| 5. Was the test for heterogeneity statistically significant (P < 0.1)? | Statistically significant (↓) | Statistically significant (↓) | Not statistically significant / Not statistically significant | |||||
| Indirectnessa | 1. Were the populations in included studies applicable to the decision context? | Applicable | Applicable | Applicable / Applicable | ||||
| 2. Were the interventions in the included studies applicable to the decision context? | Applicable | Applicable | Applicable / Applicable | |||||
| 3. Was the included outcome not a surrogate outcome? | Yes | Yes | Yes / Yes | |||||
| 4. Was the outcome time frame sufficient? | Sufficient | Sufficient | Sufficient / Sufficient | |||||
| 5. Were the conclusions based on direct comparisons? | Yes | Yes | Yes / Yes | |||||
| Imprecisionc | 1. Was the confidence interval for the pooled estimate not consistent with benefit and harm? | Yes | Yes | No (↓) / No (↓) | ||||
| 2. What is the magnitude of the median sample size (high: > 300 participants, intermediate: 100 to 300 participants, low: < 100 participants)?e | Low (↓) | Low (↓) | Intermediate / Low (↓) | |||||
| 3. What was the magnitude of the number of included studies (large: > 10 studies, moderate: 5 to 10 studies, small: < 5 studies)?e | Large | Large | Moderate / Moderate | |||||
| 4. Was the outcome a common event (e.g. occurs more than 1/100)? | N/A | N/A | Yes / Yes | |||||
| Publication biasd | 1. Was a comprehensive search conducted? | Yes | Yes | Yes / Yes | ||||
| 2. Was grey literature searched? | No (↓) | No (↓) | No (↓) / No (↓) | |||||
| 3. Were no restrictions applied to study selection on the basis of language? | Yes | Yes | Yes / Yes | |||||
| 4. There was no industry influence on studies included in the review? | No (↓) | No (↓) | No (↓) / No (↓) | |||||
| 5. There was no evidence of funnel plot asymmetry? | No (↓) | No (↓) | Unclear / Unclear | |||||
| 6. There was no discrepancy in findings between published and unpublished trials? | Unclear | Unclear | Unclear / Unclear | |||||
| aQuestions on risk of bias are answered in relation to most of the aggregated evidence in the meta‐analysis rather than to individual studies. cWhen judging the width of the confidence interval it is recommended to use a clinical decision threshold to assess whether the imprecision is clinically meaningful. (↓): key item for potential downgrading the certainty of the evidence (GRADE) as shown in the footnotes of the 'Summary of finding' table. BMI: body mass index; N/A: not applicable. | ||||||||
Appendix 14. Health‐related quality of life: instruments
| Instrument |
| Short‐Form health survey (SF‐36, generic questionnaire) ‐ employed in García‐Morales 2006. |
| Brief Symptom Inventory (BSI, generic questionnaire), parent and children's KINDL (generic questionnaire), Impact of Weight on Quality of Life ‐ Kids (IWQOL‐Kids, specific questionnaire) and global ratings scale ‐ all employed in Maahs 2006. |

Trial flow diagram.

Risk of bias graph: review authors' judgements about each risk of bias item presented as percentages across all included trials.

Risk of bias summary: review authors' judgements about each risk of bias item for each included trial.

Funnel plot of comparison: 1 Body mass index (BMI): pharmacological interventions versus comparators, outcome: 1.1 Change in BMI (all trials) (kg/m2).
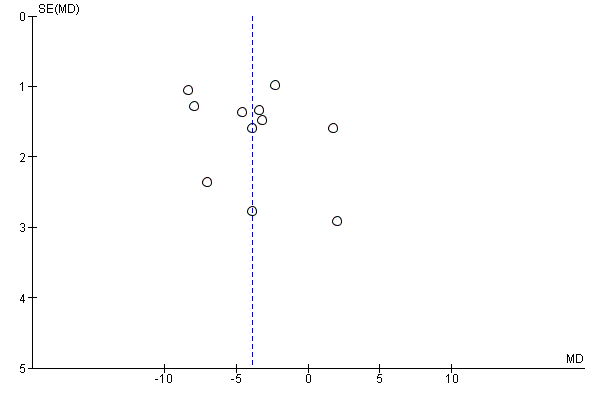
Funnel plot of comparison: 2 Weight: pharmacological interventions versus comparators, outcome: 2.1 Change in weight (all trials) (kg).

Comparison 1 Body mass index (BMI): pharmacological interventions versus comparators, Outcome 1 Change in BMI (all trials).

Comparison 1 Body mass index (BMI): pharmacological interventions versus comparators, Outcome 2 Change in BMI (drug type).

Comparison 1 Body mass index (BMI): pharmacological interventions versus comparators, Outcome 3 Change in BMI (dropout rate).

Comparison 1 Body mass index (BMI): pharmacological interventions versus comparators, Outcome 4 Change in BMI (intention‐to‐treat (ITT) analysis).

Comparison 1 Body mass index (BMI): pharmacological interventions versus comparators, Outcome 5 Change in BMI (funding).

Comparison 1 Body mass index (BMI): pharmacological interventions versus comparators, Outcome 6 Change in BMI (publication date).
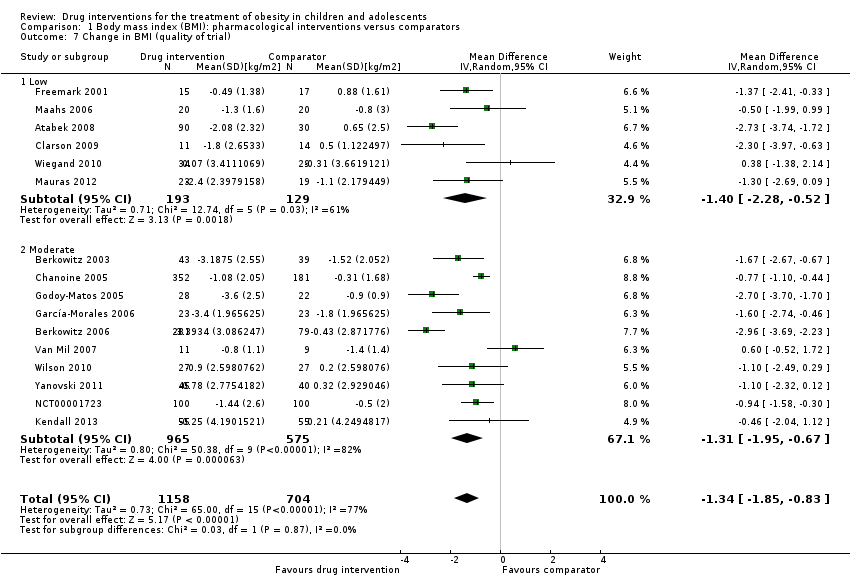
Comparison 1 Body mass index (BMI): pharmacological interventions versus comparators, Outcome 7 Change in BMI (quality of trial).
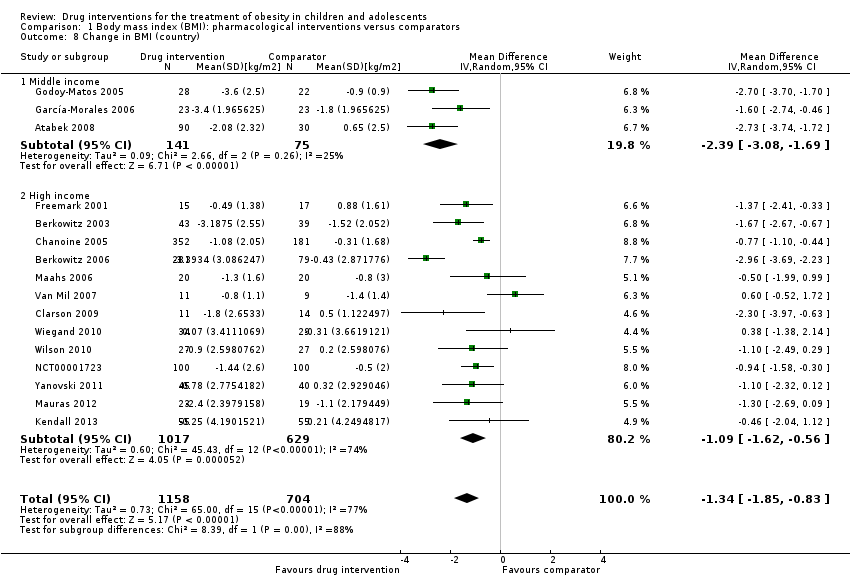
Comparison 1 Body mass index (BMI): pharmacological interventions versus comparators, Outcome 8 Change in BMI (country).

Comparison 1 Body mass index (BMI): pharmacological interventions versus comparators, Outcome 9 Change in BMI (mean age).
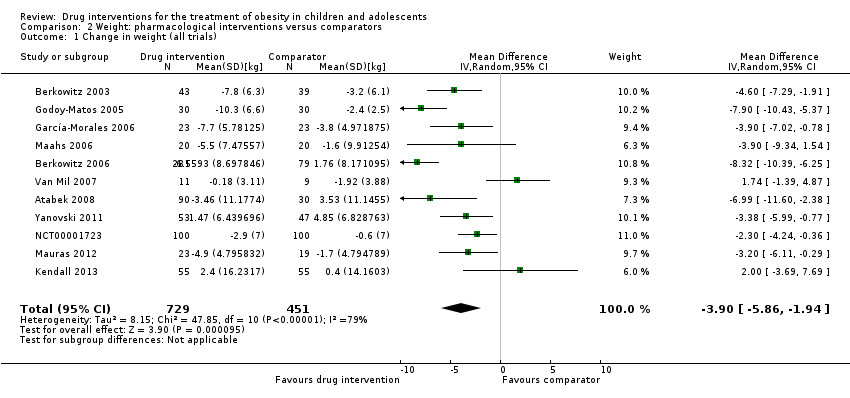
Comparison 2 Weight: pharmacological interventions versus comparators, Outcome 1 Change in weight (all trials).
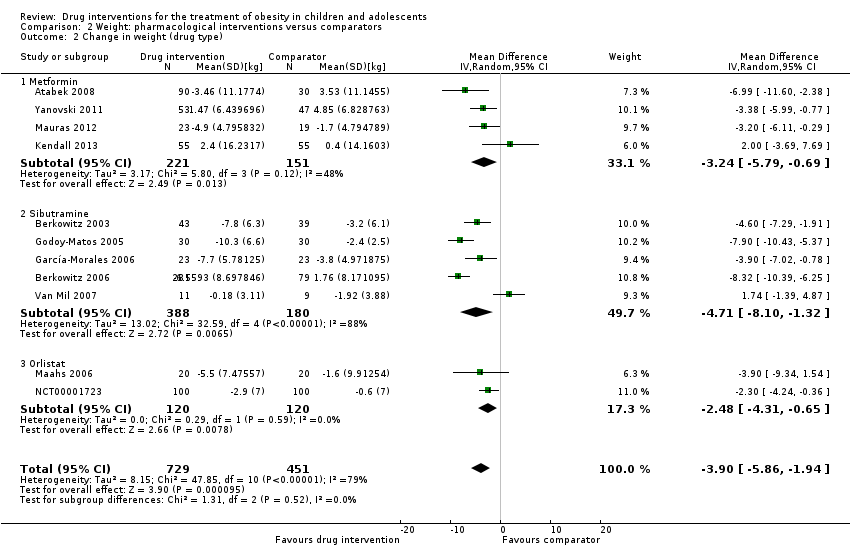
Comparison 2 Weight: pharmacological interventions versus comparators, Outcome 2 Change in weight (drug type).

Comparison 3 Adverse effects: pharmacological interventions versus comparator, Outcome 1 Serious adverse events.
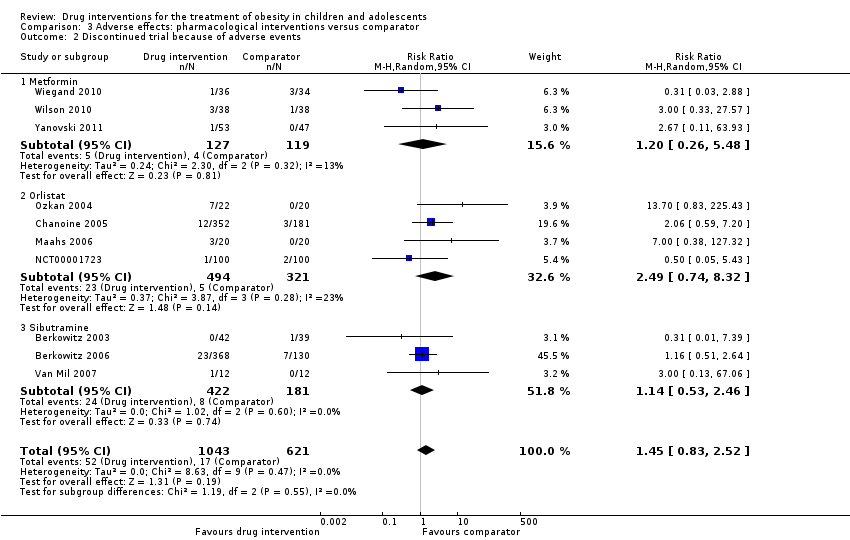
Comparison 3 Adverse effects: pharmacological interventions versus comparator, Outcome 2 Discontinued trial because of adverse events.
| Drug interventions for the treatment of obesity in children and adolescents | ||||||
| Population: obese children and adolescents Settings: mainly outpatient settings Intervention: metformin, orlistat, sibutramine usually combined with behaviour changing interventions Comparison: placebo or no placebo usually with behaviour changing interventions | ||||||
| Outcomes | Illustrative comparative risks* (95% CI) | Relative effect | No of participants | Quality of the evidence | Comments | |
| Assumed risk | Corresponding risk | |||||
| Comparator | Pharmacological intervention | |||||
| a. BMI (kg/m2) b. Body weight (kg) Follow‐up: 6 months (10 trials) ‐ 12 months (1 trial) | a. The mean reduction in BMI ranged across control groups from ‐1.8 to +0.9 b. The mean reduction in weight ranged across control groups from ‐3.8 kg to +4.9 kg | a. The mean reduction in BMI in the intervention groups was ‐1.3 higher (‐1.9 to ‐0.8 higher) b. The mean reduction in weight in the intervention groups was ‐3.9 kg higher (‐5.9 kg to ‐1.9 kg higher) | ‐ | a. 1884 (16) b. 1180 (11) | a. ⊕⊕⊝⊝ b. ⊕⊕⊝⊝ | ‐ |
| Adverse events a. Serious adverse events b. Discontinuation of trial because of adverse events Follow‐up: mostly 6 months, maximum 100 weeks (1 trial) | a. 17 per 1000 b. 27 per 1000 | a. 24 per 1000 (11 to 55) b. 40 per 1000 (23 to 69) | a.RR 1.43 (0.63 to 3.25) b.RR 1.45 (0.83 to 2.52) | a. 1347 (5) b. 1664 (10) | a. ⊕⊕⊕⊝ L owb b. ⊕⊕⊕⊝ Lowb | All trials reported if adverse events occurred; however, only 7/20 trials reported the number of participants who experienced at least 1 adverse event |
| Health‐related quality of life 3 questionnaires (1 trial) and SF‐36 (1 trial) Follow‐up: 6 months | See comment | See comment | See comment | 86 (2) | ⊕⊝⊝⊝ V ery lowc | Results were only reported for SF‐36 (1 trial on sibutramine, 46 children), there were no marked differences between intervention and comparator groups |
| All‐cause mortality Follow‐up: mostly 6 months, maximum 100 weeks (1 trial) | See comment | See comment | See comment | 2176 (20) | ⊕⊕⊕⊝ L owd | 1 suicide in the orlistat intervention group |
| Morbidity | See comment | See comment | See comment | 533 (1) | ⊕⊝⊝⊝ V ery lowe | Only 1 trial investigated morbidity defined as illness or harm associated with the intervention (Chanoine 2005). In the orlistat group 6/352 (1.7%) participants developed new gallstones compared with 1/181 (0.6%) in the placebo group |
| Socioeconomic effects | See comment | See comment | See comment | See comment | See comment | Not reported |
| *The basis for the assumed risk (e.g. the median control group risk across trials) is provided in footnotes. The corresponding risk (and its 95% confidence interval) is based on the assumed risk in the comparison group and the relative effect of the intervention (and its 95% CI). | ||||||
| GRADE Working Group grades of evidence | ||||||
| *Assumed risk was derived from the event rates in the comparator groups. aDowngraded by two levels because of potential other risk of bias, inconsistency and imprecision (see Appendix 13). | ||||||
| Trial | Intervention(s) and comparator(s) | Description of power and sample size calculation | Screened/eligible | Randomised | Safety | ITT | Finishing trial | Randomised finishing trial | Follow‐up timea |
| Atabek 2008b | I: metformin + diet and physical activity advice | ‐ | ‐ | 90 | 90 | ‐ | 90 | 100 | 6 months |
| C: placebo + diet and physical activity advice | 30 | 30 | ‐ | 30 | 100 | ||||
| total: | 120 | 120 | ‐ | 120 | 100 | ||||
| Berkowitz 2003 | I: behavioural programme + sibutramine | Powered to detect a 4% difference in % change in BMI between the 2 treatment groups with an SD of 5% (α = 0.05, β = 93%)c | 146 | 43 | 43 | 43 | 40 | 93.0 | 6 months (not including the 6‐month open‐label period where all participants received sibutramine) |
| C: behavioural programme + placebo | 39 | 39 | 39 | 34 | 87.2 | ||||
| total: | 82 | 82 | 82 | 62 | 75.6 | ||||
| Berkowitz 2006 | I: behavioural programme + sibutramine | "Planned sample size was approximately 400 participants with a 3:1 randomization ratio of sibutramine to placebo. On the basis of previous 12‐month adult trials, we determined that 300 participants in the sibutramine group would be adequate to assess safety and exposure, allowing an overall dropout rate of approximately 50% and a probability that approximately 50% of participants receiving 10 mg of sibutramine would lose 10% or more of initial BMI at 6 months" "Although the protocol did not document a formal sample size calculation for efficacy, approximately 132 adolescents (99 in the sibutramine group and 33 in the placebo group) would allow a between‐group difference in BMI of 2 kg/m2, with 90% power (2‐sided level of 0.05) to be statistically significant, assuming a common SD of 3 kg/m2)"d | ‐ | 368 | 368 | ‐ | 281 | 76.4 | 12 months |
| C: behavioural programme + placebo | 130 | 130 | ‐ | 80 | 61.5 | ||||
| total: | 498 | 498 | ‐ | 361 | 72.5 | ||||
| Chanoine 2005 | I: orlistat + diet + exercise + behaviour therapy | "We planned to enroll at least 450 individuals to provide more than 80% power to detect a difference of 1 BMI unit, assuming a 30% dropout rate" | 588 | 357 | 352 | 348 | 232 | 65.0 | 54 weeks |
| C: placebo + diet + exercise + behaviour therapy | 182 | 181 | 180 | 117 | 64.3 | ||||
| total: | 539 | 533 | 528 | 349 | 64.7 | ||||
| Clarson 2009 | I: metformin + lifestyle intervention | ‐ | 65 | 14 | ‐ | ‐ | 11 | 78.6 | 6 months |
| C: lifestyle intervention only | 17 | ‐ | ‐ | 14 | 82.4 | ||||
| total: | 31 | ‐ | ‐ | 25 | 80.6 | ||||
| Franco 2014 (cross‐over trial) | I: sibutramine + dietary guidance | ‐ | 73 | ‐ | ‐ | ‐ | ‐ | ‐ | 13 months |
| C: placebo + dietary guidance | ‐ | ‐ | ‐ | ‐ | ‐ | ||||
| total: | 63 | 63 | ‐ | 23 | 36.5 | ||||
| Freemark 2001 | I: metformin | ‐ | ‐ | 15 | ‐ | ‐ | 14 | 93.3 | 6 months |
| C: placebo | 17 | ‐ | ‐ | 15 | 88.2 | ||||
| total: | 32 | ‐ | ‐ | 29 | 90.6 | ||||
| Garcia‐Morales 2006 | I: sibutramine + diet + exercise | 13 participants per group (expectations: mean loss of 7.5 kg (SD 5.3) in the sibutramine group vs 3.6 kg (SD 4.5) in the placebo group)e | 70 | 26 | 26 | 23 | 21 | 80.8 | 6 months |
| C: placebo + diet + exercise | 25 | 25 | 23 | 19 | 76.0 | ||||
| total: | 51 | 51 | 46 | 40 | 78.4 | ||||
| Godoy‐Matos 2005 | I: sibutramine + hypocaloric diet + exercise | ‐ | ‐ | 30 | 30 | 30 | 28 | 93.3 | 24 weeks |
| C: placebo + hypocaloric diet + exercise | 30 | 30 | 30 | 22 | 73.3 | ||||
| total: | 60 | 60 | 60 | 50 | 83.3 | ||||
| Kendall 2013 | I: metformin + healthy lifestyle advice | "The target recruitment was 140 patients, based on a power calculation using the results of a previous study. A standard power calculation was used to detect a reduction in BMI of 0.15 kg/m2 (SD 0.3). Sixty‐four participants in each group give a statistical power of 80% for a t test at the 5% significance level. This was rounded up to allow for some loss to follow‐up but recognizing that adjustment using multifactorial analysis would likely enhance the trial power by an unpredictable amount"f | 234 | ‐ | 74 | 74 | 55 | ‐ | 6 months |
| C: placebo + healthy lifestyle advice | ‐ | 77 | 77 | 55 | ‐ | ||||
| total: | 155 | 151 | 151 | 110 | 71.0 | ||||
| Maahs 2006 | I: orlistat + diet and exercise therapy | "We determined that a clinically important mean difference in decrease in BMI between the orlistat and placebo groups would be 2.0 kg/m2 at 6 months and used an SD of 1.8. On the basis of this approach, a sample size of 15 subjects per group would be adequate to detect a 2.0 kg/m2 difference in Student’s t test with 80% power and alpha = 0.05. In order to allow for a 25% dropout rate, 20 subjects were randomized to each group"g | 43 | 20 | ‐ | 20 | 18 | 90.0 | 6 months |
| C: placebo + diet and exercise therapy | 20 | ‐ | 20 | 16 | 80.0 | ||||
| total: | 40 | ‐ | 40 | 34 | 85.0 | ||||
| Mauras 2012 | I: metformin + diet/exercise intervention | "Differences in hsCRP and fibrinogen concentrations at 6 months were the primary outcomes. An n = 42 completed subjects provided > 90 % power to detect significant changes" | ‐ | 35 | 35 | ‐ | 23 | 65.7 | 6 months |
| C: diet/exercise intervention | 31 | 31 | ‐ | 19 | 61.3 | ||||
| total: | 66 | 66 | ‐ | 42 | 63.6 | ||||
| NCT00001723 | I: orlistat + behavioural weight loss programme | ‐ | ‐ | 100 | 100 | 100 | 87 | 87.0 | 6 months |
| C: placebo + behavioural weight loss programme | 100 | 100 | 100 | 84 | 84.0 | ||||
| 200 | 100 | 100 | 171 | 85.5 | |||||
| Ozkan 2004 | I: conventional treatment (nutritional and lifestyle modification programmes) + orlistat | ‐ | ‐ | 22 | ‐ | ‐ | 15 | 68.2 | 5 to 15 months |
| C: conventional treatment: nutritional and lifestyle modification programmes | 20 | ‐ | ‐ | 15 | 75.0 | ||||
| total: | 42 | ‐ | ‐ | 30 | 71.4 | ||||
| Prado 2012 | I: metformin + nutritional guide and exercise programme | 8 participants were required per intervention group (SD 0.4; difference of 0.6, P < 0.05, power = 90%) | 41/26 | ‐ | 9 | ‐ | 7 | ‐ | 6 months |
| C: placebo + nutritional guide and exercise programme | ‐ | 10 | ‐ | 6 | ‐ | ||||
| total: | 26 | 19 | ‐ | 13 | 50 | ||||
| Rezvanian 2010 | I1: metformin + diet and physical activity advice | "By considering alpha = 0.05 and a power level of 0.8, the sample size was calculated as 160, and by considering the attrition during the follow‐up, we increased it to 180" | 180 | 45 | ‐ | ‐ | 41 | 91.1 | 24 weeks |
| I2: fluoxetine + diet and physical activity advice | 45 | ‐ | ‐ | 40 | 88.9 | ||||
| I3: metformin and fluoxetine + diet and physical activity advice | 45 | ‐ | ‐ | 41 | 91.1 | ||||
| C: placebo + diet and physical activity advice | 45 | ‐ | ‐ | 42 | 93.3 | ||||
| total: | 180 | ‐ | ‐ | 164 | 91.1 | ||||
| Srinivasan 2006 (cross‐over trial) | I: metformin + "standardised information on healthy eating and exercise" | ‐ | 34 | ‐ | ‐ | ‐ | ‐ | ‐ | 12 months |
| C: placebo + "standardised information on healthy eating and exercise" | ‐ | ‐ | ‐ | ‐ | ‐ | ||||
| total: | 28 | ‐ | ‐ | 22 | 78.6 | ||||
| Van Mil 2007 | I: sibutramine + energy‐restricted diet and exercise plan | "The number of patients required per treatment group to detect a difference between treatment groups in mean change in BMI at endpoint intervention of 1.0 kg/m2, based on an estimate of variance (sd) of 0.65, an overall significance level of 5%, and a power of 90%, was nine. Allowing a drop‐out rate of 25%, the number of patients needed in each group was 12"h | ‐ | 12 | 12 | 12 | 11 | 91.7 | 24 weeks |
| C: placebo + energy‐restricted diet and exercise plan | 12 | 12 | 12 | 9 | 75.0 | ||||
| total: | 24 | 24 | 24 | 20 | 83.3 | ||||
| Wiegand 2010 | I: metformin + lifestyle intervention | "Since a clinically significant effect was defined as a decrease in HOMA‐IR by ‐1, two groups of 37 patients had to be included in the study to achieve a power of 0.9 with a α value of 0.05" | 278 | 36 | ‐ | ‐ | 34 | 94.4 | 6 months |
| C: placebo + lifestyle intervention | 34 | ‐ | ‐ | 29 | 85.3 | ||||
| total: | 70 | ‐ | ‐ | 63 | 90 | ||||
| Wilson 2010 | I: metformin + lifestyle intervention | "Assuming an SD of 1.9 for BMI change, an enrolled sample of 72 provided 80% power to detect a differential of 1.46 between treatment arms or between sexes and 1.75 between white subjects and others"i | 92 | 39 | 39 | 39 | 19 | 48.7 | 100 weeks |
| C: placebo + lifestyle intervention | 38 | 38 | 38 | 19 | 50.0 | ||||
| total: | 77 | 76 | 76 | 38 | 49.4 | ||||
| Yanovski 2011 | I: metformin + dietitian‐administered weight‐reduction programme | "A total sample size of 60 participants would detect a between‐group difference of 0.09 BMI SD score units (approximately equivalent to a 2 kg/m2 difference) with 80% power. Participant accrual was set at 100 participants to allow as much as 40% loss to follow‐up"j | 278 | 53 | ‐ | 53 | 45 | 84.9 | 6 months (not including the 6‐month open‐label phase) |
| C: placebo + dietitian‐administered weight‐reduction programme | 47 | ‐ | 47 | 40 | 85.1 | ||||
| total: | 100 | ‐ | 100 | 85 | 85.0 | ||||
| Grand total | All interventionsk | 1395 | 1153 | ||||||
| All comparatorsk | 817 | 665 | |||||||
| All interventions and comparatorsk | 2484 | 1851 | |||||||
| aDuration of intervention and follow‐up under randomised conditions until end of trial. "‐" denotes not reported. BMI: body mass index; C: comparator; hsCRP: high sensitivity C‐reactive protein; HOMA‐IR: homeostasis model assessment for insulin resistance index; I: intervention; ITT: intention‐to‐treat; n: number of participants; SD: standard deviation. | |||||||||
| Trials with data on mean change only | |
| Number of trials | 14 |
| Point estimate (95% CI) (kg/m2) | ‐ 1.5 (‐2.0 to ‐0.9) favouring drug intervention |
| Trials with concealment of allocation | |
| Number of trials | 12 |
| Point estimate (95% CI) (kg/m2) | ‐1.3 (‐1.8 to ‐0.7) favouring drug interventions |
| Trials with blinding of participants/personnel | |
| Number of trials | 10 |
| Point estimate (95% CI) (kg/m2) | ‐1.3 (‐1.9 to ‐0.7) favouring drug interventions |
| Trials with blinding of outcome assessors | |
| Number of trials | 10 |
| Point estimate (95% CI) (kg/m2) | ‐1.3 (‐1.9 to ‐0.7) favouring drug interventions |
| Trials without large sample size trials | |
| Number of trials | 14 |
| Point estimate (95% CI) (kg/m2) | ‐1.3 (‐1.8 to ‐0.7) favouring drug interventions |
| Trials with trials with 6 months' follow‐up only | |
| Number of trials | 14 |
| Point estimate (95% CI) (kg/m2) | ‐1.2 (‐1.7 to ‐0.7) favouring drug interventions |
| Trials without trials with higher drug dose | |
| Number of trials | 14 |
| Point estimate (95% CI) (kg/m2) | ‐1.2 (‐1.7 to ‐0.7) favouring drug interventions |
| Trials with trials with a high dose/active lifestyle intervention | |
| Number of trials | 10 |
| Point estimate (95% CI) (kg/m2) | ‐1.3 (‐1.9 to ‐0.7) favouring drug interventions |
| Trials without trials with high attrition | |
| Number of trials | 13 |
| Point estimate (95% CI) (kg/m2) | ‐1.4 (‐2.0 to ‐0.8) favouring drug interventions |
| BMI: body mass index; CI: confidence interval. | |
| Trials with data on mean change only | |
| Number of trials | 8 |
| Point estimate (95% CI) (kg) | ‐ 4.1 (‐6.3 to ‐1.8) favouring drug intervention |
| Trials with concealment of allocation | |
| Number of trials | 9 |
| Point estimate (95% CI) (kg) | ‐3.5 (‐5.8 to ‐1.2) favouring drug interventions |
| Trials with blinding of participants/personnel | |
| Number of trials | 7 |
| Point estimate (95% CI) (kg) | ‐4.2 (‐6.8 to ‐1.5) favouring drug interventions |
| Trials with blinding of outcome assessors | |
| Number of trials | 7 |
| Point estimate (95% CI) (kg) | ‐4.2 (‐6.8 to ‐1.5) favouring drug interventions |
| Trials without large sample size trials | |
| Number of trials | 10 |
| Point estimate (95% CI) (kg) | ‐3.4 (‐5.2 to ‐1.6) favouring drug interventions |
| Trials with 6 months' follow‐up only | |
| Number of trials | 9 |
| Point estimate (95% CI) (kg) | ‐3.5 (‐5.6 to ‐1.4) favouring drug interventions |
| Trials without trials with higher drug dose | |
| Number of trials | 10 |
| Point estimate (95% CI) (kg) | ‐3.4 (‐5.2 to ‐1.6) favouring drug interventions |
| Trials with trials with a high dose/active lifestyle intervention | |
| Number of trials | 6 |
| Point estimate (95% CI) (kg) | ‐4.3 (‐6.5 to ‐2.2) favouring drug interventions |
| Trials without trials with high attrition | |
| Number of trials | 9 |
| Point estimate (95% CI) (kg) | ‐4.4 (‐6.6 to ‐2.2) favouring drug interventions |
| CI: confidence interval. | |
| Outcome or subgroup title | No. of studies | No. of participants | Statistical method | Effect size |
| 1 Change in BMI (all trials) Show forest plot | 16 | 1884 | Mean Difference (IV, Random, 95% CI) | ‐1.34 [‐1.85, ‐0.83] |
| 2 Change in BMI (drug type) Show forest plot | 16 | 1884 | Mean Difference (IV, Random, 95% CI) | ‐1.34 [‐1.85, ‐0.83] |
| 2.1 Metformin | 8 | 543 | Mean Difference (IV, Random, 95% CI) | ‐1.35 [0.00, ‐0.69] |
| 2.2 Orlistat | 3 | 773 | Mean Difference (IV, Random, 95% CI) | ‐0.79 [‐1.08, ‐0.51] |
| 2.3 Sibutramine | 5 | 568 | Mean Difference (IV, Random, 95% CI) | ‐1.70 [‐2.89, ‐0.51] |
| 3 Change in BMI (dropout rate) Show forest plot | 16 | 1862 | Mean Difference (IV, Random, 95% CI) | ‐1.34 [‐1.85, ‐0.83] |
| 3.1 Dropouts < 20% | 9 | 597 | Mean Difference (IV, Random, 95% CI) | ‐1.11 [‐1.78, ‐0.44] |
| 3.2 Dropouts ≥ 20% | 6 | 1145 | Mean Difference (IV, Random, 95% CI) | ‐1.42 [‐2.34, ‐0.50] |
| 3.3 Unclear dropout rate | 1 | 120 | Mean Difference (IV, Random, 95% CI) | ‐2.73 [‐3.74, ‐1.72] |
| 4 Change in BMI (intention‐to‐treat (ITT) analysis) Show forest plot | 16 | 1862 | Mean Difference (IV, Random, 95% CI) | ‐1.34 [‐1.85, ‐0.83] |
| 4.1 No ITT | 5 | 282 | Mean Difference (IV, Random, 95% CI) | ‐1.56 [‐2.52, ‐0.60] |
| 4.2 ITT used | 11 | 1580 | Mean Difference (IV, Random, 95% CI) | ‐1.25 [‐1.86, ‐0.65] |
| 5 Change in BMI (funding) Show forest plot | 16 | 1862 | Mean Difference (IV, Random, 95% CI) | ‐1.34 [‐1.85, ‐0.83] |
| 5.1 Commercial | 5 | 1009 | Mean Difference (IV, Random, 95% CI) | ‐1.50 [‐2.69, ‐0.31] |
| 5.2 Noncommercial | 5 | 271 | Mean Difference (IV, Random, 95% CI) | ‐1.10 [‐1.77, ‐0.44] |
| 5.3 Commercial + noncommercial | 4 | 262 | Mean Difference (IV, Random, 95% CI) | ‐1.17 [‐1.86, ‐0.47] |
| 5.4 Unclear | 2 | 320 | Mean Difference (IV, Random, 95% CI) | ‐1.79 [‐3.54, ‐0.04] |
| 6 Change in BMI (publication date) Show forest plot | 16 | 1862 | Mean Difference (IV, Random, 95% CI) | ‐1.34 [‐1.85, ‐0.83] |
| 6.1 2007 or before | 8 | 1163 | Mean Difference (IV, Random, 95% CI) | ‐1.41 [‐2.21, ‐0.60] |
| 6.2 After 2007 | 8 | 699 | Mean Difference (IV, Random, 95% CI) | ‐1.26 [‐1.90, ‐0.62] |
| 7 Change in BMI (quality of trial) Show forest plot | 16 | 1862 | Mean Difference (IV, Random, 95% CI) | ‐1.34 [‐1.85, ‐0.83] |
| 7.1 Low | 6 | 322 | Mean Difference (IV, Random, 95% CI) | ‐1.40 [‐2.28, ‐0.52] |
| 7.2 Moderate | 10 | 1540 | Mean Difference (IV, Random, 95% CI) | ‐1.31 [‐1.95, ‐0.67] |
| 8 Change in BMI (country) Show forest plot | 16 | 1862 | Mean Difference (IV, Random, 95% CI) | ‐1.34 [‐1.85, ‐0.83] |
| 8.1 Middle income | 3 | 216 | Mean Difference (IV, Random, 95% CI) | ‐2.39 [‐3.08, ‐1.69] |
| 8.2 High income | 13 | 1646 | Mean Difference (IV, Random, 95% CI) | ‐1.09 [‐1.62, ‐0.56] |
| 9 Change in BMI (mean age) Show forest plot | 16 | 1884 | Mean Difference (IV, Random, 95% CI) | ‐1.34 [‐1.85, ‐0.83] |
| 9.1 Mean age < 12 years | 2 | 220 | Mean Difference (IV, Random, 95% CI) | ‐1.93 [‐3.53, ‐0.34] |
| 9.2 Mean age ≥ 12 years | 14 | 1664 | Mean Difference (IV, Random, 95% CI) | ‐1.25 [‐1.79, ‐0.71] |
| Outcome or subgroup title | No. of studies | No. of participants | Statistical method | Effect size |
| 1 Change in weight (all trials) Show forest plot | 11 | 1180 | Mean Difference (IV, Random, 95% CI) | ‐3.90 [‐5.86, ‐1.94] |
| 2 Change in weight (drug type) Show forest plot | 11 | 1180 | Mean Difference (IV, Random, 95% CI) | ‐3.90 [‐5.86, ‐1.94] |
| 2.1 Metformin | 4 | 372 | Mean Difference (IV, Random, 95% CI) | ‐3.24 [‐5.79, ‐0.69] |
| 2.2 Sibutramine | 5 | 568 | Mean Difference (IV, Random, 95% CI) | ‐4.71 [‐8.10, ‐1.32] |
| 2.3 Orlistat | 2 | 240 | Mean Difference (IV, Random, 95% CI) | ‐2.48 [‐4.31, ‐0.65] |
| Outcome or subgroup title | No. of studies | No. of participants | Statistical method | Effect size |
| 1 Serious adverse events Show forest plot | 5 | 1347 | Risk Ratio (M‐H, Random, 95% CI) | 1.43 [0.63, 3.25] |
| 1.1 Metformin | 1 | 76 | Risk Ratio (M‐H, Random, 95% CI) | 5.0 [0.25, 100.80] |
| 1.2 Orlistat | 3 | 773 | Risk Ratio (M‐H, Random, 95% CI) | 1.04 [0.41, 2.67] |
| 1.3 Sibutramine | 1 | 498 | Risk Ratio (M‐H, Random, 95% CI) | 3.53 [0.46, 27.33] |
| 2 Discontinued trial because of adverse events Show forest plot | 10 | 1664 | Risk Ratio (M‐H, Random, 95% CI) | 1.45 [0.83, 2.52] |
| 2.1 Metformin | 3 | 246 | Risk Ratio (M‐H, Random, 95% CI) | 1.20 [0.26, 5.48] |
| 2.2 Orlistat | 4 | 815 | Risk Ratio (M‐H, Random, 95% CI) | 2.49 [0.74, 8.32] |
| 2.3 Sibutramine | 3 | 603 | Risk Ratio (M‐H, Random, 95% CI) | 1.14 [0.53, 2.46] |