مداخلات دارویی برای درمان چاقی در کودکان و نوجوانان
چکیده
پیشینه
چاقی کودکان و نوجوانان در سطح جهان افزایش یافته و میتواند با پیامدهای مهم کوتاهمدت و طولانیمدت سلامت همراه باشد.
اهداف
ارزیابی اثربخشی مداخلات دارویی برای درمان چاقی در کودکان و نوجوانان.
روشهای جستوجو
ما CENTRAL؛ MEDLINE؛ Embase؛ PubMed (زیرمجموعههای Ovid در دسترس نبودند)، LILACS و همچنین پایگاههای ثبت کارآزمایی ICTRP (WHO) و ClinicalTrials.gov را جستوجو کردیم. جستوجوها از زمان آغاز به کار بانکهای اطلاعاتی تا مارچ 2016 انجام شدند. ما فهرست منابع را بررسی کرده و هیچ محدودیتی را برای زبان اعمال نکردیم.
معیارهای انتخاب
ما کارآزماییهای تصادفیسازی و کنترل شده (randomised controlled trials; RCTs) را از مداخلات دارویی برای درمان چاقی (دارای مجوز و بدون مجوز برای این اندیکاسیون) در کودکان و نوجوانان (میانگین سنی زیر 18 سال) با یا بدون حمایت اعضای خانواده، با حداقل 3 ماه مداخله دارویی و شش ماه پیگیری از ابتدای ورود، انتخاب کردیم. ما مداخلاتی را از مرور خارج کردیم که بهطور خاص با درمان اختلالات غذا خوردن یا دیابت نوع 2 سروکار داشتند، یا شرکتکنندگان مبتلا به چاقی را با علت ثانویه یا سندرومیک وارد کرده بودند. علاوه بر این، ما کارآزماییهایی را نیز خارج کردیم که از درمانهای هورمون رشد یا زنان باردار استفاده کردند.
گردآوری و تجزیهوتحلیل دادهها
دو نویسنده مرور بهطور مستقل از هم کیفیت مطالعات را ارزیابی کرده و دادهها را با استفاده از روششناسی استاندارد کاکرین استخراج کردند. ما در صورت لزوم برای به دست آوردن اطلاعات بیشتر با نویسندگان تماس گرفتیم.
نتایج اصلی
ما 21 کارآزمایی را وارد کرده و هشت کارآزمایی در حال انجام را شناسایی کردیم. کارآزماییهای وارد شده به ارزیابی متفورمین (metformin) (11 کارآزمایی)، سیبوترامین (sibutramine) (شش کارآزمایی)، اورلیستات (orlistat) (چهار کارآزمایی) پرداخته و یک بازوی کارآزمایی، ترکیب متفورمین و فلوکستین (fluoxetine) را بررسی کرد. کارآزماییهای درحال انجام متفورمین (چهار کارآزمایی)، توپیرامات (topiramate) (دو کارآزمایی) و اگزناتید (exenatide) (دو کارآزمایی) را ارزیابی میکنند. در مجموع 2484 نفر در این کارآزماییها شرکت کردند، 1478 شرکتکننده بهصورت تصادفی به گروه مداخله با دارو و 904 نفر در گروههای مقایسه شونده (91 شرکتکننده در دو کارآزمایی متقاطع شرکت کردند؛ 11 شرکتکننده نیز مشخص نبودند) اختصاص یافتند. هجده کارآزمایی از دارونما (placebo) در گروه مقایسه شونده استفاده کردند. دو کارآزمایی دارای طراحی متقاطع بوده، در حالی که 19 کارآزمایی باقیمانده RCTهای موازی بودند. طول دوره مداخله از 12 هفته تا 48 هفته و طول مدت پیگیری از ابتدای ورود به مطالعه، بین شش ماه تا 100 هفته متغیر بود.
بهطور کلی کارآزماییها برای تولید تصادفی توالی، پنهانسازی تخصیص و کورسازی (شرکتکنندگان، پرسنل و ارزیابان پیامد) برای پیامدهای عینی (objective) و ذهنی (subjective) دارای خطر پائین سوگیری (bias) بودند. ما خطر سوگیری را در یک یا چند حوزه مانند گزارشدهی انتخابی در تقریبا نیمی از کارآزماییها، در سطح بالایی ارزیابی کردیم.
پیامدهای اولیه این مرور عبارت بودند از تغییر در شاخص توده بدنی (BMI)، تغییر در وزن و حوادث جانبی. تمامی 21 کارآزمایی این پیامدها را اندازهگیری کردند. پیامدهای ثانویه شامل کیفیت زندگی مرتبط با سلامت (فقط یافتههای یک کارآزمایی تفاوت واضحی را نشان نداد؛ شواهد با قطعیت بسیار پائین)، توزیع چربی بدن (اندازهگیری شده در 18 کارآزمایی)، تغییر رفتار (اندازهگیری در شش کارآزمایی)، نظرات شرکتکنندگان در مورد مداخله (گزارش نشد)، موربیدیتی ناشی از مداخله (اندازهگیری شده در یک کارآزمایی اورلیستات که فقط وجود سنگهای صفراوی جدید بیشتری را در گروه مداخله گزارش کرد؛ شواهد با قطعیت بسیار پائین)، مورتالیتی به هر علتی (یک مورد خودکشی در گروه مداخله اورلیستات؛ شواهد با قطعیت پائین) و تأثیرات اقتصادی‐ اجتماعی (گزارش نشد) بودند.
مداخله در برابر بازوی مقایسه برای تفاوت میانگین (MD) در تغییر BMI معادل 1.3‐ kg/m2؛ (95% فاصله اطمینان (CI): 1.9‐ تا 0.8‐؛ P < 0.00001؛ 16 کارآزمایی؛ 1884 شرکتکننده؛ شواهد با قطعیت پائین) بود. هنگامی که بر اساس نوع دارو تقسیم شد، سیبوترامین، متفورمین و اورلیستات کاهش BMI را به نفع مداخله نشان دادند.
مداخله در برابر بازوی مقایسه برای تغییر در وزن، تفاوت میانگینی را معادل 3.9‐ کیلوگرم (95% CI؛ 5.9‐ تا 1.9‐؛ P < 0.00001؛ 11 کارآزمایی؛ 1180 شرکتکننده؛ شواهد با قطعیت پائین) نشان داد. مانند BMI، هنگامی که کارآزماییها براساس نوع دارو تقسیم شدند، سیبوترامین، متفورمین و اورلیستات همگی کاهش وزن را به نفع مداخله نشان دادند.
5 کارآزمایی حوادث جانبی جدی را گزارش کردند: تعداد 24/878 (2.5%) شرکتکننده در گروههای مداخله در مقابل 8/469 (1.7%) شرکتکننده در گروههای مقایسه (خطر نسبی (RR): 1.43؛ 95% CI؛ 0.63 تا 3.25؛ 1347 شرکتکننده؛ شواهد با قطعیت پائین). مجموع 52/1043 (5.0%) شرکتکننده در گروههای مداخله در برابر 17/621 (2.7%) شرکتکننده در گروههای مقایسه به دلیل حوادث جانبی از ادامه مطالعه انصراف دادند (RR: 1.45؛ 95% CI؛ 0.83 تا 2.52؛ 10 کارآزمایی؛ 1664 شرکتکننده؛ شواهد با قطعیت پائین). شایعترین حوادث جانبی در کارآزماییهای اورلیستات و متفورمین، عوارض گوارشی (مانند اسهال، درد یا ناراحتی خفیف شکمی، مدفوع چرب) بودند. شایعترین حوادث جانبی در کارآزماییهای سیبوترامین عبارت بودند از تاکیکاردی، یبوست و فشار خون بالا. تنها مطالعه فلوکستین، خشکی دهان و شل شدن مدفوع را گزارش کرد. هیچ کارآزماییای به بررسی درمان دارویی در کودکان دارای اضافه وزن نپرداخت.
نتیجهگیریهای نویسندگان
این مرور سیستماتیک بخشی از یک سری از مرورهای کاکرین در مورد مداخلات برای کودکان و نوجوانان چاق است و نشان داده که مداخلات دارویی (متفورمین، سیبوترامین، اورلیستات و فلوکستین) ممکن است در کاهش BMI و وزن بدن در کودکان و نوجوانان چاق اثرات اندکی داشته باشند. با این حال، بسیاری از این داروها برای درمان چاقی در کودکان و نوجوانان تائید نشده، یا مجوز آنها پس گرفته شده است. بهطورکلی کارآزماییها کیفیت پائینی داشتند و بسیاری از آنها دارای دوره کوتاه پیگیری بوده یا اصلا دوره پیگیری نداشتند و میزان ترک مطالعه در آنها بالا بود (ترک کلی: 25%). پژوهشهای آینده باید روی انجام کارآزماییهایی تمرکز کنند که دارای قدرت کافی و مدت پیگیری طولانی باشند تا اطمینان حاصل شود که اثرات طولانیمدت هر مداخله دارویی به طور جامعی ارزیابی میشود. عوارض جانبی باید به شیوهای استاندارد گزارش شوند و در میان موارد دیگر تعداد شرکتکنندگان مبتلا به حداقل یک مورد حادثه جانبی را مشخص کند. الزام مقامات نظارتی (سازمان غذا و داروی ایالات متحده و آژانس دارویی اروپا) برای کارآزماییهایی از داروهای جدید مورد استفاده در کودکان و نوجوانان، باید تعداد کارآزماییهای با کیفیت بالا را افزایش دهند.
PICO
خلاصه به زبان ساده
مداخلات دارویی برای درمان چاقی در کودکان و نوجوانان
سوال مطالعه مروری
آیا مداخلات دارویی باعث کاهش وزن در کودکان و نوجوانان چاق میشود و آیا استفاده از آنها ایمن است؟
پیشینه
در سراسر جهان کودکان و نوجوانان بیشتری مبتلا به اضافه وزن و چاقی میشوند. این کودکان و نوجوانان، بیشتر در معرض مشکلات سلامت قرار دارند، چه در دوران کودکی و نوجوانی و چه در سنین بالاتر. اطلاعات بیشتری در مورد آنچه که برای درمان این مشکل به بهترین نحو جواب میدهد، مورد نیاز است، به این معنی که به اصطلاح تغییر سبک زندگی (رژیم غذایی، ورزش و مشاوره) اثربخشی محدودی دارند.
ویژگیهای مطالعه
ما 21 مطالعه تصادفیسازی و کنترل شده (مطالعات بالینی که افراد بهطور تصادفی در یکی از دو یا چند گروه درمانی قرار میگیرند) را پیدا کردیم که به مقایسه داروهای مختلف در کنار مداخله تغییر رفتار مانند رژیم غذایی، ورزش یا هر دو (= گروههای مداخله) اغلب در برابر دارونما (placebo) (یک داروی ظاهری) همراه با مداخله تغییر رفتار (= گروههای کنترل) پرداختند. ما همچنین هشت مطالعه در حال انجام را شناسایی کردیم (مطالعاتی که در حال حاضر درحال اجرا هستند اما هنوز کامل نشدهاند). در مجموع 2484 کودک و نوجوان در این مطالعات شرکت کردند. طول دوره مداخله از 12 هفته تا 48 هفته و طول مدت پیگیری از شش ماه تا 100 هفته متغیر بود.
نتایج کلیدی
مطالعات وارد شده به بررسی متفورمین (metformin) (10 مطالعه)، سیبوترامین (sibutramine) (شش مطالعه)، اورلیستات (orlistat) (چهار مطالعه) و یک گروه مطالعه، ترکیب متفورمین و فلوکستین (fluoxetine) را بررسی کردند. مطالعات در حال اجرا، به ارزیابی متفورمین (چهار مطالعه)، توپیرامات (topiramate) (دو مطالعه) و اگزناتید (exenatide) (دو مطالعه) میپردازند.
بیشتر مطالعات گزارشهای خود را روی شاخص توده بدنی (BMI) و وزن بدن ارائه کردند: BMI معیار چربی بدن است و از اندازههای وزن و قد محاسبه میشود (kg/m2). در کودکان، BMI اغلب به شکلی اندازهگیری میشود که با بزرگترشدن کودک، جنسیت، وزن و قد وی را در آن دخیل میکنند (نمره BMI z). میانگین تغییر BMI در گروههای کنترل بین 1.8 kg/m2 کاهش تا 0.9 kg/m2 افزایش بود، در حالیکه میان تمامی گروههای مداخله، متوسط کاهش برجستهتر گزارش شد (کاهش 1.3 kg/m2). اثر مشابهی در مورد تغییر وزن دیده شد: بهطور متوسط، کودکان و نوجوانان در گروههای مداخله نسبت به کودکان و نوجوانان در گروههای کنترل، 3.9 کیلوگرم بیشتر وزن از دست دادند. نویسندگان مطالعه عوارض جانبی جدی را به طور متوسط در 24 نفر از هر 1000 شرکتکننده در گروههای مداخله نسبت به میانگین 17 نفر از هر 1000 شرکتکننده در گروههای کنترل گزارش کردند. تعداد شرکتکنندگانی که به دلیل عوارض جانبی مطالعه را ترک کردند، 40 نفر از هر 1000 نفر در گروههای مداخله و 27 نفر از هر 1000 نفر در گروههای کنترل بود. شایعترین عوارض جانبی در مطالعات اورلیستات و متفورمین، گوارشی (مانند اسهال و درد خفیف شکم) بود. عوارض جانبی شایع در کارآزماییهای سیبوترامین شامل افزایش ضربان قلب (تاکیکاردی)، یبوست و فشار خون بالا بود. مطالعه فلوکستین خشکی دهان و شل شدن مدفوع را نشان داد. در یک مطالعه، کیفیت زندگی مرتبط با سلامت (معیاری از عملکرد جسمانی، روانی، عاطفی و اجتماعی) گزارش شد و تفاوت معنیداری بین گروه مداخله و کنترل وجود نداشت. هیچ مطالعهای نظرات شرکتکنندگان را در رابطه با مداخله یا اثرات اقتصادی‐اجتماعی آن را گزارش نکرد. فقط یک مطالعه در مورد عوارض بیماری (morbidity) (یک بیماری چند بار در یک جای خاص رخ میدهد) مرتبط با مداخله گزارشی را ارائه کرد که نشان داد بعد از درمان با اورلیستات، سنگ صفراوی بیشتری وجود داشت. نویسندگان این مطالعه یک مورد خودکشی را در گروه مداخله اورلیستات گزارش كردند. با این حال، مطالعات به اندازه کافی طولانی نبودند تا بتوانند مرگومیر ناشی از هر علتی را بررسی کنند. هیچ مطالعهای در مورد درمان دارویی برای کودکانی که فقط اضافه وزن داشتند، انجام نشد (کودکان چاق، دارای وزن، BMI یا BMI z score بسیار بالاتری از کودکان دارای اضافه وزن هستند).
شواهد تا مارچ 2016 بهروز هستند.
کیفیت شواهد
قطعیت کلی شواهد پائین یا خیلی پائین بود، عمدتا به دلیل اینکه برای هر معیار پیامد تعداد اندکی مطالعه وجود داشت، تعداد کودکان یا نوجوانان وارد شده در مطالعات کم بودند و همچنین به دلیل اختلاف در نتایج مطالعات. علاوه بر این، بسیاری از کودکان یا نوجوانان قبل از پایان مطالعه، مطالعات را ترک کردند.
Authors' conclusions
Summary of findings
| Drug interventions for the treatment of obesity in children and adolescents | ||||||
| Population: obese children and adolescents Settings: mainly outpatient settings Intervention: metformin, orlistat, sibutramine usually combined with behaviour changing interventions Comparison: placebo or no placebo usually with behaviour changing interventions | ||||||
| Outcomes | Illustrative comparative risks* (95% CI) | Relative effect | No of participants | Quality of the evidence | Comments | |
| Assumed risk | Corresponding risk | |||||
| Comparator | Pharmacological intervention | |||||
| a. BMI (kg/m2) b. Body weight (kg) Follow‐up: 6 months (10 trials) ‐ 12 months (1 trial) | a. The mean reduction in BMI ranged across control groups from ‐1.8 to +0.9 b. The mean reduction in weight ranged across control groups from ‐3.8 kg to +4.9 kg | a. The mean reduction in BMI in the intervention groups was ‐1.3 higher (‐1.9 to ‐0.8 higher) b. The mean reduction in weight in the intervention groups was ‐3.9 kg higher (‐5.9 kg to ‐1.9 kg higher) | ‐ | a. 1884 (16) b. 1180 (11) | a. ⊕⊕⊝⊝ b. ⊕⊕⊝⊝ | ‐ |
| Adverse events a. Serious adverse events b. Discontinuation of trial because of adverse events Follow‐up: mostly 6 months, maximum 100 weeks (1 trial) | a. 17 per 1000 b. 27 per 1000 | a. 24 per 1000 (11 to 55) b. 40 per 1000 (23 to 69) | a.RR 1.43 (0.63 to 3.25) b.RR 1.45 (0.83 to 2.52) | a. 1347 (5) b. 1664 (10) | a. ⊕⊕⊕⊝ L owb b. ⊕⊕⊕⊝ Lowb | All trials reported if adverse events occurred; however, only 7/20 trials reported the number of participants who experienced at least 1 adverse event |
| Health‐related quality of life 3 questionnaires (1 trial) and SF‐36 (1 trial) Follow‐up: 6 months | See comment | See comment | See comment | 86 (2) | ⊕⊝⊝⊝ V ery lowc | Results were only reported for SF‐36 (1 trial on sibutramine, 46 children), there were no marked differences between intervention and comparator groups |
| All‐cause mortality Follow‐up: mostly 6 months, maximum 100 weeks (1 trial) | See comment | See comment | See comment | 2176 (20) | ⊕⊕⊕⊝ L owd | 1 suicide in the orlistat intervention group |
| Morbidity | See comment | See comment | See comment | 533 (1) | ⊕⊝⊝⊝ V ery lowe | Only 1 trial investigated morbidity defined as illness or harm associated with the intervention (Chanoine 2005). In the orlistat group 6/352 (1.7%) participants developed new gallstones compared with 1/181 (0.6%) in the placebo group |
| Socioeconomic effects | See comment | See comment | See comment | See comment | See comment | Not reported |
| *The basis for the assumed risk (e.g. the median control group risk across trials) is provided in footnotes. The corresponding risk (and its 95% confidence interval) is based on the assumed risk in the comparison group and the relative effect of the intervention (and its 95% CI). | ||||||
| GRADE Working Group grades of evidence | ||||||
| *Assumed risk was derived from the event rates in the comparator groups. aDowngraded by two levels because of potential other risk of bias, inconsistency and imprecision (see Appendix 13). | ||||||
Background
The prevalence of overweight and obese children and adolescents has increased throughout the world, presenting a global public health crisis (Ng 2014; WHO 2015). It is not only a problem in high‐income countries, but a high prevalence has also been found in low‐ and middle‐income countries (Wang 2012). Evidence suggests that rates are slowing down or plateauing in high‐income countries; however, they are still rising in low‐ or middle‐income countries and prevalence continues to remain high in both (Olds 2011; Rokholm 2010). The Global Burden of Disease Study 2013 reported a mean of 24% of boys and 23% of girls from high‐income countries to be overweight or obese, whilst the estimated percentages of boys and girls in low‐ or middle‐income countries who are overweight or obese are 13% each (Ng 2014). This report used the International Obesity Task Force (IOTF) age and sex standardised cut points (Cole 2000). Furthermore, young children also have a high prevalence of being overweight or obese with an estimated 42 million overweight or obese children under five years of age in 2010 (approximately 35 million living in low‐ or middle‐income countries ‐ De Onis 2010); these statistics were based on the World Health Organization (WHO) growth standard (WHO 2006).
An additional concern in some high‐income countries, such as the USA (Kelly 2013; Skinner 2014) and England (CMO 2014; Ells 2015a), is the rise in severe paediatric obesity. In England during 2012/2013, 2.9% of girls and 3.9% of boys, aged 10 to 11 years, were classified as severely obese (body mass index (BMI) UK90 99.6th centile or greater ‐ Ells 2015a). In the USA from 2011 to 2012, 2.1% of youths (aged 2 to 19 years) were categorised as class 3 obese (Centers for Disease Control and Prevention growth charts: BMI 140% of greater of the 95th percentile or BMI 40 kg/m2 or greater ‐ Skinner 2014).
Whilst the IOTF published an international definition for paediatric severe (morbid) obesity in 2012 (Cole 2012), often severe obesity prevalence is reported using country‐specific cut points making international comparisons difficult. Data from the USA (Skinner 2014) and England (Ells 2015a) have shown that severe paediatric obesity prevalence varies by socioeconomic status and ethnicity, and may result in greater risk of adverse cardio‐metabolic events and severe obesity in adulthood (Kelly 2013).
The prevalence of overweight and obese children is influenced by inequalities, where rates are higher in children from areas of high deprivation in high‐income countries (Knai 2012; Shrewsbury 2008), and from more affluent areas in low‐ or middle‐income countries (Lobstein 2004; Wang 2012). Other variables are also likely to influence obesity prevalence including age, sex and ethnicity, with varying rates found in different groups in the USA (Freedman 2006; Skinner 2014), England (HSCIC 2014), and New Zealand (Rajput 2014).
Description of the condition
Being overweight or obese in childhood is associated with many conditions which may affect both physical and psychosocial health. Such conditions include hypertension, insulin resistance and hyperlipidaemia in obese children and adolescents, also including very young children (Bocca 2013; Freedman 1999; Reilly 2003; Weiss 2004). The prevalence of type 2 diabetes has continued to increase in children and adolescents, with recent projections in the USA suggesting a potential quadrupling from 2010 to 2050 in the number of youths (aged less than 20 years old) with type 2 diabetes (Imperatore 2012; Pinhas‐Hamiel 2005). Being overweight or obese in early childhood has also been linked to increased cardiovascular risk factors, such as high systolic blood pressure (Falaschetti 2010), with such risks factors also being present in people with type 2 diabetes (Maahs 2014). In addition medical conditions such as sleep apnoea, polycystic ovarian syndrome (PCOS) and poor pulmonary function have also been linked to childhood obesity (Dietz 1998; Ebbeling 2002; Lobstein 2004; Reilly 2003). Furthermore, childhood obesity has been shown to be strongly associated with nonalcoholic fatty liver disease (NAFLD), which is the most common cause of chronic liver disease in children and adolescents (Aggarwal 2014; Berardis 2014).
The condition can also affect the child's mental health and lead to early discrimination, low self‐esteem and depression (Dietz 1998; Puhl 2007; Tang‐Peronard 2008). There is also evidence that childhood obesity also tracks into adulthood (Parsons 1999; Singh 2008; Whitaker 1997), and hence is associated with an increased risk of ill health in later life (Reilly 2011).
Description of the intervention
Since childhood obesity can potentially have serious consequences on a child's health and well‐being, it is very important to identify interventions which can treat obesity in both the short‐ and long‐term. The purposes of such interventions are similar to treatment in adults whereby the primary aims are: to reduce energy intake, increase energy expenditure and decrease sedentary behaviour. However, the child's age and baseline degree of obesity should be taken into consideration before deciding the type, length and intensity of the intervention. This will allow the intervention to be more tailored to the target population and potentially increase the chances of success and reduce the likelihood of adverse events.
In recent years, only three drugs have been licensed for the treatment of adult obesity: rimonabant, sibutramine and orlistat. However, none of these were licensed for use in children (Petkar 2013). Rimonabant was withdrawn from the market due to psychiatric adverse events and sibutramine was suspended by the European Medicine Agency (EMA) and was withdrawn by the US Food and Drug Administration (FDA) in 2010 due to cardiovascular adverse effects; however, sibutramine is still licensed for treatment of obesity in Brazil. Orlistat has been approved by the FDA but only for people over the age of 12 years (Sherafat‐Kazemzadeh 2013). In England, National Institute for Health and Care Excellence (NICE) guidance recommends that orlistat should only be used in children under 12 years old in exceptional circumstances where severe comorbidities exist. Moreover, in children who are 12 years or older, treatment is only recommended if there are physical comorbidities such as sleep apnoea or severe psychological comorbidities (NICE 2014).
Metformin has been approved by the FDA to treat type 2 diabetes mellitus in both adults and children over the age of 10 years but does not have approval for treating obesity in children or adults (McDonagh 2014). However, an analysis of prescribing data in the UK in 2011 showed metformin has regularly been prescribed to treat childhood obesity, the main indication being PCOS (Hsia 2011). Other drugs which have also previously been used off‐licence to treat obesity in children and adolescents include antidepressants such as fluoxetine and bupropion (Petkar 2013).
While weight loss alone may be of clinical and psychological benefit, additional health benefits may be achieved by the amelioration of obesity‐related disorders, such as hyperglycaemia in type 2 diabetes (Pandey 2015), pain and mobility in osteoarthritis (Widhalm 2016), and improvement in obstructive sleep apnoea (Nespoli 2013). Weight loss may also reduce the risk factors for cardiovascular and metabolic disease (Halpern 2010), or even prevent the development of disease, for example type 2 diabetes (Power 2014). While registration of drugs usually does not require such clinical endpoints, people and health economic considerations increasingly demand evidence on more than just weight or BMI reduction, data that would be more difficult to establish in children and adolescents and have been poorly, if at all, studied.
Adverse effects of the intervention
One systematic review of pharmacological options for managing paediatric obesity stated that the most common adverse events when taking orlistat were gastrointestinal problems related to increased fat excretion (e.g. fatty or oily stools, increased defecation, soft stools, flatus, faecal leakage). Other adverse events included long‐term fat‐soluble deficiencies, decrease in vitamin D concentrations and asymptomatic gallstones (Boland 2015). The most frequent adverse events associated with metformin are gastrointestinal, some of which can be intolerable (McCreight 2016). A change in dose or duration may resolve these adverse effects (McDonagh 2014). Common adverse effects of sibutramine included dry mouth, headaches, constipation and insomnia (Cheung 2013). However, the drug has also been linked to increased risk of nonfatal stroke or myocardial infarction, as shown in the Sibutramine Cardiovascular Outcomes (SCOUT) trial (James 2010). Consequently, the drug was withdrawn from the market in numerous countries including the UK, USA and Australia.
How the intervention might work
Sibutramine is a serotonin and norepinephrine reuptake inhibitor. It works by reducing hunger and improving satiety leading to decreased food intake (Catoira 2010). Orlistat leads to the excretion of approximately 30% of ingested fat; it works by acting as a gastrointestinal lipase inhibitor (Yanovski 2014). Metformin is a biguanide derivative which activates adenosine monophosphate‐activated protein kinase leading to the reduction of glucose production and absorption in the intestines and increasing insulin sensitivity. It is thought to reduce bodyweight by inhibiting fat cell lipogenesis and potentially may decrease food intake by increasing glucagon‐like peptide (Matson 2012). Fluoxetine is an antidepressant which works by inhibiting serotonin re‐uptake. It can result in weight loss by decreasing appetite and therefore inhibiting energy intake (Ye 2011). Hence, it is important to recognise that any drug that produces aversive taste or gastrointestinal adverse effects could produce weight loss by such adverse effects (Halford 2010).
Why it is important to do this review
In 2003, a systematic Cochrane Review was published entitled "Interventions for treating obesity in children" which assessed the effects of lifestyle interventions (dietary, physical activity, behavioural, or a combination of these) and included the analysis of childhood obesity treatment trials published up to July 2001 (Summerbell 2003). The second version of this Cochrane Review was published in 2009 providing an update to the 2003 review, and assessing the effects of pharmacological and surgical interventions (Oude Luttikhuis 2009).
To reflect the rapid growth in this field, the third update to this review has been split across six reviews focusing on the following treatment approaches: "Surgery for the treatment of obesity in children and adolescents" (Ells 2015b); "Drug interventions for the treatment of obesity in children and adolescents"; "Parent‐only interventions for childhood overweight or obesity in children aged 5 to 11 years" (Loveman 2015); "Diet, physical activity, and behavioural interventions for the treatment of overweight or obesity in preschool children up to the age of 6 years" (Colquitt 2016); "Diet, physical activity and behavioural interventions for the treatment of overweight or obesity in school children from the age of 6 to 11 years"; and "Diet, physical activity, and behavioural interventions for the treatment of overweight or obesity in adolescents aged 12 to 17 years". This review in this series focuses on the efficacy of pharmacological interventions for obese children and adolescents. The review complements the Cochrane Review of "Long‐term pharmacotherapy for obesity and overweight" (Padwal 2003), which does not provide randomised controlled trial (RCT) data on pharmacological interventions for children and adolescents.
The results of this current review and other systematic reviews in this series will provide information on which to underpin clinical guidelines and health policy on the treatment of children and adolescents who are overweight or obese.
Objectives
To assess the effects of drug interventions for the treatment of obesity in children and adolescents.
Methods
Criteria for considering studies for this review
Types of studies
We included RCTs where the length of the intervention had to be at least three months and the length of follow‐up from baseline had to be a least six months.
Types of participants
We included trials evaluating obese children and adolescents with a mean age of less than 18 years at the commencement of the intervention. We excluded trials with pregnant or critically ill participants. We excluded interventions that specifically dealt with the treatment of eating disorders or type 2 diabetes, or included participants with a secondary or syndromic cause of obesity.
Types of interventions
We investigated any pharmacological intervention which aimed to treat paediatric obesity, using any of the following intervention versus control sequences, where the same letters indicate direct comparisons.
Intervention
-
(a) Pharmacological intervention.
-
(b) Pharmacological intervention plus other therapy.
Comparator
-
(a1) Placebo.
-
(a2) Usual care.
-
(b1) Placebo plus other therapy.
-
(b2) Usual care plus other therapy.
Concomitant therapies were required to be the same in both the intervention and comparator groups.
Summary of specific exclusion criteria
-
Trials which included a growth hormone therapy as treatment for obesity.
-
Trials which included pregnant participants.
-
Trials which included participants who were critically ill.
-
Trials where participants had a secondary or syndromic cause of obesity.
-
Interventions that specifically dealt with the treatment of eating disorders or type 2 diabetes.
-
Trials in which the aim was not to treat obesity in children or adolescents.
-
Duration of intervention less than three months.
-
Duration of follow‐up less than six months.
Types of outcome measures
Primary outcomes
-
Body mass index (BMI) and bodyweight.
-
Adverse events.
Secondary outcomes
-
Health‐related quality of life and self‐esteem.
-
Body fat distribution.
-
Behaviour change.
-
Participants' views of the intervention.
-
Morbidity.
-
All‐cause mortality.
-
Socioeconomic effects.
Timing of outcome measurement
-
BMI: defined as weight (kg) divided by height (m) squared, and bodyweight (kg): measured at baseline, 6, 12, 24 and more than 24 months.
-
Adverse events: defined as an adverse outcome that occurred during or after the intervention but was not necessarily caused by it, and measured at any time during the trial.
-
Health‐related quality of life and self‐esteem: evaluated by a validated instrument such as the Paediatric Quality of Life Inventory and measured at baseline, 6, 12, 24 and more than 24 months.
-
Body fat distribution: defined by validated tools such as dual energy X‐ray absorptiometry (DEXA), waist circumference, skin fold thickness, waist‐to‐hip ratio and bioelectrical impedance analysis and measured at baseline, 6, 12, 24 and more than 24 months.
-
Behaviour change: evaluated by a validated instrument and measured at baseline, 6, 12, 24 and more than 24 months.
-
Participants' views of the intervention: defined as documented accounts from participant feedback and measured at baseline, 6, 12, 24 and more than 24 months.
-
Morbidity: defined as illness or harm associated with the intervention and measured at baseline, 6, 12, 24 and more than 24 months.
-
All‐cause mortality: defined as any death that occurred during or after the intervention and measured at any time during the trial.
-
Socioeconomic effects: defined as a validated measure of socioeconomic status such as parental income or educational status and measured at baseline, 6, 12, 24 and more than 24 months.
'Summary of findings' table
We presented a 'Summary of findings' table to report the following outcomes, listed according to priority.
-
BMI and bodyweight.
-
Adverse events.
-
Health‐related quality of life.
-
All‐cause mortality.
-
Morbidity.
-
Socioeconomic effects.
Search methods for identification of studies
Electronic searches
We searched the following sources on 15 March 2016 from inception to the specified date.
-
Cochrane Central Register of Controlled Trials (CENTRAL) via Cochrane Register of Studies Online (CRSO).
-
Ovid MEDLINE(R) In‐Process & Other Non‐Indexed Citations and Ovid MEDLINE(R) (1946 to 15 March 2016).
-
PubMed (subsets not available on Ovid) (15 March 2016).
-
Embase 1974 to 2016 Week 11.
-
LILACS (15 March 2016).
-
ClinicalTrials.gov (15 March 2016).
-
WHO International Clinical Trials Registry Platform (ICTRP; apps.who.int/trialsearch/) (15 March 2016).
For detailed search strategies, see Appendix 1. We continuously applied an email alert service for MEDLINE via OvidSP to identify newly published trials using the search strategy detailed in Appendix 1. If we detected additional relevant key words during any of the electronic or other searches, we modified the electronic search strategies to incorporate these terms and documented the changes. We placed no restrictions on the language of publication when searching the electronic databases or reviewing reference lists of identified trials.
Searching other resources
We attempted to identify other potentially eligible trials or ancillary publications by searching the reference lists of retrieved included trials, (systematic) reviews, meta‐analyses and health technology assessment reports.
Data collection and analysis
Selection of studies
To determine the trials to be assessed further, two review authors (of EM, LE, CO) independently scanned the abstract, title, or both, of every record retrieved by the searches. We obtained full‐text articles of all those trials deemed potentially relevant for inclusion. We resolved any differences in opinion by consultation of a third review author (of GA, EC, LE). If there was an outstanding issue with the trial, we added the article to those 'awaiting assessment' and we contacted trial authors for clarification. We presented an adapted PRISMA flow diagram of trial selection (Figure 1) (Liberati 2009).

Trial flow diagram.
Data extraction and management
For trials that fulfilled the inclusion criteria, two review authors (of EM, LE, GA, NF, EC, LB, CO) independently extracted key participant and intervention characteristics and reported data on efficacy outcomes and adverse events using standard data extraction templates. We resolved any disagreements by discussion, or, if required, by consultation with a third review author (of NF, EC, LB, GA) (for details see Table 1; Appendix 2; Appendix 3; Appendix 4; Appendix 5; Appendix 6; Appendix 7; Appendix 8; Appendix 9; Appendix 10; Appendix 11).
| Trial | Intervention(s) and comparator(s) | Description of power and sample size calculation | Screened/eligible | Randomised | Safety | ITT | Finishing trial | Randomised finishing trial | Follow‐up timea |
| Atabek 2008b | I: metformin + diet and physical activity advice | ‐ | ‐ | 90 | 90 | ‐ | 90 | 100 | 6 months |
| C: placebo + diet and physical activity advice | 30 | 30 | ‐ | 30 | 100 | ||||
| total: | 120 | 120 | ‐ | 120 | 100 | ||||
| Berkowitz 2003 | I: behavioural programme + sibutramine | Powered to detect a 4% difference in % change in BMI between the 2 treatment groups with an SD of 5% (α = 0.05, β = 93%)c | 146 | 43 | 43 | 43 | 40 | 93.0 | 6 months (not including the 6‐month open‐label period where all participants received sibutramine) |
| C: behavioural programme + placebo | 39 | 39 | 39 | 34 | 87.2 | ||||
| total: | 82 | 82 | 82 | 62 | 75.6 | ||||
| Berkowitz 2006 | I: behavioural programme + sibutramine | "Planned sample size was approximately 400 participants with a 3:1 randomization ratio of sibutramine to placebo. On the basis of previous 12‐month adult trials, we determined that 300 participants in the sibutramine group would be adequate to assess safety and exposure, allowing an overall dropout rate of approximately 50% and a probability that approximately 50% of participants receiving 10 mg of sibutramine would lose 10% or more of initial BMI at 6 months" "Although the protocol did not document a formal sample size calculation for efficacy, approximately 132 adolescents (99 in the sibutramine group and 33 in the placebo group) would allow a between‐group difference in BMI of 2 kg/m2, with 90% power (2‐sided level of 0.05) to be statistically significant, assuming a common SD of 3 kg/m2)"d | ‐ | 368 | 368 | ‐ | 281 | 76.4 | 12 months |
| C: behavioural programme + placebo | 130 | 130 | ‐ | 80 | 61.5 | ||||
| total: | 498 | 498 | ‐ | 361 | 72.5 | ||||
| Chanoine 2005 | I: orlistat + diet + exercise + behaviour therapy | "We planned to enroll at least 450 individuals to provide more than 80% power to detect a difference of 1 BMI unit, assuming a 30% dropout rate" | 588 | 357 | 352 | 348 | 232 | 65.0 | 54 weeks |
| C: placebo + diet + exercise + behaviour therapy | 182 | 181 | 180 | 117 | 64.3 | ||||
| total: | 539 | 533 | 528 | 349 | 64.7 | ||||
| Clarson 2009 | I: metformin + lifestyle intervention | ‐ | 65 | 14 | ‐ | ‐ | 11 | 78.6 | 6 months |
| C: lifestyle intervention only | 17 | ‐ | ‐ | 14 | 82.4 | ||||
| total: | 31 | ‐ | ‐ | 25 | 80.6 | ||||
| Franco 2014 (cross‐over trial) | I: sibutramine + dietary guidance | ‐ | 73 | ‐ | ‐ | ‐ | ‐ | ‐ | 13 months |
| C: placebo + dietary guidance | ‐ | ‐ | ‐ | ‐ | ‐ | ||||
| total: | 63 | 63 | ‐ | 23 | 36.5 | ||||
| Freemark 2001 | I: metformin | ‐ | ‐ | 15 | ‐ | ‐ | 14 | 93.3 | 6 months |
| C: placebo | 17 | ‐ | ‐ | 15 | 88.2 | ||||
| total: | 32 | ‐ | ‐ | 29 | 90.6 | ||||
| Garcia‐Morales 2006 | I: sibutramine + diet + exercise | 13 participants per group (expectations: mean loss of 7.5 kg (SD 5.3) in the sibutramine group vs 3.6 kg (SD 4.5) in the placebo group)e | 70 | 26 | 26 | 23 | 21 | 80.8 | 6 months |
| C: placebo + diet + exercise | 25 | 25 | 23 | 19 | 76.0 | ||||
| total: | 51 | 51 | 46 | 40 | 78.4 | ||||
| Godoy‐Matos 2005 | I: sibutramine + hypocaloric diet + exercise | ‐ | ‐ | 30 | 30 | 30 | 28 | 93.3 | 24 weeks |
| C: placebo + hypocaloric diet + exercise | 30 | 30 | 30 | 22 | 73.3 | ||||
| total: | 60 | 60 | 60 | 50 | 83.3 | ||||
| Kendall 2013 | I: metformin + healthy lifestyle advice | "The target recruitment was 140 patients, based on a power calculation using the results of a previous study. A standard power calculation was used to detect a reduction in BMI of 0.15 kg/m2 (SD 0.3). Sixty‐four participants in each group give a statistical power of 80% for a t test at the 5% significance level. This was rounded up to allow for some loss to follow‐up but recognizing that adjustment using multifactorial analysis would likely enhance the trial power by an unpredictable amount"f | 234 | ‐ | 74 | 74 | 55 | ‐ | 6 months |
| C: placebo + healthy lifestyle advice | ‐ | 77 | 77 | 55 | ‐ | ||||
| total: | 155 | 151 | 151 | 110 | 71.0 | ||||
| Maahs 2006 | I: orlistat + diet and exercise therapy | "We determined that a clinically important mean difference in decrease in BMI between the orlistat and placebo groups would be 2.0 kg/m2 at 6 months and used an SD of 1.8. On the basis of this approach, a sample size of 15 subjects per group would be adequate to detect a 2.0 kg/m2 difference in Student’s t test with 80% power and alpha = 0.05. In order to allow for a 25% dropout rate, 20 subjects were randomized to each group"g | 43 | 20 | ‐ | 20 | 18 | 90.0 | 6 months |
| C: placebo + diet and exercise therapy | 20 | ‐ | 20 | 16 | 80.0 | ||||
| total: | 40 | ‐ | 40 | 34 | 85.0 | ||||
| Mauras 2012 | I: metformin + diet/exercise intervention | "Differences in hsCRP and fibrinogen concentrations at 6 months were the primary outcomes. An n = 42 completed subjects provided > 90 % power to detect significant changes" | ‐ | 35 | 35 | ‐ | 23 | 65.7 | 6 months |
| C: diet/exercise intervention | 31 | 31 | ‐ | 19 | 61.3 | ||||
| total: | 66 | 66 | ‐ | 42 | 63.6 | ||||
| NCT00001723 | I: orlistat + behavioural weight loss programme | ‐ | ‐ | 100 | 100 | 100 | 87 | 87.0 | 6 months |
| C: placebo + behavioural weight loss programme | 100 | 100 | 100 | 84 | 84.0 | ||||
| 200 | 100 | 100 | 171 | 85.5 | |||||
| Ozkan 2004 | I: conventional treatment (nutritional and lifestyle modification programmes) + orlistat | ‐ | ‐ | 22 | ‐ | ‐ | 15 | 68.2 | 5 to 15 months |
| C: conventional treatment: nutritional and lifestyle modification programmes | 20 | ‐ | ‐ | 15 | 75.0 | ||||
| total: | 42 | ‐ | ‐ | 30 | 71.4 | ||||
| Prado 2012 | I: metformin + nutritional guide and exercise programme | 8 participants were required per intervention group (SD 0.4; difference of 0.6, P < 0.05, power = 90%) | 41/26 | ‐ | 9 | ‐ | 7 | ‐ | 6 months |
| C: placebo + nutritional guide and exercise programme | ‐ | 10 | ‐ | 6 | ‐ | ||||
| total: | 26 | 19 | ‐ | 13 | 50 | ||||
| Rezvanian 2010 | I1: metformin + diet and physical activity advice | "By considering alpha = 0.05 and a power level of 0.8, the sample size was calculated as 160, and by considering the attrition during the follow‐up, we increased it to 180" | 180 | 45 | ‐ | ‐ | 41 | 91.1 | 24 weeks |
| I2: fluoxetine + diet and physical activity advice | 45 | ‐ | ‐ | 40 | 88.9 | ||||
| I3: metformin and fluoxetine + diet and physical activity advice | 45 | ‐ | ‐ | 41 | 91.1 | ||||
| C: placebo + diet and physical activity advice | 45 | ‐ | ‐ | 42 | 93.3 | ||||
| total: | 180 | ‐ | ‐ | 164 | 91.1 | ||||
| Srinivasan 2006 (cross‐over trial) | I: metformin + "standardised information on healthy eating and exercise" | ‐ | 34 | ‐ | ‐ | ‐ | ‐ | ‐ | 12 months |
| C: placebo + "standardised information on healthy eating and exercise" | ‐ | ‐ | ‐ | ‐ | ‐ | ||||
| total: | 28 | ‐ | ‐ | 22 | 78.6 | ||||
| Van Mil 2007 | I: sibutramine + energy‐restricted diet and exercise plan | "The number of patients required per treatment group to detect a difference between treatment groups in mean change in BMI at endpoint intervention of 1.0 kg/m2, based on an estimate of variance (sd) of 0.65, an overall significance level of 5%, and a power of 90%, was nine. Allowing a drop‐out rate of 25%, the number of patients needed in each group was 12"h | ‐ | 12 | 12 | 12 | 11 | 91.7 | 24 weeks |
| C: placebo + energy‐restricted diet and exercise plan | 12 | 12 | 12 | 9 | 75.0 | ||||
| total: | 24 | 24 | 24 | 20 | 83.3 | ||||
| Wiegand 2010 | I: metformin + lifestyle intervention | "Since a clinically significant effect was defined as a decrease in HOMA‐IR by ‐1, two groups of 37 patients had to be included in the study to achieve a power of 0.9 with a α value of 0.05" | 278 | 36 | ‐ | ‐ | 34 | 94.4 | 6 months |
| C: placebo + lifestyle intervention | 34 | ‐ | ‐ | 29 | 85.3 | ||||
| total: | 70 | ‐ | ‐ | 63 | 90 | ||||
| Wilson 2010 | I: metformin + lifestyle intervention | "Assuming an SD of 1.9 for BMI change, an enrolled sample of 72 provided 80% power to detect a differential of 1.46 between treatment arms or between sexes and 1.75 between white subjects and others"i | 92 | 39 | 39 | 39 | 19 | 48.7 | 100 weeks |
| C: placebo + lifestyle intervention | 38 | 38 | 38 | 19 | 50.0 | ||||
| total: | 77 | 76 | 76 | 38 | 49.4 | ||||
| Yanovski 2011 | I: metformin + dietitian‐administered weight‐reduction programme | "A total sample size of 60 participants would detect a between‐group difference of 0.09 BMI SD score units (approximately equivalent to a 2 kg/m2 difference) with 80% power. Participant accrual was set at 100 participants to allow as much as 40% loss to follow‐up"j | 278 | 53 | ‐ | 53 | 45 | 84.9 | 6 months (not including the 6‐month open‐label phase) |
| C: placebo + dietitian‐administered weight‐reduction programme | 47 | ‐ | 47 | 40 | 85.1 | ||||
| total: | 100 | ‐ | 100 | 85 | 85.0 | ||||
| Grand total | All interventionsk | 1395 | 1153 | ||||||
| All comparatorsk | 817 | 665 | |||||||
| All interventions and comparatorsk | 2484 | 1851 | |||||||
aDuration of intervention and follow‐up under randomised conditions until end of trial.
bUnclear from the publication on the number which completed the trial and hence number of dropouts.
cActual treatment difference between intervention groups was 4.5% reduction in BMI.
dActual treatment difference between intervention groups at 12 months was 2.9 kg/m2.
eActual weight loss was 7.3 kg in the sibutramine group vs 4.3 kg in the placebo group.
fActual adjusted treatment difference at 6 months was ‐1.07 kg/m2.
gActual treatment difference between intervention groups at 6 months was 0.5 kg/m2.
hActual treatment difference between intervention groups at end of intervention (12 weeks) was 0.4 kg/m2 and at end of follow‐up (24 weeks) was 1.0 kg/m2.
iActual treatment difference between intervention groups after 48 weeks was 1.1 kg/m2.
jActual treatment difference between intervention groups at 6 months for BMI z score was 0.07.
kNumbers for interventions and comparators do not add up to 'all interventions and comparators' because several trials did not provide information on randomised participants per intervention/comparator group but only the total number of randomised participants.
"‐" denotes not reported.
BMI: body mass index; C: comparator; hsCRP: high sensitivity C‐reactive protein; HOMA‐IR: homeostasis model assessment for insulin resistance index; I: intervention; ITT: intention‐to‐treat; n: number of participants; SD: standard deviation.
We provided information, including trial identifier, about potentially relevant ongoing trials in the Characteristics of ongoing studies table and in Appendix 5. We tried to obtain the protocol of each included trial, either in trial registers or in publications of trial designs, or both, and specified the data Appendix 5.
We sent an email to all authors of included trials to enquire whether they were willing to answer questions regarding their trials. Appendix 12 shows the results of this survey. Thereafter, we sought relevant missing information on the trial from the primary author(s) of the article, if required.
Dealing with duplicate and companion publications
In the event of duplicate publications, companion documents or multiple reports of a primary trial, we tried to maximise yield of information by collating all available data and used the most complete data set aggregated across all known publications. In case of doubt, we gave priority to the publication reporting the longest follow‐up associated with our primary or secondary outcomes.
Assessment of risk of bias in included studies
Two review authors (of EM, LE, GA, NF, EC, LB, CO) independently assessed the risk of bias of each included trial. We resolved possible disagreements by consensus, or with consultation of a third party. In cases of disagreement, the rest of the group were consulted and a judgement was made based on consensus.
We assessed risk of bias using Cochrane's 'Risk of bias' tool (Higgins 2011a; Higgins 2011b). We used the following criteria.
-
Random sequence generation (selection bias).
-
Allocation concealment (selection bias).
-
Blinding (performance bias and detection bias), separated for blinding of participants and personnel and blinding of outcome assessment.
-
Incomplete outcome data (attrition bias).
-
Selective reporting (reporting bias).
-
Other bias.
We assessed outcome reporting bias by integrating the results of 'Examination of outcome reporting bias' (Appendix 6), 'Matrix of trial endpoints (publications trial documents)' (Appendix 5), and section 'Outcomes (outcomes reported in abstract of publication)' of the Characteristics of included studies table (Kirkham 2010). This analysis formed the basis for the judgement of selective reporting (reporting bias).
We judged risk of bias criteria as 'low risk', 'high risk' or 'unclear risk' and evaluated individual bias items as described in the Cochrane Handbook for Systematic Reviews of Interventions (Higgins 2011a). We presented a 'Risk of bias' graph and a 'Risk of bias' summary figure.
We assessed the impact of individual bias domains on trial results at endpoint and trial levels.
For blinding of participants and personnel (performance bias), detection bias (blinding of outcome assessors) and attrition bias (incomplete outcome data), we intended to evaluate risk of bias separately for subjective and objective outcomes (Hróbjartsson 2013). We considered the implications of missing outcome data from individual participants.
We defined the following endpoints as self‐reported outcomes.
-
All self‐reported data such as a self‐reported health‐related quality of life questionnaires.
We defined the following endpoints as investigator‐assessed outcomes.
-
All measured data such as assessor measured height and weight.
Measures of treatment effect
We expressed continuous data as mean differences (MD) with 95% confidence intervals (CI). We expressed dichotomous data as odds ratios (ORs) or risk ratios (RRs) with 95% CIs. We used Comprehensive Meta Analysis (CMA) version 3 and Review Manager 5 (RevMan 2014) to conduct the meta‐analyses.
Unit of analysis issues
We tried to consider the level at which randomisation occurred, such as cross‐over trials, cluster‐randomised trials and multiple observations for the same outcome.
Dealing with missing data
We obtained relevant missing data from trial authors, if feasible, and evaluated important numerical data such as screened, eligible, randomised participants as well as intention‐to‐treat (ITT), as‐treated and per‐protocol (PP) populations. We investigated attrition rates, for example dropouts, losses to follow‐up and withdrawals, and critically appraised issues of missing data and imputation methods (e.g. last observation carried forward (LOCF)).
Where standard deviations (SD) for outcomes were not reported, we imputed these values by assuming the SD of the missing outcome to be the mean of the SDs from those trials where this information was reported. We investigated the impact of imputation on meta‐analyses by means of sensitivity analyses.
Assessment of heterogeneity
In the event of substantial clinical or methodological heterogeneity, we did not report trial results as meta‐analytically pooled effect estimates. We identified heterogeneity by visual inspection of the forest plots and by using a standard Chi2 test with a significance level of α = 0.1, in view of the low power of this test. We examined heterogeneity using the I2 statistic, which quantifies inconsistency across trials to assess the impact of heterogeneity on the meta‐analysis (Higgins 2002; Higgins 2003), where an I2 statistic of 75% or more indicates a considerable level of inconsistency (Higgins 2011a). We also calculated Tau2, another statistic that provides information about heterogeneity.
When we found heterogeneity, we attempted to determine potential reasons for it by examining individual trial and subgroup characteristics.
We expected the following characteristics to introduce clinical heterogeneity.
-
Differences in the age of trial population.
-
Differences in the trial population demographics.
-
Differences in the types of drugs.
-
Differences in BMI at baseline.
Assessment of reporting biases
If we included 10 trials or more for a given outcome, we used funnel plots to assess small‐trial effects. Due to several explanations for funnel plot asymmetry, we interpreted results carefully (Sterne 2011).
Data synthesis
Unless there was good evidence for homogeneous effects across trials, we primarily summarised low risk of bias data by means of a random‐effects model (Wood 2008). We interpreted random‐effects meta‐analyses with due consideration of the whole distribution of effects, ideally by presenting a prediction interval (Higgins 2009). A prediction interval specifies a predicted range for the true treatment effect in an individual trial (Riley 2011). In addition, we performed statistical analyses according to the statistical guidelines referenced in the latest version of the Cochrane Handbook for Systematic Reviews of Interventions (Higgins 2011a).
Quality of evidence
We presented the overall certainty of the evidence for each outcome specified under 'Types of outcome measures: Summary of findings table' according to the GRADE approach which considers issues not only related to internal validity (risk of bias, inconsistency, imprecision, publication bias) but also to external validity such as directness of results. Two review authors (EM, GA) independently rated the certainty for each outcome. We presented a summary of the evidence in summary of findings Table for the main comparison, which provides key information about the best estimate of the magnitude of the effect, in relative terms and absolute differences for each relevant comparison of alternative management strategies, numbers of participants and trials addressing each important outcome and the rating of the overall confidence in effect estimates for each outcome. We created the summary of findings Table for the main comparison based on the methods described in the Cochrane Handbook for Systematic Reviews of Interventions (Higgins 2011a). We presented results on the outcomes as described in Types of outcome measures. If meta‐analysis was not possible, we presented results in a narrative form in summary of findings Table for the main comparison.
In addition, we established an appendix 'Checklist to aid consistency and reproducibility of GRADE assessments' (Meader 2014) to help with standardisation of 'Summary of findings' tables (Appendix 13).
Subgroup analysis and investigation of heterogeneity
We planned to carry out the following subgroup analyses and investigated interactions.
-
Length of follow‐up.
-
Impact and nature of maintenance periods.
-
The impact of comparator/control: whether concomitant therapy or no treatment (true control).
-
The impact of population demographics.
Sensitivity analysis
We planned to performed sensitivity analyses to explore the influence of the following factors on effect size.
-
Restricting the analysis to published trials.
-
Restricting the analysis considering risk of bias, as specified in the Assessment of risk of bias in included studies section.
-
Restricting the analysis to very long or large trials (more than 300 participants in total) to establish how much they dominated the results.
-
Restricting the analysis to trials using the following filters: diagnostic criteria, language of publication, source of funding (industry versus other), country.
We also tested the robustness of the results by repeating the analysis using different measures of effect size (RR, OR, etc.) and different statistical models (fixed‐effect and random‐effects models).
Results
Description of studies
For a detailed description of trials, see the Characteristics of included studies, Characteristics of excluded studies and Characteristics of ongoing studies tables.
Results of the search
Our comprehensive literature searches identified 4995 records; from these, 199 full‐text papers or clinical trial records were identified for further examination. We excluded trials based on their titles or abstracts because they did not meet the inclusion criteria or were not relevant to the question under trial (see Figure 1 for the amended PRISMA flow diagram). After screening the full text of the selected publications, 21 completed trials (33 publications) met the inclusion criteria and were included in the qualitative synthesis of this review. All trials were published in English apart from Franco 2014 (Portuguese) and Prado 2012 (Spanish). We contacted all trial authors of the included trials and received a reply from all but four authors (Atabek 2008; Berkowitz 2003; Berkowitz 2006; Ozkan 2004). We sought additional information from the authors of all 21 trials, 12 authors responded to these requests and provided further data (Chanoine 2005; Clarson 2009; Franco 2014; Freemark 2001; Godoy‐Matos 2005; Maahs 2006; Mauras 2012; NCT00001723; Prado 2012; Rezvanian 2010; Srinivasan 2006; Van Mil 2007). We also identified eight ongoing trials, and an additional seven trials were placed in the 'awaiting classification' section because we could not source the full publication, the trial was completed but there was not yet enough information to include it in this review or the publication was identified when a final draft of the review had been completed (NCT01487993).
Included studies
A detailed description of the characteristics of included trials is presented elsewhere (see Characteristics of included studies; Appendix 2; Appendix 3; Appendix 4). The following is a succinct overview.
Source of data
The literature search identified all 21 included trials in the review and all but one (NCT00001723) were published trials. Ten out of 21 trials were included in the previous review (Oude Luttikhuis 2009), and information relating to these 10 trials was extracted from the 2009 review ‐ two review authors extracted any missing information from the publication. All ongoing trials were found from searching online clinical trial registers.
Comparisons
Of the 21 included trials, 11 used metformin in their intervention arm; four of these trials gave metformin plus a behaviour changing programme to the intervention group and used a placebo plus a behaviour changing programme in the comparator group (Prado 2012; Wiegand 2010; Wilson 2010; Yanovski 2011). Two trials compared metformin plus a behaviour changing programme against a behaviour changing programme alone without using a placebo (Clarson 2009; Mauras 2012). Four trials compared metformin plus a behaviour changing intervention against placebo plus a behaviour changing intervention (Atabek 2008; Kendall 2013; Rezvanian 2010; Srinivasan 2006). Rezvanian 2010 also had two additional intervention arms: metformin plus fluoxetine plus healthy eating plus physical activity advice; and fluoxetine plus healthy eating plus physical activity advice. The remaining trial compared metformin with placebo; hence, there was no lifestyle component included in either arm (Freemark 2001).
Six trials used sibutramine as the pharmacological intervention; three trials compared sibutramine plus a behaviour changing programme with placebo plus a behaviour changing programme (Berkowitz 2003; Berkowitz 2006; Van Mil 2007). The other three trials compared sibutramine plus dietary/exercise advice with placebo plus dietary/exercise advice (Franco 2014; García‐Morales 2006; Godoy‐Matos 2005).
Four trials investigated orlistat. Chanoine 2005, Maahs 2006, and NCT00001723 examined orlistat plus a behaviour changing intervention versus placebo plus a behaviour changing intervention. Ozkan 2004 did not include a placebo in their comparator group; hence, they compared orlistat plus a behaviour changing intervention with a behaviour changing intervention only.
Overview of trial populations
A total of 2484 children and adolescents participated in the 21 included trials. A total of 1851 participants finished the trial (74.5%) and hence we measured at the study's endpoint. In 10 studies, the dropout rates were higher in the placebo group than the intervention group, potentially showing some dissatisfaction with the control condition. The individual trial sample size ranged from 24 to 539 participants.
The 11 metformin trials included 885 participants. The individual trial sample size ranged from 26 to 155 participants. One metformin trial also included two additional intervention arms of fluoxetine and fluoxetine plus metformin (45 randomised participants in each intervention arm).
The six sibutramine trials included 778 participants. The individual trial sample size ranged from 24 to 498 participants.
The four orlistat trials included 821 participants. The individual trial sample size ranged from 40 to 539 participants.
Trial design
Trials were RCTs. Nineteen trials adopted a parallel group superiority design and two were cross‐over trials (Franco 2014; Srinivasan 2006). All but three trials used a placebo comparator (Clarson 2009; Mauras 2012; Ozkan 2004). Five trials were multicentred (Berkowitz 2006; Chanoine 2005; Kendall 2013; Wiegand 2010; Wilson 2010), with the number of centres ranging from two (Wiegand 2010) to 33 (Berkowitz 2006). In terms of blinding, 14 trials were double‐blinded for participants and personnel (Berkowitz 2003; Berkowitz 2006; Chanoine 2005; Franco 2014; Freemark 2001; Godoy‐Matos 2005; Maahs 2006; NCT00001723; Prado 2012; Rezvanian 2010; Srinivasan 2006; Van Mil 2007; Wilson 2010; Yanovski 2011), no trials were single‐blinded for participants, and four trials did not define blinding (Atabek 2008; García‐Morales 2006; Kendall 2013; Ozkan 2004). Thirteen trials blinded outcome assessors (Berkowitz 2003; Berkowitz 2006; Chanoine 2005; Franco 2014; Freemark 2001; Godoy‐Matos 2005; Maahs 2006; NCT00001723; Rezvanian 2010; Srinivasan 2006; Van Mil 2007; Wiegand 2010; Wilson 2010; Yanovski 2011). Trials were published between the 2001 and 2014; all but one sibutramine trial were published before the drug was withdrawn by the FDA ‐ Franco 2014 was conducted in Brazil where the drug is still licensed. All metformin trials were published between 2006 and 2012 apart from Freemark 2001. Orlistat trials were published between 2004 and 2006, but one trial did not have any publications available and only posted results on a clinical trial website and in a conference abstract (NCT00001723).
The duration of interventions ranged from 12 weeks to 17 months, with a mean duration of 28 weeks. The duration of follow‐up (from end of intervention) ranged from 0 to 52 weeks, with a mean follow‐up period of 12 weeks. Participants in nine trials received the intervention/comparator for six months with no additional follow‐up; in three trials, participants received the intervention/comparator for six months, which was then followed by an open‐label period for six months (Berkowitz 2003; NCT00001723; Yanovski 2011); two trials received the intervention for 12 months with no additional follow‐up (Berkowitz 2006; Chanoine 2005); two cross‐over trials included a six‐month intervention or control condition followed by a washout period, then each participant crossed over into the alternative condition for an additional six months (Franco 2014; Srinivasan 2006); three trials included an intervention/comparator period for three months (or 12 weeks) then a follow‐up period for an additional three months (or 12 weeks) (Prado 2012Rezvanian 2010; Van Mil 2007); one trial gave the intervention or comparator condition for 48 weeks, then included an additional follow‐up period for another 48 weeks (Wilson 2010); and finally in one trial the length of the intervention and follow‐up varied across participants (Ozkan 2004).
Five trials had a run‐in period, of which three included a placebo run‐in phase (Chanoine 2005; Godoy‐Matos 2005; Wilson 2010), with a duration varying from two to four weeks; Freemark 2001 included 48‐hour inpatient tests as their run‐in period; two trial gave dietetic advice/counselling (García‐Morales 2006; Godoy‐Matos 2005); Wilson 2010 also included a lifestyle modification programme in their run‐in period. Outcomes were not assessed in these run‐in periods. Furthermore, three trials included an open‐label phase six months after randomisation where both groups received the drug intervention (Berkowitz 2003; NCT00001723; Yanovski 2011); these open‐label phases were not included in our analyses. Participants in one of these trials were also followed up for two years after the open‐label phase (NCT00001723). None of the included trials were terminated before regular end; however, two trials that we identified from ClinicalTrials.gov were terminated before enrolment and have been placed in the excluded trials section (see Characteristics of excluded studies table).
Settings
Nine of the 21 trials were conducted in the USA (Berkowitz 2003; Berkowitz 2006; Chanoine 2005; Freemark 2001; Maahs 2006; Mauras 2012; NCT00001723; Wilson 2010; Yanovski 2011). The other trials were completed in Turkey (Atabek 2008; Ozkan 2004), Canada (Chanoine 2005; Clarson 2009), Brazil (Franco 2014; Godoy‐Matos 2005), Mexico (García‐Morales 2006), the UK (Kendall 2013), Australia (Srinivasan 2006), Chile (Prado 2012), Iran (Rezvanian 2010), the Netherlands (Van Mil 2007), Germany (Wiegand 2010), and Switzerland (Wiegand 2010). All trials were performed in an outpatient setting apart from three trials which had both an inpatient and outpatient setting (Freemark 2001; Maahs 2006; Yanovski 2011).
Participants
The participating population consisted of the following: mainly obese children or adolescents (Maahs 2006 also included overweight participants). The mean age of the participants in the trials ranged from 10.1 to 16.3 years with only two trials having a mean age less than 12 years old (Atabek 2008; Yanovski 2011). Two studies required all participants to be postmenarchal (Berkowitz 2003; Prado 2012), while Yanovski 2011 only included children who were prepubertal or early pubertal. Fifteen trials included participants from high‐income countries, and six recruited participants from middle‐income countries (Atabek 2008; Franco 2014; García‐Morales 2006; Godoy‐Matos 2005; Ozkan 2004; Rezvanian 2010) ‐ based on the World Bank list of economies July 2015 (World Bank 2015). Ethnic groups were distributed as follows: six trials did not report on ethnic groups (Atabek 2008; Franco 2014; Ozkan 2004; Prado 2012; Rezvanian 2010; Van Mil 2007); one trial reported all their participants were white (Clarson 2009), three trials reported approximately 75% of their population were white (Chanoine 2005; Kendall 2013; Wiegand 2010); five trials reported approximately half of their population were white (Berkowitz 2003; Berkowitz 2006; Freemark 2001; Mauras 2012; Wilson 2010); one trial reported that approximately 60% of their population were Hispanic (Maahs 2006); one trial reported approximately 50% of their population were non‐Hispanic (Yanovski 2011); 63% of participants in one trial were non‐Hispanic black people while the remaining were non‐Hispanic white people (NCT00001723); and one trial reported that 64% of their participants came from ethnic backgrounds with a high prevalence of insulin resistance and metabolic syndrome (Srinivasan 2006). Participants' sex was not distributed evenly in 11 trials (Berkowitz 2003; Berkowitz 2006; Chanoine 2005; Freemark 2001; Godoy‐Matos 2005; Kendall 2013; Maahs 2006; NCT00001723; Prado 2012; Wiegand 2010; Wilson 2010). Three trials reported glycosylated haemoglobin A1c (HbA1c) at baseline and the mean HbA1c ranged from 5.3% to 5.6% (Freemark 2001; Maahs 2006; Wilson 2010). The mean BMI at baseline for the interventions groups ranged from 26.5 kg/m2 to 41.5 kg/m2. The BMI at baseline for the comparator groups ranged from 26.2 kg/m2 to 41.7 kg/m2. Thirteen trials reported comorbidities of participants at baseline (Atabek 2008; Berkowitz 2006; Chanoine 2005; Clarson 2009; Freemark 2001; García‐Morales 2006; Kendall 2013; Mauras 2012; NCT00001723; Prado 2012; Srinivasan 2006; Wiegand 2010; Yanovski 2011), all but one trial (Freemark 2001) reported cointerventions in participants, and four trials had comedications used by participants (NCT00001723; Ozkan 2004; Wilson 2010; Yanovski 2011). Criteria for entry into the individual trials are outlined in the Characteristics of included studies table. Major trial exclusion criteria were major illnesses such as type 1 or 2 diabetes mellitus or cardiovascular disease; pregnancy; major psychiatric disorders; taking or previously taken medication known to influence body composition or contradiction to the drug therapy; cigarette smoking or alcohol use; obesity associated with genetic disorders; and eating disorders such as bulimia. Adherence/compliance with the intervention was reported in most trials as good (70% or more) and was usually assessed by pill counts.
Diagnosis
All trials included participants who were defined as obese at baseline according to the growth reference they used, apart from one trial (Maahs 2006), which also included overweight children in their inclusion criteria. Seven trials define obesity using the 95th percentile or greater cut‐off on the Centers for Disease Control and Prevention (CDC; Kuczmarski 2000) charts (Atabek 2008; Clarson 2009; García‐Morales 2006; Mauras 2012; Rezvanian 2010; Wilson 2010; Yanovski 2011), but Wilson 2010 also required their participants to weigh less than 136 kg. One trial used greater than 85th percentile (to include also overweight participants) (Maahs 2006), while Van Mil 2007 used the 97th percentile or greater but also further selected for triceps skinfold thickness 97th percentile or greater for age and sex. NCT00001723 defined obesity by BMI for age and triceps skinfold above the 95th percentile (determined by National Health and Nutrition Examination Survey (NHANES) I age‐, sex‐ and race‐specific data) and all participants were required to be over 60 kg in bodyweight. Alternatively two trials used the definition of obesity given by Rosner 1998 of two units more than the US weighted mean of the 95th percentile but no greater than 44 kg/m2 (Berkowitz 2006; Chanoine 2005). One trial used the IOTF (Cole 2000) definitions for obesity (Srinivasan 2006), while another used the WHO (WHO 1995) growth standards cut‐off (Franco 2014). Kendall 2013 used the UK BMI growth charts (Cole 1995), and used the 98th centile as the cut‐off for obesity. One trial used German references (Kromeyer‐Hausschild 2001) to define obesity using greater than 97th percentile (Wiegand 2010). Three trials used raw BMI to define obesity: BMI greater than 30 kg/m2 (Freemark 2001); BMI 32 kg/m2 to 44 kg/m2 (Berkowitz 2003); and BMI 30 kg/m2 to 45 kg/m² (Godoy‐Matos 2005). In two trials, it was unclear which growth reference charts they were referring to (Ozkan 2004; Prado 2012). Participants were diagnosed with type 1 or 2 diabetes mellitus in none of our included trials. However, some trials included additional inclusion criteria other than age and obesity: Atabek 2008 required all participants to have hyperinsulinaemia; Clarson 2009 only included participants who were insulin resistant (defined by homeostasis model assessment (HOMA) for insulin resistance values greater than 3); Godoy‐Matos 2005 required all participants to have an adult bone age determined by left hand radiography (Greulich‐Pyle method); Kendall 2013 only included participants who had impaired glucose tolerance or hyperinsulinaemia; NCT00001723 only recruited participants who had comorbidities at baseline and these included hypertension, hyperinsulinaemia and hepatic steatosis; Srinivasan 2006 only included participants where there was a suspicion of insulin resistance (fasting insulin to glucose ratio greater than 4.5 or presence of acanthosis nigricans); Prado 2012 required all participants to present with at least one risk factor for type 2 diabetes (e.g. first‐ or second‐degree relative with history of type 2 diabetes); Mauras 2012 only included participants who had normal glucose tolerance but also had elevated highly sensitive C‐reactive protein (hsCRP), fibrinogen concentrations or both; Freemark 2001 inclusion criteria included a fasting insulin concentration exceeding 15 IU/mL and at least one first‐ or second‐degree relative with type 2 diabetes; and Yanovski 2011 required all participants to have hyperinsulinaemia (defined as fasting insulin 15 IU/mL or greater). All participants in Wiegand 2010 presented with comorbidities at baseline (features of the metabolic syndrome); however, this did not appear to be an inclusion criterion.
Interventions
Eleven trials used metformin as their pharmacological intervention (Atabek 2008; Clarson 2009; Freemark 2001; Kendall 2013; Mauras 2012; Prado 2012; Rezvanian 2010; Srinivasan 2006; Wiegand 2010; Wilson 2010; Yanovski 2011). The intervention was administered orally and varied between one and four times per day. Between trials, the daily dosage of metformin varied between 500 mg and 2000 mg, with a mean daily dosage of 1364 mg. Four metformin trials reported treatment before the start of the trial (Kendall 2013; Rezvanian 2010; Wiegand 2010; Wilson 2010); this included a healthy 'lifestyle' advice sheet, lifestyle modification treatment and a six‐month multiprofessional lifestyle intervention. Seven trials had a titration period, consisting of increasing the number of tablets taken over a period of weeks until the maximum dosage was tolerated (Clarson 2009; Kendall 2013; Mauras 2012; Rezvanian 2010; Srinivasan 2006; Wilson 2010; Yanovski 2011). Two trials did not have a matching placebo in the comparator group ‐ participants received a lifestyle intervention only (Clarson 2009; Mauras 2012). The duration of treatment ranged from 12 weeks/three months to six months with a mean treatment duration of 5.5 months.
Six trials used sibutramine as their intervention (Berkowitz 2003; Berkowitz 2006; Franco 2014; García‐Morales 2006; Godoy‐Matos 2005; Van Mil 2007). In all six trials, the drug was administered orally once daily. The daily dosage of sibutramine varied between 5 mg and 15 mg, with a mean daily dose of 11 mg. Three trials reported that participants received treatment before the start of the trial (Franco 2014; García‐Morales 2006; Godoy‐Matos 2005); this included dietetic advice/counselling and a six‐month lifestyle intervention. Two trials had a titration period (Berkowitz 2003; Van Mil 2007). All trials had a matching placebo as the comparator intervention. The duration of treatment ranged from 12 weeks to 12 months, with a mean treatment duration of 6.5 months.
Four trials gave orlistat to their intervention group (Chanoine 2005; Maahs 2006; NCT00001723; Ozkan 2004). The drug was administered orally three times per day and the daily dosage of orlistat was 360 mg in all four trials. No trials gave participants any treatment before the trial. One trial did not give a matching placebo to the comparator group ‐ participants received a lifestyle intervention only (Ozkan 2004). The duration of treatment ranged from six months to 12 months, with a mean treatment duration of 8.9 months.
One trial also included two additional intervention arms: metformin plus fluoxetine and fluoxetine only (Rezvanian 2010). The drugs were given by the oral route once daily. The daily dose of fluoxetine was 20 mg. Participants were also given lifestyle modification treatment before the start of the trial. They also had a titration period. The comparator group received a matching placebo. The duration of treatment was 12 weeks.
Outcomes
Fourteen trials explicitly stated a primary endpoint in the publication (Berkowitz 2003; Berkowitz 2006; Chanoine 2005; Clarson 2009; García‐Morales 2006; Godoy‐Matos 2005; Kendall 2013; Maahs 2006; Mauras 2012; Prado 2012; Van Mil 2007; Wiegand 2010; Wilson 2010; Yanovski 2011), 10 trials reported 'secondary' endpoints (Berkowitz 2003; Berkowitz 2006; Chanoine 2005; García‐Morales 2006; Godoy‐Matos 2005; Kendall 2013; Maahs 2006; Wiegand 2010; Wilson 2010; Yanovski 2011). NCT00001723 had no publication attached; however, the trial authors reported both a primary and secondary endpoint on the clinical trials website. The most commonly defined primary outcomes in publications were change in absolute BMI, change in BMI z score/standard deviation score (SDS) and change in bodyweight. The most commonly defined primary outcomes in trial protocols were change in BMI from baseline and per cent change in BMI.
Reporting of endpoints
Twenty‐one trials collected a mean of 14 (range four to 25) outcomes. All 21 trials measured raw BMI. Ten trials reported change in BMI z score/SDS (Berkowitz 2003; Clarson 2009; Freemark 2001; Kendall 2013; NCT00001723; Srinivasan 2006; Van Mil 2007; Wiegand 2010; Wilson 2010; Yanovski 2011). All 21 trials reported on whether adverse events occurred. Of those trials which reported adverse events, some reported the total number of adverse events whilst others reported the total number of participants who experienced at least one adverse event. We asked all authors to provide further details on adverse events, such as how many participants experienced severe adverse events and if so, whether they were hospitalised. Two trials measured health‐related quality of life with validated questionnaires (García‐Morales 2006; Maahs 2006). Seventeen trials reported that they measured body fat distribution. Fifteen trials measured waist circumference, hip circumference, or both (Berkowitz 2003; Berkowitz 2006; Chanoine 2005; Clarson 2009; Franco 2014; García‐Morales 2006; Godoy‐Matos 2005; Kendall 2013; Mauras 2012; Prado 2012; Rezvanian 2010; Srinivasan 2006; Wiegand 2010; Wilson 2010; Yanovski 2011). Seven trials measured body fat mass by DEXA (Chanoine 2005; Mauras 2012; NCT00001723; Srinivasan 2006; Van Mil 2007; Wilson 2010; Yanovski 2011). Two trials also measured body fat mass by bioelectrical impedance (Maahs 2006; Wiegand 2010). Six trials measured behaviour change (Atabek 2008; Berkowitz 2003; García‐Morales 2006; Kendall 2013; Maahs 2006; Van Mil 2007). Five trials measured food consumption through dietary records or questionnaires (Atabek 2008; García‐Morales 2006; Kendall 2013; Maahs 2006; Van Mil 2007), and one trial measured the feeling of hunger (Berkowitz 2003). Two trials measure changes in physical activity: Kendall 2013 used a physical activity questionnaire and Van Mil 2007 measured total energy expenditure which accounts for level of physical activity. Only one trial investigated morbidity defined as illness or harm associated with the intervention (Chanoine 2005). One trial reported a death from suicide (Maahs 2006). Berkowitz 2006 reported two suicide attempts which did not result in death.
No trials assessed participants' views or socioeconomic effects as outcomes. For a summary of all outcomes assessed in each trial, see Appendix 5.
Excluded studies
We excluded 135 trials or trial records after careful evaluation of the full publication. The main reasons for exclusion were the participants were adults or had a mean age of more than 18 years, the trial design was not an RCT, the duration of treatment was less than three months or the duration of follow‐up was less than six months. For further details, see Characteristics of excluded studies table.
Risk of bias in included studies
For details on risk of bias of included trials see Characteristics of included studies table. For an overview of review authors' judgements about each risk of bias item for individual trials and across all trials, see Figure 2 and Figure 3. We investigated performance bias, detection bias and attrition bias separately for objective and subjective outcome measures.

Risk of bias graph: review authors' judgements about each risk of bias item presented as percentages across all included trials.

Risk of bias summary: review authors' judgements about each risk of bias item for each included trial.
Allocation
Fifteen trials reported allocation was concealed (Berkowitz 2006; Chanoine 2005; Franco 2014;Freemark 2001; García‐Morales 2006; Godoy‐Matos 2005; Kendall 2013; Mauras 2012; NCT00001723; Prado 2012; Rezvanian 2010; Srinivasan 2006; Wiegand 2010; Wilson 2010; Yanovski 2011); two trials did not conceal allocation (Clarson 2009; Ozkan 2004). It was unclear whether four trials concealed allocation (Atabek 2008; Berkowitz 2003; Rezvanian 2010;Wiegand 2010) ). Fourteen trials reported an adequate random sequence generation (Berkowitz 2006; Chanoine 2005; Clarson 2009; Franco 2014; Freemark 2001; García‐Morales 2006; Kendall 2013; Mauras 2012; NCT00001723; Prado 2012; Rezvanian 2010; Srinivasan 2006; Wilson 2010; Yanovski 2011). Two trials reported random sequence generation was inadequate; hence, would have likely of introduced bias (Maahs 2006; Ozkan 2004).Five trials did not describe the randomisation process (Atabek 2008; Berkowitz 2003; Godoy‐Matos 2005; Van Mil 2007; Wiegand 2010).
Blinding
All 21 trials reported both objective and subjective outcomes. The main objectives outcomes were BMI, weight, waist or hip circumference, blood pressure, cholesterol insulin, glucose and triglycerides, whilst the main subjective outcomes were adverse events, food consumption and health‐related quality of life. Subjective outcomes tended to be self‐reported (e.g. quality of life and dietary questionnaires), while objective measures usually were investigator‐assessed (e.g. BMI, waist circumference). Adverse events could be either self‐reported or investigator assessed.
Ten trials explicitly stated that blinding of the participants, personnel and outcome assessors was undertaken (Berkowitz 2003; Berkowitz 2006; Franco 2014; Maahs 2006; NCT00001723; Rezvanian 2010; Srinivasan 2006; Van Mil 2007; Wilson 2010; Yanovski 2011). Seven trials reported that double blinding took place (Atabek 2008; Chanoine 2005; Freemark 2001; García‐Morales 2006; Godoy‐Matos 2005; Kendall 2013; Wiegand 2010), but only three of the trials' authors confirmed this meant blinding was undertaken of participants, personnel and outcomes assessors (Chanoine 2005; Freemark 2001; Godoy‐Matos 2005). No trials reported that single blinding was undertaken. Six trials did not provide sufficient information about blinding procedures (Atabek 2008; García‐Morales 2006; Kendall 2013; Ozkan 2004; Prado 2012; Wiegand 2010).
Incomplete outcome data
Twenty trials that had losses to follow‐up described the number of trial withdrawals (Berkowitz 2003; Berkowitz 2006; Chanoine 2005; Clarson 2009; Franco 2014; Freemark 2001; García‐Morales 2006; Godoy‐Matos 2005; Kendall 2013; Maahs 2006; Mauras 2012; NCT00001723; Ozkan 2004; Prado 2012; Rezvanian 2010; Srinivasan 2006; Van Mil 2007; Wiegand 2010; Wilson 2010; Yanovski 2011). Twelve trials used ITT analyses (Berkowitz 2003; Berkowitz 2006; Chanoine 2005; García‐Morales 2006; Godoy‐Matos 2005; Kendall 2013; Maahs 2006; NCT00001723; Rezvanian 2010; Van Mil 2007; Wilson 2010; Yanovski 2011). One trial did not report whether there were any losses to follow‐up (Atabek 2008). Five trials did not provide detailed descriptions of participants' withdrawals and reasons underpinning them (Atabek 2008; Franco 2014; Freemark 2001; García‐Morales 2006; Mauras 2012). Four trials had attrition rates greater than 30% with possible impact on the outcomes(Chanoine 2005; Franco 2014; Mauras 2012; Prado 2012;Wilson 2010).
Selective reporting
Only nine trials provided a clinical trial identifier or reference to a protocol (Berkowitz 2003; Berkowitz 2006; Kendall 2013; Mauras 2012; NCT00001723; Srinivasan 2006; Wiegand 2010; Wilson 2010; Yanovski 2011); however, we were unable to source the clinical trial entry of one trial (Wiegand 2010). Three trials had a high risk of reporting bias after failure to report results for one or more outcomes they described as having measured (Atabek 2008; García‐Morales 2006; Maahs 2006), and a further trial had a high risk due to differences in results reported on the clinical trial website and in a conference abstract (NCT00001723). The remaining trials had unclear risk of reporting bias due to no protocol being available.
Other potential sources of bias
Seven trials were at high risk of other biases. These biases included: the trial not including a power calculation (Atabek 2008; Clarson 2009; Franco 2014; Freemark 2001; Godoy‐Matos 2005; Ozkan 2004), the trial lacking methodological detail (Atabek 2008; Franco 2014) and the trial not adjusting for baseline differences (Freemark 2001; Ozkan 2004), The remaining 14 trials were at unclear risk of other potential sources of bias. It is important to note that the trials which do not include a power calculation may not be powered to detect differences in their primary outcome. BMI or weight was the primary outcome in all but two trials (Mauras 2012; Wiegand 2010) that included a power calculation. Mauras 2012 and Wiegand 2010 may not have been adequately powered to detect differences in BMI or weight. With regards to adverse events and the review's secondary outcomes (e.g. morbidity), it is likely that most trials would not have been powered to detect differences in these outcomes. Hence, these results should be interpreted with caution.
Effects of interventions
Baseline characteristics
For details of baseline characteristics, see Appendix 3 and Appendix 4.
Pharmacological intervention versus comparators
We performed the meta‐analyses with CMA software version 3 and aligned with the data in the Review Manager 5 (RevMan 2014) meta‐analyses. Because the cross‐over design did not appear suitable for our research question due to inadequate washout periods and noncomparable baseline measures in the two cross‐over periods, we excluded Franco 2014 and Srinivasan 2006 from all meta‐analyses. We also excluded Rezvanian 2010 from the meta‐analyses because the reported SDs were unreliably small in comparison to all other published SDs of included trials and probably denoted standard errors. We excluded two further trials because of substantial methodological concerns (Ozkan 2004; Prado 2012). In addition, Prado 2012 did not report change in BMI from baseline to follow‐up and Ozkan 2004 did not have a consistent follow‐up time frame across all participants.
Primary outcomes
Body mass index and bodyweight
We included 16 trials in the meta‐analysis of BMI. Most of the BMI data were from the publications, except for Chanoine 2005 and Freemark 2001, where raw BMI, SDs or both were not available; hence, we obtained additional data from the trial authors. We extracted data for NCT00001723 from the ClinicalTrials.gov website. In the meta‐analysis, we included trials which had either a six‐month or 12‐month follow‐up from baseline (Berkowitz 2006; Wilson 2010), which was the endpoint in most of the trials. However, even though Chanoine 2005 had a 12‐month follow‐up, we only had data available at six months from baseline. Wilson 2010 provided data at 100 weeks' follow‐up but we did not include these in the meta‐analysis.
The summary estimate across all pharmacological interventions versus all comparators (metformin, orlistat or sibutramine mostly versus placebo ‐ usually combined with behaviour changing interventions) showed a MD in BMI change of ‐1.3 kg/m2 (95% CI ‐1.9 to ‐0.8; P < 0.00001; 16 trials; 1884 participants; low certainty evidence ‐ Analysis 1.1) in favour of the drug interventions. Heterogeneity was considerable (I2 = 77%).
In Wilson 2010, which reported a BMI change at 100 weeks from baseline (48 weeks of metformin or placebo treatment, then a 48‐week drug‐free period), the metformin group increased their BMI during the drug‐free period (+0.5) while the placebo group decreased their BMI (‐0.8), measured as the difference between 52 and 100 weeks from baseline. In the metformin plus fluoxetine trial, the fluoxetine only group had a decrease in BMI of ‐0.6 (SD 0.1) and the metformin plus fluoxetine group had a decrease in BMI of ‐0.9 (SD 0.02), compared to an increase of 0.2 (SD 0.04) in the placebo group at 24 weeks from baseline.
Only 11 trials reported weight data at baseline or follow‐up (or change from baseline) in their publications; hence, we only included these trials in the meta‐analysis. Data were reported at six months from baseline apart from one trial (Berkowitz 2006), which reported the change in weight at 12 months from baseline. The summary estimate across all pharmacological interventions versus comparators (metformin, orlistat or sibutramine mostly versus placebo ‐ usually combined with behaviour changing interventions) showed an MD in change in weight of ‐3.9 kg (95% CI ‐5.9 to ‐1.9; P < 0.00001; 11 trials; 1180 participants; low certainty evidence ‐ Analysis 2.1) in favour of the drug interventions. Heterogeneity was considerable (I2 = 79%).
Adverse events
Only three trials had sufficiently long exposure times to evaluate adverse events possibly associated with drug interventions for obesity in children and adolescents: one trial with 39 participants randomised to metformin treatment for 100 weeks (Wilson 2010), one trial with 368 participants randomised to sibutramine treatment for 12 months (Berkowitz 2006), and one trial with 357 participants randomised to orlistat treatment for 54 weeks (Chanoine 2005).
Adverse events were reported to have occurred in all 11 metformin trials except from Clarson 2009, which reported that metformin was well tolerated, and the author clarified no adverse events occurred. Gastrointestinal adverse events were most commonly reported with one metformin trial reporting that gastrointestinal adverse events were statistically more prevalent in the intervention group compared to the control group (Yanovski 2011). However, Wiegand 2010 reported such events occurred more frequently in the placebo group. Kendall 2013 reported adverse events were more common in the metformin group and were mainly gastrointestinal. Atabek 2008 reported that two metformin‐treated participants experienced diarrhoea, mild abdominal pain/discomfort, or both. Freemark 2001 also reported three participants experienced transient abdominal discomfort or diarrhoea, however so did one placebo participant. Wilson 2010 reported that the most common adverse events included headache, nausea, vomiting, upper respiratory tract infection and musculoskeletal complaints; however, none were statistically different between the metformin and placebo groups. One trial showed the fatigue was more common in the metformin‐treated children (Yanovski 2011). Furthermore, Freemark 2001 reported one case of an exacerbation of migraine and one case of transient nausea in the metformin arm. Nausea was reported in the Srinivasan 2006 trial where two participants were unable to tolerate a higher dose of metformin (1 g); however, they tolerated a lower dose and continued in the trial. Yanovski 2011 also reported that levels of serum vitamin B12 were reduced in the metformin group compared with an increase in the placebo group ‐ this difference was statistically significant. Rezvanian 2010 reported two cases of headache, two cases of abdominal pain and three cases of loose stools in the metformin arm but they were all minor and tolerable. Mauras 2012 reported metformin was well tolerated and safe, and the author added that the adverse effects between groups were comparable. Prado 2012 reported metformin was well tolerated by participants and both groups showed a significant increase in alanine transaminase (ALT) and aspartate transaminase (AST), and a reduction in haemoglobin levels, but these were within the normal ranges.
Three of six trials on sibutramine therapy reported on adverse events: one large trial showed tachycardia, dry mouth, constipation, dizziness, insomnia and hypertension were all reported more frequently by sibutramine participants than by placebo participants (Berkowitz 2006). Sibutramine‐treated participants also had a higher blood pressure and pulse rate at 12 months' follow‐up compared to the placebo‐treated participants (Berkowitz 2006). However, another trial reported that there was no statistically significant difference between changes in heart rate or blood pressure between the sibutramine and placebo groups, although abdominal cramps were significantly higher in the sibutramine group (Van Mil 2007). Godoy‐Matos 2005 showed constipation was significantly higher in the sibutramine group compared to the placebo group.
All four orlistat trials reported on adverse events: gastrointestinal problems such as fatty stools, oily spotting and fecal urgency, along with headaches and upper respiratory tract infections, were the most common adverse effects. In the NCT00001723 trial, the prevalence of some gastrointestinal problems was higher in the orlistat group compared to the placebo group and this included: fatty‐appearing stools, bloating/gas, frequent urge for bowel movement and uncontrolled passage of stool or oil. Chanoine 2005 reported that gastrointestinal tract‐related adverse events were more common in the orlistat group compared to the placebo group; however, most were classed as mild to moderate intensity. Maahs 2006 also reported that the orlistat group had significantly increased gastrointestinal adverse events (e.g. soft stools, oily spotting) compared to the placebo group. Mild gastrointestinal complaints (frequent stools) were experienced by all orlistat‐receiving participants in the Ozkan 2004 trial. Chanoine 2005 also reported that 10 orlistat and one placebo participant showed abnormalities detected on electrocardiograms; however, an independent cardiologist concluded that none were connected to the treatment; in addition, levels of oestradiol in girls decreased in the orlistat group versus a slight increase in the placebo group (P = 0.05). Symptomatic gallstones were also seen in six orlistat participants which were not seen at baseline (five of these participants had lost large amounts of weight).
In the trial which included a fluoxetine arm, there were five adverse events with regards to the drug which included three cases of dry mouth and two cases of loose stool; these were all considered as minor and tolerable, and reported as transient (Rezvanian 2010).
Serious/severe adverse events were also investigated: most trials did not report how they defined a serious/severe adverse event. It was also unclear in four trials whether a serious/severe adverse event actually occurred (Berkowitz 2003; Ozkan 2004; Van Mil 2007; Wiegand 2010). Only five trials reported that a serious or severe adverse event occurred (Berkowitz 2006; Chanoine 2005; Maahs 2006; NCT00001723; Wilson 2010); the remaining 12 trials reported that there were no serious or severe adverse events.
Across all trials the RR for serious adverse events comparing drug interventions with comparators was 1.43 (95% CI 0.63 to 3.25; P = 0.39; 5 trials; 1347 participants; low certainty evidence ‐ Analysis 3.1). Absolute numbers experiencing a serious adverse event were 24/878 (2.7%) participants in the drug intervention groups versus 8/469 (1.7%) participants in the comparator groups.
In the metformin trials, only one trial reported that there were serious adverse events and these included one case of appendectomy and one case of leg vein thrombosis in the metformin group, but these were both seen as unrelated to the drug (Wilson 2010). One sibutramine trial reported that 2.7% of sibutramine‐treated participants experienced serious adverse events which included one case of excessive nausea and vomiting, one suicide attempt and five depression cases (Berkowitz 2006). The placebo group had one case of suicide attempt and one case of depression. Chanoine 2005 reported 3% of participants experienced at least one serious adverse event: the five events in the placebo group included acute demyelinating encephalomyelitis, facial palsy, pneumonia, worsening of asthma and pain in the right side; and the 11 events in the orlistat group included pilonidal abscess, depression, asthma attack, seizure, admission for repair of deviated nasal septum, appendicitis, cholelithiasis, gallbladder disorder followed by cholecystectomy, adenoidal hypertrophy and aseptic meningitis. It was only the case of cholelithiasis in the orlistat participant which was seen to be possibly related to the trial medication potentially due to rapid weight loss. Another orlistat trial reported two serious adverse events in the placebo group and these were one case of hypoglycaemia and one case of left lower quadrant pain and vomiting (NCT00001723).
In the sibutramine trials, 32 participants (24 in the intervention groups and eight in the control groups) left the trial because of adverse events. Berkowitz 2006 reported that withdrawals due to tachycardia were similar in both groups but hypertension led to the withdrawal of five participants in the sibutramine group versus none in the placebo group. Two cases of attempted suicide (one intervention and one placebo) also led to discontinuation but were considered unlikely to be related to the trial drug; one case of excessive nausea and vomiting in the sibutramine group also led to withdrawal and may have been related to the drug. Van Mil 2007 had one withdrawal from the sibutramine group due to symptoms of clinical depression and Berkowitz 2003 had one withdrawal from the placebo group.
In the metformin trials, nine participants withdrew due to adverse events (five in intervention group and four in placebo group). Wilson 2010 reported one participant from the metformin group withdrew due to nausea which was probably related to the drug, and a further two metformin and one placebo participants dropped out of the trial due to elevated levels of ALT. Gastrointestinal symptoms caused 6% of participants (one in metformin group and three in placebo group) to drop out of the Wiegand 2010 trial. In addition, Yanovski 2011 reported one participant dropped out of the metformin group due to medication intolerance.
Across all trials the RR for discontinuing the trial because of adverse events comparing drug interventions with comparators was 1.45 (95% CI 0.83 to 2.52; P = 0.19; 10 trials; 1664 participants; low certainty evidence ‐ Analysis 3.2). Absolute numbers discontinuing the trial because of an adverse event were 52/1043 (5.0%) participants in the drug intervention groups versus 17/621 (2.7%) participants in the comparator groups.
All four orlistat trials had dropouts due to adverse events; 28 participants (23 in the intervention group and five in the placebo group). Chanoine 2005 reported 12 dropouts (3%) in the orlistat group and three dropouts (2%) in the placebo group, mainly due to gastrointestinal adverse events. Ozkan 2004 reported seven participants (32%) dropped out of the orlistat group due to gastrointestinal complaints. Maahs 2006 reported two participants in the orlistat group discontinued due to adverse events (assumed to be gastrointestinal) and one participant in the orlistat group committed suicide. NCT00001723 reported one participant in the orlistat group and two participants in the placebo group dropped out of the trial due to medication intolerance.
For further details, see Appendix 9, Appendix 10, and Appendix 11.
Secondary outcomes
Health‐related quality of life
Two trials measured health‐related quality of life; the certainty of the evidence was very low. García‐Morales 2006 used the 36‐Item Short‐Form Health Survey (SF‐36) questionnaire and found changes in the total score were slightly higher in the sibutramine group compared to the placebo group, but this difference was not statistically significant. Maahs 2006 used three questionnaires to assess health‐related quality of life, but found no statistically significant differences between the orlistat and placebo group from baseline to six months. For further details on the health‐related quality of life measurements, see Appendix 14.
Body fat distribution
Eighteen trials reported outcomes which measured body fat distribution. Fifteen of these trials measured waist, hip, or both circumferences at baseline and follow‐up. In the metformin trials, Mauras 2012 found greater decreases in waist circumference in the metformin plus diet plus exercise group compared with the diet plus exercise group at six months' follow‐up. However, this trial was not placebo controlled. In addition, Srinivasan 2006, a cross‐over trial, reported a beneficial treatment effect on waist circumference in participants taking metformin for six months, when compared to six months of placebo. However, there was no statistically significant difference in waist circumference between the drug and control groups in Clarson 2009 and Prado 2012 trials at six months' follow‐up. Wilson 2010 measured waist circumference but did not report results. Two metformin trials also measured waist‐to‐hip ratio and found no statistically significant difference between groups at six months' follow‐up (Kendall 2013; Wiegand 2010). Yanovski 2011 also measured abdominal and hip circumference at six months' follow‐up, and found a statistically significant difference between metformin and placebo, in favour of the intervention. In the metformin plus fluoxetine trial, only the metformin plus fluoxetine arm had a statistically significant between‐group difference in waist circumference at 24 weeks from baseline (Rezvanian 2010). In the sibutramine trials, there was a statistically significant difference in waist circumference in favour of the intervention in five trials (Berkowitz 2003; Berkowitz 2006; Franco 2014; García‐Morales 2006; Godoy‐Matos 2005). Godoy‐Matos 2005 also reported a statistically significant reduction in hip circumference in the sibutramine group compared to the placebo group; however, there was no statistically significant difference for waist‐to‐hip ratio at six months. Only one orlistat trial measured waist circumference and found it increased in the placebo group but decreased in the orlistat group at one year' follow‐up (difference statistically significant); this was also seen for hip circumference (Chanoine 2005).
Seven trials measured body composition by DEXA. Four metformin trials and two orlistat trials measured body fat using DEXA. Three metformin trials found no statistically significant difference between groups in the percentage of body fat lost (Mauras 2012; Srinivasan 2006; Wilson 2010). However, one trial observed a statistically significant difference of 1.4 kg between the metformin and placebo groups, in favour of the intervention group at six months' follow‐up (Yanovski 2011). One sibutramine trial assessed body composition using underwater weighing and DEXA; however, there was no statistically significant difference in percentage of fat mass between groups. Chanoine 2005 reported they measured fat mass by DEXA in a subgroup of participants as a safety measure and the orlistat group lost more fat mass compared to the placebo group (P = 0.03). NCT00001723 found a slightly greater decrease in body fat (kg) in the orlistat group compared to the placebo group. Two trials estimated fat mass from bioimpedence analysis: one orlistat trial (Maahs 2006) and one metformin trial (Wiegand 2010), but they reported no statistically significant difference between intervention and placebo groups. Yanovski 2011 measured fat mass by air displacement plethysmography and found metformin participants had statistically significant decreases in their fat mass compared to placebo participants; they also measured intra‐abdominal fat by magnetic resonance imaging but found no statistically significant difference between groups. Srinivasan 2006 also used magnetic resonance imaging and found a beneficial treatment effect of metformin over placebo for subcutaneous abdominal adipose tissue but not visceral abdominal adipose tissue; Mauras 2012 also used this technique and found that intrahepatic fat only decreased in the nonplacebo control group. Wiegand 2010 used abdominal computer tomography (CT) scans to evaluate abdominal fat content but also found no statistically significant difference between metformin and placebo participants in the results.
Behaviour change
Six trials measured behaviour change; however, only two trials reported the results. Participants in three trials all completed a food frequency questionnaire at the beginning and end of the trial; however, no results were presented (Atabek 2008; García‐Morales 2006; Maahs 2006). Kendall 2013 assessed dietary habits and exercise levels through three previously validated questionnaires but were unable to analyse the data due to insufficient resources. Van Mil 2007 measured total energy expenditure, using the Maastricht protocol and included data from a seven‐day dietary record; however, the difference between the sibutramine and control groups after 12 weeks of intervention was not statistically significant. Physical activity level was also measured using an activity questionnaire, but there was no statistically significant difference between groups at 12 weeks. Changes in total energy expenditure and physical activity levels were not measured at 24‐week follow‐up due to unavailability of equipment.
Participants' views of the intervention
No trials investigated participants' views of the intervention.
Morbidity
Only one trial investigated morbidity defined as illness or harm associated with the intervention (Chanoine 2005). In the orlistat group, 6/352 (1.7%) participants developed new gallstones compared with 1/181 (0.6%) in the placebo group. The certainty of the evidence was very low.
Some trials investigated various risk indicators, mainly insulin resistance or insulin sensitivity and hyperinsulinaemia (Atabek 2008; Clarson 2009; Freemark 2001; Kendall 2013; Srinivasan 2006; Wiegand 2010; Yanovski 2011). García‐Morales 2006 investigated changes in blood pressure, glucose and triglycerides. Prado 2012 investigated glycaemia, insulin resistance and lipid profiles. Mauras 2012 investigated changes in hsCRP and fibrogen concentrations.
All‐cause mortality
One trial reported a death from suicide (Maahs 2006); the certainty of evidence was low. The authors reported that quality of life factors were screened extensively and the participant gave negative responses to quality of life questions specific to suicide and was also under the care of a psychiatrist for depression at the time of the trial. Berkowitz 2006 reported two suicide attempts (one in the intervention group and one in the placebo group).
Socioeconomic effects
No trials investigated socioeconomic effects.
For a summary of all outcomes assessed in each trial, see Appendix 5. For further explanation on how trial outcomes were defined, see Appendix 7 and Appendix 8.
Subgroup analyses
We performed subgroup analyses on our primary outcomes of BMI and weight. In our protocol, we specified we would analyse length of follow‐up; however, only two trials provided data at a time point greater than six months. There was too much heterogeneity to analyse the maintenance periods and most trials ended on completion of the intervention. In addition, there were only two trials which did not use a placebo; hence, we did not perform subgroup analyses based on type of control given. However, we performed subgroup analyses on BMI for the following factors: drug type (Analysis 1.2), dropout rates (Analysis 1.3), ITT analysis (Analysis 1.4), funding source (Analysis 1.5), publication date (Analysis 1.6), quality of trial (Analysis 1.7), country income (Analysis 1.8), and mean age of participants (Analysis 1.9).
Only two interaction tests for subgroup differences indicated statistically significant differences.
Comparing dropout rates less than 20% showed an MD in BMI change of ‐1.1 kg/m2 (95% CI ‐1.8 to ‐0.4; 9 trials), with dropout rates 20% or greater showed an MD in BMI change of ‐1.4 kg/m2 (95% CI ‐2.3 to ‐0.5; 6 trials), and with unclear dropout rates showed an MD in BMI change of ‐2.7 kg/m2 (95% CI ‐3.7 to ‐1.7; 1 trial). The P value for interaction was 0.03 and heterogeneity was substantial (I2 = 71%).
Comparing middle‐income countries with high‐income countries showed an MD in BMI change of ‐2.4 kg/m2 (95% CI ‐3.1 to ‐1.7; 3 trials) versus ‐1.1 kg/m2 (95% CI ‐1.6 to ‐0.6; 13 trials). The P value for interaction was 0.004 and heterogeneity was considerable (I2 = 88%).
For the outcome measure change in weight, only drug type could be used for a subgroup analysis and the interaction test for subgroup differences was not statistically significant (P = 0.52, I2 = 0%).
We also explored the effects of participant sex on the BMI point estimate, using a meta‐regression model in CMA. The proportion of boys at follow‐up (or baseline if not reported) in each study was selected as a covariate. We found that the coefficient of determination (r2) from this model was zero. The 95% CI for the meta‐regression slope was extremely wide either side of zero (‐6.3 to 4.1). We noted that some study authors only reported the percentage of boys and girls in the total sample at baseline and not at follow‐up.
Sensitivity analyses
Table 2 shows the sensitivity analyses on BMI change. Our first analysis removed the trials which only reported pre‐ and post‐BMI (not change scores) (Kendall 2013; Wiegand 2010), and hence required the use of a correlation coefficient of 0.78 (Bayer 2011) to predict the point estimates. This made very little difference in the point estimate. Only two trials had larger sample sizes (Berkowitz 2006; Chanoine 2005); however, when we removed these trials from the meta‐analysis the point estimate did not change. Furthermore, all trials in the meta‐analysis were published and were in English; hence, we could not perform a sensitivity analysis on these criteria. However, we performed a sensitivity analysis with allocation bias, blinding bias (participant and trial personnel, and assessor) and attrition bias by removing the high risk or unclear risk trials, and did not find substantial differences. This was also the case when we removed trials with higher drug dose and 12 months' follow‐up, as well as when we removed the trials with an active lifestyle intervention.
| Trials with data on mean change only | |
| Number of trials | 14 |
| Point estimate (95% CI) (kg/m2) | ‐ 1.5 (‐2.0 to ‐0.9) favouring drug intervention |
| Trials with concealment of allocation | |
| Number of trials | 12 |
| Point estimate (95% CI) (kg/m2) | ‐1.3 (‐1.8 to ‐0.7) favouring drug interventions |
| Trials with blinding of participants/personnel | |
| Number of trials | 10 |
| Point estimate (95% CI) (kg/m2) | ‐1.3 (‐1.9 to ‐0.7) favouring drug interventions |
| Trials with blinding of outcome assessors | |
| Number of trials | 10 |
| Point estimate (95% CI) (kg/m2) | ‐1.3 (‐1.9 to ‐0.7) favouring drug interventions |
| Trials without large sample size trials | |
| Number of trials | 14 |
| Point estimate (95% CI) (kg/m2) | ‐1.3 (‐1.8 to ‐0.7) favouring drug interventions |
| Trials with trials with 6 months' follow‐up only | |
| Number of trials | 14 |
| Point estimate (95% CI) (kg/m2) | ‐1.2 (‐1.7 to ‐0.7) favouring drug interventions |
| Trials without trials with higher drug dose | |
| Number of trials | 14 |
| Point estimate (95% CI) (kg/m2) | ‐1.2 (‐1.7 to ‐0.7) favouring drug interventions |
| Trials with trials with a high dose/active lifestyle intervention | |
| Number of trials | 10 |
| Point estimate (95% CI) (kg/m2) | ‐1.3 (‐1.9 to ‐0.7) favouring drug interventions |
| Trials without trials with high attrition | |
| Number of trials | 13 |
| Point estimate (95% CI) (kg/m2) | ‐1.4 (‐2.0 to ‐0.8) favouring drug interventions |
BMI: body mass index; CI: confidence interval.
We performed similar analyses for weight change (Table 3). We removed trials which did not report change in weight (Atabek 2008; Kendall 2013; Maahs 2006), and this resulted in a slightly greater reduction in the point estimate. We used the same correlation coefficient to calculate the mean change in weight (in the intervention and comparator groups) as we did for the BMI outcome (r = 0.78), although we were able to calculate an exact correlation coefficient in one trial (Maahs 2006) by using their reported BMI at baseline, follow‐up and change score (r = 0.975). Reductions in point estimates increased slightly when we removed trials with blinding (participant and trial personnel, and assessor) and attrition bias. This also occurred when we restricted the analysis to trials which also included a high‐dose behaviour change intervention. In the sensitivity analyses where we removed trials with high allocation concealment bias, high drug dose, large sample size or follow‐up greater than six months, point estimate reductions were slightly less than in the original analysis.
| Trials with data on mean change only | |
| Number of trials | 8 |
| Point estimate (95% CI) (kg) | ‐ 4.1 (‐6.3 to ‐1.8) favouring drug intervention |
| Trials with concealment of allocation | |
| Number of trials | 9 |
| Point estimate (95% CI) (kg) | ‐3.5 (‐5.8 to ‐1.2) favouring drug interventions |
| Trials with blinding of participants/personnel | |
| Number of trials | 7 |
| Point estimate (95% CI) (kg) | ‐4.2 (‐6.8 to ‐1.5) favouring drug interventions |
| Trials with blinding of outcome assessors | |
| Number of trials | 7 |
| Point estimate (95% CI) (kg) | ‐4.2 (‐6.8 to ‐1.5) favouring drug interventions |
| Trials without large sample size trials | |
| Number of trials | 10 |
| Point estimate (95% CI) (kg) | ‐3.4 (‐5.2 to ‐1.6) favouring drug interventions |
| Trials with 6 months' follow‐up only | |
| Number of trials | 9 |
| Point estimate (95% CI) (kg) | ‐3.5 (‐5.6 to ‐1.4) favouring drug interventions |
| Trials without trials with higher drug dose | |
| Number of trials | 10 |
| Point estimate (95% CI) (kg) | ‐3.4 (‐5.2 to ‐1.6) favouring drug interventions |
| Trials with trials with a high dose/active lifestyle intervention | |
| Number of trials | 6 |
| Point estimate (95% CI) (kg) | ‐4.3 (‐6.5 to ‐2.2) favouring drug interventions |
| Trials without trials with high attrition | |
| Number of trials | 9 |
| Point estimate (95% CI) (kg) | ‐4.4 (‐6.6 to ‐2.2) favouring drug interventions |
CI: confidence interval.
Assessment of reporting bias
We drew a funnel plot in CMA version 3 and Review Manager 5 for change in BMI as there was a sufficient number of trials (16) (Figure 4). The Egger's regression intercept was ‐0.75 (95% CI ‐3.2 to 1.7; P = 0.52); this suggests there was no evidence of reporting bias.

Funnel plot of comparison: 1 Body mass index (BMI): pharmacological interventions versus comparators, outcome: 1.1 Change in BMI (all trials) (kg/m2).
There was a similar finding when we drew a funnel plot for change in weight (11 trials) (Egger's regression intercept 1.7, 95% CI ‐3.5 to 6.8; P = 0.48) (Figure 5).

Funnel plot of comparison: 2 Weight: pharmacological interventions versus comparators, outcome: 2.1 Change in weight (all trials) (kg).
Ongoing trials
We found eight ongoing RCTs with four receiving metformin in the intervention group (EUCTR2010‐023061‐21; NCT00889876; NCT01677923; NCT02274948), two receiving topiramate (NCT01859013; NCT02273804), and two receiving exenatide (EUCTR2015‐001628‐45‐SE; NCT02496611). Three trials, originally identified as ongoing, have been moved into the 'awaiting classification' section because the trial has been completed but no results are available on the clinical trial website or through a publication (ISRCTN08063839; NCT00934570; NCT00940628). In addition, one trial which was originally classified as ongoing was moved to the 'awaiting classification' section because during the final stages of conducting the review we identified a new publication (via the MEDLINE email alert service), which included results from 18‐month follow‐up (van der Aa 2016, see NCT01487993 for a summary of the results). Results from this trial will be incorporated in the next update of the review. For two trials, we were unable to locate the source (Golebiowska 1981; Linquette 1971). In addition, we identified one conference abstract (Pastor 2014a, see EUCTR2010‐023061‐21) and one conference poster (Smetanina 2015). We attempted to contact both authors but only received a reply from Smetanina 2015, who confirmed the trial had been completed but these data were still being analysed.
Discussion
Summary of main results
We included 21 published RCTs and eight ongoing RCTs in this review. The included trials evaluated metformin (11 trials), sibutramine (six trials), orlistat (four trials), and one trial arm investigating the combination of metformin plus fluoxetine. The ongoing trials included four metformin, two topiramate and two exenatide trials. There were 2484 participants in the included trials, 1478 participants were randomised to drug intervention groups and 904 to comparator groups. All trials but three used a placebo in the comparator group. Two trials had a cross‐over design while the remaining 19 trials were parallel RCTs. The length of the intervention period ranged from 12 weeks to 48 weeks, and the length of follow‐up from baseline ranged from six months to 100 weeks. Overall there were small reductions in BMI (MD ‐1.3, 95% CI ‐1.9 to ‐0.8) and bodyweight change (MD ‐3.9 kg. 95% CI ‐5.9 to ‐1.9) in favour of the drug interventions. Five trials reported serious adverse events (24/878 (2.7%) participants in the intervention groups versus 8/469 (1.7%) participants in the comparator groups; RR 1.43, 95% CI 0.63 to 3.25; 1347 participants; low certainty evidence). A total of 52/1043 (5.0%) participants in the intervention groups versus 17/621 (2.7%) in the comparator groups discontinued the trial because of adverse events (RR 1.45, 95% CI 0.83 to 2.52; 10 trials; 1664 participants; low certainty evidence). The most common adverse events in orlistat and metformin trials were gastrointestinal. Common adverse effects in sibutramine trials included tachycardia, constipation and hypertension. The fluoxetine trial reported dry mouth and loose stools. One trials reported health‐related quality of life showing no marked differences between intervention and comparator. No trial reported the participants' views of the intervention or socioeconomic effects. Only one trial reported on morbidity associated with the intervention where there were more gallstones after the orlistat treatment. Trial authors reported one suicide in one of the orlistat intervention groups. However, the trials were not sufficiently long to investigate all‐cause mortality reliably. No trial investigated drug treatment for overweight children.
Overall completeness and applicability of evidence
We faced problems in meta‐analysing BMI as some trials did not report the raw data we required; therefore, we had to try and obtain this from the trial authors. In addition, age and sex are usually taken into account when measuring the weight status of a child because they are growing. However, in this review, we only assessed changes in raw BMI because previous research has shown short‐term changes in adiposity are best represented by changes in raw BMI units compared to BMI z scores or BMI centiles (Cole 2005; Kakinami 2014). Furthermore, only 10 trials reported changes in BMI z scores; therefore, we thought it was more appropriate to only meta‐analyse raw BMI, then this change could be converted into change in BMI z score (using the desired growth reference) ‐ which we have done in the conclusion section of this review.
All 21 trials measured adverse events; however, some trials reported the total number of participants who experienced at least one adverse event whilst others only reported the number of specific adverse events. Hence, we also had to attempt to obtain this information from the trial authors. Of the six trials which measured behaviour change, only two trials reported the results at follow‐up. Only two trials reported health‐related quality of life and they used different methods. Hence, more trials are needed to investigate how drugs used to treat obesity affect the participants' health‐related quality of life. No trials reported differences in participant views or socioeconomic effects.
Quality of the evidence
Based on the GRADE criteria, we rated the outcomes BMI, body weight, all‐cause mortality and adverse events as low. We downgraded the levels of evidence because of potential other risk of bias or reporting bias, inconsistency and imprecision. We rated health‐related quality of life and morbidity as very low certainty evidence, mainly because of the small number of participants, one trial only and imprecision.
Potential biases in the review process
We decided to perform unplanned subgroup analyses looking at funding and country as there were enough trials to divide them into groups. We were unable to analyse length of follow‐up, impact of maintenance periods and type of control group in the subgroup analyses as there were too few trials or too much heterogeneity. The meta‐analyses for BMI and weight included trials which differed in follow‐up length, behavioural interventions and drug dose. However, when sensitivity analyses were performed, the changes in point estimates were small.
We did not restrict our search strategy to any date, hence we have sifted through trials ranging back to the 1960s. However, we did not undertake any searches of the grey literature. We had some correspondence with most of trial authors, and some have supplied us with additional information including raw BMI data. Only seven trials gave clinical trial identifiers or protocols available; hence, it was difficult to assess whether reporting bias occurred. However, from the trials where a protocol/clinical trial entry was available, there was little evidence to suggest a source of reporting bias. We excluded a large number of trials because of follow‐up times less than six months, especially older trials, and this may have impacted on the overall findings from this review. In addition, we had difficulties calculating the number of adverse events in each trial due to different reporting metrics; for example, some trials reported the total number of adverse events in each group whilst others reported the total number of participants who suffered at least one adverse event. Despite our attempts to contact authors for additional information, we were still unable to meta‐analyse most of these findings.
Agreements and disagreements with other studies or reviews
Since the previous review (Oude Luttikhuis 2009), we identified one new orlistat trial; however, the reduction in BMI was similar to what was found previously. The reduction in BMI for the sibutramine trials found in this review was smaller than the change reported in the previous review; however, these data still favour the intervention. This difference is likely to be due to the inclusion of three extra sibutramine trials in the meta‐analysis. The previous review did not include a meta‐analysis of metformin trials.
Another review and meta‐analysis of the effect of orlistat and sibutramine on adolescent weight loss derived a difference in BMI of ‐2.3 kg/m2 for sibutramine (95% CI ‐2.9 to ‐1.8; 5 trials; 770 participants) and ‐1.7 kg/m2 for orlistat (95% CI ‐3.5 to 0.2; 3 trials; 621 participants) (Czernichow 2010). These point estimates reductions are greater than the ones derived in our review. However, the orlistat point estimate in the Czernichow 2010 review includes the Ozkan 2004 trial with a large BMI weight reduction which we excluded from the meta‐analysis in our review for not having a common follow‐up time across participants. In addition, the sibutramine analysis included data from a secondary analysis of white and African‐American participants from Berkowitz 2003 which may explain why the point estimate was different. In an earlier review, there was an MD of ‐0.7 kg/m2 (95% CI ‐1.2 to ‐0.3) in orlistat participants compared to placebo, which is consistent with our findings (McGovern 2008). There was a reduction of ‐2.4 kg/m2 (95% CI ‐3.1 to ‐1.8) in sibutramine trials, which is higher than the reduction we found (McGovern 2008). There were similar findings also found in another meta‐analysis where the reduction for sibutramine was an MD of ‐2.2 kg/m2 (95% CI ‐2.8 to ‐1.6; 4 trials; 686 participants) and the reduction for orlistat was an MD of ‐0.8 (95% CI ‐1.2 to ‐0.5; 2 trials; 573 participants) (Viner 2010).
In metformin trials, McDonagh 2014 determined an effect size of an MD of ‐1.2 kg/m2 (95% CI ‐1.6 to ‐0.7; 13 trials), which is similar to the point estimate found in this review. In addition, Bouza 2012 found a reduction of a MD of ‐1.2 kg/m2 (95% CI ‐1.8 to ‐0.5; 7 trials), in favour of metformin. An earlier review found a reduction of ‐1.4 kg/m2 (95% CI ‐2 to ‐0.8; 5 trials; 320 participants) in metformin trials (Park 2009); however, the review only included five trials and we excluded one of the trials in this review (Love‐Osborne 2008).
Overall findings from meta‐analyses of metformin, sibutramine and orlistat trials are similar to the ones presented in this review, and reasons for any differences are likely to derive from different inclusion criteria and our inclusion of more recent trials.

Trial flow diagram.

Risk of bias graph: review authors' judgements about each risk of bias item presented as percentages across all included trials.

Risk of bias summary: review authors' judgements about each risk of bias item for each included trial.

Funnel plot of comparison: 1 Body mass index (BMI): pharmacological interventions versus comparators, outcome: 1.1 Change in BMI (all trials) (kg/m2).
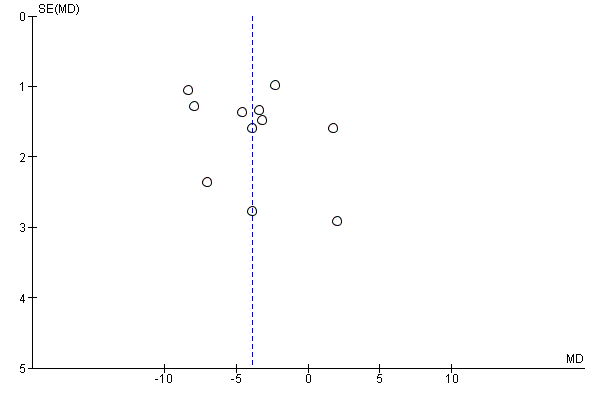
Funnel plot of comparison: 2 Weight: pharmacological interventions versus comparators, outcome: 2.1 Change in weight (all trials) (kg).

Comparison 1 Body mass index (BMI): pharmacological interventions versus comparators, Outcome 1 Change in BMI (all trials).

Comparison 1 Body mass index (BMI): pharmacological interventions versus comparators, Outcome 2 Change in BMI (drug type).

Comparison 1 Body mass index (BMI): pharmacological interventions versus comparators, Outcome 3 Change in BMI (dropout rate).

Comparison 1 Body mass index (BMI): pharmacological interventions versus comparators, Outcome 4 Change in BMI (intention‐to‐treat (ITT) analysis).

Comparison 1 Body mass index (BMI): pharmacological interventions versus comparators, Outcome 5 Change in BMI (funding).

Comparison 1 Body mass index (BMI): pharmacological interventions versus comparators, Outcome 6 Change in BMI (publication date).
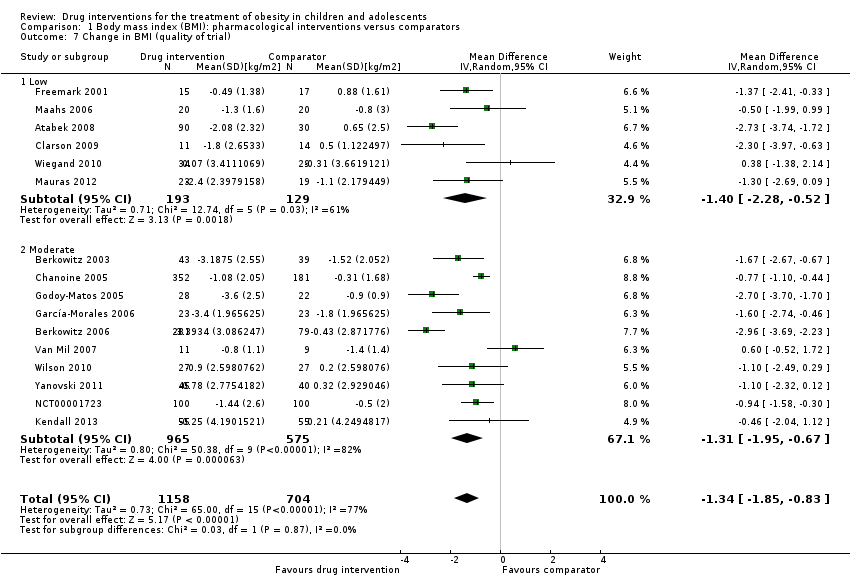
Comparison 1 Body mass index (BMI): pharmacological interventions versus comparators, Outcome 7 Change in BMI (quality of trial).
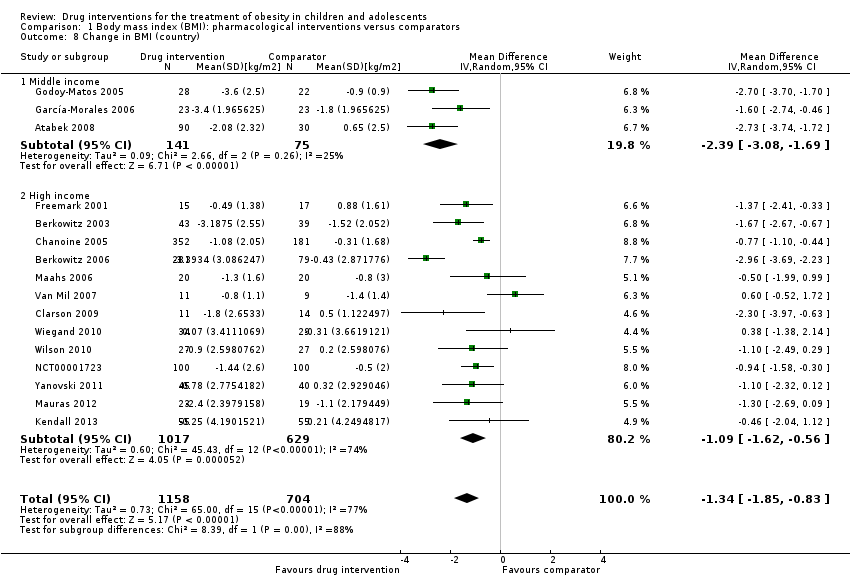
Comparison 1 Body mass index (BMI): pharmacological interventions versus comparators, Outcome 8 Change in BMI (country).

Comparison 1 Body mass index (BMI): pharmacological interventions versus comparators, Outcome 9 Change in BMI (mean age).
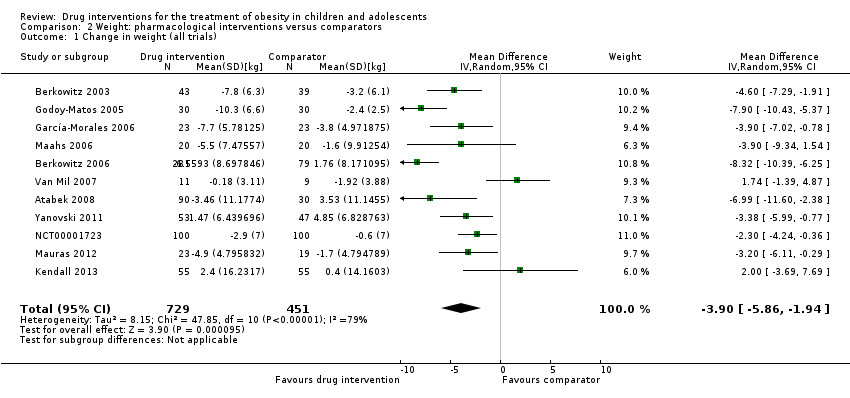
Comparison 2 Weight: pharmacological interventions versus comparators, Outcome 1 Change in weight (all trials).
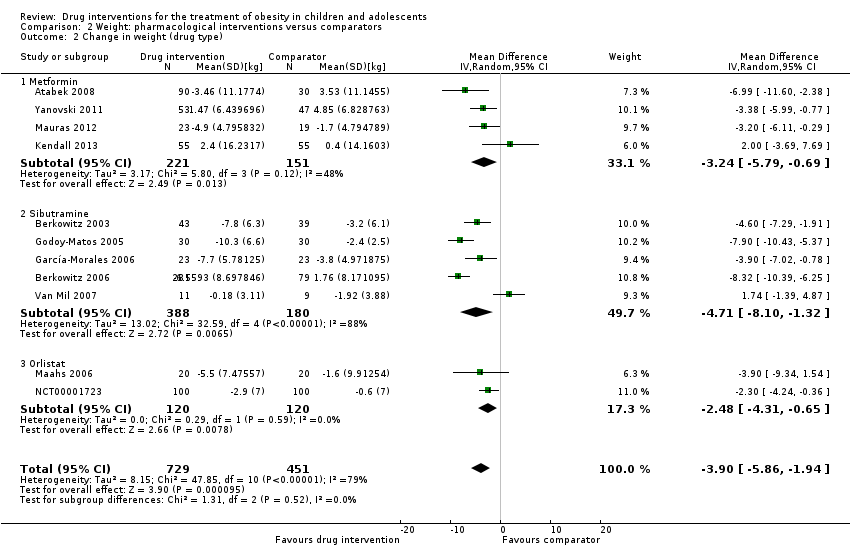
Comparison 2 Weight: pharmacological interventions versus comparators, Outcome 2 Change in weight (drug type).

Comparison 3 Adverse effects: pharmacological interventions versus comparator, Outcome 1 Serious adverse events.
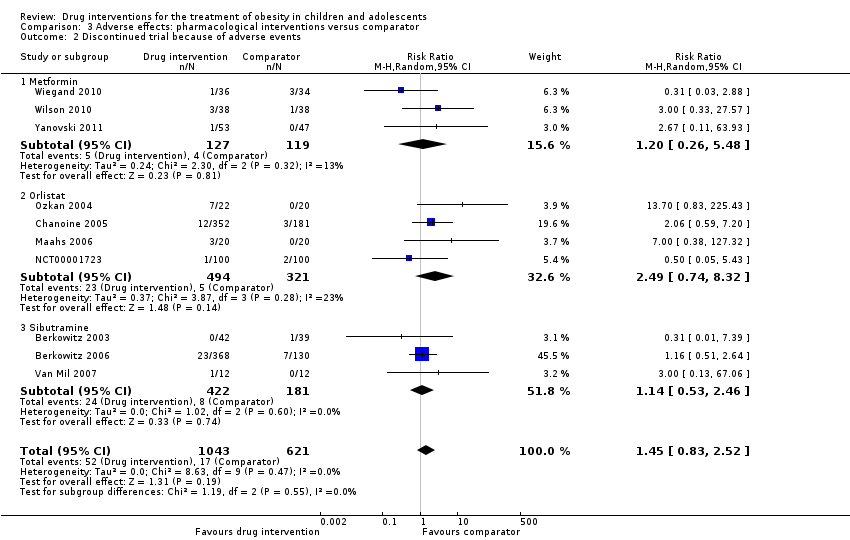
Comparison 3 Adverse effects: pharmacological interventions versus comparator, Outcome 2 Discontinued trial because of adverse events.
| Drug interventions for the treatment of obesity in children and adolescents | ||||||
| Population: obese children and adolescents Settings: mainly outpatient settings Intervention: metformin, orlistat, sibutramine usually combined with behaviour changing interventions Comparison: placebo or no placebo usually with behaviour changing interventions | ||||||
| Outcomes | Illustrative comparative risks* (95% CI) | Relative effect | No of participants | Quality of the evidence | Comments | |
| Assumed risk | Corresponding risk | |||||
| Comparator | Pharmacological intervention | |||||
| a. BMI (kg/m2) b. Body weight (kg) Follow‐up: 6 months (10 trials) ‐ 12 months (1 trial) | a. The mean reduction in BMI ranged across control groups from ‐1.8 to +0.9 b. The mean reduction in weight ranged across control groups from ‐3.8 kg to +4.9 kg | a. The mean reduction in BMI in the intervention groups was ‐1.3 higher (‐1.9 to ‐0.8 higher) b. The mean reduction in weight in the intervention groups was ‐3.9 kg higher (‐5.9 kg to ‐1.9 kg higher) | ‐ | a. 1884 (16) b. 1180 (11) | a. ⊕⊕⊝⊝ b. ⊕⊕⊝⊝ | ‐ |
| Adverse events a. Serious adverse events b. Discontinuation of trial because of adverse events Follow‐up: mostly 6 months, maximum 100 weeks (1 trial) | a. 17 per 1000 b. 27 per 1000 | a. 24 per 1000 (11 to 55) b. 40 per 1000 (23 to 69) | a.RR 1.43 (0.63 to 3.25) b.RR 1.45 (0.83 to 2.52) | a. 1347 (5) b. 1664 (10) | a. ⊕⊕⊕⊝ L owb b. ⊕⊕⊕⊝ Lowb | All trials reported if adverse events occurred; however, only 7/20 trials reported the number of participants who experienced at least 1 adverse event |
| Health‐related quality of life 3 questionnaires (1 trial) and SF‐36 (1 trial) Follow‐up: 6 months | See comment | See comment | See comment | 86 (2) | ⊕⊝⊝⊝ V ery lowc | Results were only reported for SF‐36 (1 trial on sibutramine, 46 children), there were no marked differences between intervention and comparator groups |
| All‐cause mortality Follow‐up: mostly 6 months, maximum 100 weeks (1 trial) | See comment | See comment | See comment | 2176 (20) | ⊕⊕⊕⊝ L owd | 1 suicide in the orlistat intervention group |
| Morbidity | See comment | See comment | See comment | 533 (1) | ⊕⊝⊝⊝ V ery lowe | Only 1 trial investigated morbidity defined as illness or harm associated with the intervention (Chanoine 2005). In the orlistat group 6/352 (1.7%) participants developed new gallstones compared with 1/181 (0.6%) in the placebo group |
| Socioeconomic effects | See comment | See comment | See comment | See comment | See comment | Not reported |
| *The basis for the assumed risk (e.g. the median control group risk across trials) is provided in footnotes. The corresponding risk (and its 95% confidence interval) is based on the assumed risk in the comparison group and the relative effect of the intervention (and its 95% CI). | ||||||
| GRADE Working Group grades of evidence | ||||||
| *Assumed risk was derived from the event rates in the comparator groups. aDowngraded by two levels because of potential other risk of bias, inconsistency and imprecision (see Appendix 13). | ||||||
| Trial | Intervention(s) and comparator(s) | Description of power and sample size calculation | Screened/eligible | Randomised | Safety | ITT | Finishing trial | Randomised finishing trial | Follow‐up timea |
| Atabek 2008b | I: metformin + diet and physical activity advice | ‐ | ‐ | 90 | 90 | ‐ | 90 | 100 | 6 months |
| C: placebo + diet and physical activity advice | 30 | 30 | ‐ | 30 | 100 | ||||
| total: | 120 | 120 | ‐ | 120 | 100 | ||||
| Berkowitz 2003 | I: behavioural programme + sibutramine | Powered to detect a 4% difference in % change in BMI between the 2 treatment groups with an SD of 5% (α = 0.05, β = 93%)c | 146 | 43 | 43 | 43 | 40 | 93.0 | 6 months (not including the 6‐month open‐label period where all participants received sibutramine) |
| C: behavioural programme + placebo | 39 | 39 | 39 | 34 | 87.2 | ||||
| total: | 82 | 82 | 82 | 62 | 75.6 | ||||
| Berkowitz 2006 | I: behavioural programme + sibutramine | "Planned sample size was approximately 400 participants with a 3:1 randomization ratio of sibutramine to placebo. On the basis of previous 12‐month adult trials, we determined that 300 participants in the sibutramine group would be adequate to assess safety and exposure, allowing an overall dropout rate of approximately 50% and a probability that approximately 50% of participants receiving 10 mg of sibutramine would lose 10% or more of initial BMI at 6 months" "Although the protocol did not document a formal sample size calculation for efficacy, approximately 132 adolescents (99 in the sibutramine group and 33 in the placebo group) would allow a between‐group difference in BMI of 2 kg/m2, with 90% power (2‐sided level of 0.05) to be statistically significant, assuming a common SD of 3 kg/m2)"d | ‐ | 368 | 368 | ‐ | 281 | 76.4 | 12 months |
| C: behavioural programme + placebo | 130 | 130 | ‐ | 80 | 61.5 | ||||
| total: | 498 | 498 | ‐ | 361 | 72.5 | ||||
| Chanoine 2005 | I: orlistat + diet + exercise + behaviour therapy | "We planned to enroll at least 450 individuals to provide more than 80% power to detect a difference of 1 BMI unit, assuming a 30% dropout rate" | 588 | 357 | 352 | 348 | 232 | 65.0 | 54 weeks |
| C: placebo + diet + exercise + behaviour therapy | 182 | 181 | 180 | 117 | 64.3 | ||||
| total: | 539 | 533 | 528 | 349 | 64.7 | ||||
| Clarson 2009 | I: metformin + lifestyle intervention | ‐ | 65 | 14 | ‐ | ‐ | 11 | 78.6 | 6 months |
| C: lifestyle intervention only | 17 | ‐ | ‐ | 14 | 82.4 | ||||
| total: | 31 | ‐ | ‐ | 25 | 80.6 | ||||
| Franco 2014 (cross‐over trial) | I: sibutramine + dietary guidance | ‐ | 73 | ‐ | ‐ | ‐ | ‐ | ‐ | 13 months |
| C: placebo + dietary guidance | ‐ | ‐ | ‐ | ‐ | ‐ | ||||
| total: | 63 | 63 | ‐ | 23 | 36.5 | ||||
| Freemark 2001 | I: metformin | ‐ | ‐ | 15 | ‐ | ‐ | 14 | 93.3 | 6 months |
| C: placebo | 17 | ‐ | ‐ | 15 | 88.2 | ||||
| total: | 32 | ‐ | ‐ | 29 | 90.6 | ||||
| Garcia‐Morales 2006 | I: sibutramine + diet + exercise | 13 participants per group (expectations: mean loss of 7.5 kg (SD 5.3) in the sibutramine group vs 3.6 kg (SD 4.5) in the placebo group)e | 70 | 26 | 26 | 23 | 21 | 80.8 | 6 months |
| C: placebo + diet + exercise | 25 | 25 | 23 | 19 | 76.0 | ||||
| total: | 51 | 51 | 46 | 40 | 78.4 | ||||
| Godoy‐Matos 2005 | I: sibutramine + hypocaloric diet + exercise | ‐ | ‐ | 30 | 30 | 30 | 28 | 93.3 | 24 weeks |
| C: placebo + hypocaloric diet + exercise | 30 | 30 | 30 | 22 | 73.3 | ||||
| total: | 60 | 60 | 60 | 50 | 83.3 | ||||
| Kendall 2013 | I: metformin + healthy lifestyle advice | "The target recruitment was 140 patients, based on a power calculation using the results of a previous study. A standard power calculation was used to detect a reduction in BMI of 0.15 kg/m2 (SD 0.3). Sixty‐four participants in each group give a statistical power of 80% for a t test at the 5% significance level. This was rounded up to allow for some loss to follow‐up but recognizing that adjustment using multifactorial analysis would likely enhance the trial power by an unpredictable amount"f | 234 | ‐ | 74 | 74 | 55 | ‐ | 6 months |
| C: placebo + healthy lifestyle advice | ‐ | 77 | 77 | 55 | ‐ | ||||
| total: | 155 | 151 | 151 | 110 | 71.0 | ||||
| Maahs 2006 | I: orlistat + diet and exercise therapy | "We determined that a clinically important mean difference in decrease in BMI between the orlistat and placebo groups would be 2.0 kg/m2 at 6 months and used an SD of 1.8. On the basis of this approach, a sample size of 15 subjects per group would be adequate to detect a 2.0 kg/m2 difference in Student’s t test with 80% power and alpha = 0.05. In order to allow for a 25% dropout rate, 20 subjects were randomized to each group"g | 43 | 20 | ‐ | 20 | 18 | 90.0 | 6 months |
| C: placebo + diet and exercise therapy | 20 | ‐ | 20 | 16 | 80.0 | ||||
| total: | 40 | ‐ | 40 | 34 | 85.0 | ||||
| Mauras 2012 | I: metformin + diet/exercise intervention | "Differences in hsCRP and fibrinogen concentrations at 6 months were the primary outcomes. An n = 42 completed subjects provided > 90 % power to detect significant changes" | ‐ | 35 | 35 | ‐ | 23 | 65.7 | 6 months |
| C: diet/exercise intervention | 31 | 31 | ‐ | 19 | 61.3 | ||||
| total: | 66 | 66 | ‐ | 42 | 63.6 | ||||
| NCT00001723 | I: orlistat + behavioural weight loss programme | ‐ | ‐ | 100 | 100 | 100 | 87 | 87.0 | 6 months |
| C: placebo + behavioural weight loss programme | 100 | 100 | 100 | 84 | 84.0 | ||||
| 200 | 100 | 100 | 171 | 85.5 | |||||
| Ozkan 2004 | I: conventional treatment (nutritional and lifestyle modification programmes) + orlistat | ‐ | ‐ | 22 | ‐ | ‐ | 15 | 68.2 | 5 to 15 months |
| C: conventional treatment: nutritional and lifestyle modification programmes | 20 | ‐ | ‐ | 15 | 75.0 | ||||
| total: | 42 | ‐ | ‐ | 30 | 71.4 | ||||
| Prado 2012 | I: metformin + nutritional guide and exercise programme | 8 participants were required per intervention group (SD 0.4; difference of 0.6, P < 0.05, power = 90%) | 41/26 | ‐ | 9 | ‐ | 7 | ‐ | 6 months |
| C: placebo + nutritional guide and exercise programme | ‐ | 10 | ‐ | 6 | ‐ | ||||
| total: | 26 | 19 | ‐ | 13 | 50 | ||||
| Rezvanian 2010 | I1: metformin + diet and physical activity advice | "By considering alpha = 0.05 and a power level of 0.8, the sample size was calculated as 160, and by considering the attrition during the follow‐up, we increased it to 180" | 180 | 45 | ‐ | ‐ | 41 | 91.1 | 24 weeks |
| I2: fluoxetine + diet and physical activity advice | 45 | ‐ | ‐ | 40 | 88.9 | ||||
| I3: metformin and fluoxetine + diet and physical activity advice | 45 | ‐ | ‐ | 41 | 91.1 | ||||
| C: placebo + diet and physical activity advice | 45 | ‐ | ‐ | 42 | 93.3 | ||||
| total: | 180 | ‐ | ‐ | 164 | 91.1 | ||||
| Srinivasan 2006 (cross‐over trial) | I: metformin + "standardised information on healthy eating and exercise" | ‐ | 34 | ‐ | ‐ | ‐ | ‐ | ‐ | 12 months |
| C: placebo + "standardised information on healthy eating and exercise" | ‐ | ‐ | ‐ | ‐ | ‐ | ||||
| total: | 28 | ‐ | ‐ | 22 | 78.6 | ||||
| Van Mil 2007 | I: sibutramine + energy‐restricted diet and exercise plan | "The number of patients required per treatment group to detect a difference between treatment groups in mean change in BMI at endpoint intervention of 1.0 kg/m2, based on an estimate of variance (sd) of 0.65, an overall significance level of 5%, and a power of 90%, was nine. Allowing a drop‐out rate of 25%, the number of patients needed in each group was 12"h | ‐ | 12 | 12 | 12 | 11 | 91.7 | 24 weeks |
| C: placebo + energy‐restricted diet and exercise plan | 12 | 12 | 12 | 9 | 75.0 | ||||
| total: | 24 | 24 | 24 | 20 | 83.3 | ||||
| Wiegand 2010 | I: metformin + lifestyle intervention | "Since a clinically significant effect was defined as a decrease in HOMA‐IR by ‐1, two groups of 37 patients had to be included in the study to achieve a power of 0.9 with a α value of 0.05" | 278 | 36 | ‐ | ‐ | 34 | 94.4 | 6 months |
| C: placebo + lifestyle intervention | 34 | ‐ | ‐ | 29 | 85.3 | ||||
| total: | 70 | ‐ | ‐ | 63 | 90 | ||||
| Wilson 2010 | I: metformin + lifestyle intervention | "Assuming an SD of 1.9 for BMI change, an enrolled sample of 72 provided 80% power to detect a differential of 1.46 between treatment arms or between sexes and 1.75 between white subjects and others"i | 92 | 39 | 39 | 39 | 19 | 48.7 | 100 weeks |
| C: placebo + lifestyle intervention | 38 | 38 | 38 | 19 | 50.0 | ||||
| total: | 77 | 76 | 76 | 38 | 49.4 | ||||
| Yanovski 2011 | I: metformin + dietitian‐administered weight‐reduction programme | "A total sample size of 60 participants would detect a between‐group difference of 0.09 BMI SD score units (approximately equivalent to a 2 kg/m2 difference) with 80% power. Participant accrual was set at 100 participants to allow as much as 40% loss to follow‐up"j | 278 | 53 | ‐ | 53 | 45 | 84.9 | 6 months (not including the 6‐month open‐label phase) |
| C: placebo + dietitian‐administered weight‐reduction programme | 47 | ‐ | 47 | 40 | 85.1 | ||||
| total: | 100 | ‐ | 100 | 85 | 85.0 | ||||
| Grand total | All interventionsk | 1395 | 1153 | ||||||
| All comparatorsk | 817 | 665 | |||||||
| All interventions and comparatorsk | 2484 | 1851 | |||||||
| aDuration of intervention and follow‐up under randomised conditions until end of trial. "‐" denotes not reported. BMI: body mass index; C: comparator; hsCRP: high sensitivity C‐reactive protein; HOMA‐IR: homeostasis model assessment for insulin resistance index; I: intervention; ITT: intention‐to‐treat; n: number of participants; SD: standard deviation. | |||||||||
| Trials with data on mean change only | |
| Number of trials | 14 |
| Point estimate (95% CI) (kg/m2) | ‐ 1.5 (‐2.0 to ‐0.9) favouring drug intervention |
| Trials with concealment of allocation | |
| Number of trials | 12 |
| Point estimate (95% CI) (kg/m2) | ‐1.3 (‐1.8 to ‐0.7) favouring drug interventions |
| Trials with blinding of participants/personnel | |
| Number of trials | 10 |
| Point estimate (95% CI) (kg/m2) | ‐1.3 (‐1.9 to ‐0.7) favouring drug interventions |
| Trials with blinding of outcome assessors | |
| Number of trials | 10 |
| Point estimate (95% CI) (kg/m2) | ‐1.3 (‐1.9 to ‐0.7) favouring drug interventions |
| Trials without large sample size trials | |
| Number of trials | 14 |
| Point estimate (95% CI) (kg/m2) | ‐1.3 (‐1.8 to ‐0.7) favouring drug interventions |
| Trials with trials with 6 months' follow‐up only | |
| Number of trials | 14 |
| Point estimate (95% CI) (kg/m2) | ‐1.2 (‐1.7 to ‐0.7) favouring drug interventions |
| Trials without trials with higher drug dose | |
| Number of trials | 14 |
| Point estimate (95% CI) (kg/m2) | ‐1.2 (‐1.7 to ‐0.7) favouring drug interventions |
| Trials with trials with a high dose/active lifestyle intervention | |
| Number of trials | 10 |
| Point estimate (95% CI) (kg/m2) | ‐1.3 (‐1.9 to ‐0.7) favouring drug interventions |
| Trials without trials with high attrition | |
| Number of trials | 13 |
| Point estimate (95% CI) (kg/m2) | ‐1.4 (‐2.0 to ‐0.8) favouring drug interventions |
| BMI: body mass index; CI: confidence interval. | |
| Trials with data on mean change only | |
| Number of trials | 8 |
| Point estimate (95% CI) (kg) | ‐ 4.1 (‐6.3 to ‐1.8) favouring drug intervention |
| Trials with concealment of allocation | |
| Number of trials | 9 |
| Point estimate (95% CI) (kg) | ‐3.5 (‐5.8 to ‐1.2) favouring drug interventions |
| Trials with blinding of participants/personnel | |
| Number of trials | 7 |
| Point estimate (95% CI) (kg) | ‐4.2 (‐6.8 to ‐1.5) favouring drug interventions |
| Trials with blinding of outcome assessors | |
| Number of trials | 7 |
| Point estimate (95% CI) (kg) | ‐4.2 (‐6.8 to ‐1.5) favouring drug interventions |
| Trials without large sample size trials | |
| Number of trials | 10 |
| Point estimate (95% CI) (kg) | ‐3.4 (‐5.2 to ‐1.6) favouring drug interventions |
| Trials with 6 months' follow‐up only | |
| Number of trials | 9 |
| Point estimate (95% CI) (kg) | ‐3.5 (‐5.6 to ‐1.4) favouring drug interventions |
| Trials without trials with higher drug dose | |
| Number of trials | 10 |
| Point estimate (95% CI) (kg) | ‐3.4 (‐5.2 to ‐1.6) favouring drug interventions |
| Trials with trials with a high dose/active lifestyle intervention | |
| Number of trials | 6 |
| Point estimate (95% CI) (kg) | ‐4.3 (‐6.5 to ‐2.2) favouring drug interventions |
| Trials without trials with high attrition | |
| Number of trials | 9 |
| Point estimate (95% CI) (kg) | ‐4.4 (‐6.6 to ‐2.2) favouring drug interventions |
| CI: confidence interval. | |
| Outcome or subgroup title | No. of studies | No. of participants | Statistical method | Effect size |
| 1 Change in BMI (all trials) Show forest plot | 16 | 1884 | Mean Difference (IV, Random, 95% CI) | ‐1.34 [‐1.85, ‐0.83] |
| 2 Change in BMI (drug type) Show forest plot | 16 | 1884 | Mean Difference (IV, Random, 95% CI) | ‐1.34 [‐1.85, ‐0.83] |
| 2.1 Metformin | 8 | 543 | Mean Difference (IV, Random, 95% CI) | ‐1.35 [0.00, ‐0.69] |
| 2.2 Orlistat | 3 | 773 | Mean Difference (IV, Random, 95% CI) | ‐0.79 [‐1.08, ‐0.51] |
| 2.3 Sibutramine | 5 | 568 | Mean Difference (IV, Random, 95% CI) | ‐1.70 [‐2.89, ‐0.51] |
| 3 Change in BMI (dropout rate) Show forest plot | 16 | 1862 | Mean Difference (IV, Random, 95% CI) | ‐1.34 [‐1.85, ‐0.83] |
| 3.1 Dropouts < 20% | 9 | 597 | Mean Difference (IV, Random, 95% CI) | ‐1.11 [‐1.78, ‐0.44] |
| 3.2 Dropouts ≥ 20% | 6 | 1145 | Mean Difference (IV, Random, 95% CI) | ‐1.42 [‐2.34, ‐0.50] |
| 3.3 Unclear dropout rate | 1 | 120 | Mean Difference (IV, Random, 95% CI) | ‐2.73 [‐3.74, ‐1.72] |
| 4 Change in BMI (intention‐to‐treat (ITT) analysis) Show forest plot | 16 | 1862 | Mean Difference (IV, Random, 95% CI) | ‐1.34 [‐1.85, ‐0.83] |
| 4.1 No ITT | 5 | 282 | Mean Difference (IV, Random, 95% CI) | ‐1.56 [‐2.52, ‐0.60] |
| 4.2 ITT used | 11 | 1580 | Mean Difference (IV, Random, 95% CI) | ‐1.25 [‐1.86, ‐0.65] |
| 5 Change in BMI (funding) Show forest plot | 16 | 1862 | Mean Difference (IV, Random, 95% CI) | ‐1.34 [‐1.85, ‐0.83] |
| 5.1 Commercial | 5 | 1009 | Mean Difference (IV, Random, 95% CI) | ‐1.50 [‐2.69, ‐0.31] |
| 5.2 Noncommercial | 5 | 271 | Mean Difference (IV, Random, 95% CI) | ‐1.10 [‐1.77, ‐0.44] |
| 5.3 Commercial + noncommercial | 4 | 262 | Mean Difference (IV, Random, 95% CI) | ‐1.17 [‐1.86, ‐0.47] |
| 5.4 Unclear | 2 | 320 | Mean Difference (IV, Random, 95% CI) | ‐1.79 [‐3.54, ‐0.04] |
| 6 Change in BMI (publication date) Show forest plot | 16 | 1862 | Mean Difference (IV, Random, 95% CI) | ‐1.34 [‐1.85, ‐0.83] |
| 6.1 2007 or before | 8 | 1163 | Mean Difference (IV, Random, 95% CI) | ‐1.41 [‐2.21, ‐0.60] |
| 6.2 After 2007 | 8 | 699 | Mean Difference (IV, Random, 95% CI) | ‐1.26 [‐1.90, ‐0.62] |
| 7 Change in BMI (quality of trial) Show forest plot | 16 | 1862 | Mean Difference (IV, Random, 95% CI) | ‐1.34 [‐1.85, ‐0.83] |
| 7.1 Low | 6 | 322 | Mean Difference (IV, Random, 95% CI) | ‐1.40 [‐2.28, ‐0.52] |
| 7.2 Moderate | 10 | 1540 | Mean Difference (IV, Random, 95% CI) | ‐1.31 [‐1.95, ‐0.67] |
| 8 Change in BMI (country) Show forest plot | 16 | 1862 | Mean Difference (IV, Random, 95% CI) | ‐1.34 [‐1.85, ‐0.83] |
| 8.1 Middle income | 3 | 216 | Mean Difference (IV, Random, 95% CI) | ‐2.39 [‐3.08, ‐1.69] |
| 8.2 High income | 13 | 1646 | Mean Difference (IV, Random, 95% CI) | ‐1.09 [‐1.62, ‐0.56] |
| 9 Change in BMI (mean age) Show forest plot | 16 | 1884 | Mean Difference (IV, Random, 95% CI) | ‐1.34 [‐1.85, ‐0.83] |
| 9.1 Mean age < 12 years | 2 | 220 | Mean Difference (IV, Random, 95% CI) | ‐1.93 [‐3.53, ‐0.34] |
| 9.2 Mean age ≥ 12 years | 14 | 1664 | Mean Difference (IV, Random, 95% CI) | ‐1.25 [‐1.79, ‐0.71] |
| Outcome or subgroup title | No. of studies | No. of participants | Statistical method | Effect size |
| 1 Change in weight (all trials) Show forest plot | 11 | 1180 | Mean Difference (IV, Random, 95% CI) | ‐3.90 [‐5.86, ‐1.94] |
| 2 Change in weight (drug type) Show forest plot | 11 | 1180 | Mean Difference (IV, Random, 95% CI) | ‐3.90 [‐5.86, ‐1.94] |
| 2.1 Metformin | 4 | 372 | Mean Difference (IV, Random, 95% CI) | ‐3.24 [‐5.79, ‐0.69] |
| 2.2 Sibutramine | 5 | 568 | Mean Difference (IV, Random, 95% CI) | ‐4.71 [‐8.10, ‐1.32] |
| 2.3 Orlistat | 2 | 240 | Mean Difference (IV, Random, 95% CI) | ‐2.48 [‐4.31, ‐0.65] |
| Outcome or subgroup title | No. of studies | No. of participants | Statistical method | Effect size |
| 1 Serious adverse events Show forest plot | 5 | 1347 | Risk Ratio (M‐H, Random, 95% CI) | 1.43 [0.63, 3.25] |
| 1.1 Metformin | 1 | 76 | Risk Ratio (M‐H, Random, 95% CI) | 5.0 [0.25, 100.80] |
| 1.2 Orlistat | 3 | 773 | Risk Ratio (M‐H, Random, 95% CI) | 1.04 [0.41, 2.67] |
| 1.3 Sibutramine | 1 | 498 | Risk Ratio (M‐H, Random, 95% CI) | 3.53 [0.46, 27.33] |
| 2 Discontinued trial because of adverse events Show forest plot | 10 | 1664 | Risk Ratio (M‐H, Random, 95% CI) | 1.45 [0.83, 2.52] |
| 2.1 Metformin | 3 | 246 | Risk Ratio (M‐H, Random, 95% CI) | 1.20 [0.26, 5.48] |
| 2.2 Orlistat | 4 | 815 | Risk Ratio (M‐H, Random, 95% CI) | 2.49 [0.74, 8.32] |
| 2.3 Sibutramine | 3 | 603 | Risk Ratio (M‐H, Random, 95% CI) | 1.14 [0.53, 2.46] |