نقش تریهگزیفنیدیل در مدیریت دیستونی در فلج مغزی
چکیده
پیشینه
فلج مغزی (cerebral palsy) حدود 2.1 مورد را از هر 1000 تولد زنده متاثر میکند و شامل طیف وسیعی از مشکلات و اختلالات حرکتی (movement disorders) است. یکی از شایعترین اختلالات حرکتی که در مبتلایان به فلج مغزی رخ میدهد، دیستونی (dystonia) است: اسپاسمهای عضلانی مداوم یا متناوب غیر‐ارادی و انقباضاتی که منجر به پیچ خوردن، حرکات مکرر و وضعیتهای غیر‐عادی میشود. انقباضات غیر‐ارادی اغلب خیلی دردناک و ناراحت کننده بوده و منجر به محدودیتهای قابلتوجهی در فعالیت و مشارکت افراد میشود.
اغلب اوقات اولین خط درمان دارویی برای دیستونی، استفاده از داروهای خوراکی است. تریهگزیفنیدیل (trihexyphenidyl) یکی از این داروهاست که پزشکان اغلب برای درمان دیستونی در افراد مبتلا به فلج مغزی استفاده میکنند.
اهداف
ارزیابی اثرات تریهگزیفنیدیل در افراد مبتلا به فلج مغزی، در حوزههای اختلال، فعالیت و مشارکت براساس طبقهبندی بینالمللی عملکرد، ناتوانی و سلامت (International Classification of Functioning, Disability and Health; ICF) سازمان جهانی بهداشت (WHO). ما همچنین نوع و بروز اثرات عوارض جانبی را در افرادی که دارو مصرف میکنند ارزیابی کردیم.
روشهای جستوجو
در پایگاههای CENTRAL؛ MEDLINE؛ Embase و هشت بانک اطلاعاتی دیگر و دو پایگاه ثبت کارآزماییهای بالینی در می 2017 جستوجو کردیم، و فهرست منابع و استنادات را برای شناسایی مطالعات بیشتر بررسی کردیم.
معیارهای انتخاب
ما کارآزماییهای تصادفیسازی و کنترل شدهای را وارد کردیم که تریهگزیفنیدیل خوراکی را در برابر دارونما (placebo) برای دیستونی در فلج مغزی مقایسه کردند. ما مطالعات مربوط به کودکان و بزرگسالان مبتلا به فلج مغزی دیستونیک را در هر سن، به صورت تکی یا با اختلالات حرکتی اسپاستیک (spasticity)، آتاکسی (ataxia)، کورا (chorea)، آتتوز (athetosis) یا هیپوتونی (hypotonia) بررسی کردیم. مطالعات را بدون توجه به این که نویسندگان مطالعه روش خاصی را برای تشخیص دیستونی در جمعیت مطالعهشان به کار بردند یا خیر، وارد کردیم. پیامدهای اولیه تغییر در دیستونی و عوارض جانبی بودند. پیامدهای ثانویه فعالیت شامل موربیدیتی و عملکرد اندام فوقانی؛ مشارکت در فعالیتهای روزانه زندگی؛ درد و کیفیت زندگی بودند.
گردآوری و تجزیهوتحلیل دادهها
از روشهای استاندارد روششناسی مورد انتظار کاکرین استفاده کردیم.
نتایج اصلی
مطالعهای را شناسایی کردیم که در استرالیا انجام شده و شامل معیارهای ما میشد. مطالعه از نوع کارآزمایی تصادفیسازیشده، دوسو‐کور (double‐blind)، کنترل شده با دارونما، متقاطع در 16 کودک (10 پسر و 6 دختر) مبتلا به فلج مغزی دیستونیک غالب و میانگین سنی 9 سال بود (انحراف معیار (standard deviation) 4.3 سال، محدوده 2 تا 17 سال). ما کارآزمایی را با خطر پائین سوگیری انتخاب، عملکرد، تشخیص، ریزش نمونه، گزارشدهی و سایر منابع سوگیری در نظر گرفتیم. کیفیت شواهد را براساس درجهبندی توصیه، ارزیابی، توسعه و ارزشیابی (GRADE) در سطح پائین رتبهبندی کردیم.
هیچ تفاوتی در میانگین نمرات پیگیری برای تغییر در دیستونی اندازهگیری شده توسط Barry Albright Dystonia Scale (BADS)، مقیاسی که هشت ناحیه بدن را برای دیستونی در یک مقیاس 5 نقطهای ارزیابی میکند (0 = هیچ تا 4 = شدید)، یافت نشد، نتیجهگیری در نمره کل 0 تا 32 انجام شد. نمره BADS معادل 2.67 نمره بالاتر بود (95% فاصله اطمینان (CI): 2.55‐ تا 7.90؛ شواهد با کیفیت پائین)، بدین معنا که دیستونی بدتری در گروه درمان وجود داشت. تریهگزیفنیدیل ممکن است با افزایش خطر عوارض جانبی مرتبط باشد (خطر نسبی (RR): 2.54؛ 95% CI؛ 1.38 تا 4.67؛ شواهد با کیفیت پائین).
هیچ اختلافی در میانگین نمرات پیگیری برای عملکرد اندام فوقانی اندازهگیری شده توسط Quality of Upper Extremity Skills Test، که چهار حوزه داشته و در مجموع 36 آیتم را ارزیابی میکند (هر کدام 1 یا 2 نمره) و نمره کل 0 تا 100 را تولید میکند، وجود نداشت. نمره گروه درمان شده 4.62 نقطه پائینتر بود (95% CI؛ 10.98‐ تا 20.22؛ شواهد با کیفیت پائین)، که متناظر با عملکرد بدتر از گروه کنترل بود. شواهدی را با کیفیت پائین برای بهبود مشارکت (که با نمرات بالاتر نشان داده میشود) در گروه درمان در فعالیتهای روزانه زندگی پیدا کردیم، که به وسیله سه ابزار اندازهگیری شد: 18.86 نقطه بالاتر (95% CI؛ 5.68 تا 32.03) برای Goal Attainment Scale (تا پنج هدف عملکردی بر اساس مقیاس 5‐نقطهای (2‐ = بسیار کمتر از انتظار تا 2+ = بسیار بیشتر از انتظار، نمره داده شد)، 2.91 نقطه بالاتر (95% CI؛ 1.01 تا 4.82) برای خرده‐مقیاس Canadian Occupational Performance Measure (COMP؛ رضایتمندی با عملکرد تا پنج ناحیه مشکل در مقیاس 10‐نقطهای امتیازدهی شد (1 = کاملا ناراضی تا 10 = کاملا راضی)) و 2.24 نمره بالاتر (95% CI؛ 0.64 تا 3.84) برای خرده‐مقیاس عملکرد COMP (عملکرد تا پنج ناحیه مشکل در مقیاس 10‐نقطهای (1 = قادر به انجام نیست؛ 10 = خیلی خوب قادر است انجام دهد)).
مطالعه گزارشی از درد یا کیفیت زندگی بیماران نداشت.
نتیجهگیریهای نویسندگان
در حال حاضر، شواهد کافی برای اثربخشی تریهگزیفنیدیل بر افراد مبتلا به فلج مغزی برای پیامدهای: تغییر در دیستونی، عوارض جانبی، افزایش عملکرد اندام فوقانی و ارتقای مشارکت در فعالیتهای روزانه زندگی وجود ندارد. این مطالعه درد یا کیفیت زندگی را اندازهگیری نکرد. به انجام کارآزماییهای تصادفیسازی و کنترل شده چند‐مرکزی بزرگتری نیاز است که تاثیر مداخله را بر درد و کیفیت زندگی به منظور تعیین اثربخشی تریهگزیفنیدیل بر افراد مبتلا به فلج مغزی تعیین کنند.
PICO
خلاصه به زبان ساده
نقش تریهگزیفنیدیل در مدیریت دیستونی در فلج مغزی
سوال مطالعه مروری
آیا تریهگزیفنیدیل (trihexyphenidyl) درمان کمک کنندهای برای افراد مبتلا به فلج مغزی (cerebral palsy) هست که مشکل حرکتی به نام دیستونی (dystonia) دارند یا خیر؟
پیشینه
فلج مغزی وضعیت شایعی است که طیفی از مشکلات حرکتی را در بر میگیرد. یک مشکل حرکتی شایع، دیستونی است، که کنترل حرکات افراد مبتلا به فلج مغزی را دچار مشکل میکند. آنها انقباضات عضلانی غیرارادی – و اغلب دردناک و ناراحت کننده – دارند که قادر به کنترل آنها نیستند. انقباضات توانایی افراد را برای حرکت کردن، انجام فعالیتهای خود‐مراقبتی، صحبت کردن و مشارکت در فعالیتهای روزمره کاهش میدهد.
پزشکان اغلب از داروها از جمله تریهگزیفنیدیل برای درمان این وضعیت مشکل استفاده میکنند. با وجود این، هنوز تمام مزایا و معایب تجویز تریهگزیفنیدیل برای افراد مبتلا به فلج مغزی و دیستونی شناخته نشده است.
ویژگیهای مطالعه
در می 2017، برای یافتن تمام کارآزماییهای بالینیای جستوجو کردیم که اثربخشی تریهگزیفنیدیل را برای افراد مبتلا به فلج مغزی دیستونیک بررسی کردند. یک کارآزمایی استرالیایی را که شامل 16 کودک (10 پسر، 6 دختر) مبتلا به فلج مغزی و دیستونی بود، وارد کردیم. آنها میانگین سنی نه سال داشتند.
کودکان به دو گروه مختلف تقسیم شدند. هر دو گروه 12 هفته تریهگزیفنیدیل و 12 هفته دارونما (placebo) (شبیه به تریهگزیفنیدیل اما بدون ماده فعال) دریافت کردند، با 4 هفته استراحت بین دورانی که دارو هم دریافت نمیکردند. تنها تفاوت بین گروهها این بود که یک گروه درمان خود را با تریهگزیفنیدیل شروع کرد و سپس دارونما دریافت کرد و گروه دیگر با دارونما شروع و سپس تریهگزیفنیدیل دریافت کرد.
نتایج کلیدی
هیچ شواهدی برای اثربخشی تریهگزیفنیدیل در کاهش دیستونی یا بهبود عملکرد اندام فوقانی در کودکان مبتلا به فلج مغزی و دیستونی پیدا نکردیم. تریهگزیفنیدیل ممکن است با افزایش خطر عوارض جانبی (تحریک، یبوست، خشکی دهان و کم‐خوابی) مرتبط باشد. شواهدی وجود دارد که تریهگزیفنیدیل ممکن است اهداف فردی تعیین شده را توسط کودک و خانواده برای ارتقای مشارکت در فعالیتهای روزانه زندگی بهبود بخشد. این مطالعه درد یا کیفیت زندگی را اندازهگیری نکرد.
کیفیت شواهد
ما کیفیت شواهد را در سطح پائین رتبهبندی کردیم زیرا این مطالعه شامل تعداد اندکی از کودکان بود و هیچ مطالعه دیگری برای حمایت از یافتهها پیدا نشد. بنابراین، در مورد اثربخشی تریهگزیفنیدیل در کاهش دیستونی یا بهبود عملکرد بازو و مشارکت در فعالیتهای روزمره افراد مبتلا به فلج مغزی و دیستونی مطمئن نیستیم.
Authors' conclusions
Summary of findings
| Trihexyphenidyl compared with placebo for dystonia in cerebral palsy | |||||
| Patient or population: children with dystonic cerebral palsy Settings: one tertiary care hospital Intervention: trihexyphenidyl Comparison: placebo | |||||
| Outcomes | Illustrative comparative risks* (95% CI) | Relative effect | Number of participants | Quality of the evidence | |
| Assumed risk | Corresponding risk | ||||
| Placebo | Trihexyphenidyl | ||||
| Change in dystonia from baseline Measured by: BADS (eight body regions assessed for dystonia on a five‐point scale (0 = none to 4 = severe), minimum score 0 to maximum score 32; higher score = greater severity of dystonia) Follow‐up: 12 weeks | The mean follow‐up score in the control group was 15.50 points | The mean follow‐up score in the intervention group was 2.67 points higher (2.55 lower to 7.90 higher) | — | 16 | ⊕⊕⊝⊝ Lowa |
| Adverse effectsb (mood disturbance, irritability, behavioural change, constipation) Measured by: counts of number and type Follow‐up: various (includes data assessed at both 12 and 28 weeks) | 375 per 1000 | 1000 per 1000 | RR 2.54 (1.38 to 4.67) | 16 | ⊕⊕⊝⊝ |
| Participation in activities of daily living:individual goal setting Measured by: GAS (up to 5 functional goals scored on a 5‐point scale (−2 = much less than expected to +2 = much more than expected); higher score = better than expected outcome) Follow‐up: 12 weeks | The mean follow‐up score in the control group was 27.63 points | The mean follow‐up score in the intervention group was 18.86 points higher (5.68 higher to 32.03 higher) | — | 16 | ⊕⊕⊝⊝ |
| Participation in activities of daily living:satisfaction with individual goals Measured by: satisfaction subscale of the COPM (satisfaction with performance in up to 5 problem areas scored on a 10‐point scale (1 = not satisfied at all to 10 = extremely satisfied); higher score = greater satisfaction) Follow‐up: 12 weeks | The mean follow‐up score in the control group was 2.96 points | The mean follow‐up score in the intervention group was 2.91 points higher (1.01 higher to 4.82 higher) | — | 16 | ⊕⊕⊝⊝ |
| Participation in activities of daily living:performance of individual goals Measured by: performance subscale of the COPM (up to five problem areas scored on a 10‐point scale (1 = not able to do to 10 = able to do extremely well; higher score = better performance) Follow‐up: 12 weeks | The mean follow‐up score in the control group was 3.14 points | The mean follow‐up score in the intervention group was2.24 points higher (0.64 higher to 3.84 higher) | — | 16 | ⊕⊕⊝⊝ |
| Quality of life | Not measured | ||||
| *The basis for the assumed risk is provided in the footnotes. The corresponding risk (and its 95% CI) is based on the assumed risk in the comparison group and the relative effect of the intervention (and its 95% CI) | |||||
| GRADE Working Group grades of evidence | |||||
| aDowngraded two levels due to imprecision; small sample size from one study only. | |||||
Background
Description of the condition
Cerebral palsy has been described as "a group of permanent disorders of the development of movement and posture, causing activity limitation ... [attributable] to non‐progressive disturbances that occurred in the developing fetal or infant brain" (Rosenbaum 2007). Disturbances of sensation, perception, cognition, communication and behaviour, epilepsy and secondary musculoskeletal problems often accompany the motor disorders of cerebral palsy.
Cerebral palsy is a common childhood condition, occurring in approximately 2.11 of every 1000 live births (Oskoui 2013). It encompasses motor problems such as spasticity (increased muscle tone); hyperkinetic disorders, such as dystonia and choreoathetosis where there is unwanted excessive movement; and, less commonly, ataxia (uncoordinated movement). However, many children present with a mixed movement disorder.
Dystonia frequently occurs in children with cerebral palsy and is "characterised by involuntary sustained or intermittent muscle contractions that cause twisting and repetitive movements, abnormal postures, or both” (Sanger 2003). Of the methods used to diagnose dystonia, the one with the greatest credibility is the Hypertonia Assessment Tool (HAT; Jethwa 2010). The HAT is a seven‐item, standardised clinical assessment tool for children over four years of age, which is used to reliably differentiate the various types of paediatric hypertonia, namely spasticity, dystonia and rigidity (Jethwa 2010). Dystonia can result from an abnormality in the basal‐ganglia cortical pathway and can be measured clinically using a variety of scales. It may affect one or more limbs, or be present throughout the child’s whole body, including the mouth, eyes and neck. The involuntary contractions are often very painful and distressing. Dystonia can reduce activity and participation across many of the health‐related domains described in the World Health Organization's (WHO) International Classification of Functioning, Disability and Health (ICF) model (WHO ICF 2003).
The percentage of children with cerebral palsy identified as having dominant dyskinetic cerebral palsy (including dystonia and choreoathetosis) is substantial, ranging from 6% in Australia to 15% in Europe (ACPR 2016; Bax 2006; Himmelmann 2007). Children who are accurately identified as spasticity‐dominant can also have dyskinesia, which can add to their disability and discomfort. Traditionally, identifying dystonia and differentiating it from spasticity relied primarily on clinical examination and observation, with uncertain reliability and validity. The accurate identification of dyskinesia in children with cerebral palsy has been facilitated by the development of the HAT, which reliably differentiates the subtypes of hypertonia (Jethwa 2010).
Dystonia can have devastating effects on function, including impairment of communication and swallowing, and it can create difficulties in completing self‐care tasks and being comfortably seated in a wheelchair. Children also get into cycles of dystonia causing musculoskeletal pain, which in turn exacerbates their dystonia. The worst example of this is the dystonic crisis, which can require muscle paralysis/sedation (Allen 2014). These difficulties can negatively affect the quality of life of the individual and their caregivers.
Description of the intervention
Dystonia is a difficult movement disorder with limited management options available for treatment. Oral medications are often the first‐line of treatment for this challenging condition.
Trihexyphenidyl (also known as benzhexol) is a selective muscarinic acetylcholine receptor antagonist, blocking cholinergic activity centrally and peripherally (NIH 2005). It is also thought to increase the availability of dopamine, a brain chemical that is critical in the initiation and smooth control of voluntary muscle movement. Trihexyphenidyl is available in liquid form, as a tablet, or as an extended‐release (long‐acting) capsule. The onset of action of this medication occurs within an hour of oral administration. It has a peak effect 2 to 3 hours after administration, and the duration of action can last from 6 to 12 hours.
How the intervention might work
The pathophysiology of dystonia involves a dysfunction in the basal ganglia. The pathways between the basal ganglia and the cortex are influenced by neurotransmitters that act on various receptors in feedback loops causing positive or negative effects. The mechanism of action of trihexyphenidyl in reducing dystonia is believed to be in the basal ganglia where it reduces acetylcholine and increases dopamine (Carranza del Rio 2011). By treating dystonia and its associated impairments, clinicians hope to improve activity and decrease associated pain and discomfort.
Why it is important to do this review
Medication is frequently used for dystonia but little information is available as to whether it is effective, and side effects are common. Most of the published studies assessing medications are small and descriptive, limiting the ability to draw conclusions on its effects. Prospective case series, such as Sanger 2007, along with a few retrospective case series, like Ben‐Pazi 2011, and Hoon 2001, have reported inconsistent results for trihexyphenidyl in cerebral palsy; however, there is a need to examine evidence from existing randomised trials. This review will bring together and evaluate existing trials to clarify the benefits and risks of trihexyphenidyl for dystonia in cerebral palsy.
Objectives
To assess the effects of trihexyphenidyl in people with dystonic cerebral palsy, according to the World Health Organization's (WHO) International Classification of Functioning, Disability and Health (ICF) domains of impairment, activity and participation. We also assessed the type and incidence of adverse effects in people taking the drug.
Methods
Criteria for considering studies for this review
Types of studies
Randomised controlled trials (RCTs).
Types of participants
Children and adults with dystonic cerebral palsy, either in isolation or with the associated movement disorders of spasticity, ataxia, chorea, athetosis and/or hypotonia were eligible. Although we applied no age restrictions, we found no studies reporting outcomes for adults.
We included studies regardless of whether or not the study authors specified the method used to diagnose dystonia in their study population. We did this in order to include all studies with relevant findings. We do concede, however, that studies using the HAT may have greater credibility than those using other or unspecific methods of diagnosis (Jethwa 2010).
Types of interventions
Oral trihexyphenidyl, regardless of dosage or frequency of administration, used to treat dystonia in cerebral palsy.
The control group had to be a placebo group. Trials with more than one comparison group were eligible, as long as one group received trihexyphenidyl and one group received placebo.
Types of outcome measures
Primary outcomes
-
*Change in dystonia from baseline, as assessed using the Barry‐Albright Dystonia scale (Barry 1999), Dyskinesia Impairment Scale (Monbaliu 2012), or electrophysiological measures of dystonia
-
*Adverse effects (mood disturbance, irritability, behavioural change, constipation)
Secondary outcomes
-
Activity, including mobility and upper limb function, as measured by validated scales such as the Canadian Occupational Performance Measure (Law 2005), Global Assessment Scale (Endicott 1976), Quality of Upper Extremity Skills Test (QUEST 1992), Melbourne Assessment of Unilateral Upper Limb Function (Randall 1999), Gross Motor Function Measure (Hanna 2008), Three Dimensional Gait Analysis (Ferber 2016), Timed Up and Go Test (TUG 2005), Functional Independence Measure (WeeFIM 1994), and High‐level Mobility Assessment Tool (Williams 2006)
-
*Participation in activities of daily living at home, school, in the community and in the workforce, as measured by validated scales such as the Children's Assessment of Participation and Enjoyment (King 2004), the Canadian Occupational Performance Measure (Law 2005), and the Global Assessment Scale (Endicott 1976)
-
Pain, as measured by validated scales such as the Wong‐Baker FACES Pain Rating Scale (Wong‐Baker FACES Pain Rating Scale 2001)
-
*Quality of life, as measured by validated scales such as the Pediatric Quality of Life Inventory (PedsQL 1999), the Caregiver Priorities and Child Health Index of Life with Disabilities (Narayanan 2007), or other validated scale
We placed no restrictions on length of outcome follow‐up.
We used those outcomes marked with an asterisk (*) to populate the 'Summary of findings' table.
Search methods for identification of studies
This review is based on a published protocol (Baker 2017).
Electronic searches
We searched the electronic databases and trials registers listed below up to May 2017.
-
Cochrane Register of Studies Online, which includes the Cochrane Developmental, Psychosocial and Learning Problems Group Specialised Register (crso.cochrane.org; searched 25 May 2017).
-
MEDLINE Ovid (1946 to May week 3 2017).
-
MEDLINE In‐Process & Other Non‐Indexed Citations Ovid (searched 25 May 2017).
-
MEDLINE Epub Ahead of Print Ovid (searched 25 May 2017).
-
Embase Ovid (1974 to 2017 week 21).
-
CINAHL EBSCOhost (Cumulative Index to Nursing and Allied Health Literature; 1937 to 25 May 2017).
-
Science Citation Index Web of Science (SCI; 1990 to 24 May 2017).
-
Conference Proceedings Citation Index – Science Web of Science (CPCI‐S; 1990 to 24 May 2017).
-
Cochrane Database of Systematic Reviews (CDSR; 2017, Issue 5) part of the Cochrane Library (searched 26 May 2017).
-
Database of Abstracts of Reviews of Effects (DARE; 2015, Issue 2. Final Issue) part of the Cochrane Library (searched 26 May 2017).
-
LILACS (lilacs.bvsalud.org/en; searched 26 May 2017).
-
ClinicalTrials.gov (clinicaltrials.gov; searched 26 May 2017).
-
WHO International Clinical Trials Registry Platform (ICTRP) (who.int/ictrp/en; searched 26 May 2017).
We developed a search strategy in MEDLINE, which we adapted for each of the sources listed above (Appendix 1) . We did not apply any date or language restrictions.
Searching other resources
We checked the reference lists of included reports and relevant reviews. In addition, we contacted experts to identify any additional studies not retrieved by our electronic searches.
Data collection and analysis
We were not able to use many of our planned methods because only one study met the criteria for inclusion in the review (Criteria for considering studies for this review). Details of unused methods can be found in Baker 2017 and Table 1. What follows next is a description of methods that we did use.
| Method | Unused methods |
| Measures of treatment effect | Continuous data For continuous outcomes we will calculate the MD and corresponding 95% CI if studies use the same rating scales. We will calculate the SMD with 95% CIs if studies use different scales to measure the same outcomes. As recommended in section 9.4.5.2 of the Cochrane Handbook for Systematic Reviews of Interventions (Deeks 2017), we will focus on final values unless some of the studies use change scores. We will combine studies that report final values with studies that report only change scores in the same meta‐analysis, provided that the studies use the same rating scale. We will conduct the analysis according to age, as children and adults respond differently to medication. We will combine the data from all groups in studies that have trihexyphenidyl in more than one group (i.e. different frequencies) and then separate these when performing the subgroup analysis to see how the different frequencies influence the results (see item four in the Subgroup analysis and investigation of heterogeneity section). |
| Multiple outcomes If studies provide multiple, interchangeable measures of the same construct at the same point in time, we will calculate the average SMD across the outcomes and the average estimated variances, as recommended in section 16.1.2 of the Cochrane Handbook for Systematic Reviews of Interventions (Higgins 2011b). | |
| Unit of analysis issues | Cluster‐RCTs If included trials use cluster randomisation, we will extract an ICC and use this to reanalyse the data. Where no ICC is given and a unit of analysis error appears to exist, we will contact the trial authors and ask them to provide either an ICC or the raw data to enable calculation of an ICC. Where no ICC is made available, we will search for similar studies from which we can impute an ICC, or seek statistical advice to obtain an estimate of the ICC. |
| Dealing with missing data | We will contact trial investigators to request missing data. If the trialists provide missing data, we will conduct a meta‐analysis according to intention‐to‐treat principles using all data and keeping participants in the treatment group to which they were originally randomised, regardless of the treatment they actually received, as recommended in section 16.1.2 of the Cochrane Handbook for Systematic Reviews of Interventions (Higgins 2011b). If missing data are not provided, we will analyse only the available data. If there is concern regarding a high level of missing data, such that data could not be included in a meta‐analysis, we will include a qualitative summary in the text of the review. We will document missing data and attrition in the 'Risk of bias' tables, and we will explore how missing data might affect the interpretation of the results by conducting a sensitivity analysis. |
| Assessment of heterogeneity | We will assess clinical heterogeneity by comparing the between‐trials distribution of participant characteristics (e.g. children versus adults) and intervention characteristics (e.g. treatment type and dose), and assess methodological heterogeneity by comparing trial characteristics (e.g. cross‐over versus parallel design). We will evaluate statistical heterogeneity using the I2 statistic and the Chi2 test of heterogeneity, with statistical significance set at P value < 0.10. As recommended in section 9.5.2 of the Cochrane Handbook for Systematic Reviews of Interventions (Deeks 2017), we will consider I2 values as follows.
We will report Tau2 as an estimate of the between‐study variance when reporting the results from the random‐effects model. |
| Assessment of reporting biases | If we identify 10 or more studies, we will use funnel plots to investigate the relationship between intervention effect and study size. We will explore possible reasons for any asymmetry found. We will analyse the funnel plot of the data to ascertain asymmetry. Asymmetry of a funnel plot may indicate, among other things, publication bias or poor methodological quality (Egger 1997). |
| Data synthesis | We will synthesise results in a meta‐analysis using a fixed‐effect model when studies are similar enough with regard to the intervention, population and methods, to assume that the same treatment effect is estimated. We will synthesise results in a meta‐analysis using a random‐effects model when statistical heterogeneity is found or when studies differ enough with regard to the intervention, population, and methods, to assume that different yet related treatment effects are estimated, and when it is deemed to be clinically relevant, as recommended in section 9.4.3.1 of the Cochrane Handbook for Systematic Reviews of Interventions (Deeks 2017). |
| Subgroup analysis and investigation of heterogeneity | We will conduct the subgroup analyses listed below.
We will also look at the number of participants per study to determine if this is sufficient to perform a subgroup analysis. |
| Sensitivity analysis | We will conduct sensitivity analyses to investigate the effect on the overall results of excluding trials that meet the criteria described below.
We will also conduct a sensitivity analysis for studies with very low risk of bias. In addition, we will conduct a sensitivity analysis using a range of ICCs to assess the impact on treatment effect. |
CI: confidence intervals; ICC: intraclass correlation coefficient; MD: mean difference; SMD: standardised mean difference.
Selection of studies
Two review authors, ARH and AS, independently screened the titles and abstracts of the citations identified from the search, discarding those that were clearly irrelevant. They then obtained the full texts of those studies that met, or seemed to meet, the inclusion criteria (Criteria for considering studies for this review), and they assessed them for relevance. KW acted as arbiter in the event of dispute. We recorded our decisions in a PRISMA flow diagram (Moher 2009).
Data extraction and management
Two review authors (ARH and AS) independently extracted data from the included study using a data extraction form designed and piloted for this review. They extracted the following information.
-
Study methods and setting: study type (type of RCT), study site, country of publication, language of publication, publication type and study duration.
-
Participant details: age, sex, diagnosis and diagnosis tool.
-
Intervention details: intervention type, including dosage, mode of delivery, frequency and duration; placebo type, including dosage, mode of delivery, frequency and duration.
-
Outcomes: all primary and secondary outcomes (see Types of outcome measures).
We resolved disagreements through consultation with KW.
ARH entered data into Review Manager 5 (RevMan 5), which KW checked for accuracy (RevMan 2014).
Assessment of risk of bias in included studies
Two review authors (ARH and AS) independently assessed the risk of bias in the included study using the tool described in section 8.5.1 of the Cochrane Handbook for Systematic Reviews of Interventions (Higgins 2017). For the study, they judged the risk of bias to be either low, high or unclear, for each of the seven domains described in Appendix 2. They resolved disagreements by discussion with KW.
Measures of treatment effect
Dichotomous data
We had planned to analyse dichotomous outcomes by calculating the odds ratio (OR) and corresponding 95% confidence intervals (CI). However, because adverse effects (the only dichotomous outcome in this review) were frequent in the one included study, we calculated the risk ratio (RR) and corresponding 95% CI to provide a more interpretable statistic.
Continuous data
As recommended in section 9.4.5.2 of the Cochrane Handbook for Systematic Reviews of Interventions (Deeks 2017), we performed an ANCOVA to estimate the change score due to the one included study using change scores. A potential problem of including change scores is that the standard deviation of changes may not be reported in the original study (Higgins 2011a).
See also Baker 2017 and Table 1.
Unit of analysis issues
The included study was a cross‐over trial, and we used the data from the first period of the cross‐over. We did not include any cluster‐randomised trials (see Baker 2017; Table 1).
Dealing with missing data
We assessed missing data and dropouts for the included study. We reported the number of participants included in the final analysis as a proportion of all participants in the study, reporting reasons for missing data (dropouts) according to their randomised groups (trihexyphenidyl and placebo) as provided in the study. We examined the differences in these rates to determine the treatment effect bias, as differences in rates of missing data between the groups are indicative of data not missing at random. This would indicate a high risk of bias for incomplete outcome reporting in the included study. This is reported in the risk of bias.
Assessment of heterogeneity
We were unable to assess heterogeneity, as we only included one study in the review (see Baker 2017; Table 1).
Assessment of reporting biases
We were unable to assess reporting biases, as we only included one study in the review (see Baker 2017; Table 1).
Data synthesis
We were unable to conduct a meta‐analysis as we only included one study in the review (see Baker 2017; Table 1).
Subgroup analysis and investigation of heterogeneity
We were unable to conduct a subgroup analysis or investigate heterogeneity, as we only included one study in the review (see Baker 2017; Table 1).
Sensitivity analysis
We were unable to conduct a sensitivity analysis, as we only included one study in the review (see Baker 2017; Table 1).
Summary of findings table
Following the recommendations in section 11.5.4 of the Cochrane Handbook for Systematic Reviews of Interventions (Schünemann 2017), and using GRADEprofiler: Guideline Development Tool (GRADEpro GDT 2015), we created a 'Summary of findings' table for the comparison, trihexyphenidyl versus placebo for dystonia in cerebral palsy. We reported the following outcomes in the table: change in dystonia; adverse effects; participation in activities of daily living; and quality of life. We reported all outcomes at 12 weeks follow‐up except for adverse effects, whose analysis contains data assessed at both 12 and 28 weeks because we were unable to separate the data.
Two review authors (AH and KW) independently assessed the quality of the evidence for each outcome contributing data using the GRADE tool (GRADE 2004), looking at study limitations, consistency of effect, imprecision, indirectness and publication bias.
Results
Description of studies
A description of the included study is in the Characteristics of included studies table.
Results of the search
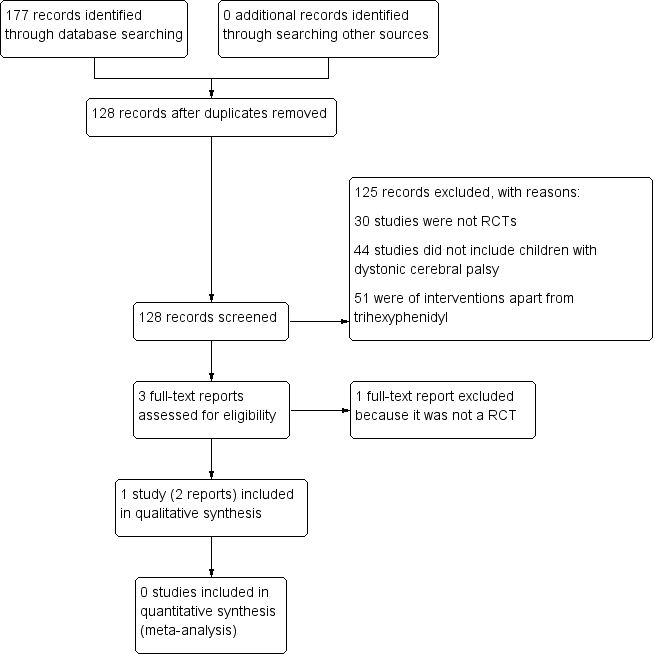
We conducted a literature search up to 26 May 2017, identifying 128 original records. After screening of titles and abstracts, we retrieved three full‐text reports. We excluded one study, Reddihough 1990, because it was not an RCT (see Excluded studies; Characteristics of excluded studies table). We identified two reports of one original trial for inclusion (Rice 2009). Figure 1 shows a study flow diagram.

Study flow diagram.
Included studies
Study design
Rice 2009 was a randomised, double‐blind, placebo‐controlled, cross‐over trial.
Participants
The study recruited 16 children with predominant dystonic cerebral palsy and a mean age of nine years (SD 4.3 years, range 2 to 17 years). There were 10 boys and 6 girls.
Diagnosis
One of the study physicians verified the diagnosis of dystonia, but authors did not report the method used.
Randomisation
Children were randomised into either trihexyphenidyl (dose starting at 0.2 mg/kg/d in three divided doses and increased over six weeks up to a maximum 2.5 mg/kg/d in three divided doses) or placebo (liquid delivered orally at 2.5 mg/kg/day of liquid in three divided doses (equals same volume as intervention)) for 12 weeks. Parents administered the trihexyphenidyl and the placebo. There was a washout period of four weeks prior to cross‐over.
Outcomes
The primary outcomes reported were change in dystonia from baseline, assessed using the Barry Albright Dystonia Scale (BADS) and adverse effects. Authors counted all side effects as adverse effects. Secondary outcomes reported were upper limb function, assessed using the Quality of Upper Extremity Skills Test (QUEST) and participation in activities of daily living at home, school and in the community, assessed using the Canadian Occupational Performance Measure (COPM) and the Goal Attainment Scale (GAS). Trialists did not measure pain or quality of life. Children were assessed at baseline, 12 weeks and 28 weeks after commencement. We only included data from the first phase (12 weeks) in this review, except for adverse effects where it was not possible to separate first‐ and second‐phase data.
Excluded studies
We excluded one study, Reddihough 1990, because it was not an RCT. See the Characteristics of excluded studies table.
Risk of bias in included studies
Figure 2 presents a summary of the 'Risk of bias' assessment for the included trial, Rice 2009. We judged the trial as being at low risk of bias for all categories.

Risk of bias summary: review authors' judgements about each risk of bias item for each included study.
Allocation
We considered Rice 2009 to be at low risk of selection bias due to both random sequence generation and allocation concealment because the trial pharmacy generated a randomisation table and kept codes concealed until after data collection was complete.
Blinding
We judged Rice 2009 to be at low risk of performance and detection bias because assessors, the patient and the family were all blinded to the intervention.
Incomplete outcome data
We judged Rice 2009 to be at low risk of attrition bias because, although two of the eight children who received the active treatment in the first phase dropped out, one child withdrew due to a family crisis unrelated to the medication.
Selective reporting
We judged Rice 2009 to be at low risk of reporting bias because it reported on all pre‐specified outcomes.
Other potential sources of bias
We identified no other potential sources of bias for Rice 2009.
Effects of interventions
In order to obtain the first‐phase data only, we contacted the study authors and they provided the requested information. The follow‐up time point for the first phase was 12 weeks.
Primary outcomes
Change in dystonia from baseline
Our analysis of first‐phase data only showed no evidence of a difference in mean follow‐up scores, with an estimate that the BADS score (eight body regions assessed for dystonia on a five‐point scale (0 = none to 4 = severe), for a total score of 0 to 32) was 2.67 points higher (95% CI −2.55 to 7.90; low‐quality evidence; Figure 3), that is, worse dystonia, in the treated group.

ANCOVA analyses, page 1
The results reported by the study authors from both phases using the general linear model analysis showed no evidence that trihexyphenidyl had any treatment (F(1,12) = 0.2, P = 0.67), carry‐over (F(1,12) = 1.7, P = 0.22) or order (F(1,12) = 0.3, P = 0.57) effects.
Adverse effects
The study authors reported that trihexyphenidyl increased the risk of adverse effects by 154% using data from both the first and second phases of the study. All children had reported adverse effects in the treatment phase (16/16), so all children receiving treatment in the first phase experienced adverse effects (8/8). Reported adverse effects included agitation, constipation, dry mouth and poor sleep. Authors reported that 6 out of 16 participants had adverse effects in the placebo phase; however, the timing of these effects is not clear. It is conceivable that children who received the placebo in the second phase may have experienced ongoing adverse effects related to the treatment phase.Therefore, the estimate of the number of adverse effects with placebo in the first phase may be lower than three out of eight, and we may be underestimating the increased risk with treatment.
Secondary outcomes
Activity
Our analysis of first‐phase data only showed no evidence of a difference in mean follow‐up scores as measured by the QUEST (36 items across four domains, scored one or two, producing a score of 0 to 100), with an estimated score of 4.62 points lower (95% CI −10.98 to 20.22; low‐quality evidence), that is worse upper limb function, in the treated group.
The results reported by the study authors from both phases using general linear model analysis showed no evidence that trihexyphenidyl had any treatment (F(1,12) = 0.9, P = 0.37), carry‐over (F(1,12) = 1.4, P = 0.25) or order (F(1,12) = 0.2, P = 0.90) effects.
Participation in activities of daily living
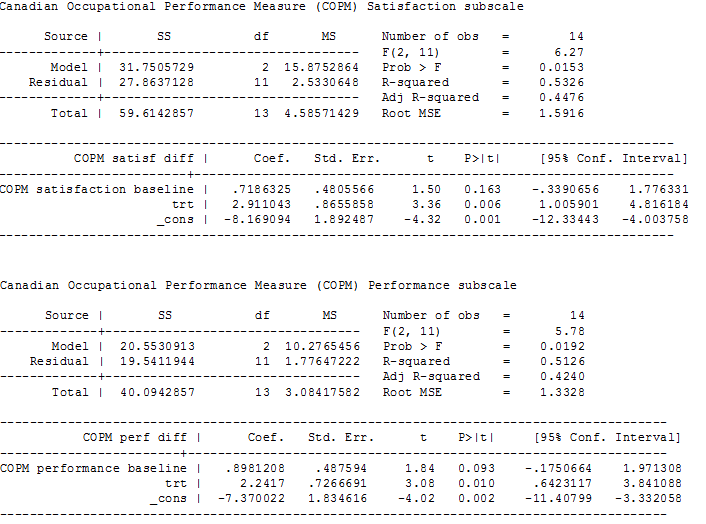
Our analysis of first‐phase data only showed a difference in mean follow‐up scores, as measured by three tools, in the treated group, with an estimate of: 18.86 points higher (95% CI 5.68 to 32.03; low‐quality evidence) for the GAS (up to five functional goals scored on 5‐point scale (−2 = much less than expected to +2 = much more than expected)), 2.91 points higher (95% CI 1.01 to 4.82; low‐quality evidence) for the satisfaction subscale of the COPM (satisfaction with performance in up to five problem areas scored on a 10‐point scale (1 = not satisfied at all to 10 = extremely satisfied)), and 2.24 points higher (CI 95% 0.64 to 3.84; low‐quality evidence; Figure 4) for the performance subscale of the COPM (performance in up to five problem areas scored on a 10‐point scale (1 = not able to do to 10 = able to do extremely well)). Higher scores represent improved participation.

ANCOVA analyses, page 2
The results reported by the study authors from both phases using general linear model analysis showed no evidence that trihexyphenidyl had any treatment or carry‐over effects for any of the three participation measures but had statistically significant order effects on the GAS (F(1,11) = 10.2, P = 0.009) and borderline significant order effects on the performance component of the COPM (F(1,12) = 4.7, P = 0.05).
Pain and quality of life
Rice 2009 did not report on these outcomes.
Quality of the evidence
Although we judged Rice 2009 to be at low risk of bias in all categories, we considered the quality of the evidence for all reported outcomes to be low after downgrading two levels due to imprecision resulting from the inclusion of a single small study.
Discussion
Summary of main results
For our primary outcomes, the results of our analysis using phase‐one data only from the one included cross‐over trial did not generate evidence that trihexyphenidyl reduces dystonia but did identify that the risk of adverse effects is high. For the secondary outcomes, there was no evidence that trihexyphenidyl increases upper limb function, but there was improved goal attainment relating to improved participation in activities of daily living. There was a lack of internal consistency with the expectation that improvement in goal attainment and participation would be mediated by reduced dystonia. The study did not measure pain or quality of life.
The risk for adverse effects needs to be interpreted with caution, as we were unable to separate out first‐ and second‐phase data. Consequently, we may have underestimated the risk for adverse effects with treatment.
There were slight differences in the results from our analyses using phase‐one data only compared with the published authors' analyses of combined phases. Using the phase‐one data, we observed differences between the treatment and placebo scores that were in the same direction as the published authors’ analyses, but greater in magnitude. In addition, our results found a difference in COPM performance and satisfaction scales compared to the study authors. This suggests that the magnitude of the treatment effect was smaller in the second phase than in the first phase of the trial. It is not possible to determine whether this difference between analyses is due to small carry‐over effects, to chance or to the small numbers of participants in the trial.
Overall completeness and applicability of evidence
The evidence base for trihexyphenidyl in managing dystonia in people with cerebral palsy is incomplete. The only RCT we could find assessed the outcomes of dystonia reduction, adverse effects, upper limb function and goal attainment related to improved function and participation in a small sample of children and young people aged 2 to 17 years, who either walk with assistive devices or are non‐ambulant. No RCTs have evaluated pain, quality of life, or outcomes for adults with dystonic cerebral palsy or higher gross motor function.
Quality of the evidence
Using the GRADE criteria (GRADE 2004; Schünemann 2017), we rated the quality of the evidence for all outcomes as low, due to the small sample size and lack of any other RCT, leading to imprecision and inconsistency. Consequently, our confidence in the effect estimate is limited: the true effect may be substantially different from the estimate of the effect.
Potential biases in the review process
We conducted an extensive search of all available literature, including grey literature. We included trials regardless of publication date or language. Therefore, we are confident that this review includes all published evidence from RCTs on this topic to date. By including only RCTs, we excluded a small number of non‐randomised studies that examine trihexyphenidyl in cerebral palsy; however, these studies do not add to the quality of evidence for this intervention. One author of this review (DSR) is a co‐author of a published study that we excluded from the review, and three review authors (AH, AS and DSR) collaborate with authors of the included published trial. Independent review authors assessed the eligibility, risk of bias and quality of the evidence for this study.
Agreements and disagreements with other studies or reviews
There is little literature with which to compare the results of this review. Our results are consistent with a recent systematic review of the efficacy of oral pharmacological treatments in dyskinetic cerebral palsy. That review also included the study by Rice 2009, which met our eligibility criteria (Criteria for considering studies for this review), concluding that "trihexyphenidyl needs further investigation, primarily in dystonic patients with predominant involvement of upper limb" (Masson 2017).
Other non‐randomised studies have reported inconsistent results from studies examining trihexyphenidyl in cerebral palsy. In contrast to our review, a prospective, open‐label, multicentre pilot trial of high‐dose trihexyphenidyl in 23 children aged 4 to 15 years with cerebral palsy and dystonia impairing function in the dominant upper extremity found some improvement in upper limb function (Sanger 2007). However post hoc analyses indicated that a subgroup of children with hyperkinetic dystonia worsened over this period. Similar to our review, Sanger 2007 reported no effect for reducing dystonia or improving gross motor function, quality of life, or care and comfort. Retrospective chart reviews have reported results inconsistent with ours: Carranza del Rio 2011 reported reduction of dystonia, and Ben‐Pazi 2011 and Hoon 2001, improvements in motor function; however, methodological issues and inconsistent outcome reporting lower the quality of these results. Also, higher positive outcomes can be expected when using retrospective data. Although these non‐randomised studies add to the body of literature for trihexyphenidyl in dystonia in cerebral palsy, their results need to be interpreted with caution due to the low quality of the evidence.
Consistent with our review, all studies reported a high incidence of adverse effects.
Study flow diagram.

Risk of bias summary: review authors' judgements about each risk of bias item for each included study.

ANCOVA analyses, page 1
ANCOVA analyses, page 2

Comparison 1 Trihexphenidyl versus placebo, Outcome 1 Adverse effects.
| Trihexyphenidyl compared with placebo for dystonia in cerebral palsy | |||||
| Patient or population: children with dystonic cerebral palsy Settings: one tertiary care hospital Intervention: trihexyphenidyl Comparison: placebo | |||||
| Outcomes | Illustrative comparative risks* (95% CI) | Relative effect | Number of participants | Quality of the evidence | |
| Assumed risk | Corresponding risk | ||||
| Placebo | Trihexyphenidyl | ||||
| Change in dystonia from baseline Measured by: BADS (eight body regions assessed for dystonia on a five‐point scale (0 = none to 4 = severe), minimum score 0 to maximum score 32; higher score = greater severity of dystonia) Follow‐up: 12 weeks | The mean follow‐up score in the control group was 15.50 points | The mean follow‐up score in the intervention group was 2.67 points higher (2.55 lower to 7.90 higher) | — | 16 | ⊕⊕⊝⊝ Lowa |
| Adverse effectsb (mood disturbance, irritability, behavioural change, constipation) Measured by: counts of number and type Follow‐up: various (includes data assessed at both 12 and 28 weeks) | 375 per 1000 | 1000 per 1000 | RR 2.54 (1.38 to 4.67) | 16 | ⊕⊕⊝⊝ |
| Participation in activities of daily living:individual goal setting Measured by: GAS (up to 5 functional goals scored on a 5‐point scale (−2 = much less than expected to +2 = much more than expected); higher score = better than expected outcome) Follow‐up: 12 weeks | The mean follow‐up score in the control group was 27.63 points | The mean follow‐up score in the intervention group was 18.86 points higher (5.68 higher to 32.03 higher) | — | 16 | ⊕⊕⊝⊝ |
| Participation in activities of daily living:satisfaction with individual goals Measured by: satisfaction subscale of the COPM (satisfaction with performance in up to 5 problem areas scored on a 10‐point scale (1 = not satisfied at all to 10 = extremely satisfied); higher score = greater satisfaction) Follow‐up: 12 weeks | The mean follow‐up score in the control group was 2.96 points | The mean follow‐up score in the intervention group was 2.91 points higher (1.01 higher to 4.82 higher) | — | 16 | ⊕⊕⊝⊝ |
| Participation in activities of daily living:performance of individual goals Measured by: performance subscale of the COPM (up to five problem areas scored on a 10‐point scale (1 = not able to do to 10 = able to do extremely well; higher score = better performance) Follow‐up: 12 weeks | The mean follow‐up score in the control group was 3.14 points | The mean follow‐up score in the intervention group was2.24 points higher (0.64 higher to 3.84 higher) | — | 16 | ⊕⊕⊝⊝ |
| Quality of life | Not measured | ||||
| *The basis for the assumed risk is provided in the footnotes. The corresponding risk (and its 95% CI) is based on the assumed risk in the comparison group and the relative effect of the intervention (and its 95% CI) | |||||
| GRADE Working Group grades of evidence | |||||
| aDowngraded two levels due to imprecision; small sample size from one study only. | |||||
| Method | Unused methods |
| Measures of treatment effect | Continuous data For continuous outcomes we will calculate the MD and corresponding 95% CI if studies use the same rating scales. We will calculate the SMD with 95% CIs if studies use different scales to measure the same outcomes. As recommended in section 9.4.5.2 of the Cochrane Handbook for Systematic Reviews of Interventions (Deeks 2017), we will focus on final values unless some of the studies use change scores. We will combine studies that report final values with studies that report only change scores in the same meta‐analysis, provided that the studies use the same rating scale. We will conduct the analysis according to age, as children and adults respond differently to medication. We will combine the data from all groups in studies that have trihexyphenidyl in more than one group (i.e. different frequencies) and then separate these when performing the subgroup analysis to see how the different frequencies influence the results (see item four in the Subgroup analysis and investigation of heterogeneity section). |
| Multiple outcomes If studies provide multiple, interchangeable measures of the same construct at the same point in time, we will calculate the average SMD across the outcomes and the average estimated variances, as recommended in section 16.1.2 of the Cochrane Handbook for Systematic Reviews of Interventions (Higgins 2011b). | |
| Unit of analysis issues | Cluster‐RCTs If included trials use cluster randomisation, we will extract an ICC and use this to reanalyse the data. Where no ICC is given and a unit of analysis error appears to exist, we will contact the trial authors and ask them to provide either an ICC or the raw data to enable calculation of an ICC. Where no ICC is made available, we will search for similar studies from which we can impute an ICC, or seek statistical advice to obtain an estimate of the ICC. |
| Dealing with missing data | We will contact trial investigators to request missing data. If the trialists provide missing data, we will conduct a meta‐analysis according to intention‐to‐treat principles using all data and keeping participants in the treatment group to which they were originally randomised, regardless of the treatment they actually received, as recommended in section 16.1.2 of the Cochrane Handbook for Systematic Reviews of Interventions (Higgins 2011b). If missing data are not provided, we will analyse only the available data. If there is concern regarding a high level of missing data, such that data could not be included in a meta‐analysis, we will include a qualitative summary in the text of the review. We will document missing data and attrition in the 'Risk of bias' tables, and we will explore how missing data might affect the interpretation of the results by conducting a sensitivity analysis. |
| Assessment of heterogeneity | We will assess clinical heterogeneity by comparing the between‐trials distribution of participant characteristics (e.g. children versus adults) and intervention characteristics (e.g. treatment type and dose), and assess methodological heterogeneity by comparing trial characteristics (e.g. cross‐over versus parallel design). We will evaluate statistical heterogeneity using the I2 statistic and the Chi2 test of heterogeneity, with statistical significance set at P value < 0.10. As recommended in section 9.5.2 of the Cochrane Handbook for Systematic Reviews of Interventions (Deeks 2017), we will consider I2 values as follows.
We will report Tau2 as an estimate of the between‐study variance when reporting the results from the random‐effects model. |
| Assessment of reporting biases | If we identify 10 or more studies, we will use funnel plots to investigate the relationship between intervention effect and study size. We will explore possible reasons for any asymmetry found. We will analyse the funnel plot of the data to ascertain asymmetry. Asymmetry of a funnel plot may indicate, among other things, publication bias or poor methodological quality (Egger 1997). |
| Data synthesis | We will synthesise results in a meta‐analysis using a fixed‐effect model when studies are similar enough with regard to the intervention, population and methods, to assume that the same treatment effect is estimated. We will synthesise results in a meta‐analysis using a random‐effects model when statistical heterogeneity is found or when studies differ enough with regard to the intervention, population, and methods, to assume that different yet related treatment effects are estimated, and when it is deemed to be clinically relevant, as recommended in section 9.4.3.1 of the Cochrane Handbook for Systematic Reviews of Interventions (Deeks 2017). |
| Subgroup analysis and investigation of heterogeneity | We will conduct the subgroup analyses listed below.
We will also look at the number of participants per study to determine if this is sufficient to perform a subgroup analysis. |
| Sensitivity analysis | We will conduct sensitivity analyses to investigate the effect on the overall results of excluding trials that meet the criteria described below.
We will also conduct a sensitivity analysis for studies with very low risk of bias. In addition, we will conduct a sensitivity analysis using a range of ICCs to assess the impact on treatment effect. |
| CI: confidence intervals; ICC: intraclass correlation coefficient; MD: mean difference; SMD: standardised mean difference. | |
| Outcome or subgroup title | No. of studies | No. of participants | Statistical method | Effect size |
| 1 Adverse effects Show forest plot | 1 | Risk Ratio (M‐H, Fixed, 95% CI) | Totals not selected | |