Alimentación enteral a un volumen alto versus estándar para promover el crecimiento en lactantes prematuros o con bajo peso al nacer
Resumen
Antecedentes
La leche materna sola, proporcionada a los volúmenes estándares recomendados (150 a 180 ml/kg/d), no es suficiente para alcanzar los requerimientos proteicos, energéticos y de otros nutrientes de los lactantes prematuros o con bajo peso al nacer en crecimiento. Una estrategia que se puede utilizar para solucionar estos posibles déficits nutricionales es proporcionarles a los lactantes una alimentación enteral que exceda los 200 ml/kg/d (alimentación a un "volumen alto"). Este enfoque puede aumentar la ingesta de nutrientes y las tasas de crecimiento, pero las inquietudes incluyen que la alimentación enteral a un volumen alto puede provocar intolerancia alimentaria, reflujo gastroesofágico, neumonía por aspiración, enterocolitis necrosante o complicaciones relacionadas con la sobrehidratación como el conducto arterioso permeable y la displasia broncopulmonar.
Objetivos
Evaluar el efecto sobre el crecimiento y la seguridad de alimentar a los lactantes prematuros o con bajo peso al nacer con alimentación enteral a un volumen alto (> 200 ml/kg/d de) versus estándar (≤ 200 ml/kg/d). Los lactantes de los grupos de intervención y control deben haber recibido el mismo tipo de leche (leche materna, leche maternizada o ambas), la misma fortificación o suplementos de micronutrientes, así como el mismo régimen de alimentación enteral (bolo, continuo) y la misma tasa de ascenso del volumen de alimentación.
Realizar análisis de subgrupos según el tipo de leche (leche materna versus leche maternizada), la edad gestacional o la categoría de peso al nacer de los lactantes incluidos (muy prematuro o MBPN versus prematuro o BPN), la presencia de restricción del crecimiento intrauterino (con el uso del peso al nacer con respecto a la población de referencia como una alternativa), y el nivel de ingresos del país en el cual se realizó el ensayo (ingresos bajos o medios versus ingresos altos) (ver "Análisis de subgrupos e investigación de la heterogeneidad").
Métodos de búsqueda
Se utilizó la estrategia de búsqueda estándar del Grupo Cochrane de Neonatología que incluyó búsquedas en el Registro Cochrane Central de Ensayos Controlados (Cochrane Central Register of Controlled Trials) (CENTRAL; 2017, número 2) en la Cochrane Library; MEDLINE (1946 hasta noviembre 2016); EMBASE (1974 hasta noviembre 2016); y en la Cumulative Index to Nursing and Allied Health Literature (CINAHL; 1982 hasta noviembre 2016), así como en actas de congresos, revisiones anteriores, y en registros de ensayos.
Criterios de selección
Ensayos controlados aleatorios y cuasialeatorios que compararon alimentación enteral a volumen alto versus volumen estándar en lactantes prematuros o con bajo peso al nacer.
Obtención y análisis de los datos
Dos autores de la revisión evaluaron la elegibilidad de los ensayos y el riesgo de sesgo y de forma independiente extrajeron los datos. Se analizaron los efectos del tratamiento en los ensayos individuales y se informó el cociente de riesgos y la diferencia de riesgos para los datos dicotómicos y la diferencia de medias para los datos continuos, con los intervalos de confianza del 95% respectivos. . La calidad de la evidencia se evaluó a nivel del resultado mediante el enfoque GRADE.
Resultados principales
Se encontró un ensayo elegible que incluyó a 64 lactantes. Este ensayo no estaba cegado. El análisis mostró una tasa mayor de aumento de peso en el grupo de alimentación a un volumen alto: diferencia de medias 6,20 g/kg/d (intervalo de confianza del 95%: 2,71 a 9,69). No hubo aumento del riesgo de intolerancia alimentaria ni de enterocolitis necrosante con la alimentación a un volumen alto, pero los intervalos de confianza del 95% alrededor de estas estimaciones fueron amplios. La calidad de la evidencia para estos resultados se consideró "baja" o "muy baja" debido a la imprecisión de las estimaciones del efecto y la inquietud por el riesgo de sesgo como consecuencia de la falta de cegamiento en el ensayo incluido. Los autores del ensayo no presentaron datos sobre otros resultados, incluidos el reflujo gastroesofágico, la neumonía por aspiración, la enterocolitis necrosante, el conducto arterioso permeable, la displasia broncopulmonar ni el crecimiento y el desarrollo nervioso a largo plazo.
Conclusiones de los autores
Se encontraron solamente datos muy limitados de un ensayo pequeño no cegado sobre los efectos de la alimentación a un volumen alto sobre resultados importantes en lactantes prematuros o con bajo peso al nacer. La calidad de la evidencia es baja o muy baja. Por lo tanto, la evidencia disponible no es suficiente para apoyar ni refutar la alimentación enteral a un volumen alto en los lactantes prematuros o con bajo peso al nacer. Se necesita un ensayo controlado aleatorio pragmático grande que aporte datos de calidad y precisión suficientes para informar la política y la práctica.
PICOs
Resumen en términos sencillos
Volúmenes altos versus estándares de alimentación para los lactantes prematuros o con bajo peso al nacer
Pregunta de la revisión
¿Proporcionar a los lactantes prematuros o con bajo peso al nacer más leche que la que se les proporciona habitualmente estimula el crecimiento sin provocar problemas alimentarios?
Antecedentes
Los lactantes nacidos muy temprano (prematuros) o muy pequeños (bajo peso al nacer) necesitan nutrientes adicionales para el crecimiento en comparación con los lactantes más grandes o más maduros. Una manera de proporcionar nutrición adicional es proporcionarles a los lactantes más leche que la habitual ("alimentación a un volumen alto"), generalmente más de 200 ml por kilogramo por día. Aunque proporcionar altos volúmenes de leche a los lactantes prematuros o con bajo peso al nacer podría aumentar las tasas de crecimiento, las inquietudes al respecto incluyen que los lactantes no puedan tolerar altos volúmenes de alimentación y puedan presentar efectos secundarios como problemas intestinales graves. Se buscó la evidencia proveniente de ensayos clínicos que evaluara si la alimentación a un volumen alto es beneficiosa o perjudicial para los lactantes prematuros o con bajo peso al nacer.
Características de los estudios
A través de las búsquedas bibliográficas actualizadas hasta noviembre de 2016, sólo se encontró un ensayo controlado aleatorio pequeño (con 64 lactantes con muy bajo peso al nacer) que analizó esta pregunta.
Resultados clave
Los lactantes con muy bajo peso al nacer que reciben más leche que los volúmenes estándares aumentan de peso más rápidamente durante la estancia hospitalaria. No se encontró evidencia que indique que proporcionar a los lactantes altos volúmenes de leche provoque problemas alimentarios o intestinales, pero este resultado no es confiable.
Conclusiones
La evidencia disponible no es suficiente para apoyar ni refutar la administración de alimentación a un volumen alto a los lactantes prematuros o con bajo peso al nacer. La alimentación a un volumen alto podría aumentar la tasa de aumento de peso, pero se necesitan más ensayos para confirmar este hallazgo y para examinar si la alimentación a un volumen alto causa problemas a los lactantes prematuros o con bajo peso al nacer.
Authors' conclusions
Summary of findings
| High‐volume feeds vs standard‐volume feeds for preterm or low birth weight infants | |||||
| Patient or population: preterm or low birth weight infants | |||||
| Outcomes | Anticipated absolute effects* (95% CI) | Relative effect | No. of participants | Quality of the evidence | |
| Risk with standard‐volume feeds | Risk with high‐volume feeds | ||||
| Weight gain (g/kg/d) | Mean weight gain was 18.7 g/kg/d | Mean weight gain was 6.2 g/kg/d higher | ‐ | 61 | ⊕⊕⊝⊝ |
| Feed intolerance | Study population | RR 1.81 | 61 | ⊕⊕⊝⊝ | |
| 258 per 1000 | 467 per 1000 | ||||
| Necrotising enterocolitis | Study population | RR 1.03 | 61 | ⊕⊝⊝⊝ | |
| 32 per 1000 | 33 per 1000 | ||||
| *Risk in the intervention group (and its 95% CI) is based on assumed risk in the comparison group and relative effect of the intervention (and its 95% CI). | |||||
| aDowngraded for risk of bias (lack of blinding). bDowngraded for imprecision. cDowngraded (by 2) for serious imprecision. | |||||
Background
Description of the condition
The optimal growth rate of infants born preterm or with low birth weight (LBW) is not known (Higgins 2012). Consensus guidelines suggest that caregivers should aim to achieve a postnatal growth rate similar to the gestation‐equivalent foetal intrauterine growth rate (Agostoni 2010). Many preterm or LBW infants, especially those born very preterm or at very low birth weight (VLBW), do not achieve these rates of growth and are growth restricted at the time of hospital discharge (Ehrenkranz 1999; Steward 2002; Clark 2003; Cooke 2004; Sakurai 2008; Shan 2009; Lima 2014; Horbar 2015; Stevens 2016). Growth deficits can persist through childhood and adolescence and into adulthood (Dusick 2003; Hack 2003; Brandt 2005; Euser 2008; Stein 2013). Slow postnatal growth is associated with neurodevelopmental impairment and with poorer cognitive and scholastic outcomes (Brandt 2003; Franz 2009; Neubauer 2013; Leppanen 2014). Furthermore, concerns include that nutritional deficiency and growth restriction during infancy may have adverse effects on long‐term metabolic and cardiovascular health (Higgins 2012; Embleton 2013; Lapillonne 2013).
Description of the intervention
Human breast milk is the recommended form of enteral nutrition for newborn infants for at least the first six months of postnatal life (Johnston 2012). However, breast milk alone, given at volumes that meet the nutritional needs of term infants, may not meet the higher nutritional requirements of growing preterm or LBW infants (Embleton 2007). International consensus guidelines state that 'standard' volumes (about 150 to 180 mL/kg/d) of breast milk do not provide the recommended amount of energy (110 to 135 kCal/kg/d) or protein (3.5 to 4.5 g/kg/d) to meet the metabolic needs of very preterm or VLBW infants (Table 1) (CPS 1995; AAP 2004; Agostoni 2010).
| per 100 mL | Expressed breast milk (EBM) | EBM + Fortifier | Term formula | Preterm formula |
| Energy (kCal) | 67 | 74 to 80 | 67 | 80 |
| Protein (g) | 1.2 to 1.7 | 2.0 to 2.5 | 1.5 | 2.4 |
In neonatal care facilities in high‐income countries, the strategy most commonly employed to address these potential nutrient deficits is to supplement breast milk with extra nutrients, usually in the form of a commercially available powder or liquid 'multi‐nutrient fortifier' extracted from cow's milk (Uhing 2009; Klingenberg 2012; Cormack 2013; Dutta 2015). Multi‐nutrient fortification may be especially important for infants who receive donated (donor expressed) breast milk, which typically contains lower levels of energy and protein than breast milk expressed by the mother (Arslanoglu 2013). A Cochrane Review of randomised controlled trials provides evidence that feeding preterm infants with multi‐nutrient fortified breast milk rather than unfortified breast milk increases growth rates during the initial hospitalisation period (Brown 2016). However, commercially available fortifiers are expensive, and their use is less feasible in resource‐poor settings in low‐ or middle‐income countries (Chawla 2008; Kler 2015).
'High‐volume' feeds
An alternative, cheaper way of meeting the recommended daily intakes of energy, protein, and other nutrients for preterm or LBW infants is to increase the total volume of enteral feeds (Klingenberg 2012). Feeding preterm or LBW infants with daily volumes of milk in excess of 200 mL/kg ('high‐volume' feeds) has been proposed as a safe and effective growth‐enhancement strategy (Valman 1974; Lewis 1984; Doege 2007). Whereas feeding preterm or LBW infants with unfortified maternal breast milk at 150 mL/kg/d typically would provide 100 kCal/kg/d and between 1.8 and 3.0 g/kg/d of protein (depending on the type of expressed breast milk), feeding at 200 mL/kg/d could provide 135 kCal/kg/d and between 2.4 and 4.0 g/kg/d of protein. However, because of concerns about fluid overload and complications such as feed intolerance, necrotising enterocolitis (NEC), patent ductus arteriosus (PDA), bronchopulmonary dysplasia (BPD), and metabolic complications such as hyponatraemia, high‐volume enteral feeding has not become an established practice (Chawla 2008; Sankar 2008; Bertino 2009; Klingenberg 2012; Raban 2013).
Formula feeding
Standard 'term' formula, designed to match the composition of mature breast milk, does not provide the recommended nutrient needs for growing preterm infants. Commercially available 'preterm formula', enriched with energy (about 80 kCal/100 mL) and protein (about 2.2 g/100 mL), is commonly used to provide the extra nutrients required without increasing the volume of feeds beyond about 150 mL/kg/d to 180 mL/kg/d (Klingenberg 2012; Tudehope 2013). Nutrient‐enriched formula is more expensive, is not widely available, and is used less often in low‐ and middle‐income countries (Chawla 2008). Theoretically, the same strategy as applies to breast milk‐fed infants could apply, that is, high‐volume feeding with standard formula as a cheaper and more readily available alternative to standard‐volume feeding with nutrient‐enriched preterm formula.
How the intervention might work
Feeding preterm or LBW infants higher volumes of milk (more than 200 mL/kg/d) may be expected to promote nutrient accretion and faster rates of growth (increase in weight, length, and head circumference). Higher levels of nutrient intake during this critical period may be important for optimising long‐term growth and neurodevelopment (Embleton 2013). Potential disadvantages of high‐volume enteral feeding also are known. High volumes of milk may add to the physiological and metabolic stress of the immature gastrointestinal tract and its blood supply, thus increasing risk of NEC. This may result in or worsen gastro‐oesophageal reflux, increasing risk of apnoea or aspiration. High‐volume feeds may lead to fluid overload and associated complications such as peripheral or pulmonary oedema, PDA, and BPD. Furthermore, enteral feeding that is ceased owing to intolerance may reduce total nutrient intake over time, thus adversely affecting growth.
Why it is important to do this review
Given the potential of high‐volume enteral feeding to increase nutrient accretion and growth rates, while improving developmental outcomes in preterm or LBW infants, as well the potential risks of this feeding strategy, we undertook a systematic review that would identify and appraise data from randomised controlled trials, to provide a synthesis of evidence that could inform practice and research. No systematic review has examined this topic.
Objectives
To assess the effect on growth and safety of feeding preterm or LBW infants with high (> 200 mL/kg/d) versus standard (≤ 200 mL/kg/d) volume of milk. Infants in intervention and control groups should have received the same type of milk (breast milk, formula, or both), the same fortification or micronutrient supplements, and the same enteral feeding regimen (bolus, continuous) and rate of feed volume advancement.
To conduct subgroup analyses based on type of milk (breast milk vs formula), gestational age or birth weight category of included infants (very preterm or VLBW vs preterm or LBW), presence of intrauterine growth restriction (using birth weight relative to the reference population as a surrogate), and income level of the country in which the trial was conducted (low or middle income vs high income) (see Subgroup analysis and investigation of heterogeneity).
Methods
Criteria for considering studies for this review
Types of studies
Randomised and quasi‐randomised controlled trials, including cluster‐randomised controlled trials.
Types of participants
Preterm (< 37 weeks' gestational age) or LBW (< 2500 grams) infants.
Types of interventions
-
Intervention: high‐volume enteral feeds: > 200 mL/kg/d
-
Control: standard‐volume enteral feeds: ≤ 200 mL/kg/d
Infants might have been randomised to the allocated intervention at any stage up to the time of achieving full enteral feeding volumes. The prescribed feeding regimen should have been followed until the infant was able to self‐regulate intake.
Types of outcome measures
Primary outcomes
-
Rates of weight gain (g/kg/d), linear growth (cm/week), or head growth (cm/week) during hospital stay and z‐scores for these parameters; proportion of infants who remain below the 10th percentile for the index population up to discharge from hospital
-
Growth measures following discharge from hospital to latest follow‐up
Secondary outcomes
-
Neurodevelopmental outcomes assessed after 12 months post term: neurological evaluations; developmental scores; and classifications of disability, including auditory and visual disability. We will define neurodevelopmental impairment as the presence of one or more of the following: non‐ambulant cerebral palsy; developmental quotient greater than two standard deviations below the population mean; and blindness (visual acuity < 6/60) or deafness (any hearing impairment requiring, or unimproved by, amplification)
-
Number of infants with feed intolerance: vomiting, excessive gastric residual volumes (defined by investigators), or abdominal distension that results in reduction or cessation of enteral feeding
-
Number of infants with aspiration pneumonia or pneumonitis (clinical or radiological evidence of lower respiratory tract compromise that has been attributed to covert or evident aspiration of gastric contents)
-
Number of infants with gastro‐oesophageal reflux diagnosed by (i) clinical features; post‐feed (if bolus‐fed) apnoea, desaturation, irritability, or vomiting; or (ii) oesophageal pH monitoring, multiple intraluminal impedance, or endoscopy
-
Frequency of apnoea (no respiratory effort > 20 seconds) or bradycardia (< 100 beats per minute), or apnoea/bradycardia necessitating stimulation, oxygen administration increase, or positive‐pressure ventilation (mean number of episodes per day)
-
Frequency of episodes of spontaneous fall in oxygen saturation (SpO₂) to 85% or less (mean number of episodes per day)
-
Number of infants with NEC (modified Bell stage 2/3; Walsh 1986)
-
Number of infants with BPD (oxygen supplementation at 36 weeks' postmenstrual age)
-
Number of infants with PDA treated pharmacologically or surgically+++
-
All‐cause mortality before discharge or up to 44 weeks' postmenstrual age
-
Mean duration of hospital stay (days)
Search methods for identification of studies
We used the standard search strategy of Cochrane Neonatal (neonatal.cochrane.org/resources‐review‐authors).
Electronic searches
We searched the Cochrane Central Register of Controlled Trials (CENTRAL; 2017, Issue 2) in the Cochrane Library; MEDLINE (1946 to November 2016); Embase (1974 to November 2016); the Cumulative Index to Nursing and Allied Health Literature (CINAHL; 1982 to November 2016); and Maternity and Infant Care (1971 to November 2016). We limited search outputs with relevant search filters for clinical trials, as recommended in the Cochrane Handbook for Systematic Reviews of Interventions (Higgins 2011). We did not apply any language restrictions. See Appendix 1 for details of the search terms that we used.
We searched ClinicalTrials.gov, Current Controlled Trials, and the World Health Organization International Trials Registry and Platform (www.whoint/ictrp/search/en/) for completed or ongoing trials.
Searching other resources
We examined reference lists in related reviews, included, and excluded studies. We searched the proceedings of annual meetings of the Pediatric Academic Societies (1993 to 2016), the European Society for Paediatric Research (1995 to 2016), the Royal College of Paediatrics and Child Health (2000 to 2017), and the Perinatal Society of Australia and New Zealand (2000 to 2016). Trials reported only as abstracts were eligible if sufficient information was available from the report, or from contact with trial authors, to fulfil inclusion criteria.
Data collection and analysis
We used standard methods of Cochrane Neonatal.
Selection of studies
We screened the title and abstract of all studies identified by the above search strategy, and two review authors (TA and WM) independently assessed the full articles for all potentially relevant trials. We excluded studies that did not meet all of the inclusion criteria, and we stated the reason for exclusion. We discussed disagreements until we achieved consensus.
Data extraction and management
Two review authors (TA and WM) extracted data independently using a data collection form to aid extraction of information on design, methods, participants, interventions, outcomes, and treatment effects from each included study. We discussed disagreements until we reached consensus. If data from trial reports were insufficient, we contacted trialists to request further information.
Assessment of risk of bias in included studies
We used criteria and standard methods of Cochrane Neonatal to assess the methodological quality of included trials. Two review authors (TA and VA) assessed risk of bias across key domains (Appendix 2) and resolved disagreements in consultation with a third review author (WM). We requested additional information from trial authors to clarify methods and results when necessary.
Measures of treatment effect
We analysed treatment effects in individual trials using Review Manager 5 and reported risk ratios (RRs) and risk differences (RDs) for dichotomous data, and mean differences (MDs) for continuous data, with respective 95% confidence intervals (CIs) (Review Manager 5). We determined the number needed to treat for an additional beneficial outcome (NNTB) or an additional harmful outcome (NNTH) for analyses with a statistically significant difference in RD.
Unit of analysis issues
The unit on analysis was the participating infant in individual randomised controlled trials (RCTs). For cluster‐RCTs, we planned to undertake analyses at the level of the individual while accounting for clustering in the data using methods recommended in the Cochrane Handbook for Systematic Reviews of Interventions (Higgins 2011).
Dealing with missing data
We requested additional data from trialists if information on important outcomes was missing or was reported unclearly. When data were still missing, we planned to examine the impact on effect size estimates in sensitivity analyses using the 'best‐worst case scenario' technique.
Assessment of heterogeneity
We planned to examine treatment effects of individual trials and heterogeneity between trial results by inspecting forest plots. We planned to calculate the I² statistic for each RR analysis to quantify inconsistency across studies and to describe the percentage of variability in effect estimates that may be due to heterogeneity rather than to sampling error. If we detected moderate or high heterogeneity (I² ≥ 50%), we planned to explore possible causes (e.g. differences in study design, participants, interventions, or completeness of outcome assessments).
Assessment of reporting biases
If we included more than 10 trials in a meta‐analysis, we planned to examine a funnel plot for asymmetry.
Data synthesis
We planned to use a fixed‐effect model for meta‐analyses.
Quality of evidence
We assessed the quality of evidence for the main comparison at the outcome level using the GRADE approach (Appendix 3). Two review authors (TA and VA) assessed independently the quality of evidence found for outcomes identified as critical or important for clinical decision making. We considered evidence from RCTs as high quality but downgraded evidence one level for serious (or two levels for very serious) limitations on the basis of the following: design (risk of bias), consistency across studies, directness of evidence, precision of estimates, and presence of publication bias. We used GRADEproGDT to create a ‘Summary of findings’ (SoF) table to report the quality of evidence (GRADEproGDT).
Subgroup analysis and investigation of heterogeneity
We planned to undertake these subgroup analyses, when possible.
-
Very preterm (< 32 weeks' gestation) or VLBW (< 1500 grams) infants versus preterm infants born at between 32 and 36 weeks' gestation or with birth weight 1500 to 2499 grams.
-
Breast milk‐fed versus formula‐fed infants.
-
Infants with birth weight below the 10th percentile for the reference population ('small for gestational age') versus infants with birth weight 'appropriate for gestational age'.
-
Trials conducted in low‐ or middle‐income versus high‐income countries (data.worldbank.org/about/country‐classifications).
Sensitivity analysis
We planned to undertake sensitivity analyses to determine whether findings were affected when only studies using adequate methods were included (low risk of bias); adequate methods were defined as adequate randomisation and allocation concealment, blinding of intervention and measurement, and less than 10% loss to follow‐up.
Results
Description of studies
See Characteristics of included studies,Characteristics of excluded studies, and Characteristics of ongoing studies.
Results of the search
See Figure 1.

Study flow diagram.
Included studies
We included one trial (Thomas 2012).
The trial enrolled 64 VLBW infants (Thomas 2012). Both appropriate‐for‐gestational‐age and small‐for‐gestational‐age infants were eligible to participate. Infants in the intervention arm received 300 mL/kg/d, and those in the control arm were given 200 mL/kg/d. Participants were fed with expressed breast milk plus individual micronutrient supplementation for iron, calcium, and vitamins. Multi‐nutrient fortifiers, which supplement calories and protein, were not used. The primary outcome was daily rate of weight gain from enrolment until the infant reached 1700 grams weight. Secondary outcomes were feed intolerance (two episodes of vomiting or pre‐feed gastric aspirates > 50% of previous feed volume), tachypnoea (respiratory rate > 60 breaths per minute), PDA (diagnosed clinically or by echocardiograph), NEC (Bell stage 2a or greater), invasive infection (confirmed by blood culture), and biochemical abnormalities.
Excluded studies
We excluded four studies (Characteristics of excluded studies).
-
We excluded two RCTs (Kuschel 2000; Zecca 2014). One of these compared 200 mL/kg/d versus 150 mL/kg/d (Kuschel 2000). This study did not meet our eligibility criteria, which defined any volume up to 200 mL/kg/d as standard‐volume feeds, and volumes > 200 mL/kg/d as high‐volume feeds. The other trial compared 200 mL/kg/d versus 170 mL/kg/d, and reported rates of feed volume advancement that were different between intervention and control groups (Zecca 2014).
-
Two studies were not RCTs (Valman 1974; Lewis 1984). One was an observational study of LBW infants fed 250 mL/kg/d of milk (Lewis 1984). The other was a cohort study comparing two enteral feed volumes; 180 and 230 mL/kg/d (Valman 1974).
Risk of bias in included studies
See Figure 2.

Risk of bias summary: review authors' judgements about each risk of bias item for the included study.
Allocation
The included trial used computer‐generated random numbers for sequence generation and sealed opaque envelopes for allocation concealment (Thomas 2012; personal communication).
Blinding
This trial was unblinded.
Incomplete outcome data
Investigators assessed all participants for primary and secondary outcomes.
Selective reporting
The study protocol was not published. Researchers reported all proposed outcomes (personal communication).
Other potential sources of bias
We identified no other potential source of bias.
Effects of interventions
Primary outcomes
Growth during initial hospital stay (Outcome 1.1)
Trialists reported a higher rate of weight gain in the intervention group (MD 6.2, 95% CI 2.71 to 9.69 g/kg/d; 1 trial, 64 participants) (Analysis 1.1; Figure 3). This trial did not report linear growth and head growth (Thomas 2012).

Forest plot of comparison: 1 High‐volume vs standard‐volume feeds, outcome: 1.1 Weight gain (g/kg/d).
Post‐hospital discharge growth
Trialists did not report growth after hospital discharge (Thomas 2012).
Secondary outcomes
Neurodevelopmental outcomes
Trialists did not report any neurodevelopmental outcomes (Thomas 2012).
Feed intolerance (Outcome 1.2)
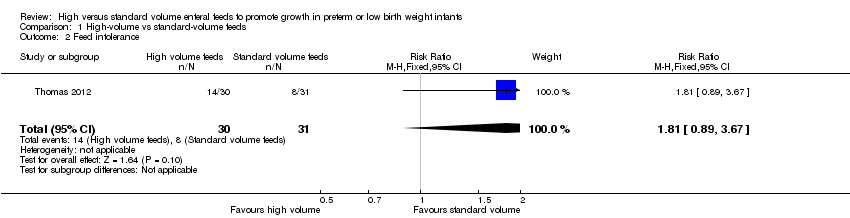
Trialists did not show a difference in the incidence of feed intolerance (RR 1.81, 95% CI 0.89 to 3.67; 1 trial, 64 participants) (Analysis 1.2; Figure 4) (Thomas 2012).
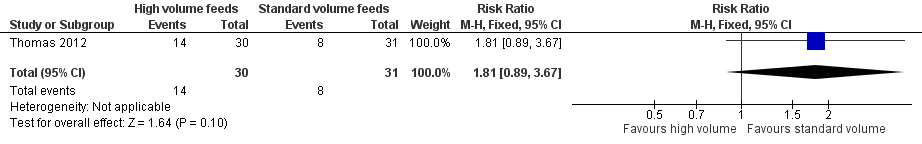
Forest plot of comparison: 1 High‐volume vs standard‐volume feeds, outcome: 1.2 Feed intolerance.
Aspiration pneumonia
Trialists did not report aspiration pneumonia as an outcome (Thomas 2012).
Gastro‐oesophageal reflux
Trialists did not report gastro‐oesophageal reflux as an outcome (Thomas 2012).
Frequency of apnoea/bradycardia/desaturation
Trialists did not report frequency of apnoea/bradycardia/desaturation as an outcome (Thomas 2012).
NEC stage 2/3 (Outcome 1.3)
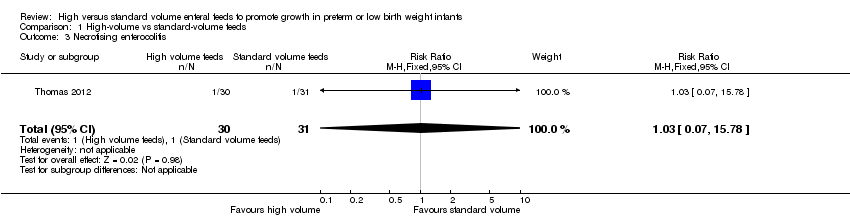
Trialists did not show a difference in risk of NEC stage 2/3 (RR 1.03, 95% CI 0.07 to 15.78) (Analysis 1.3; Figure 5) (Thomas 2012).

Forest plot of comparison: 1 High‐volume vs standard‐volume feeds, outcome: 1.3 Necrotising enterocolitis.
BPD
Trialists did not report BPD as an outcome (Thomas 2012).
PDA
Trialists did not report PDA as an outcome (Thomas 2012).
All‐cause mortality before discharge or at 44 weeks
Trialists reported no death in either of the groups (Thomas 2012).
Duration of hospital stay
Trialists did not report duration of hospital stay as an outcome (Thomas 2012).
Subgroup analyses
-
Very preterm or VLBW infants: All participants in the included trial were VLBW
-
Breast milk‐fed infants: All participants in the included trial were breast milk fed.
-
Small‐for‐gestational‐age infants: Trialists did not show a statistically significant effect on rate of weight gain in a subgroup of small‐for‐gestational‐age infants: High volume (n = 10) 22.5 g/kg/d versus standard volume (n = 14) 17.6 g/kg/d. Trialists did not report standard deviations (SDs) and did not report data for appropriate‐for‐gestational‐age infants, so a subgroup comparison was not possible (Thomas 2012).
-
Low‐ or middle‐income countries: The only included trial was conducted in a low‐ or middle‐income country (India).
Discussion
Summary of main results
Only one small randomised controlled trial (RCT) met the inclusion criteria for this Cochrane Review (Thomas 2012). This trial was unblinded but otherwise of good methodological quality. Analysis showed a higher rate of weight gain in the high‐volume enteral feeds group. An increase in weight gain of 6.2 g/kg/d in the high‐volume feeds group would be clinically significant because it amounts to 43 g/kg/week and 186 g/kg/month. However, owing to the small sample size (n = 64), data is insufficient to provide a precise estimate of the effect of high‐volume enteral feeds on risk of necrotising enterocolitis (NEC) and feed intolerance. We found no data for other outcomes such as linear and head growth, post‐discharge growth, duration of hospital stay, neurodevelopmental outcomes, and risk of complications such as patent ductus arteriosus (PDA), bronchopulmonary dysplasia (BPD), aspiration pneumonia, or gastro‐oesophageal reflux.
Overall completeness and applicability of evidence
Although the included trial showed that high‐volume enteral feeds increase the rate of weight gain, it is plausible that giving high volumes could have resulted in greater feed intolerance and interruption or cessation of enteral feeding that in turn reduced growth rates. The included trial prespecified definitions of feed intolerance that mandated interrupting or ceasing feed volume advancement ‐ principally two ore more episodes of vomiting ‐ or detecting a pre‐feed 'gastric residual volume' that was more than half the volume of the preceding enteral feed. This trial did not show a statistically significant difference in the incidence of feed intolerance, but the 95% confidence interval (CI) was wide (risk ratio (RR) 1.81, 95% CI 0.89 to 3.67), with the upper bound consistent with a greater than three‐fold increase in the incidence of feed intolerance. Similarly, the estimate of effect on the risk of NEC is imprecise, with the upper bound of the 95% CI (RR 1.03, 95% CI 0.07 to 15.78) consistent with a greater than 15‐fold increase in the incidence of NEC.
Most participants in the included trial were stable very preterm (mean gestational age at birth: 32 weeks) or very low birth weight (VLBW) (mean birth weight: 1200 g) infants. About two‐fifths of all participants were small for gestational age. Owing to lack of data, however, subgroup comparisons of appropriate‐for‐gestational‐age versus small‐for‐gestational‐age infants were not possible. The fact that risks of feed intolerance and NEC may differ between these groups of infants may limit the applicability of these data from a low‐ or middle‐income country, where being small for gestational age is a major contributor to VLBW, to high‐income countries, where short gestation (with appropriate growth) is the main cause. It is not clear, furthermore, whether study findings are applicable to other subgroups of infants at risk of developing feed intolerance or NEC, including those with intrauterine growth restriction or compromise, as investigators did not assess these risk factors.
All infants recruited to the included trial were fed with expressed maternal breast milk. Human milk feeding reduces the risk of feed intolerance and NEC in preterm infants, and it is unclear whether this finding could be applied to infants fed artificial formulas. Similarly, all participants received bolus intragastric feeds at two‐ to three‐hourly intervals, and it is unclear whether findings can be applied to infants who receive continuous infusion of intragastric feeds, because RCTs have reported conflicting findings about effects of continuous enteral infusion on feed tolerance and NEC in very preterm or VLBW infants (Premji 2011).
Quality of the evidence
The quality of the evidence from the only included trial was low for the primary outcome of weight gain (downgraded for lack of blinding and imprecision of results). The quality of evidence was very low for feed intolerance and NEC (downgraded for lack of blinding and serious imprecision of results).
Although allocation was concealed in the included trial, the intervention was not blinded to caregivers and investigators, and surveillance bias may have influenced assessment of some outcomes, including feed intolerance and NEC. Clinicians' and caregivers' subjective assessments of when to investigate (e.g. examining the infant's abdomen for tenderness or distension) or intervene (e.g. interrupting or ceasing enteral feeds) may have been affected by perceived risks associated with high‐volume feeds. The unblinded design may also have influenced care practices. For example, the perception that high‐volume feeds may be more likely to cause gastro‐oesophageal reflux may influence the attitude of healthcare staff regarding investigation or management of episodes of apnoea, bradycardia, or oxygen desaturation (linked putatively to reflux).
Potential biases in the review process
We found only one small trial for inclusion in this review. Although we conducted a comprehensive search, including a search of conference proceedings, we cannot exclude fully the possibility of publication bias because we do not know whether other published (but not indexed) or unpublished trials have been conducted.
Agreements and disagreements with other studies or reviews
We are not aware of other systematic reviews on the use of high‐volume enteral feeds to increase nutrient intake in preterm or low birth weight infants.
Two of the studies excluded from this review were RCTs involving preterm infants in neonatal units in high‐income countries (Kuschel 2000; Zecca 2014). Although these trials compared different volumes of enteral feeds, in both the studies the higher volume was 200 mL/kg/d, which is the upper limit for our a priori definition of "standard‐volume" feeds.
Consistent with our included trial, both trials showed higher rates of weight gain among infants fed higher volumes of milk than among those given standard volumes of milk: weight gain of 16.2 versus 15.7 g/kg/d until discharge in one study, and discharge weight z‐score of ‐2.04 versus ‐2.31 in the other study (Kuschel 2000; Thomas 2012; Zecca 2014). However, higher‐volume feeds did not result in greater length and head circumference at discharge in both studies. The other benefit of higher‐volume feeds was shorter duration of hospital stay (Zecca 2014). Although one study showed higher rates of fluid retention in the form of oedema with or without respiratory deterioration in the higher‐volume feeds group (27%) than in the standard‐volume feeds group (14%), this difference was not statistically significant (Kuschel 2000).
Risk of bias summary: review authors' judgements about each risk of bias item for the included study.
Forest plot of comparison: 1 High‐volume vs standard‐volume feeds, outcome: 1.1 Weight gain (g/kg/d).
Forest plot of comparison: 1 High‐volume vs standard‐volume feeds, outcome: 1.2 Feed intolerance.
Forest plot of comparison: 1 High‐volume vs standard‐volume feeds, outcome: 1.3 Necrotising enterocolitis.

Comparison 1 High‐volume vs standard‐volume feeds, Outcome 1 Weight gain (g/kg/d).
Comparison 1 High‐volume vs standard‐volume feeds, Outcome 2 Feed intolerance.
Comparison 1 High‐volume vs standard‐volume feeds, Outcome 3 Necrotising enterocolitis.
| High‐volume feeds vs standard‐volume feeds for preterm or low birth weight infants | |||||
| Patient or population: preterm or low birth weight infants | |||||
| Outcomes | Anticipated absolute effects* (95% CI) | Relative effect | No. of participants | Quality of the evidence | |
| Risk with standard‐volume feeds | Risk with high‐volume feeds | ||||
| Weight gain (g/kg/d) | Mean weight gain was 18.7 g/kg/d | Mean weight gain was 6.2 g/kg/d higher | ‐ | 61 | ⊕⊕⊝⊝ |
| Feed intolerance | Study population | RR 1.81 | 61 | ⊕⊕⊝⊝ | |
| 258 per 1000 | 467 per 1000 | ||||
| Necrotising enterocolitis | Study population | RR 1.03 | 61 | ⊕⊝⊝⊝ | |
| 32 per 1000 | 33 per 1000 | ||||
| *Risk in the intervention group (and its 95% CI) is based on assumed risk in the comparison group and relative effect of the intervention (and its 95% CI). | |||||
| aDowngraded for risk of bias (lack of blinding). bDowngraded for imprecision. cDowngraded (by 2) for serious imprecision. | |||||
| per 100 mL | Expressed breast milk (EBM) | EBM + Fortifier | Term formula | Preterm formula |
| Energy (kCal) | 67 | 74 to 80 | 67 | 80 |
| Protein (g) | 1.2 to 1.7 | 2.0 to 2.5 | 1.5 | 2.4 |
| Outcome or subgroup title | No. of studies | No. of participants | Statistical method | Effect size |
| 1 Weight gain (g/kg/d) Show forest plot | 1 | 61 | Mean Difference (IV, Fixed, 95% CI) | 6.20 [2.71, 9.69] |
| 2 Feed intolerance Show forest plot | 1 | 61 | Risk Ratio (M‐H, Fixed, 95% CI) | 1.81 [0.89, 3.67] |
| 3 Necrotising enterocolitis Show forest plot | 1 | 61 | Risk Ratio (M‐H, Fixed, 95% CI) | 1.03 [0.07, 15.78] |