Alimentación enteral a un volumen alto versus estándar para promover el crecimiento en lactantes prematuros o con bajo peso al nacer
Appendices
Appendix 1. Search strategy
De‐duplicated search results from: PubMed, Embase, CINAHL, Cochrane Library (Search date: No limit – November 14, 2016)
Search terms: breast milk OR diet supplementation OR ((fortif* OR supplemented OR supplementation) near ((human OR breast OR expressed) NEAR milk))
Plus the following database‐specific terms:
PubMed: ((infant, newborn[MeSH] OR newborn OR neonate OR neonatal OR premature OR low birth weight OR VLBW OR LBW or infan* or neonat*) AND (randomized controlled trial [pt] OR controlled clinical trial [pt] OR randomized [tiab] OR placebo [tiab] OR drug therapy [sh] OR randomly [tiab] OR trial [tiab] OR groups [tiab]) NOT (animals [mh] NOT humans [mh]))
Embase: (infant, newborn or newborn or neonate or neonatal or premature or very low birth weight or low birth weight or VLBW or LBW or Newborn or infan* or neonat*) AND (human not animal) AND (randomized controlled trial or controlled clinical trial or randomized or placebo or clinical trials as topic or randomly or trial or clinical trial)
CINAHL: (infant, newborn OR newborn OR neonate OR neonatal OR premature OR low birth weight OR VLBW OR LBW or Newborn or infan* or neonat*) AND (randomized controlled trial OR controlled clinical trial OR randomized OR placebo OR clinical trials as topic OR randomly OR trial OR PT clinical trial)
Cochrane Library: (infant or newborn or neonate or neonatal or premature or very low birth weight or low birth weight or VLBW or LBW)
Appendix 2. Risk of bias
-
Random sequence generation: We categorised the method used to generate the allocation sequence as:
-
-
low risk of bias: Any random process (e.g. random number table; computer random number generator; coin tossing; shuffling of cards or envelopes; throwing of dice; drawing of lots; minimisation) (may be implemented without a random element; this is considered equivalent to being random);
-
high risk of bias: any non‐random process (e.g. sequence generated by odd or even date of birth; date (or day) of admission; sequence generated by hospital or clinic record number; allocation by judgement of the clinician; allocation by preference of the participant; allocation based on results of a laboratory test or series of tests; allocation based on availability of the intervention); or
-
unclear risk of bias: insufficient information about the sequence generation process to permit judgement.
-
-
Allocation concealment: We categorised the method used to conceal the allocation sequence as:
-
-
low risk of bias: randomisation method described that would not allow investigator/participant to know or influence the intervention group before eligible participants entered the study (i.e. central allocation, including telephone, Web‐based, and pharmacy‐controlled randomisation; sequentially numbered drug containers of identical appearance; sequentially numbered, opaque, sealed envelopes);
-
high risk of bias: open random allocation schedule (i.e. list of random numbers); assignment envelopes used without appropriate safeguards (e.g. if envelopes were unsealed or non‐opaque, or were not sequentially numbered); alternation or rotation; date of birth; case record number; any other explicitly unconcealed procedure; or
-
unclear risk of bias: randomisation stated but no information provided on method used.
-
-
Blinding of participants and personnel: We assessed blinding of participants, clinicians and caregivers, and outcome assessors separately for different outcomes and categorised the methods used as:
-
-
low risk of bias: no blinding or incomplete blinding, but review authors judged that the outcome was not likely to be influenced by lack of blinding; blinding of participants and key study personnel ensured, and unlikely that blinding could have been broken;
-
high risk of bias: no blinding or incomplete blinding, and the outcome was likely to be influenced by lack of blinding; blinding of key study participants and personnel attempted, but likely that blinding could have been broken, and the outcome was likely to be influenced by lack of blinding; or
-
unclear risk of bias: insufficient information to permit judgement.
-
-
Incomplete outcome data: We described the completeness of data including attrition and exclusions from analysis for each outcome and reasons for attrition or exclusion when reported. We assessed whether missing data were balanced across groups or were related to outcomes. We categorised completeness as:
-
-
low risk of bias: no missing outcome data; reasons for missing outcome data unlikely to be related to true outcome (for survival data, censoring unlikely to introduce bias); missing outcome data balanced in numbers across intervention groups, with similar reasons for missing data across groups; for dichotomous outcome data, proportion of missing outcomes compared with observed event risk not enough to have a clinically relevant impact on the intervention effect estimate; for continuous outcome data, plausible effect size (difference in means or standardised difference in means) among missing outcomes not sufficient to have a clinically relevant impact on observed effect size; missing data imputed by appropriate methods;
-
high risk of bias: reason for missing outcome data likely to be related to true outcome, with imbalance in numbers or reasons for missing data across intervention groups; for dichotomous outcome data, proportion of missing outcomes compared with observed event risk enough to induce clinically relevant bias in intervention effect estimate; for continuous outcome data, plausible effect size (difference in means or standardised difference in means) among missing outcomes enough to induce clinically relevant bias in observed effect ’as‐treated’ analysis done with substantial departure of the intervention received from that assigned at randomisation; potentially inappropriate application of simple imputation; or
-
unclear risk of bias: insufficient information to permit judgement.
-
-
Selective reporting: We assessed reporting bias due to selective outcome reporting as:
-
-
low risk of bias: study protocol available, and all of the study’s prespecified (primary and secondary) outcomes of interest in the review had been reported in the prespecified way; study protocol not available, but it was clear that published reports included all expected outcomes, including those that were prespecified;
-
high risk of bias: not all of the study’s prespecified primary outcomes reported; one or more primary outcomes reported by measurements, analysis methods, or subsets of data (i.e. subscales) that had not been prespecified; one or more reported primary outcomes not prespecified (unless clear justification for their reporting is provided, such as an unexpected adverse effect); one or more outcomes of interest in the review reported incompletely, so they could not be entered into a meta‐analysis; study report failed to include results for a key outcome that would be expected to be reported for such a study; or
-
unclear risk of bias: insufficient information to permit judgement.
-
-
Other bias: We analysed bias due to problems not covered elsewhere in the table as:
-
-
low risk of bias: study appears to be free of other sources of bias;
-
high risk of bias: study had a potential source of bias related to the specific study design used; stopped early because a data‐dependent study design was used; stopped early as the result of a data‐dependent process (including a formal stopping rule); had extreme baseline imbalance; was claimed to be fraudulent; had some other problem; or
-
unclear risk of bias: insufficient information to assess whether an important risk of bias existed; insufficient rationale or evidence to suggest that an identified problem would introduce bias.
-
Appendix 3. GRADE assessment of quality of evidence
GRADE considers evidence from randomised controlled trials as high quality that may be downgraded on the basis of consideration of any of five areas.
-
Design (risk of bias).
-
Consistency across studies.
-
Directness of evidence.
-
Precision of estimates.
-
Presence of publication bias.
The GRADE approach results in assessment of the quality of a body of evidence according to four grades (Schünemann 2013).
-
High: We are very confident that the true effect lies close to the estimate of effect.
-
Moderate: We are moderately confident in the effect estimate: The true effect is likely to be close to the estimate of effect but may be substantially different.
-
Low: Our confidence in the effect estimate is limited: The true effect may be substantially different from the estimate of effect.
-
Very low: We have very little confidence in the effect estimate: The true effect is likely to be substantially different from the estimate of effect.


Risk of bias summary: review authors' judgements about each risk of bias item for the included study.

Forest plot of comparison: 1 High‐volume vs standard‐volume feeds, outcome: 1.1 Weight gain (g/kg/d).
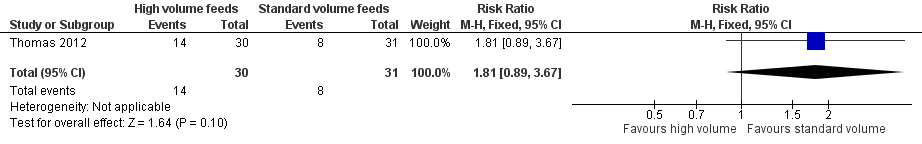
Forest plot of comparison: 1 High‐volume vs standard‐volume feeds, outcome: 1.2 Feed intolerance.

Forest plot of comparison: 1 High‐volume vs standard‐volume feeds, outcome: 1.3 Necrotising enterocolitis.

Comparison 1 High‐volume vs standard‐volume feeds, Outcome 1 Weight gain (g/kg/d).
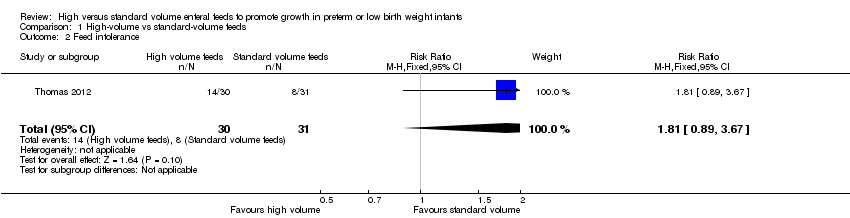
Comparison 1 High‐volume vs standard‐volume feeds, Outcome 2 Feed intolerance.
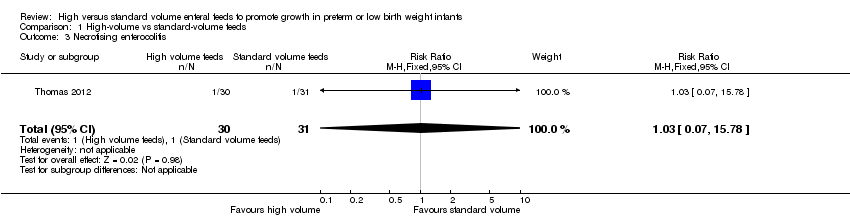
Comparison 1 High‐volume vs standard‐volume feeds, Outcome 3 Necrotising enterocolitis.
| High‐volume feeds vs standard‐volume feeds for preterm or low birth weight infants | |||||
| Patient or population: preterm or low birth weight infants | |||||
| Outcomes | Anticipated absolute effects* (95% CI) | Relative effect | No. of participants | Quality of the evidence | |
| Risk with standard‐volume feeds | Risk with high‐volume feeds | ||||
| Weight gain (g/kg/d) | Mean weight gain was 18.7 g/kg/d | Mean weight gain was 6.2 g/kg/d higher | ‐ | 61 | ⊕⊕⊝⊝ |
| Feed intolerance | Study population | RR 1.81 | 61 | ⊕⊕⊝⊝ | |
| 258 per 1000 | 467 per 1000 | ||||
| Necrotising enterocolitis | Study population | RR 1.03 | 61 | ⊕⊝⊝⊝ | |
| 32 per 1000 | 33 per 1000 | ||||
| *Risk in the intervention group (and its 95% CI) is based on assumed risk in the comparison group and relative effect of the intervention (and its 95% CI). | |||||
| aDowngraded for risk of bias (lack of blinding). bDowngraded for imprecision. cDowngraded (by 2) for serious imprecision. | |||||
| per 100 mL | Expressed breast milk (EBM) | EBM + Fortifier | Term formula | Preterm formula |
| Energy (kCal) | 67 | 74 to 80 | 67 | 80 |
| Protein (g) | 1.2 to 1.7 | 2.0 to 2.5 | 1.5 | 2.4 |
| Outcome or subgroup title | No. of studies | No. of participants | Statistical method | Effect size |
| 1 Weight gain (g/kg/d) Show forest plot | 1 | 61 | Mean Difference (IV, Fixed, 95% CI) | 6.20 [2.71, 9.69] |
| 2 Feed intolerance Show forest plot | 1 | 61 | Risk Ratio (M‐H, Fixed, 95% CI) | 1.81 [0.89, 3.67] |
| 3 Necrotising enterocolitis Show forest plot | 1 | 61 | Risk Ratio (M‐H, Fixed, 95% CI) | 1.03 [0.07, 15.78] |