Estimulación eléctrica con dispositivos no implantados para la incontinencia urinaria de esfuerzo en mujeres
Información
- DOI:
- https://doi.org/10.1002/14651858.CD012390.pub2Copiar DOI

- Base de datos:
-
- Cochrane Database of Systematic Reviews
- Versión publicada:
-
- 22 diciembre 2017see what's new
- Tipo:
-
- Intervention
- Etapa:
-
- Review
- Grupo Editorial Cochrane:
-
Grupo Cochrane de Incontinencia
- Copyright:
-
- Copyright © 2017 The Cochrane Collaboration. Published by John Wiley & Sons, Ltd.
Cifras del artículo
Altmetric:
Citado por:
Autores
Contributions of authors
FS: drafting of protocol, screening of search results, data extraction, data analysis and interpretation, draft manuscript, review manuscript.
BB: review protocol, clinical advice, review analysis, review manuscript.
KB: review protocol, review analysis, review manuscript.
CG: screening of search results, data extraction, data analysis and interpretation, draft manuscript, review manuscript.
Sources of support
Internal sources
-
No sources of support supplied
External sources
-
National Institute for Health Research, UK.
This project was supported by the National Institute for Health Research, via Cochrane Infrastructure, Cochrane Programme Grant or Cochrane Incentive funding to the Incontinence Group. The views and opinions expressed therein are those of the authors and do not necessarily reflect those of the Systematic Reviews Programme, NIHR, NHS or the Department of Health.
Declarations of interest
FS: none known.
BB: none known.
KB: lead author of an included trial (Bø 1999). She was not involved in extracting data or assessing risk of bias for this trial.
CG: none known.
Acknowledgements
The authors are grateful to Jo Booth, Jean Hay‐Smith, Jennifer Hislop, Priya Kannan, Emily Karahalios, Mary Kilonzo, Doreen McClurg and Fiona Tito Wheatland for valuable comments on drafts of this review. We would also like to thank Suzanne Macdonald, Imran Omar, Sheila Wallace and Luke Vale for their support, and the author of one trial for extra information (Oldham 2013).
We would also like to thank Miriam Brazzelli, Mette Frahm Olsen, Beatriz Gualao, Anna Sierawska and Gavin Stewart for help with translations.
Version history
| Published | Title | Stage | Authors | Version |
| 2017 Dec 22 | Electrical stimulation with non‐implanted devices for stress urinary incontinence in women | Review | Fiona Stewart, Bary Berghmans, Kari Bø, Cathryn MA Glazener | |
| 2016 Oct 19 | Electrical stimulation with non‐implanted devices for stress urinary incontinence in women | Protocol | Fiona Stewart, Bary Berghmans, Kari Bø, Cathryn MA Glazener | |
Differences between protocol and review
We added the following to the list of quality of life outcomes: "QoL measures of sexual function or satisfaction; measures of psychological or emotional well‐being".
Keywords
MeSH
Medical Subject Headings (MeSH) Keywords
Medical Subject Headings Check Words
Female; Humans;
PICO
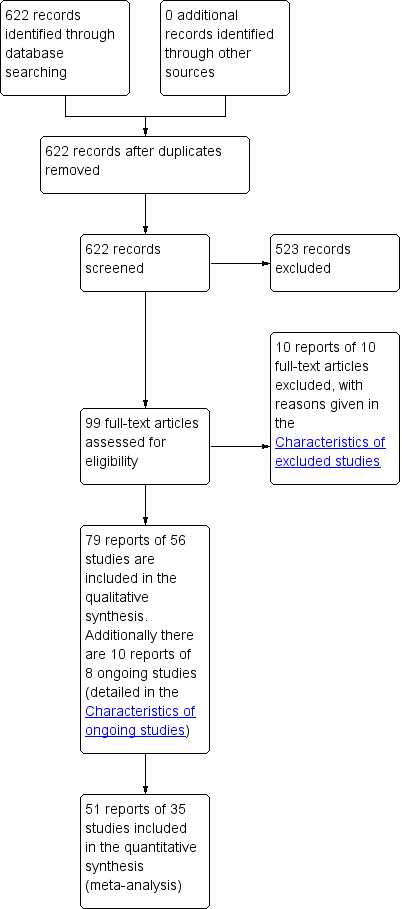
PRISMA study flow diagram

Risk of bias graph: review authors' judgements about each risk of bias item presented as percentages across all included studies.
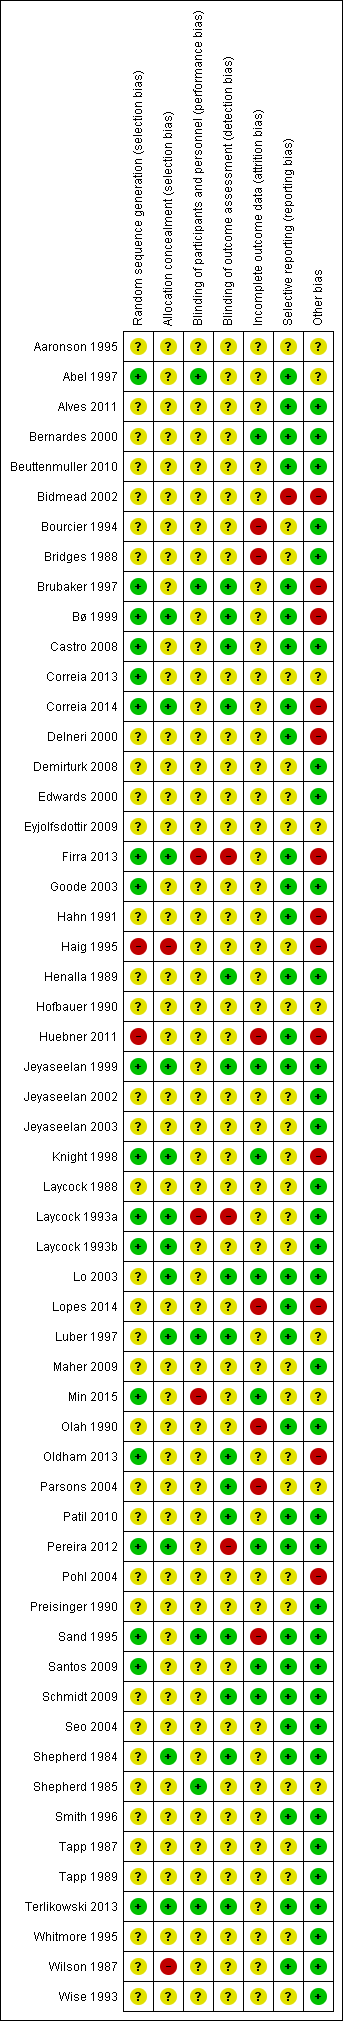
Risk of bias summary: review authors' judgements about each risk of bias item for each included study.
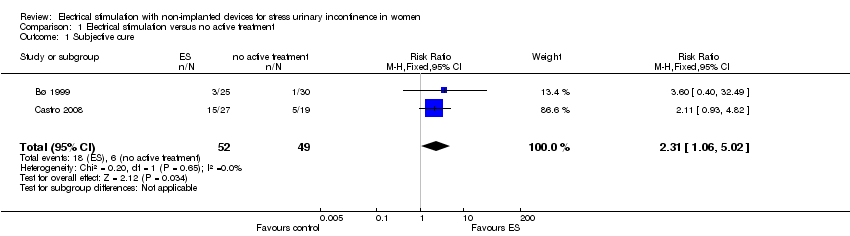
Comparison 1 Electrical stimulation versus no active treatment, Outcome 1 Subjective cure.

Comparison 1 Electrical stimulation versus no active treatment, Outcome 2 Subjective cure or improvement.
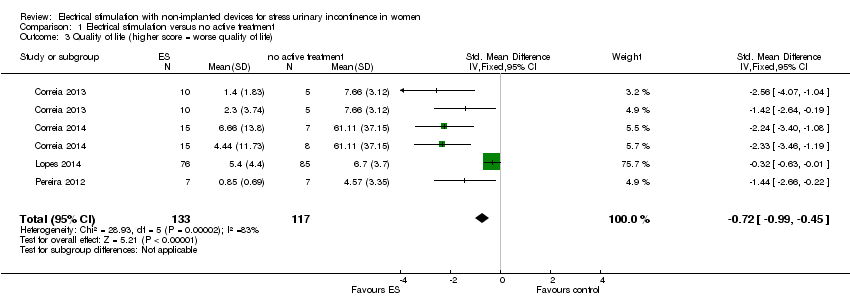
Comparison 1 Electrical stimulation versus no active treatment, Outcome 3 Quality of life (higher score = worse quality of life).

Comparison 1 Electrical stimulation versus no active treatment, Outcome 4 Pad test (g).

Comparison 1 Electrical stimulation versus no active treatment, Outcome 5 Adverse effects.

Comparison 2 Electrical stimulation versus sham treatment, Outcome 1 Subjective cure.

Comparison 2 Electrical stimulation versus sham treatment, Outcome 2 Subjective cure or improvement.

Comparison 2 Electrical stimulation versus sham treatment, Outcome 3 Number of incontinence episodes per 24 h.
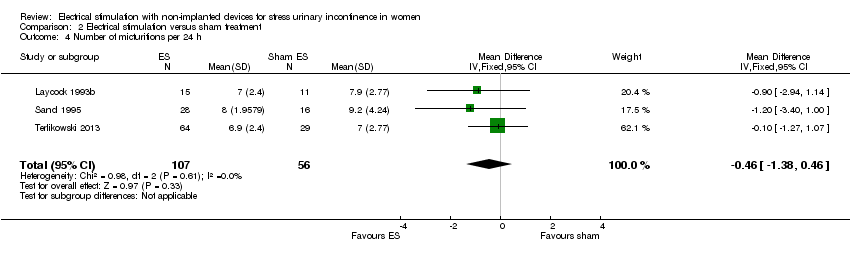
Comparison 2 Electrical stimulation versus sham treatment, Outcome 4 Number of micturitions per 24 h.

Comparison 2 Electrical stimulation versus sham treatment, Outcome 5 Number of pads per week.
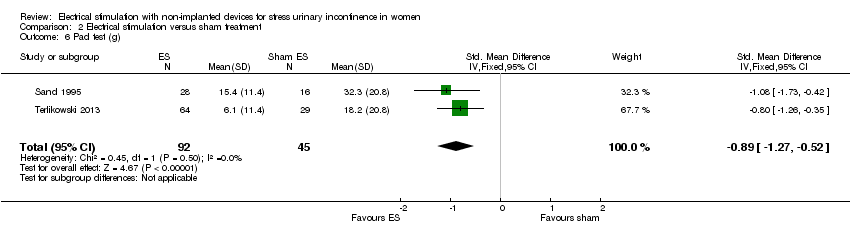
Comparison 2 Electrical stimulation versus sham treatment, Outcome 6 Pad test (g).

Comparison 2 Electrical stimulation versus sham treatment, Outcome 7 Adverse effects.

Comparison 3 Electrical stimulation versus PFMT, Outcome 1 Subjective cure.

Comparison 3 Electrical stimulation versus PFMT, Outcome 2 Subjective cure or improvement.
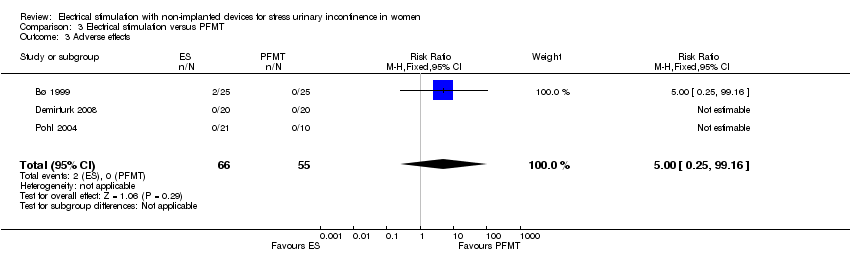
Comparison 3 Electrical stimulation versus PFMT, Outcome 3 Adverse effects.

Comparison 4 Electrical stimulation versus vaginal cones, Outcome 1 Subjective cure.
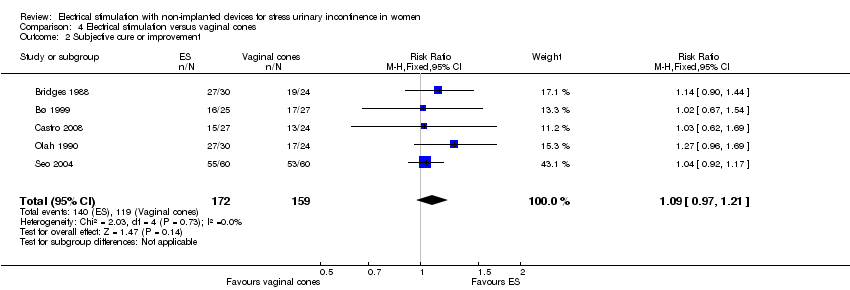
Comparison 4 Electrical stimulation versus vaginal cones, Outcome 2 Subjective cure or improvement.

Comparison 4 Electrical stimulation versus vaginal cones, Outcome 3 Quality of life (I‐QoL).

Comparison 4 Electrical stimulation versus vaginal cones, Outcome 4 Number of incontinence episodes per 24 h.

Comparison 4 Electrical stimulation versus vaginal cones, Outcome 5 Pad test (g).

Comparison 5 Electrical stimulation versus PFMT and vaginal cones, Outcome 1 Subjective cure.

Comparison 5 Electrical stimulation versus PFMT and vaginal cones, Outcome 2 Subjective cure or improvement.

Comparison 6 Electrical stimulation plus PFMT versus PFMT, Outcome 1 Subjective cure.

Comparison 6 Electrical stimulation plus PFMT versus PFMT, Outcome 2 Subjective cure or improvement.

Comparison 6 Electrical stimulation plus PFMT versus PFMT, Outcome 3 Quality of life (higher score = worse quality of life).
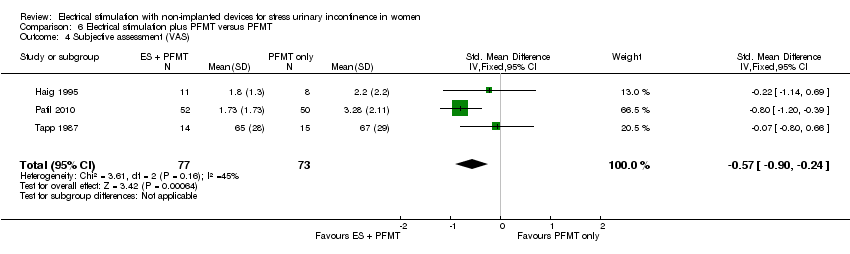
Comparison 6 Electrical stimulation plus PFMT versus PFMT, Outcome 4 Subjective assessment (VAS).

Comparison 6 Electrical stimulation plus PFMT versus PFMT, Outcome 5 Women requesting surgery at end of follow‐up.

Comparison 6 Electrical stimulation plus PFMT versus PFMT, Outcome 6 Number of incontinence episodes per 24 h.

Comparison 6 Electrical stimulation plus PFMT versus PFMT, Outcome 7 Number of micturitions per 24 h.
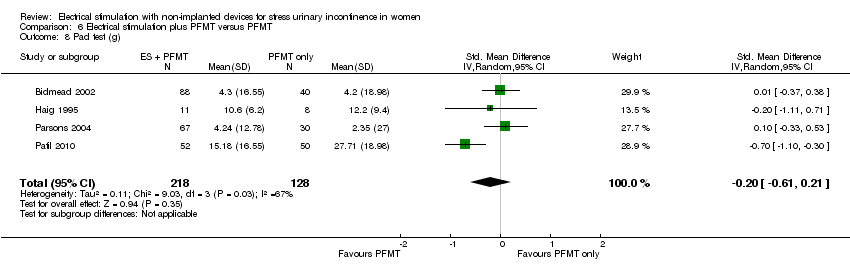
Comparison 6 Electrical stimulation plus PFMT versus PFMT, Outcome 8 Pad test (g).
| Electrical stimulation versus no active treatment | ||||||
| Patient or population: women with stress urinary incontinence | ||||||
| Outcomes | Anticipated absolute effects* (95% CI) | Relative effect | № of participants | Quality of the evidence | Comments | |
| Risk with no active treatment | Risk with electrical stimulation | |||||
| Cure: number of women with self‐reported continence | Study population | RR 2.31 | 101 | ⊕⊕⊕⊝ | — | |
| 122 per 1000 | 283 per 1000 | |||||
| Improvement: number of women with self‐reported improvement in SUI (cured or improved) | Study population | RR 1.73 | 347 | ⊕⊕⊝⊝ | — | |
| 382 per 1000 | 660 per 1000 | |||||
| Incontinence‐specific quality of life (higher score = worse quality of life) assessed with: King's Health Questionnaire, Incontinence Severity Index, ICI‐Q | The mean incontinence‐specific quality of life score was 0.72 standard deviations lower (0.99 lower to 0.45 lower). | — | 250 | ⊕⊕⊕⊝ | A standard deviation of 0.80 | |
| Adverse effects | Study population | RR 5.96 | 103 | ⊕⊝⊝⊝ | 2 trials reported no women with adverse effects in either group. 1 trial reported 2 women with adverse effects in the ES group (1 tenderness and bleeding, 1 discomfort) | |
| 0 per 1000 | 0 per 1000 | |||||
| Cost‐effectiveness | Not reported | |||||
| *The risk in the intervention group (and its 95% confidence interval) is based on the assumed risk in the comparison group and the relative effect of the intervention (and its 95% CI). | ||||||
| GRADE Working Group grades of evidence | ||||||
| aDowngraded two levels due to very serious imprecision (small sample sizes, few events and wide confidence intervals around estimates of effect). | ||||||
| Electrical stimulation versus sham treatment | ||||||
| Patient or population: women with stress urinary incontinence | ||||||
| Outcomes | Anticipated absolute effects* (95% CI) | Relative effect | № of participants | Quality of the evidence | Comments | |
| Risk with sham treatment | Risk with electrical stimulation | |||||
| Cure: number of women with self‐reported continence | Study population | RR 2.21 | 158 | ⊕⊝⊝⊝ | — | |
| 95 per 1000 | 210 per 1000 | |||||
| Improvement: number of women with self‐reported improvement in SUI (cured or improved) | Study population | RR 2.03 | 236 | ⊕⊕⊝⊝ | — | |
| 198 per 1000 | 402 per 1000 | |||||
| Incontinence‐specific quality of life assessed with: IIQ, UDI, I‐QoL | One trial found significantly better I‐QoL scores in the ES group, while another trial found no evidence of a difference between groups in IIQ or UDI scores. | — | 117 | ⊕⊕⊝⊝ | — | |
| Adverse effects | Study population | RR 2.01 | 233 | ⊕⊕⊝⊝ | 2 trials reported no women with adverse effects in either group. 2 trials reported vaginal irritation, bleeding and discomfort in the ES groups. | |
| 23 per 1000 | 47 per 1000 | |||||
| Cost‐effectiveness | Not reported | |||||
| *The risk in the intervention group (and its 95% confidence interval) is based on the assumed risk in the comparison group and the relative effect of the intervention (and its 95% CI). | ||||||
| GRADE Working Group grades of evidence | ||||||
| aDowngraded one level due to unclear risk of bias in most domains). | ||||||
| Electrical stimulation versus PFMT | ||||||
| Patient or population: women with stress urinary incontinence | ||||||
| Outcomes | Anticipated absolute effects* (95% CI) | Relative effect | № of participants | Quality of the evidence | Comments | |
| Risk with PFMT | Risk with Electrical stimulation | |||||
| Cure: number of women with self‐reported continence | Study population | RR 0.51 | 143 | ⊕⊕⊝⊝ | — | |
| 507 per 1000 | 259 per 1000 | |||||
| Improvement: number of women with self‐reported improvement in SUI (cured or improved) | Study population | RR 0.85 | 244 | ⊕⊕⊝⊝ | — | |
| 669 per 1000 | 569 per 1000 | |||||
| Incontinence‐specific quality of life assessed with: I‐QoL and unvalidated instrument | None of the trials found any evidence of a difference between groups. | — | 93 | ⊕⊕⊝⊝ | — | |
| Adverse effects | Study population | RR 5.00 | 121 | ⊕⊕⊝⊝ | 2 trials reported no women with adverse effects in either group. 1 trial reported 2 women with adverse effects in the ES group (1 tenderness and bleeding, 1 discomfort) | |
| 0 per 1000 | 0 per 1000 | |||||
| Cost‐effectiveness | Not reported | |||||
| *The risk in the intervention group (and its 95% confidence interval) is based on the assumed risk in the comparison group and the relative effect of the intervention (and its 95% CI). | ||||||
| GRADE Working Group grades of evidence | ||||||
| aDowngraded one level due to serious risk of bias (unclear risk of bias in most domains). | ||||||
| Electrical stimulation versus vaginal cones | ||||||
| Patient or population: women with stress urinary incontinence | ||||||
| Outcomes | Anticipated absolute effects* (95% CI) | Relative effect | № of participants | Quality of the evidence | Comments | |
| Risk with vaginal cones | Risk with electrical stimulation | |||||
| Cure: number of women with self‐reported continence | Study population | RR 1.04 (0.70 to 1.54) | 157 | ⊕⊕⊝⊝ | — | |
| 363 per 1000 | 454 per 1000 | |||||
| Subjective cure or improvement | Study population | RR 1.09 (0.97 to 1.21) | 331 | ⊕⊕⊝⊝ | — | |
| 685 per 1000 | 768 per 1000 | |||||
| Incontinence‐specific quality of life | — | MD 1.59 higher | — | 96 | ⊕⊕⊝⊝ | Minimum clinically important difference between treatments is 2.5 points |
| Adverse effects | Study population | RR 0.54 | 52 | ⊕⊕⊝⊝ | Adverse effects in the ES group:
Adverse effects in the vaginal cones group:
| |
| 148 per 1000 | 80 per 1000 | |||||
| Cost‐effectiveness | Not reported | |||||
| *The risk in the intervention group (and its 95% confidence interval) is based on the assumed risk in the comparison group and the relative effect of the intervention (and its 95% CI). | ||||||
| GRADE Working Group grades of evidence | ||||||
| aDowngraded one level due to serious risk of attrition bias. | ||||||
| Electrical stimulation versus PFMT plus vaginal cones | ||||||
| Patient or population: women with stress urinary incontinence | ||||||
| Outcomes | Anticipated absolute effects* (95% CI) | Relative effect | № of participants | Quality of the evidence | Comments | |
| Risk with PFMT plus vaginal cones | Risk with electrical stimulation | |||||
| Cure: number of women with self‐reported continence | Study population | RR 1.45 (0.96 to 2.20) | 123 | ⊕⊝⊝⊝ | — | |
| 333 per 1000 | 483 per 1000 | |||||
| Subjective cure or improvement | Study population | RR 1.53 (1.08 to 2.18) | 123 | ⊕⊝⊝⊝ | — | |
| 426 per 1000 | 652 per 1000 | |||||
| Incontinence‐specific quality of life | Not reported | |||||
| Adverse effects | Not reported | |||||
| Cost‐effectiveness | Not reported | |||||
| *The risk in the intervention group (and its 95% confidence interval) is based on the assumed risk in the comparison group and the relative effect of the intervention (and its 95% CI). | ||||||
| GRADE Working Group grades of evidence | ||||||
| aDowngraded one level due to serious risk of performance and detection bias. | ||||||
| Electrical stimulation versus drug therapy | ||||||
| Patient or population: women with stress urinary incontinence | ||||||
| Outcomes | Anticipated absolute effects* (95% CI) | Relative effect | № of participants | Quality of the evidence | Comments | |
| Risk with drug therapy | Risk with electrical stimulation | |||||
| Cure: number of women with self‐reported continence | Not reported | |||||
| Subjective cure or improvement | Study population | RR 13.89 | 50 | ⊕⊝⊝⊝ | — | |
| 0 per 1000 | 0 per 1000 | |||||
| Incontinence‐specific quality of life | Not reported | |||||
| Adverse effects | Not reported | |||||
| Cost‐effectiveness | Not reported | |||||
| *The risk in the intervention group (and its 95% confidence interval) is based on the assumed risk in the comparison group and the relative effect of the intervention (and its 95% CI). | ||||||
| GRADE Working Group grades of evidence | ||||||
| aDowngraded one level due to serious risk of bias (unclear risk of bias in most domains). | ||||||
| Electrical stimulation plus PFMT versus PFMT | ||||||
| Patient or population: women with stress urinary incontinence | ||||||
| Outcomes | Anticipated absolute effects* (95% CI) | Relative effect | № of participants | Quality of the evidence | Comments | |
| Risk with PFMT | Risk with Electrical stimulation plus PFMT | |||||
| Cure: number of women with self‐reported continence | Study population | RR 0.76 | 99 | ⊕⊕⊝⊝ | — | |
| 240 per 1000 | 182 per 1000 | |||||
| Improvement: number of women with self‐reported improvement in SUI (cured or improved) | Study population | RR 1.10 | 308 | ⊕⊕⊝⊝ | — | |
| 639 per 1000 | 703 per 1000 | |||||
| Incontinence‐specific quality of life (higher score = worse quality of life) | The mean incontinence‐specific quality of life score was 0.35 standard deviations lower (0.64 lower to 0.05 lower) | — | 193 | ⊕⊝⊝⊝ | A standard deviation of 0.20 represents a small difference between groups. 2 other trials found no evidence of a difference between groups (data unsuitable for meta‐analysis) | |
| Adverse effects | 1 trial reported 4/59 women in the ES + PFMT group with adverse effects (vaginal irritation) but did not report any data for the PFMT‐only group. | 133 | ⊕⊕⊝⊝ | — | ||
| Cost‐effectiveness | Not reported | |||||
| *The risk in the intervention group (and its 95% confidence interval) is based on the assumed risk in the comparison group and the relative effect of the intervention (and its 95% CI). | ||||||
| GRADE Working Group grades of evidence | ||||||
| aDowngraded one level due to serious risk of bias (unclear risk of bias in all domains). | ||||||
| Electrical stimulation plus surgery versus surgery | ||||||
| Patient or population: women with stress urinary incontinence | ||||||
| Outcomes | Anticipated absolute effects* (95% CI) | Relative effect | № of participants | Quality of the evidence | Comments | |
| Risk with surgery | Risk with electrical stimulation plus surgery | |||||
| Cure: number of women with self‐reported continence | Study population | RR 1.19 | 120 | ⊕⊝⊝⊝ | — | |
| 750 per 1000 | 893 per 1000 | |||||
| Improvement: number of women with self‐reported improvement in SUI (cured or improved) | Study population | RR 5.36 | 120 | ⊕⊝⊝⊝ | — | |
| 917 per 1000 | 1000 per 1000 | |||||
| Incontinence‐specific quality of life assessed with: I‐QoL and ICIQ‐SF | Both I‐QoL and ICIQ‐SF scores suggested higher QoL when ES was added to surgery. | — | 120 | ⊕⊕⊝⊝ | — | |
| Adverse effects | Study population | RR 1.00 | 120 | ⊕⊝⊝⊝ | 3 women in each group reported medial thigh pain. | |
| 150 per 1000 | 150 per 1000 | |||||
| Cost‐effectiveness | Not reported | |||||
| *The risk in the intervention group (and its 95% confidence interval) is based on the assumed risk in the comparison group and the relative effect of the intervention (and its 95% CI). | ||||||
| GRADE Working Group grades of evidence | ||||||
| aDowngraded one level due to serious risk of performance bias. | ||||||
| Surface ES versus intravaginal ES | ||||||
| Patient or population: women with stress urinary incontinence | ||||||
| Outcomes | Anticipated absolute effects* (95% CI) | Relative effect | № of participants | Quality of the evidence | Comments | |
| Risk with intravaginal ES | Risk with surface ES | |||||
| Cure: number of women with self‐reported continence | Not reported | |||||
| Improvement: number of women with self‐reported improvement in SUI (cured or improved) | Not reported | |||||
| Incontinence‐specific quality of life | — | MD 2.9 points higher | — | 30 | ⊕⊕⊝⊝ | Lower score suggests greater quality of life in the intravaginal group |
| Adverse effects | Not reported | |||||
| Cost‐effectiveness | Not reported | |||||
| *The risk in the intervention group (and its 95% confidence interval) is based on the assumed risk in the comparison group and the relative effect of the intervention (and its 95% CI). | ||||||
| GRADE Working Group grades of evidence | ||||||
| aDowngraded two levels due to very serious imprecision (single trial, small sample, wide confidence intervals around estimate of effect). | ||||||
| Low intensity ES plus PFMT versus maximal intensity ES plus PFMT | ||||||
| Patient or population: women with stress urinary incontinence | ||||||
| Outcomes | Anticipated absolute effects* (95% CI) | Relative effect | № of participants | Quality of the evidence | Comments | |
| Risk with maximal intensity ES plus PFMT | Risk with low intensity ES plus PFMT | |||||
| Cure: number of women with self‐reported continence | Not reported | |||||
| Improvement: number of women with self‐reported improvement in SUI (cured or improved) | Study population | RR 0.28 | 49 | ⊕⊕⊝⊝ | — | |
| 667 per 1000 | 187 per 1000 | |||||
| Incontinence‐specific quality of life | Not reported | |||||
| Adverse effects ‐ not reported | Not reported | |||||
| Cost‐effectiveness ‐ not reported | Not reported | |||||
| *The risk in the intervention group (and its 95% confidence interval) is based on the assumed risk in the comparison group and the relative effect of the intervention (and its 95% CI). | ||||||
| GRADE Working Group grades of evidence | ||||||
| aDowngraded two levels due to very serious imprecision (single trial, small sample, wide confidence intervals around estimate of effect). | ||||||
| Conventional ES plus PFMT versus dynamic ES plus PFMT | ||||||
| Patient or population: women with stress urinary incontinence | ||||||
| Outcomes | Anticipated absolute effects* (95% CI) | Relative effect | № of participants | Quality of the evidence | Comments | |
| Risk with dynamic ES plus PFMT | Risk with conventional ES plus PFMT | |||||
| Cure: number of women with self‐reported continence | Not reported | |||||
| Improvement: number of women with self‐reported improvement in SUI (cured or improved) (perception of bother of UI symptoms) | — | MD 0.7 higher | — | 61 | ⊕⊝⊝⊝ | — |
| Incontinence‐specific quality of life | — | MD 4.1 points higher | — | 61 | ⊕⊝⊝⊝ | Scores indicate greater quality of life in the dynamic ES group |
| Adverse effects ‐ not reported | Not reported | |||||
| Cost‐effectiveness ‐ not reported | Not reported | |||||
| *The risk in the intervention group (and its 95% confidence interval) is based on the assumed risk in the comparison group and the relative effect of the intervention (and its 95% CI). | ||||||
| GRADE Working Group grades of evidence | ||||||
| aDowngraded two levels due to very serious risk of bias (high risk of selection and attrition bias). | ||||||
| Study | Current | Current intensity | Pulse shape & duration | Frequency (Hz) | Duty cycle | Electrodes | Treatment duration/supervision |
| Unclear | Unclear | Unclear | Unclear | Unclear | Intravaginal | Unclear | |
| Unclear | Unclear | Unclear | Unclear | Unclear | Unclear | Unclear | |
| Unclear | Maximum tolerable intensity | Biphasic 2000 Hz 100 ms | 50 | 4 s on: 8 s off | Intravaginal | Twice a week for 6 weeks (12 sessions) | |
| Biphasic 2000 Hz 700 ms | |||||||
| Unclear | 10‐30 mA up to maximum tolerable intensity | Symmetrical bidirectional 1 ms | 60 | 6 s on: 12 s off | Intravaginal | 20 min daily for 10 days (10 sessions) | |
| Unclear | Maximum tolerable intensity | 0.2‐0.5 ms | 50 | Rest time at least twice the time of current | Intravaginal | Two 20 min sessions per week for 6 weeks (12 sessions) | |
| Unclear | Unclear | Unclear | Unclear | Unclear | Unclear | Unclear | |
| Unclear | 0‐120 mA up to maximum tolerable intensity | 0.2 ms | 50 | 0.5‐10 s on: 0‐30 s off, adapted on basis of ability to hold voluntary contraction | Intravaginal | 30 min daily | |
| Unclear | Unclear | Unclear | Unclear | Unclear | Unclear | Twelve 30 min sessions over 6 weeks (20 min maximal ES, 10 min EMG/pressure biofeedback) | |
| Unclear | Maximum tolerable intensity | Unclear | 0‐100 | Unclear | Unclear | Three 15 min session per week for 4 weeks (12 sessions) | |
| Bipolar | 0‐100 mA | Bipolar square wave 0.1 µs | 20 | 2 s on: 4 s off | Intravaginal | 20 min daily for 8 weeks (56 sessions) | |
| Bipolar | 0‐100 mA up to maximum tolerable intensity | Bipolar square wave 0.5 milliseconds | 50 | 5 s on: 10 s off | Intravaginal | Three 20 min session per week under supervision of trained physical therapist | |
| Unclear | Maximum tolerable intensity | 700 µs | 50 | Unclear | 4 surface electrodes: 2 in the suprapubic region and 2 medial to the ischial tuberosity | Two 20 min session per week for 3 weeks (6 sessions) | |
| Intravaginal | |||||||
| Unclear | Maximum tolerable intensity | 700 µs | 50 | 4 s on: 8 s off | 4 surface electrodes: 2 in the suprapubic region and 2 medial to the ischial tuberosity | Two 20 min session per week for 6 weeks (12 sessions) | |
| Intravaginal | |||||||
| Unclear | "According to the patient's sensations" | Unclear | 15 min: 20 15 min: 50 | 4 s on: 8 s off | Unclear | 12 x 30 min sessions on consecutive days, excluding Saturdays and Sundays. | |
| Unclear | Unclear | Unclear | 0‐100 Hz | Unclear | 4 vacuum electrodes: 2 in the suprapubic region, 2 near to the medial side of the ischial tuberosity, crosswise | 3 x 15 min session per week for 5 weeks (15 sessions) | |
| Unclear | Unclear | Unclear | Unclear | Unclear | Unclear | Unclear | |
| Unclear | Unclear | 200 µs | 50 | Unclear | Unclear | Unclear | |
| Unclear | Unclear current, intensity according to participant tolerance | Unclear | 12.5 | 5 s on: 10 s off | Intravaginal | 14 x 30 min sessions | |
| Biphasic | According to participant tolerance, up to 100 mA | Biphasic, 1 millisecond | 20 | 1 s on: 1 s off1 | Intravaginal | Home use, 15 min every second day for 8 weeks | |
| Unclear | Unclear | Unclear | 50 | Unclear | Intravaginal | Home use, 6‐8 hours per night for 12 months | |
| Unclear | Unclear | Unclear | 10‐40 | Intravaginal | 20 min sessions, treatment for 3 months (unclear how many sessions) | ||
| Unclear | According to participant tolerance | Unclear | 0‐100 | Unclear | Unclear | 1 x 20 min session per week for 10 weeks (10 sessions) | |
| Unclear | Intensity increased until participant felt a contraction | Unclear | Unclear | 10 ms on: 15 ms off | Unclear | 3 sessions per week for 6 weeks (18 sessions) | |
| Unclear | 20−80 mA | Unclear | 50 | 8 s on: 15 s off | Intravaginal | 2 x 15 min sessions per day for 12 weeks | |
| Unclear | Up to 90 mA | Balanced, asymmetrical biphasic pulse width 250 µs | Background low frequency (to target slow twitch fibres), and intermediate frequency with initial doublet (to target fast twitch fibres) | 10 s on: 50 s off | Intravaginal | Home use (portable device), 1 hour daily for 8 weeks (except when menstruating) | |
| Unclear | Unclear | Unclear | Unclear | Unclear | Unclear | 1 hour daily for 8 weeks (except when menstruating) | |
| Unclear | Unclear | Unclear | Unclear | A range of frequencies in conjunction with a longer duty cycle than is traditionally used | Unclear | Unclear | |
| Unclear | Low intensity, barely perceptible tingling sensation | Pulse width 200 ms | Preset frequencies of 10 Hz with bursts of 35 Hz to maintain fast twitch fibre activity | 5 s on: 5 s off | Intravaginal | Home use (3 hours per day) for 6 months, except during menstruation (overnight) | |
| According to maximum participant tolerance | 35 | 16 x 30 min sessions in clinic | |||||
| Unclear | Unclear | Unclear | Unclear | Unclear | Unclear | 2‐3 30 min sessions per week for 4‐6 weeks | |
| Unclear | According to maximum participant tolerance | Unclear | Three different frequencies: 10 min 1 Hz, 10 min 10‐40 Hz, 10 min 40 Hz | Unclear | Transcutaneous: one medium electrode placed over perineal body and a small electrode positioned immediately inferior to the symphasis pubis | 10 sessions; 1 x 15 min, 9 x 30 min | |
| Unclear | According to maximum participant tolerance | Unclear | Three different frequencies: 10 min 1 Hz, 10 min 10‐40 Hz, 10 min 40 Hz | Unclear | Transcutaneous: one medium electrode placed over perineal body and a small electrode positioned immediately inferior to the symphasis pubis | 10 sessions; 1 x 15 min, 9 x 30 min | |
| Unclear | According to maximum participant tolerance | Unclear | 0‐100 | Unclear | Transcutaneous: 2 anterior flat electrodes placed over obturator foramen 1.5‐2 cm lateral to symphasis, 2 posterior electrodes placed medial to ischial tuberosities, either side of anus | One 15 min session, 11 x 30 min sessions. 3 sessions per week for 4 weeks (12 sessions) | |
| Unclear | Unclear | Unclear | Unclear | Unclear | Unclear | 3 x 30 min sessions per week at home | |
| Unclear | 10−100 mA | 2 ms | 50 | 2 s on: 4 s off | Intravaginal | 2 x 15 min sessions per day for 12 weeks | |
| Unclear | Unclear | Unclear | Unclear | Unclear | External electrodes | Home use, at least 4 x 30 min sessions per week for 8 weeks | |
| Unclear | Unclear | Unclear | Unclear | Unclear | Intravaginal | Home use, at least 4 x 30 min sessions per week for 8 weeks | |
| Unclear | Unclear | Unclear | Unclear | Unclear | Unclear | Unclear | |
| Unclear | 0−100 mA, up to maximum participant tolerance | Unclear | Unclear | Unclear | Transcutaneous: 2 electrodes placed on abdomen and 2 on inner thighs | 3 x 15 min sessions per week for 4 weeks | |
| Unclear | Pre‐programmed to increase intensity over 24 s to reach therapeutic level and switch off automatically after 30 min. All devices same level of stimulation (average intensity considered comfortable and capable of producing contractions of pelvic floor muscles) | Unclear | During the 10 s 'on time' the device delivers 10 repeats of a short high intensity burst of 50 Hz stimulation immediately preceded by a doublet (125 Hz), superimposed on continuous low frequency 2 Hz stimulation | 10 s on: 10 s off | Intravaginal ‐ single use tampon‐like Pelviva device | One disposable device per day for 12 weeks except during menstruation | |
| Unclear | Unclear | Unclear | Unclear | Unclear | Intravaginal | Home use | |
| Unclear | According to maximum participant tolerance | Unclear | 0‐100 | Unclear | Surface ES: 2 flat electrodes placed anteriorly over obturator foramen, 1.5‐2cm lateral to the symphysis; 2 electrodes placed posteriorly medial to ischial tuberosity on either side of the anus | 1st session 15 min, if no ill effects then 30 min for all subsequent sessions. 3 times a week, for 4 weeks (12 sessions) under supervision of a physiotherapist. Participants were asked to perform 8‐12 pelvic floor contractions 3 times a day at home | |
| Unclear | According to maximum participant tolerance | Pulse width 700 µs | 50 | 4 s on: 8 s off | Surface ES: 2 electrodes in suprapubic region, 2 medial to the ischial tuberosity | 2 x 20 min sessions per week for 6 weeks (12 sessions). "The women were not instructed to perform the contraction of the pelvic floor muscles in conjunction with electrical stimulation" | |
| Unclear | Unclear | Unclear | Unclear | Unclear | Unclear | Unclear | |
| Unclear | Surging faradic‐type current | Unclear | Unclear | Unclear | Unclear | 3 x 10 min sessions per week for 10‐12 weeks | |
| Unclear | Gradually adjusted amperage to 60‐80 mA or highest tolerable level | Unclear | Unclear | First 2 weeks: 5 s on: 10 s off. Weeks 3‐4: 5s: 5s; weeks 5‐6: 5 s: 10 s; weeks 7‐12: 5 s: 5 s | Vaginal electrode ( 2.6 cm diameter, 6.35 cm length) with electrode resistance 85 Ω | Women instructed to use device twice daily for 12 weeks. First 4 weeks: 15 min sessions. Weeks 5‐12: 30 min | |
| Unclear | 10‐100 mA | 1 ms | 50 | Unclear | Intravaginal: electrode: 10cm long, 3.5 cm wide with double metallic ring and cylindrical shape, positioned in medium third of the vagina | 2 x 20 min sessions per week for 4 months | |
| Unclear | Unclear | 300 μs | 50 | Unclear | Unclear | 12 weeks (unclear how many sessions or duration of sessions) | |
| Unclear | Unclear | Unclear | "Simultaneous electrical stimulation of 35 Hz and 50 Hz for 24 secs" | Unclear | Unclear | 2 x 20 min sessions per week for 6 weeks (12 sessions) (plus biofeedback) | |
| Unclear | Up to 40 v | Unclear | 10‐50 | Unclear | Maximum perineal stimulation: Scott electrode in vagina, large indifferent electrode under buttocks | Single 20 min session | |
| Unclear | Unclear | Unclear | 10 | Unclear | Intravaginal cushion attached to stimulator worn around waist | Cushion worn for 8/24 hours, day or night according to participant preference | |
| Biphasic | 5 mA ‐ 10 mA, increased each month to 80 mA max (range 1‐100) | Asymmetric balanced biphasic pulse, 300 μs, | Channel 1: 50 Hz; channel 2: 12.5 Hz | 5 s contraction time (range 5‐15), duty cycle 1‐2 (range 1 to 1 to 2) | Unclear | 16 weeks (unclear how many sessions); increasing treatment time from 15, 30, 45, 60 minutes | |
| Unclear | Unclear | Unclear | Unclear | Unclear | Intravaginal. Faradic stimulation using vaginal probe | 2 sessions per week for 1 month (session duration not reported) | |
| Unclear | Unclear | Unclear | Unclear | Unclear | Intravaginal. Faradic stimulation using vaginal probe | 2 sessions per week for 1 month (session duration not reported) | |
| Unclear | Unclear | 200‐250 μs | 10‐40 | 15 s; 30 s | Intravaginal | 2 x 20 min sessions per day at home for 8 weeks | |
| Unclear | Unclear | Unclear | Unclear | Unclear | Unclear | Unclear | |
| Unclear | According to maximum participant tolerance | Unclear | Unclear | Groups of 12 surges/min, 2 min rest in between each group | Faradism. Surface electrodes. Saddle shaped indifferent electrode placed over the sacrum, active electrode applied to perineum | 6 weeks' treatment (session duration not reported) | |
| Unclear | 20−25 mA | Unclear | Unclear | 15 pulses at pressure peak 0.25‐0.30 Pa/cmb | Interferential. 4 suction electrodes (2 on abdomen, 2 on adductor muscles) | First treatment 10 min, if no ill effects then duration increased to 15 min | |
| Unclear | 0‐90 mA, according to participant tolerance | Unclear | 20 | Unclear | Intravaginal | 1 session per day (at home) for 6 weeks | |
| EMG: electromyography; ES: electrical stimulation. | |||||||
| Study | Description of sham interventiona |
| Identical device to the intervention group with disconnected wire so no electricity supplied | |
| Electrodes placed in the lumbar region | |
| One 250 μ impulse every minute for 60 min (proven to have no physiological effect on muscle) | |
| Machine modified to bypass the patient circuit and divert the interferential current to a separate circuit within the machine so the participant received no current. Participants told to expect no sensation | |
| Wiring from the unit to the probe was covertly discontinuous | |
| Same system as intervention group but limited to maximum output 1 mA | |
| Vaginal electrode but no current | |
| Identical device to intervention group but not activated | |
| Women were provided with a placebo set to parameters proven to have no physiological effect | |
| aFour of 13 trials comparing ES with sham ES did not describe the sham intervention in detail. | |
| Study | Outcome | ES: mean (SD), N or n/N | No active treatment: mean (SD), N or n/N | Result |
| Primary outcomes | ||||
| I‐QoL scorea | 83.4 (12.1), 27 | 57.6 (28.2), 24 | Favours ES MD 25.80 (95% CI 13.63 to 37.97) | |
| Women with significant improvement in QoL | 9/27 | 0/24 | Favours ES RR 16.96 (95% CI 1.04 to 276.81) | |
| Secondary outcomes | ||||
| Women requesting further treatment in addition to the allocated intervention | 19/25 | 28/30 | RR 0.23 (95% CI 0.04 to 1.24) | |
| Incontinence episodes per 24 hours | 0.3 (0.8), 27 | 1.3 (0.9), 24 | Favours ES MD −1.00 (95% CI 1.47 to −0.53) | |
| Tertiary outcomes | ||||
| Objective cure or improvement | 7/25 | 2/30 | Favours ES Pooled RR 2.41 (95% CI 1.02 to 5.68) | |
| 11/27 | 3/12 | |||
| Pelvic floor muscle strength (cmH2O) | 18.6 (13.52b), 25 | 16.0 (8.38b), 30 | MD 2.60 (95% CI −3.49 to 8.69) MD 4.73 (95% CI −3.92 to 13.38) Pooled MD 3.31 (95% CI −1.67 to 8.28) | |
| 14.57 (11.55), 7 | 9.84 (1.71), 7 | |||
| Women with negative urodynamic stress test | 11/27 | 3/12 | RR 2.79 (95% CI 0.62 to 12.60) | |
| Pelvic floor muscle strength measured by PERFECTc | 2.9 (1.00), 27 | 2.3 (1.07), 24 | Favours ES Pooled MD 0.84 (95% CI 0.55 to 1.14) MD 0.60 (95% CI 0.03 to 1.17) | |
| 1.71 (0.95), 7 | 1.14 (0.37), 7 | MD 0.57 (95% CI −0.19 to 1.33) | ||
| Surface ES: 2.53 (0.83), 15 | 2.25 (0.86), 15 | MD 0.28 (95% CI −0.32 to 0.88) | ||
| Intravaginal ES: 2.66 (0.81), 15 | 1.14 (0.37), 7 | MD 0.41 (95% CI −0.19 to 1.01) | ||
| Maximum urethral closure pressure (cmH2O) | 26 (30.0b), 25 | 20 (19.60b), 24 | MD 6.00 (95% CI −8.13, 20.13) | |
| CI: confidence interval; ES: electrical stimulation; I‐QoL: Incontincence Quality of Life questionnaire; MD: mean difference; QoL: quality of life; RR: risk ratio; SD: standard deviation. aHigher score = greater QoL. Range of possible scores: 0‐100. | ||||
| Study | Outcome | ES: mean (SD), N or n/N unless otherwise stated | Sham: mean (SD), N or n/N unless otherwise stated | Result |
| Primary outcomes | ||||
| IIQ scorea | 28.42 (17.22), 12 | 30.11 (17.94), 12 | MD −1.69 (95% CI −15.76 to 12.38) | |
| UDI scorea | 34.45 (25.25), 12 | 38.32 (11.75), 12 | MD −3.87 (95% CI −19.63 to 11.89) | |
| I‐QoL scoreb | 80.8 (24.1), 64 | 50.6 (14.9), 29 | Favours ES MD 30.20 (95% CI 22.18 to 38.22) | |
| Subjective assessment of SUI severity (VAS) | 4.8 (NR), 28 | 6.3 (NR), 16 | Not estimable | |
| 2.9 (NR), 15 | 3.5 (NR), 11 | |||
| Subjective assessment of improvement in SUI (VAS) | NR | NR | Significantly greater improvement in group A (ES) than group B (sham ES) | |
| Subjective assessment of improvement in frequency of urine loss (VAS) | NR | NR | ||
| Secondary outcomes | ||||
| Incontinence episodes per week | Median (range), N: 0 (0 to 5), 7 | Median (range), N: 3 (0 to 17), 10 | Not estimable | |
| 1 hour pad test (g) | Median (range), N: 5.0 (1 to 91.9), 12 | Median (range), N: 5.2 (0 to 75.0), 12 | Not estimable | |
| Tertiary outcomes | ||||
| Objective cure or improvement | 11/13 | 5/9 | Favours ES Pooled RR 3.32 (95% CI 1.89 to 5.84) | |
| 3/20 | 3/24 | |||
| 3/11 | 0/10 | |||
| 25/64 | 0/29 | |||
| 22/35 | 3/17 | |||
| PFM strength (cmH2O) | 24 (13), 12 | 19 (6), 12 | MD −5.00 (95% CI −3.46 to 13.46) | |
| Vaginal muscle strength (mmHg) | 15.5 (13.49c), 28 | 8.9 (5.75c), 16 | Favours ES MD −6.60 (−12.34 to −0.86) | |
| Oxford scoreb | 8 weeks: 4.2 (NR), 64 16 weeks: 4.1 (NR) 64 | 8 weeks: 2.6 (NR), 29 16 weeks: 2.7 (NR), 29 | Favours ES | |
| CI: confidence interval; ES: electrical stimulation; IIQ: incontinence impact questionnaire; I‐QoL: Incontincence Quality of Life questionnaire; MD: mean difference; NR: not reported; QoL: quality of life; PFM: pelvic floor muscle; RR: risk ratio; SD: standard deviation; SUI: stress urinary incontinence; UDI: urogenital distress inventory; VAS: visual analogue scale. aHigher score = greater severity. IIQ range of possible scores: 0‐100. UDI range of possible scores: 0‐300. | ||||
| Study | Outcome | ES: mean (SD), N or n/N unless otherwise stated | PFMT: mean (SD), N or n/N unless otherwise stated | Result |
| Primary outcomes | ||||
| I‐QoL scorea | 83.4 (12.1), 27 | 82.2 (17.6), 26 | MD 1.20 (95% CI (−6.96 to 9.36) | |
| Women with significant improvement in QoL | 9/27 | 7/26 | RR 1.24 (95% CI 0.54 to 2.83) | |
| Quality of life questionnaire score (non‐validated instrument)b | 22.5 (17.11c), 20 | 13.5 (11.41c), 20 | MD 9.00 (95% CI −0.01 to 18.01) | |
| Subjective assessment of SUI severity (VAS) | 4.81 (NR), 21 | 5.33 (NR), 10 | Not estimable | |
| Secondary outcomes | ||||
| Incontinence episodes per 24 hours | 0.3 (0.8), 27 | 0.4 (0.5), 26 | MD −0.10 (95% CI −0.46 to 0.26) | |
| Mean (range), N: 1.4 (0 to 5), 9 | Mean (range), N: 2.4 (0 to 6), 9 | Not estimable | ||
| Women requesting further treatment in addition to the allocated intervention | 19/25 | 4/25 | Favours PFMT RR 16.63 (95CI 4.06 to 68.04) | |
| Women going on to have surgery | 2/9 | 3/9 | RR 0.57 (95% CI 0.07 to 4.64) | |
| Pads per week | Mean (range), N: 4.0 (0−10), 9 | Mean (range), N: 5.4 (0−10), 9 | Not estimable | |
| Pad test (g) (timescale not reported) | 6.21 (NR), 21 | 10.00 (NR), 10 | Not estimable | |
| Tertiary outcomes | ||||
| Objective cure or improvement | 2/7 | 5/7 | Pooled RR 1.18 (95% CI 0.68 to 2.03 | |
| 7/25 | 1/25 | |||
| 4/10 | 1/10 | |||
| 3/11 | 7/11 | |||
| 4/9 | 3/9 | |||
| PFM strength (cmH2O) | 18.6 (13.52c), 25 | 19.2 (9.95c), 25 | MD −0.60 (95% CI −7.18 to 5.98) | |
| Perineal contraction strength (0−5 scale; higher score = stronger contraction) | 1 (0.82), 7 | 8 (1.83), 7 | Favours PFMT MD −2.00 (95% CI −3.49, −0.51) | |
| Women with negative urodynamic stress test | 11/27 | 10/26 | RR 1.49 (95% CI 0.50 to 4.43) | |
| Oxford scored | 2.9 (1.0), 27 | 3.6 (0.7), 26 | Favours PFMT MD −0.70 (95% CI −1.16 to −0.24) | |
| 2.55 (NR), 21 | 2.7 (NR), 10 | Not estimable | ||
| Median (range): 13 (0−14) | Median (range): 11 (0−83 | |||
| Maximum urethral closure pressure (cmH2O) | 26 (30.0c), 25 | 32 (20.40c), 26 | MD −6.00 (95% CI −20.13, 8.13) | |
| Maximum urethral closure pressure (mmHg) | 42.6 (8.2), 11 | 41.4 (14.3), 11 | MD 1.20 (95% CI −8.54 to 10.94) | |
| CI: confidence interval; ES: electrical stimulation; I‐QoL: Incontincence Quality of Life questionnaire; MD: mean difference; NR: not reported; QoL: quality of life; PFM(T): pelvic floor muscle training; RR: risk ratio; SD: standard deviation; SUI: stress urinary incontinence; VAS: visual analogue scale. aHigher score = greater QoL.Range of possible scores: 0‐100 | ||||
| Study | Outcome | ES: mean (SD), N or n/N | Vaginal cones: mean (SD), N or n/N | Result |
| Primary outcomes | ||||
| Women with significant improvement in QoL | 9/27 | 7/24 | RR 1.14 (95% CI 0.50 to 2.60) | |
| Subjective assessment of SUI severity (10 point VAS) | 5/10 | 5/10 | RR 1.00 (95% CI 0.17 to 5.77) | |
| Secondary outcomes | ||||
| Women requiring continence surgery | 2/30 | 3/24 | RR 0.50 (95% CI 0.08 to 3.27) | |
| Women requesting further treatment in addition to the allocated intervention | 19/25 | 23/27 | RR 0.55 (95% CI 0.14 to 2.24) | |
| Adverse effects | 2/25 | 4/27 | RR 0.54 (95% CI 0.11 to 2.70) | |
| No leakage at 6 months | 11/28 | 10/19 | RR 0.58 (95% CI 0.18 to 1.89) | |
| Weekly leakage (g) | 5.3 (9.2), 30 | 3.9 (9.4), 24 | MD 1.40 (95% CI −3.60 to 6.40) | |
| Tertiary outcomes | ||||
| Objective cure | 7/25 | 4/27 | RR 1.89 (95% CI 0.63 to 5.69) | |
| Objective cure or improvement | 18/30 | 20/24 | Pooled RR 0.93 (95% CI 0.72 to 1.20) | |
| 7/25 | 4/27 | |||
| 15/30 | 16/21 | |||
| PFM strength (cmH2O) | 18.6 (12.8a), 25 | 15.4 (11.40a), 27 | MD 3.20 (95% CI −3.62 to 10.02) | |
| Women with negative urodynamic stress test | 11/27 | 9/24 | RR 1.55 (95% CI 0.51 to 4.74) | |
| Oxford scoreb | 2.9 (1.0), 27 | 3.0 (0.8), 24 | MD −0.10 (95% CI −0.59 to 0.39) | |
| Maximum vaginal pressure (mmHg) | 33.64 (16.72), 60 | 27.20 (13.21), 60 | Favours ES plus PFMT MD 6.44 (95% CI 1.05 to 11.83) | |
| Maximum urethral pressure (mmH2O) | 77.93 (30.96), 60 | 78.38 (18.30), 60 | MD −0.45 (95% CI −9.55 to 8.65) | |
| CI: confidence interval; ES: electrical stimulation; MD: mean difference; QoL: quality of life; PFM: pelvic floor muscle; RR: risk ratio; SD: standard deviation; SUI: stress urinary incontinence; VAS: visual analogue scale. | ||||
| Study | Outcome | ES: mean (SD), N or n/N | PFMT plus vaginal cones: mean (SD), N or n/N | Result |
| Secondary outcomes | ||||
| Pad test (g) (timescale not reported) | 7.1 (NR), 52 | 11.5 (NR), 50 | Not estimable | |
| Tertiary outcomes | ||||
| Urethral pressure profile (cmH2O) | 57 (NR), 38 | 45 (NR), 46 | Not estimable | |
| Objective cure or improvement | 10/20 | 10/16 | RR 0.80 (95% CI 0.45 to 1.43) | |
| CI: confidence interval; ES: electrical stimulation; MD: mean difference; NR: not reported; QoL: quality of life; PFMT: pelvic floor muscle training; RR: risk ratio; SD: standard deviation. | ||||
| Study | Outcome | ES: mean (SD), N or n/N | Drug therapy: mean (SD), N or n/N | Result |
| Primary outcomes | ||||
| Subjective cure or improvement | 7/26 | 0/24 | RR 13.89 (95% CI 0.84 to 230.82) | |
| Tertiary outcomes | ||||
| Maximum urethral closure pressure (cmH2O) | 26 (30.0a), 25 | 24 (19.60a), 24 | MD 2.00 (95% CI −12.13 to 16.13) | |
| CI: confidence interval; ES: electrical stimulation; MD: mean difference; RR: risk ratio; SD: standard deviation. | ||||
| Study | Outcome | ES plus PFMT: mean (SD), N or n/N unless otherwise stated | PFMT: mean (SD), N or n/N unless otherwise stated | Result |
| Primary outcomes | ||||
| York Incontinence Perception Scale scorea | 46.4 (7.2), 9 | 44.8 (6.3), 12 | MD 0.23 (95% CI −0.64 to 1.10) | |
| Change in perception of bother of UI symptoms (1‐10 VASb) | Conventional ES: −2.2 (3.2), 33 | −2.5 (2.1), 27 | MD 0.30 (95% CI −1.18 to 1.78) | |
| Dynamic ES: −2.9 (2.9), 28 | MD −0.40 (95% CI −1.73 to 0.93) | |||
| Change in King's Health Questionnaire scoreb | Conventional ES: −20.7 (5.3), 33 | −20.2 (5.4), 27 | MD −0.50 (95% CI −3.22 to 2.22) | |
| Dynamic ES: −24.8 (5.3), 28 | Favours ES MD −4.60 (95% CI −7.43 to −1.77) | |||
| % change in UDI score | Median (range), N: −32 (−50 to −18), 6 | Median (range), N: 0 (−43 to 180), 7 | Not estimable | |
| % change in IIQ score | Median (range), N: −27 (−63 to 0), 6 | Median (range), N: 0 (−67 to 200), 7 | ||
| Secondary outcomes | ||||
| Women 'somewhat' or 'completely' satisfied | 46/47 | 46/47 | RR 1.00 (95% CI 0.06 to 16.47) | |
| Women whose incontinence no longer restricts activities | 37/47 | 33/47 | RR 1.57 (95% CI 0.61 to 4.01) | |
| Subjective assessment of symptoms (1‐5 scale, higher score = better) | Low intensity ES at home plus PFMT: Mean (range), N: 3.3 (1 to 5), 19 | Mean (range), N: 3.5 (2−5), 18 | Not estimable | |
| Maximal ES in clinic plus PFMT: mean (range), N: 105.6 (−55.9 to 3.9 (3−5), 20 | ||||
| Incontinence episodes | Median (IQR), N: 12 weeks: 0 (0, 1), 11 6 months: 0.5 (0, 1.25), 11 | Median (IQR), N: 12 weeks: 2 (0, 3), 11 6 months: 0 (0, 5.25), 11 | Not estimable | |
| Daytime micturitions | Median (IQR), N: 12 weeks: 5 (5, 6), 11 6 months: 4.5 (4, 6), 11 | Median (IQR), N: 12 weeks: 7 (5, 10), 11 6 months: 2 (1, 3), 11 | ||
| Women with adverse effects | 4/59 | Unclear | Not estimable | |
| Pad test (g) | 4.3 (NR), 88 | 4.2 (NR), 40 | ||
| Low intensity ES plus PFMT: Median (range), N: 2.9 (0.0‐50.9), 19 | Median (range), N: 0.8 (0.0‐88.1), 18 | |||
| Maximal intensity ES plus PFMT: Median (range), N: 1.5 (0.0‐28.1), 20 | ||||
| Tertiary outcomes | ||||
| Objective cure or improvement | Low intensity ES plus PFMT: 10/25 | 13/21 | RR 0.41 (95% CI 0.12 to 1.35) | |
| Maximal intensity ES plus PFMT: 16/24 | RR 1.23 (95% CI 0.36 to 4.18) | |||
| PFM strength (cmH2O) | 36.7 (14.1), 9 | 32.5 (18.5), 12 | MD 0.24 (95% CI −0.63 to 1.11) MD −7.03 (95% CI −26.20 to 12.14) Pooled MD −0.04 (95% CI −0.64 to 0.57) | |
| 41.85 (26.1), 11 | 48.88 (19.25), 11 | |||
| Oxford scorec | 4.1 (0.9), 12 | 3.8 (1.4), 12 | MD 0.25 (95% CI −0.56 to 1.05) MD 0.48 (95% CI −0.03 to 1.00] MD 0.42 (95% CO −0.12 to 0.96) Pooled MD 0.39 (95% CI −0.01 to 0.79) | |
| Conventional ES plus PFMT: 1.9 (0.9), 33 | 1.5 (0.7), 27 | |||
| Dynamic ES plus PFMT: 1.8 (0.7), 27 | ||||
| Maximum urethral closure pressure (mmHg) | 49.9 (12.0), 11 | 41.4 (14.3), 11 | MD 8.50 (95% CI −2.53 to 19.53) | |
| Maximum urethral closure pressure at rest (cmH2O) | ES (faradism): 58.0 (15.4), 14 | 51.5 (10.5), 9 | MD 6.50 (95% CI −4.09 to 17.09) | |
| ES (interferential) 56.0 (16.7), 12 | MD 4.50 (95% CI −7.18 to16.18) | |||
| Contraction of pelvic floor at rest | 30.79 (7.44), 25 | 32.28 (7.33), 15 | MD −1.49 (95% CI −6.21 to 3.23) | |
| CI: confidence interval; ES: electrical stimulation; MD: mean difference; QoL: quality of life; PFM(T): pelvic floor muscle training; RR: risk ratio; SD: standard deviation; SUI: stress urinary incontinence; CI: confidence interval; ES: electrical stimulation; MD: mean difference; PFMT: pelvic floor muscle training; RR: risk ratio; SD: standard deviation.VAS: visual analogue scale. | ||||
| Study | Outcome | ES plus surgery: mean (SD), N or n/N | Surgery: mean (SD), N or n/N | Result |
| Primary outcomes | ||||
| Subjective cure | 43/60 | 45/60 | RR 1.19 (95% CI 0.53 to 2.67) | |
| Subjective cure or improvement | 59/60 | 55/60 | RR 5.36 (95% CI 0.61 to 47.36) | |
| I‐QoL scorea | 96.0 (15.2), 60 | 89.0 (11.2), 60 | Favours ES plus surgery MD 7.00 (95% CI 2.22 to 11.78) | |
| ICIQ‐SF scoreb | 2.0 (2.5), 60 | 5.0 (3.1), 60 | Favours ES plus surgery MD −3.00 (95% CI −4.01 to −1.99) | |
| Secondary outcomes | ||||
| Incontinence episodes per 24 hours | c4.3 (1), 60 | c3 (1.3), 60 | Favours ES plus surgery MD −0.70 (95% CI −1.19 to −0.21) | |
| Micturitions per 24 hours | c7.67 (1.67), 60 | c8 (1.3), 60 | MD −0.33 (95% CI −0.87 to 0.21) | |
| Pad test (g/h) | 1.8 (1.21), 60 | 3.0 (1.08), 60 | Favours ES plus surgery MD −1.20 (95% CI −1.61 to −0.79) | |
| Adverse effects: Urgency Dysuria Medial thigh pain | d9/60 3/60 3/60 3/60 | d9/60 4/60 2/60 3/60 | RR 1.00 (95% CI 0.37 to 2.72) | |
| CI: confidence interval; ES: electrical stimulation; ICIQ‐SF: International Consultation on Incontinence Questionnaire ‐ Short Form; I‐QoL: Incontincence Quality of Life questionnaire; MD: mean difference; SD: standard deviation. aHigher score = greater QoL. Range of possible scores: 0‐100. | ||||
| Study | Outcome | Surface ES: mean (SD), N or n/N | Intravaginal ES: mean (SD), N or n/N | Result |
| Primary outcomes | ||||
| King's Health Questionnaire Incontinence impact scorea | 6.66 (13.80), 15 | 4.44 (11.73), 15 | MD 2.22 (95% CI −6.95, 11.39) | |
| Secondary outcomes | ||||
| 1 hour pad test (g) | 3.31 (12.10), 15 | 0.41 (0.78), 15 | MD 2.90 (95% CI −3.24, 9.04) | |
| Tertiary outcomes | ||||
| Pelvic floor muscle strength measured by PERFECTb | 2.53 (0.83), 15 | 2.66 (0.81), 15 | MD −0.13 (95% CI −0.72, 0.46) | |
| CI: confidence interval; ES: electrical stimulation; MD: mean difference; RR: risk ratio; SD: standard deviation. aHigher score = worse QoL. Range of possible scores: 0‐100. | ||||
| Study | Outcome | Low intensity ES plus PFMT: mean (SD), N or n/N, unless otherwise stated | Maximal intensity ES plus PFMT: mean (SD), N or n/N, unless otherwise stated | Result |
| Primary outcomes | ||||
| Subjective cure or improvement | 9/25 | 16/24 | Favours maximal intensity RR 0.28 (95% CI 0.09 to 0.91) | |
| Secondary outcomes | ||||
| Subjective assessment of symptoms (1‐5 scale, higher score = better) | Median (range), N: 3.3 (1 to 5), 19 | Median (range), N: 3.9 (3 to 5), 20 | Not estimable | |
| Pad test (g) | Median (range), N: 2.9 (0.0‐50.9), 19) | Median (range), N: 1.5 (0.0 to 28.1), 20 | Not estimable | |
| Tertiary outcomes | ||||
| Objective cure | 6/19 | 11/20 | RR 0.38 (95% CI 0.10 to 1.40) | |
| Objective cure or improvement | 10/25 | 16/24 | RR 0.33 (95% CI 0.10 to 1.07) | |
| CI: confidence interval; ES: electrical stimulation; MD: mean difference; PFMT: pelvic floor muscle training; RR: risk ratio; SD: standard deviation. | ||||
| Study | Outcome | Low frequency ES: mean (SD), N or n/N | Medium frequency ES: mean (SD), N or n/N | Result |
| Primary outcomes | ||||
| SUI‐related discomfort (10 cm VAS) | 0.5 (0.4), 10 | 0.6 (0.7), 10 | MD −0.10 (95% CI −0.60 to 0.40) | |
| Secondary outcomes | ||||
| 1 hour pad test (g) | 1.2 (NR), 10 | 1 (NR), 10 | Not estimable | |
| Tertiary outcomes | ||||
| Objective cure (Laycock and Green criteria) | 6 months: 4/10 12 months: 10/10 | 6 months: 9/10 12 months: 10/10 | 6 months: RR 0.07 (95% CI 0.01 to 0.84) 10 months: not estimable | |
| Perineal pressure (mmHg) | 9.82 (2.87), 10 | 8.59 (5.47), 10 | MD 1.23 (95% CI −2.60, 5.06) | |
| CI: confidence interval; ES: electrical stimulation; MD: mean difference; NR: not reported; RR: risk ratio; SD: standard deviation; SUI: stress urinary incontinence; VAS: visual analogue scale.. | ||||
| Study | Outcome | ES (faradism) plus PFMT: mean (SD), N or n/N | ES (interferential) plus PFMT: mean (SD), N or n/N | Result |
| Primary outcomes | ||||
| Subjective cure or improvement | 10/15 | 9/15 | RR 1.33 (95% CI 0.30 to 5.91) | |
| Secondary outcomes | ||||
| Micturitions per 24 hours | 7.8 (2.0), 15 | 8.0 (1.8), 15 | MD (95% CI −0.20 −1.56 to 1.16) | |
| Pads per 24 hours | 1.3 (1.4), 15 | 1.6 (2.3), 15 | MD −0.30 (95% CI −1.66 to 1.06) | |
| Tertiary outcomes | ||||
| Maximum urethral closure pressure (cmH2O) | 58.0 (15.4), 14 | 56.0 (16.7), 12 | MD 2.00 (95% CI −10.42 to 14.42) | |
| CI: confidence interval; ES: electrical stimulation; MD: mean difference; PFMT: pelvic floor muscle training; RR: risk ratio; SD: standard deviation. | ||||
| Study | Outcome | Conventional ES: mean (SD), N or n/N | Dynamic ES: mean (SD), N or n/N | Result |
| Primary outcomes | ||||
| Change in perception of bother of UI symptoms (VAS) | −2.2 (3.2), 33 | −2.9 (2.9), 28 | MD 0.70 (95% CI −0.83 to 2.23) | |
| Change in King's Health Questionnaire score | −20.7 (5.3), 33 | −24.8 (5.3), 28 | Favours dynamic ES MD 4.10 (95% CI 1.43 to 6.77) | |
| Tertiary outcomes | ||||
| Oxford scorea | 1.9 (0.9), 33 | 1.8 (0.7), 27 | MD 0.10 (95% CI −0.30 to 0.50) | |
| CI: confidence interval; ES: electrical stimulation; MD: mean difference; PFMT: pelvic floor muscle training; SD: standard deviation; UI: urinary incontinence; VAS: visual analogue scale. aMeasure of vaginal muscle strength (higher score = stronger). Range of possible scores: 0‐5. | ||||
| Outcome or subgroup title | No. of studies | No. of participants | Statistical method | Effect size |
| 1 Subjective cure Show forest plot | 2 | 101 | Risk Ratio (M‐H, Fixed, 95% CI) | 2.31 [1.06, 5.02] |
| 2 Subjective cure or improvement Show forest plot | 5 | 347 | Risk Ratio (M‐H, Fixed, 95% CI) | 1.73 [1.41, 2.11] |
| 3 Quality of life (higher score = worse quality of life) Show forest plot | 4 | 250 | Std. Mean Difference (IV, Fixed, 95% CI) | ‐0.72 [‐0.99, ‐0.45] |
| 4 Pad test (g) Show forest plot | 3 | 110 | Std. Mean Difference (IV, Fixed, 95% CI) | ‐0.71 [‐1.11, ‐0.31] |
| 5 Adverse effects Show forest plot | 3 | 103 | Risk Ratio (M‐H, Fixed, 95% CI) | 5.96 [0.30, 118.70] |
| Outcome or subgroup title | No. of studies | No. of participants | Statistical method | Effect size |
| 1 Subjective cure Show forest plot | 3 | 158 | Risk Ratio (M‐H, Random, 95% CI) | 2.21 [0.38, 12.73] |
| 2 Subjective cure or improvement Show forest plot | 5 | 236 | Risk Ratio (M‐H, Random, 95% CI) | 2.03 [1.02, 4.07] |
| 3 Number of incontinence episodes per 24 h Show forest plot | 3 | 181 | Mean Difference (IV, Fixed, 95% CI) | ‐1.34 [‐2.02, ‐0.66] |
| 4 Number of micturitions per 24 h Show forest plot | 3 | 163 | Mean Difference (IV, Fixed, 95% CI) | ‐0.46 [‐1.38, 0.46] |
| 5 Number of pads per week Show forest plot | 2 | 97 | Mean Difference (IV, Fixed, 95% CI) | ‐0.78 [‐1.23, ‐0.33] |
| 6 Pad test (g) Show forest plot | 2 | 137 | Std. Mean Difference (IV, Fixed, 95% CI) | ‐0.89 [‐1.27, ‐0.52] |
| 7 Adverse effects Show forest plot | 4 | 233 | Risk Ratio (M‐H, Fixed, 95% CI) | 2.01 [0.52, 7.67] |
| Outcome or subgroup title | No. of studies | No. of participants | Statistical method | Effect size |
| 1 Subjective cure Show forest plot | 4 | 143 | Risk Ratio (M‐H, Random, 95% CI) | 0.51 [0.16, 1.63] |
| 2 Subjective cure or improvement Show forest plot | 7 | 244 | Risk Ratio (M‐H, Fixed, 95% CI) | 0.85 [0.70, 1.03] |
| 3 Adverse effects Show forest plot | 3 | 121 | Risk Ratio (M‐H, Fixed, 95% CI) | 5.0 [0.25, 99.16] |
| Outcome or subgroup title | No. of studies | No. of participants | Statistical method | Effect size |
| 1 Subjective cure Show forest plot | 3 | 157 | Risk Ratio (M‐H, Fixed, 95% CI) | 1.04 [0.70, 1.54] |
| 2 Subjective cure or improvement Show forest plot | 5 | 331 | Risk Ratio (M‐H, Fixed, 95% CI) | 1.09 [0.97, 1.21] |
| 3 Quality of life (I‐QoL) Show forest plot | 2 | 96 | Mean Difference (IV, Fixed, 95% CI) | 1.59 [‐3.72, 6.90] |
| 4 Number of incontinence episodes per 24 h Show forest plot | 2 | 96 | Mean Difference (IV, Fixed, 95% CI) | 0.10 [‐0.13, 0.33] |
| 5 Pad test (g) Show forest plot | 4 | 239 | Std. Mean Difference (IV, Fixed, 95% CI) | 0.06 [‐0.20, 0.31] |
| Outcome or subgroup title | No. of studies | No. of participants | Statistical method | Effect size |
| 1 Subjective cure Show forest plot | 2 | 123 | Risk Ratio (M‐H, Fixed, 95% CI) | 1.45 [0.96, 2.20] |
| 2 Subjective cure or improvement Show forest plot | 2 | 123 | Risk Ratio (M‐H, Fixed, 95% CI) | 1.53 [1.08, 2.18] |
| Outcome or subgroup title | No. of studies | No. of participants | Statistical method | Effect size |
| 1 Subjective cure Show forest plot | 3 | 99 | Risk Ratio (M‐H, Fixed, 95% CI) | 0.76 [0.38, 1.52] |
| 2 Subjective cure or improvement Show forest plot | 6 | 308 | Risk Ratio (M‐H, Fixed, 95% CI) | 1.10 [0.95, 1.28] |
| 3 Quality of life (higher score = worse quality of life) Show forest plot | 4 | 193 | Std. Mean Difference (IV, Fixed, 95% CI) | ‐0.35 [‐0.64, ‐0.05] |
| 4 Subjective assessment (VAS) Show forest plot | 3 | 150 | Std. Mean Difference (IV, Fixed, 95% CI) | ‐0.57 [‐0.90, ‐0.24] |
| 5 Women requesting surgery at end of follow‐up Show forest plot | 2 | 82 | Risk Ratio (M‐H, Fixed, 95% CI) | 0.91 [0.59, 1.41] |
| 6 Number of incontinence episodes per 24 h Show forest plot | 4 | 275 | Mean Difference (IV, Fixed, 95% CI) | ‐0.33 [‐0.59, ‐0.06] |
| 7 Number of micturitions per 24 h Show forest plot | 2 | 66 | Mean Difference (IV, Fixed, 95% CI) | ‐0.13 [‐1.46, 1.20] |
| 8 Pad test (g) Show forest plot | 4 | 346 | Std. Mean Difference (IV, Random, 95% CI) | ‐0.20 [‐0.61, 0.21] |