Intervenciones para la nefropatía crónica en pacientes con drepanocitosis
Información
- DOI:
- https://doi.org/10.1002/14651858.CD012380.pub2Copiar DOI

- Base de datos:
-
- Cochrane Database of Systematic Reviews
- Versión publicada:
-
- 03 julio 2017see what's new
- Tipo:
-
- Intervention
- Etapa:
-
- Review
- Grupo Editorial Cochrane:
-
Grupo Cochrane de Fibrosis quística y enfermedades genéticas
- Copyright:
-
- Copyright © 2017 The Cochrane Collaboration. Published by John Wiley & Sons, Ltd.
Cifras del artículo
Altmetric:
Citado por:
Autores
Contributions of authors
Noemi Roy: searching; selection of trials; eligibility assessment; content expert, and review content development
Patricia Fortin: searching; selection of trials; eligibility assessment; and review content development
Katherine Bull: protocol development and content expert
Carolyn Doree: protocol development, search methods and strategies
Sally Hopewell: methodological expert and review development
Marialena Trivella: statistical and methodological expert and review development
Lise Estcourt: review conception, review development and content expert
Sources of support
Internal sources
-
NHS Blood and Transplant, Research and Developmen, UK.
To fund the work of the Systematic Review Initiative (SRI)
External sources
-
National Institute for Health Research (NIHR) Cochrane Programme Grant, UK.
To provide funding for systematic reviewers and methodological support from the Centre for Statistics in Medicine, Oxford
Declarations of interest
Noemi Roy: none known.
Patricia Fortin: funded by the NIHR Cochrane Programme Grant ‐ Safe and Appropriate Use of Blood Components.
Katherine Bull: none known.
Carolyn Doree: none known.
Sally Hopewell: partly funded by the NIHR Cochrane Programme Grant ‐ Safe and Appropriate Use of Blood Components.
Marialena Trivella: partly funded by the NIHR Cochrane Programme Grant ‐ Safe and Appropriate Use of Blood Components.
Lise Estcourt: partly funded by the NIHR Cochrane Programme Grant ‐ Safe and Appropriate Use of Blood Components.
Acknowledgements
We thank the editorial base of the Cochrane Cystic Fibrosis and Genetic Disorders Group for their help and support.
We thank the National Institute for Health Research (NIHR). This review is part of a series of reviews that have been partly funded by the NIHR Cochrane Programme Grant ‐ Safe and Appropriate Use of Blood Components. This research was also supported by the National Institute for Health Research (NIHR) Oxford Biomedical Research Centre Programme. The views expressed are those of the authors and not necessarily those of the NHS, the NIHR or the Department of Health.
Version history
| Published | Title | Stage | Authors | Version |
| 2023 Aug 04 | Interventions for chronic kidney disease in people with sickle cell disease | Review | Noemi BA Roy, Abigail Carpenter, Isabella Dale-Harris, Carolyn Dorée, Lise J Estcourt | |
| 2017 Jul 03 | Interventions for chronic kidney disease in people with sickle cell disease | Review | Noemi BA Roy, Patricia M Fortin, Katherine R Bull, Carolyn Doree, Marialena Trivella, Sally Hopewell, Lise J Estcourt | |
| 2016 Oct 05 | Interventions for chronic kidney disease in people with sickle cell disease | Protocol | Noemi BA Roy, Patricia M Fortin, Katherine R Bull, Carolyn Doree, Marialena Trivella, Sally Hopewell, Lise J Estcourt | |
Differences between protocol and review
We adjusted the following statement for reporting 99% confidence intervals for SAEs and other adverse events: "We reported secondary outcomes as groups of transfusion‐related and drug‐related adverse event. If this was not possible due to duplicate counting of the same participant who may have experienced more than one adverse event of the same category (e.g. more than one transfusion‐related adverse event). In this case, we reported subgroup categories of adverse events separately and reported the 99% CI of the pooled RR to allow for multiple statistical testing".
Keywords
MeSH
Medical Subject Headings (MeSH) Keywords
- *Acute Chest Syndrome [chemically induced, complications, drug therapy];
- *Anemia, Sickle Cell [complications];
- Angiotensin-Converting Enzyme Inhibitors [therapeutic use];
- Antisickling Agents [therapeutic use];
- Ascorbic Acid [therapeutic use];
- Captopril [therapeutic use];
- Creatinine;
- Hydroxyurea [therapeutic use];
- *Kidney Failure, Chronic;
- Lisinopril [therapeutic use];
- Proteinuria [etiology];
Medical Subject Headings Check Words
Adolescent; Adult; Child; Humans;
PICO

Sickle cell nephropathy pathophysiology in sickle cell disease: Adapted fromOkafor 2013andNath 2015
RBC: red blood cells; FSGS: focal segmental glomerulosclerosis; ESRD: end‐stage renal disease

Structure of the kidney. From: Wikispaces. Human Physiology. 12. Urology.https://humanphysiology2011.wikispaces.com/12.+Urology

Study flow diagram.

Risk of bias graph: review authors' judgements about each risk of bias item presented as percentages across all included studies.

Risk of bias summary: review authors' judgements about each risk of bias item for each included study.
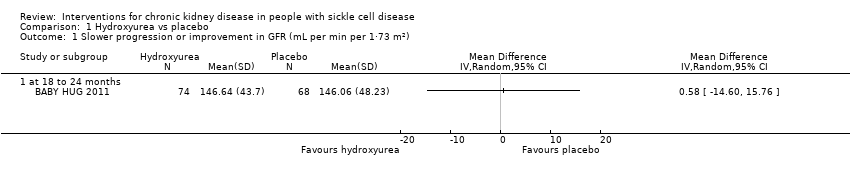
Comparison 1 Hydroxyurea vs placebo, Outcome 1 Slower progression or improvement in GFR (mL per min per 1·73 m²).

Comparison 1 Hydroxyurea vs placebo, Outcome 2 Improvement in ability to concentrate urine (mOsm/kg).
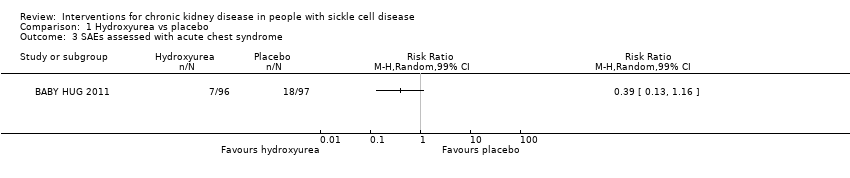
Comparison 1 Hydroxyurea vs placebo, Outcome 3 SAEs assessed with acute chest syndrome.

Comparison 1 Hydroxyurea vs placebo, Outcome 4 SAEs assessed with painful crisis.
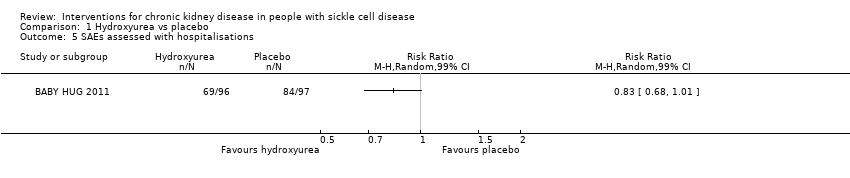
Comparison 1 Hydroxyurea vs placebo, Outcome 5 SAEs assessed with hospitalisations.

Comparison 1 Hydroxyurea vs placebo, Outcome 6 SAEs assessed with stroke.

Comparison 1 Hydroxyurea vs placebo, Outcome 7 AEs assessed with neutropenia.

Comparison 1 Hydroxyurea vs placebo, Outcome 8 AEs assessed with thrombocytopenia.

Comparison 1 Hydroxyurea vs placebo, Outcome 9 Number of participants transfused.
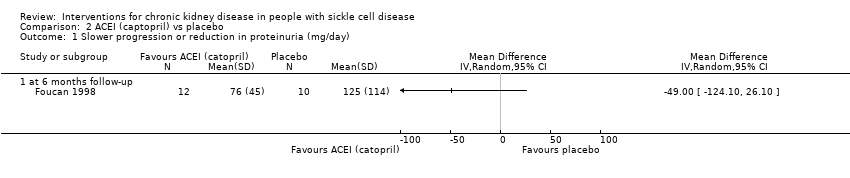
Comparison 2 ACEI (captopril) vs placebo, Outcome 1 Slower progression or reduction in proteinuria (mg/day).

Comparison 2 ACEI (captopril) vs placebo, Outcome 2 Other drug‐related adverse events (dry cough).
| Hydroxyurea compared to placebo for preventing or reducing kidney complications in people with sickle cell disease | ||||||
| Patient or population: people with sickle cell disease | ||||||
| Outcomes | Anticipated absolute effects* (95% CI) | Relative effect | № of participants | Quality of the evidence | Comments | |
| Risk with placebo | Risk with hydroxyurea | |||||
| Slower progression or improvement in GFR mL per min per 1.73 m² (measured at 18 to 24 months) | The mean slower progression or improvement in GFR mL per min per 1.73 m² (measured at 18 to 24 months) was 146.64 (43.7) | MD 0.58 higher | ‐ | 142 | ⊕⊝⊝⊝ | |
| Improvement in ability to concentrate urine mOsm/kg (measured at 18 to 24 months) | The mean improvement in ability to concentrate urine mOsm/kg (measured at 18 to 24 months) was 494.57 (110.07) | MD 42.23 higher | ‐ | 178 | ⊕⊕⊝⊝ | |
| SAEs assessed with acute chest syndrome | Study population | RR 0.39 | 193 | ⊕⊕⊝⊝ | ||
| 186 per 1000 | 72 per 1000 | |||||
| SAEs assessed with painful crisis | Study population | RR 0.68 | 193 | ⊕⊕⊝⊝ | ||
| 567 per 1000 | 386 per 1000 | |||||
| SAEs assessed with hospitalisations | Study population | RR 0.83 | 193 | ⊕⊕⊝⊝ | ||
| 866 per 1000 | 719 per 1000 | |||||
| Mortality due to any cause | No deaths reported in either group | not estimable | 193 | ⊕⊕⊝⊝ | ||
| Quality of life | Not reported | ‐ | ‐ | ‐ | ‐ | |
| *The risk in the intervention group (and its 95% CI) is based on the assumed risk in the comparison group and the relative effect of the intervention (and its 95% CI). | ||||||
| GRADE Working Group grades of evidence | ||||||
| 1 We downgraded the quality of evidence by one due to unclear risk of attrition bias. | ||||||
| ACEI compared to placebo in preventing or reducing kidney complications in people with sickle cell disease | ||||||
| Patient or population: people with sickle cell disease | ||||||
| Outcomes | Anticipated absolute effects* (95% CI) | Relative effect | № of participants | Quality of the evidence | Comments | |
| Risk with placebo | Risk with ACEI | |||||
| Slower progression or reduction in proteinuria (mg/day 6 months follow‐up) | The mean slower progression or reduction in proteinuria (mg/day 6 months follow‐up) was 76 (45) | MD 49.00 lower | ‐ | 22 | ⊕⊝⊝⊝ | |
| Improvement in ability to concentrate urine mOsm/kg | Not reported | ‐ | ‐ | ‐ | ||
| SAEs assessed with acute chest syndrome | Not reported | ‐ | ‐ | ‐ | ||
| SAEs assessed with painful crisis | Not reported | ‐ | ‐ | ‐ | ||
| SAEs assessed with hospitalisations | Not reported | ‐ | ‐ | ‐ | ||
| Mortality due to any cause | Not reported | ‐ | ‐ | ‐ | ||
| Quality of life | Not reported | ‐ | ‐ | ‐ | ||
| ACEI: angiotensin converting enzyme inhibitor; CI: confidence interval; MD: mean difference; SAEs: serious adverse events | ||||||
| GRADE Working Group grades of evidence | ||||||
| 1 We downgraded the quality of evidence by two due to unclear or high risk of bias in all domains. | ||||||
| Unadjusted HRs reported in BABY HUG 2011 | ||
| Outcome | HR | 95% CI |
| Acute chest syndrome | 0.36 | 0.15 to 0.87 |
| Painful crisis | 0.54 | 0.36 to 0.83 |
| Hospitalisations | 0.73 | 0.53 to 1.00 |
| Neutropenia | 3.0 | 1.7 to 5.1 |
| Thrombocytopenia | 1.6 | 0.6 to 4.1 |
| Transfusions | 0.55 | 0.32 to 0.96 |
| CI: confidence interval | ||
| Outcome or subgroup title | No. of studies | No. of participants | Statistical method | Effect size |
| 1 Slower progression or improvement in GFR (mL per min per 1·73 m²) Show forest plot | 1 | Mean Difference (IV, Random, 95% CI) | Totals not selected | |
| 1.1 at 18 to 24 months | 1 | Mean Difference (IV, Random, 95% CI) | 0.0 [0.0, 0.0] | |
| 2 Improvement in ability to concentrate urine (mOsm/kg) Show forest plot | 1 | Mean Difference (IV, Random, 95% CI) | Totals not selected | |
| 2.1 at 18 to 24 months | 1 | Mean Difference (IV, Random, 95% CI) | 0.0 [0.0, 0.0] | |
| 3 SAEs assessed with acute chest syndrome Show forest plot | 1 | Risk Ratio (M‐H, Random, 99% CI) | Totals not selected | |
| 4 SAEs assessed with painful crisis Show forest plot | 1 | Risk Ratio (M‐H, Random, 99% CI) | Totals not selected | |
| 5 SAEs assessed with hospitalisations Show forest plot | 1 | Risk Ratio (M‐H, Random, 99% CI) | Totals not selected | |
| 6 SAEs assessed with stroke Show forest plot | 1 | Peto Odds Ratio (Peto, Fixed, 99% CI) | Totals not selected | |
| 7 AEs assessed with neutropenia Show forest plot | 1 | Risk Ratio (M‐H, Random, 99% CI) | Totals not selected | |
| 8 AEs assessed with thrombocytopenia Show forest plot | 1 | Risk Ratio (M‐H, Random, 99% CI) | Totals not selected | |
| 9 Number of participants transfused Show forest plot | 1 | Risk Ratio (IV, Random, 95% CI) | Totals not selected | |
| Outcome or subgroup title | No. of studies | No. of participants | Statistical method | Effect size |
| 1 Slower progression or reduction in proteinuria (mg/day) Show forest plot | 1 | Mean Difference (IV, Random, 95% CI) | Totals not selected | |
| 1.1 at 6 months follow‐up | 1 | Mean Difference (IV, Random, 95% CI) | 0.0 [0.0, 0.0] | |
| 2 Other drug‐related adverse events (dry cough) Show forest plot | 1 | Risk Ratio (M‐H, Random, 99% CI) | Totals not selected | |