Terapie psychologiczne u dzieci i młodzieży, które przeżyły traumę
Abstract
Background
Children and adolescents who have experienced trauma are at high risk of developing post‐traumatic stress disorder (PTSD) and other negative emotional, behavioural and mental health outcomes, all of which are associated with high personal and health costs. A wide range of psychological treatments are used to prevent negative outcomes associated with trauma in children and adolescents.
Objectives
To assess the effects of psychological therapies in preventing PTSD and associated negative emotional, behavioural and mental health outcomes in children and adolescents who have undergone a traumatic event.
Search methods
We searched the Cochrane Common Mental Disorders Group's Specialised Register to 29 May 2015. This register contains reports of relevant randomised controlled trials from The Cochrane Library (all years), EMBASE (1974 to date), MEDLINE (1950 to date) and PsycINFO (1967 to date). We also checked reference lists of relevant studies and reviews. We did not restrict the searches by date, language or publication status.
Selection criteria
All randomised controlled trials of psychological therapies compared with a control such as treatment as usual, waiting list or no treatment, pharmacological therapy or other treatments in children or adolescents who had undergone a traumatic event.
Data collection and analysis
Two members of the review group independently extracted data. We calculated odds ratios for binary outcomes and standardised mean differences for continuous outcomes using a random‐effects model. We analysed data as short‐term (up to and including one month after therapy), medium‐term (one month to one year after therapy) and long‐term (one year or longer).
Main results
Investigators included 6201 participants in the 51 included trials. Twenty studies included only children, two included only preschool children and ten only adolescents; all others included both children and adolescents. Participants were exposed to sexual abuse in 12 trials, to war or community violence in ten, to physical trauma and natural disaster in six each and to interpersonal violence in three; participants had suffered a life‐threatening illness and had been physically abused or maltreated in one trial each. Participants in remaining trials were exposed to a range of traumas.
Most trials compared a psychological therapy with a control such as treatment as usual, wait list or no treatment. Seventeen trials used cognitive‐behavioural therapy (CBT); four used family therapy; three required debriefing; two trials each used eye movement desensitisation and reprocessing (EMDR), narrative therapy, psychoeducation and supportive therapy; and one trial each provided exposure and CBT plus narrative therapy. Eight trials compared CBT with supportive therapy, two compared CBT with EMDR and one trial each compared CBT with psychodynamic therapy, exposure plus supportive therapy with supportive therapy alone and narrative therapy plus CBT versus CBT alone. Four trials compared individual delivery of psychological therapy to a group model of the same therapy, and one compared CBT for children versus CBT for both mothers and children.
The likelihood of being diagnosed with PTSD in children and adolescents who received a psychological therapy was significantly reduced compared to those who received no treatment, treatment as usual or were on a waiting list for up to a month following treatment (odds ratio (OR) 0.51, 95% confidence interval (CI) 0.34 to 0.77; number needed to treat for an additional beneficial outcome (NNTB) 6.25, 95% CI 3.70 to 16.67; five studies; 874 participants). However the overall quality of evidence for the diagnosis of PTSD was rated as very low. PTSD symptoms were also significantly reduced for a month after therapy (standardised mean difference (SMD) ‐0.42, 95% CI ‐0.61 to ‐0.24; 15 studies; 2051 participants) and the quality of evidence was rated as low. These effects of psychological therapies were not apparent over the longer term.
CBT was found to be no more or less effective than EMDR and supportive therapy in reducing diagnosis of PTSD in the short term (OR 0.74, 95% CI 0.29 to 1.91; 2 studies; 160 participants), however this was considered very low quality evidence. For reduction of PTSD symptoms in the short term, there was a small effect favouring CBT over EMDR, play therapy and supportive therapies (SMD ‐0.24, 95% CI ‐0.42 to ‐0.05; 7 studies; 466 participants). The quality of evidence for this outcome was rated as moderate.
We did not identify any studies that compared pharmacological therapies with psychological therapies.
Authors' conclusions
The meta‐analyses in this review provide some evidence for the effectiveness of psychological therapies in prevention of PTSD and reduction of symptoms in children and adolescents exposed to trauma for up to a month. However, our confidence in these findings is limited by the quality of the included studies and by substantial heterogeneity between studies. Much more evidence is needed to demonstrate the relative effectiveness of different psychological therapies for children exposed to trauma, particularly over the longer term. High‐quality studies should be conducted to compare these therapies.
PICO
Streszczenie prostym językiem
Terapie psychologiczne w zapobieganiu zespołowi stresu pourazowego u dzieci i młodzieży
Dlaczego ten przegląd jest ważny?
Dzieci i młodzież, które przeżyły traumę są obciążone dużym ryzykiem rozwoju zespołu stresu pourazowego (PTSD) oraz wystąpienia negatywnych skutków psychologicznych i społecznych.
Kto będzie zainteresowany wynikami tego przeglądu?
Wyniki tego przeglądu zainteresują dzieci i młodzież, które przeżyły traumę oraz ich rodziny i opiekunów, a także pracowników służby zdrowia, szczególnie tych, którzy pracują w dziedzinie zdrowia psychicznego dzieci i młodzieży.
Na jakie pytania odpowiada ten przegląd?
• Jakie są skutki terapii psychologicznych (psychoterapii) w zapobieganiu PTSD i innym negatywnym skutkom emocjonalnym, behawioralnym i tym związanym ze zdrowiem psychicznym, u dzieci i młodzieży, które przeżyły traumatyczne doświadczenie?
• Jakie rodzaje terapii psychologicznych są najbardziej skuteczne?
• Czy terapie psychologiczne są skuteczniejsze niż farmakoterapia lub inne metody leczenia?
Jakie badania włączono do przeglądu?
Autorzy przeglądu przeszukali bazy danych do maja 2015 roku, aby odnaleźć wszystkie istotne badania. Do niniejszego przeglądu włączono wyłącznie badania z randomizacją, które obejmowały dzieci i młodzież, które przeżyły traumę.
Do przeglądu włączyliśmy 51 badań, które obejmowały łącznie 6201 uczestników. W 12 badaniach uczestnicy doświadczyli nadużycia seksualnego, w 10 badaniach przeżyli wojnę lub akty przemocy między społecznościami, w 6 badaniach doświadczyli urazu fizycznego i w 6 klęski żywiołowej, a w 3 badaniach przemocy interpersonalnej. W 1 badaniu, wszyscy uczestnicy cierpieli na chorobę zagrażającą życiu lub była wobec nich stosowana przemoc fizyczna albo byli maltretowani. Uczestnicy w pozostałych badaniach byli narażeni na szereg urazów.
W większości badań porównywano terapię psychologiczną z postępowaniem kontrolnym, w ramach którego stosowano standardowe leczenie, listę oczekujących na leczenie lub nie stosowano leczenia; w innych badaniach porównywano różne rodzaje terapii psychologicznych.
Łącznie w 43 badaniach podano wyniki zarejestrowane w ciągu pierwszego miesiąca od zakończenia leczenia; w 27 badaniach ‐ w okresie od jednego miesiąca do jednego roku, a w 8 badaniach ‐ przez co najmniej rok po zakończeniu leczenia.
O czym mówią wyniki przedstawione w tym przeglądzie?
U dzieci i młodzieży uczestniczących w terapii psychologicznej (psychoterapii) rzadziej rozpoznawano PTSD i obserwowano mniej objawów PTSD w okresie jednego miesiąca od zakończenia leczenia, w porównaniu z tymi, którzy nie otrzymali żadnego leczenia, zostali poddani standardowemu leczeniu albo oczekiwali na leczenie. Nasze zaufanie wobec tych wyników jest ograniczone ze względu na niską lub bardzo niską jakość danych naukowych. Nie odnaleziono danych naukowych dotyczących skuteczności stosowania terapii psychologicznych w okresie dłuższym niż jeden miesiąc. Dane naukowe umiarkowanej jakości wskazują, że terapia poznawczo‐behawioralna (CBT) może być skuteczniejsza pod względem zmniejszenia nasilenia objawów PTSD, w porównaniu z innymi rodzajami terapii psychologicznej, w okresie do jednego miesiąca. Nie podano informacji o objawach niepożądanych. Nie odnaleziono żadnych badań, w których porównywano stosowanie psychoterapii i farmakoterapii.
Jaki powinien być następny krok?
Naukowcy powinni przeprowadzić badania wysokiej jakości w celu dalszej oceny skuteczności stosowania terapii psychologicznych u dzieci i młodzieży, które przeżyły traumę. Badania te należy zaprojektować tak, żeby uczestnicy i ich rodziny nie wiedzieli czy otrzymują terapię psychologiczną, zwłaszcza gdy wyniki podawane są przez uczestników lub ich rodziców. Ponadto należy dołożyć starań, aby zapewnić duży odsetek osób poddanych obserwacji dłuższej niż jeden miesiąc po zakończeniu terapii.
Ponadto w badaniach należy porównać różne rodzaje terapii psychologicznej, aby dostarczyć wskazówki, czy dzieci i młodzieży, które przeżyły różnego rodzaju traumę lepiej lub gorzej odpowiedzą na te różne rodzaje terapii.
Authors' conclusions
Summary of findings
| Patient or population: children and adolescents exposed to trauma | ||||||
| Outcomes | Anticipated absolute effects* (95% CI) | Relative effect | Number of participants | Quality of the evidence | Comments | |
| Risk with control (short‐term) | Risk with all psychotherapies | |||||
| PTSD diagnosis | Study population | OR 0.51 | 874 | ⊕⊝⊝⊝ | ||
| 367 per 1000 | 228 per 1000 | |||||
| Moderate | ||||||
| 345 per 1000 | 212 per 1000 | |||||
| PTSD total symptoms | Mean PTSD total symptoms in the intervention group 0.42 standard deviations undefined fewer (0.61 fewer to 0.24 fewer) | Moderate effect size | 2051 | ⊕⊕⊝⊝ | ||
| *The risk in the intervention group (and its 95% confidence interval) is based on assumed risk in the comparison group and relative effect of the intervention (and its 95% CI) | ||||||
| GRADE Working Group grades of evidence | ||||||
| aParticipants are likely to have been aware of whether they received the active or inactive intervention in all studies, and diagnosis was based on self reported measures in 2 studies dParticipants were likely to have been aware of whether they received active or inactive intervention in all but one study, and scores were based on self reported measures in 10 studies eSubstantial heterogeneity between different types of psychological therapy (I2 = 71%) | ||||||
| Patient or population: children and adolescents exposed to trauma | ||||||
| Outcomes | Anticipated absolute effects* (95% CI) | Relative effect | Numer of participants | Quality of the evidence | Comments | |
| Risk with other therapies (short‐term) | Risk with CBT | |||||
| PTSD diagnosis | Study population | OR 0.74 | 160 | ⊕⊝⊝⊝ | ||
| 141 per 1000 | 108 per 1000 | |||||
| Moderate | ||||||
| 111 per 1000 | 85 per 1000 | |||||
| PTSD total symptoms | Mean PTSD total symptoms in the intervention group 0.24 standard deviations undefined fewer (0.42 fewer to 0.05 fewer) | Small effect size | 466 | ⊕⊕⊕⊝ | ||
| *The risk in the intervention group (and its 95% confidence interval) is based on assumed risk in the comparison group and relative effect of the intervention (and its 95% CI) | ||||||
| GRADE Working Group grades of evidence | ||||||
| aParticipants are likely to have been aware of whether they received active or inactive intervention in both studies, and diagnosis was based on self reported measures in both cParticipants are likely to have been aware of whether they received active or inactive intervention in all studies, and scores were based on self reported measures in 4 studies | ||||||
Background
Description of the condition
Children and adolescents exposed to trauma are at high risk of post‐traumatic stress disorder (PTSD) and other negative emotional, behavioural and mental health outcomes. Although estimates of the prevalence of PTSD in children and adolescents who have experienced trauma vary, most studies have reported prevalence of 30% to 40% (AACAP 1998; Fletcher 2003; McNally 1996; Saigh 1996), and a meta‐analysis of 34 studies of 2697 children and adolescents exposed to traumatic events (Fletcher 2003) reported an overall prevalence of 36%. The prevalence of PTSD appears to vary with several factors, such as type of trauma, frequency and severity of exposure and time since the traumatic event (Carr 2004; Donnelly 2002; Fletcher 2003; Foy 1996; Yule 2001). Multiple studies have identified co‐morbidities between PTSD and other psychiatric disorders, including depression and anxiety disorders, externalising disorders, substance use and suicidal ideation (AACAP 1998; APA 2000; Donnelly 2002; Perrin 2000).
Characteristic symptoms of PTSD include re‐experiencing the trauma (such as recurrent memories or nightmares), avoiding stimuli associated with the trauma and increased arousal and reactivity (APA 2000; WHO 1990). According to the Diagnostic and Statistical Manual of Mental Disorders, 4th Edition, Text Revision (DSM‐IV‐TR) criteria for a PTSD diagnosis, symptoms must be present for at least a month and must cause clinically significant distress or impairment in social, occupational or other important areas of function (APA 2000). Types of traumatic events that may cause PTSD include natural and man‐made disasters, war, physical or sexual abuse, violence to self or others, exposure to suicidal acts, serious injury and life‐threatening illness such as cancer or severe burns (AACAP 1998; APA 2000; Parry‐Jones 1995).
Description of the intervention
For children who have been exposed to trauma, psychological therapies are intended to prevent the onset of trauma‐related symptoms or PTSD (Forman‐Hoffman 2013). Although a range of psychological therapies are used with people exposed to trauma (see How the intervention might work), most therapies are based on one or more common elements. These may include psychoeducational elements, which may help traumatised children or adolescents to normalise PTSD reactions; psychodynamic elements, which can help them to process the trauma emotionally and gain a better understanding of its meaning to them; exposure elements, which can desensitise them to trauma‐related memories; cognitive‐behavioural elements, which help them rethink assumptions and reactions to the traumatic event; and coping elements or skills, such as problem solving, safety planning and anxiety management (AACAP 2010; Carr 2004; Robertson 2004; Sones 2011). Inclusion of parents may enhance the effectiveness of these therapies with children and adolescents by improving parental recognition of trauma symptoms and enhancing their ability to help with their child's emotional distress and to manage related behaviour problems (AACAP 2010). Psychological therapies may be targeted to the individual or may be group‐based, and the frequency and duration of treatment may vary widely.
How the intervention might work
Several trauma‐specific and generic psychological therapeutic approaches have been used to prevent negative outcomes among children and adolescents who have undergone trauma. Cognitive‐behavioural therapy (CBT) challenges the distorted, negative thinking patterns associated with the trauma to help people develop more adaptive cognitions and behaviours (Robertson 2004; Sones 2011). Exposure therapy is used to help people overcome symptoms by exposing them to specific or non‐specific cues or memories related to the trauma (Neuner 2004; Robertson 2004). Because the fragmentation and distortion of memories and cognitions associated with trauma are thought to prevent symptom resolution, narrative therapy can be used to help someone reconstruct a consistent narrative about the trauma (Neuner 2004). Therapists work with individuals in psychodynamic psychotherapy to help them develop a better understanding of their responses to the trauma and how it impacts their feelings, behaviours and relationships (AACAP 2010; BluePages 2012; Foa 1997). In eye movement desensitisation and reprocessing (EMDR), the individual focuses on a disturbing image, memory, emotion or cognition associated with the trauma, while the therapist initiates rapid voluntary eye movements (Bryant 2001; Robertson 2004). Other therapies include supportive therapy, whereby counsellors give support, listen to people and help them talk over their problems (BluePages 2012); debriefing, which allows emotional processing or ventilation by encouraging recollection, ventilation and reworking of the traumatic event (Rose 2002); and family therapy, which can reduce psychological symptoms by focusing on improving family communication and functioning (Henken 2007).
Why it is important to do this review
Although a Cochrane review has been conducted to examine the effectiveness of psychological interventions for children and adolescents diagnosed with PTSD (Gillies 2012), no Cochrane reviews have studied available psychological therapies for prevention of PTSD in children and adolescents exposed to trauma. Therefore, we have prepared this Cochrane review to address the remaining need for a systematic review of the effectiveness of psychological therapies for prevention of PTSD and other negative outcomes in children and adolescents who have undergone trauma.
Objectives
To assess the effects of psychological therapies in preventing PTSD and associated negative emotional, behavioural and mental health outcomes in children and adolescents who have undergone a traumatic event.
Methods
Criteria for considering studies for this review
Types of studies
All relevant randomised and quasi‐randomised controlled trials. Quasi‐randomised studies included studies that used allocation methods with no apparent association with participant characteristics. For example, we could include studies that allocated participants on the basis of the last numeral of the medical identifier number or the last numeral of the date of birth.
All cross‐over trials and cluster‐randomised trials were eligible for inclusion.
Types of participants
Participant characteristics
We included studies of children or adolescents, boys and girls, up to and including 18 years of age, who had been exposed to a traumatic event. Trauma is defined as an event in which the child or adolescent experienced, witnessed or was confronted with an event or events that involved actual or threatened death or serious injury, or a threat to the physical integrity of self or others, and response involved intense fear, helplessness or horror, which in children may be expressed as disorganised or agitated behaviour (APA 2000). Trauma may include natural or man‐made disaster, physical or sexual abuse, war, violence and life‐threatening injury.
The primary criterion of exposure to trauma differentiates this review, which focuses on the effectiveness of psychological therapies in prevention of PTSD, from the previously published review on psychological therapies as treatment for children and adolescents with PTSD (Gillies 2012).
Diagnosis
Although the inclusion criterion for this review was exposure to trauma, participants in some identified studies may have been diagnosed with PTSD or might have had baseline symptom scores that were above validated cut‐off scores for PTSD. Therefore, for this review we included studies if less than 50% of participants in both groups had baseline symptom scores above validated cut‐offs, or were diagnosed with PTSD using validated methods. When 50% or more of participants received a diagnosis of PTSD or had baseline scores above validated cut‐off scores, these were considered treatment studies and included in Gillies 2012 or, if newly identified, will be included in updates of Gillies 2012.
Co‐morbidities
We included studies of participants with any co‐morbidity.
Setting
We placed no restriction on the setting of studies.
Subset data
If children and adolescents were randomised separately, and if data for children or adolescents were reported as a subset of data in a study that included adults, we would have included these data.
Types of interventions
Experimental interventions
-
Major categories of psychological therapies included CBT (including both cognitive and behavioural components), exposure therapy, family therapy, EMDR, narrative therapy, psychodynamic therapy (including play therapy), psychoeducation, immediate post‐trauma interventions such as debriefing and psychological first aid and supportive therapy (including non‐directive counselling). Therapies had to be used primarily with the child or adolescent and could be delivered in any format including individual or group therapies but could also include parents or could have parents attend parallel sessions.
Comparator interventions
-
Control (treatment as usual, waiting list controls or no treatment).
-
Another psychological therapy.
-
Pharmacological therapy.
Types of outcome measures
Reports of the following outcomes were not required for studies to be considered for inclusion in this review. If it was apparent that these outcomes had not been measured (rather than had not been reported) upon review of these studies, we excluded them and provided the reasons for exclusion.
Primary outcomes
1. Diagnosis of post‐traumatic stress disorder determined by accepted clinical diagnostic criteria such as International Classification of Diseases, Revision 10 (ICD‐10), or DSM‐IV‐TR.
2. Symptoms of PTSD measured on scales based on diagnostic criteria such as ICD‐10 or DSM‐IV‐TR with published reliability and validity (e.g. Children's PTSD Inventory) (Saigh 2000).
Secondary outcomes
3. Severity or incidence of anxiety symptoms (e.g. State‐Trait Anxiety Inventory for Children) (Spielberger 1973).
4. Severity or incidence of depressive symptoms (e.g. Children's Depression Inventory) (Kovacs 1992).
5. Severity or incidence of behavioural problems (e.g. Child Behavior Checklist) (Achenbach 1983).
6. Function (e.g. Children's Global Assessment Scale) (Schaffer 1983).
7. Quality of life (e.g. Pediatric Quality of Life Inventory, version 4.0) (Varni 2001).
8. Any adverse events including self harm or suicidal behaviour.
9. Cost.
10. Loss to follow‐up.
Outcome scales
We included outcome data only if the scale or questionnaire was reported to be valid and reliable in a peer‐reviewed journal. If useable data for a particular outcome were collected from different sources (i.e. PTSD symptoms reported by child and parent in Celano 1996, Danielson 2012, Jaberghaderi 2004, Kemp 2010 and Schottelkorb 2012), we used data that showed the highest response rates. If follow‐up was the same for all raters, we used clinician scales in preference because these were based on clinician interview with child and parent, which is considered by expert groups as the most valid form of assessment (AACAP 1998).
Timing of outcome assessment
Data were analysed as short‐term (up to and including one month following completion of therapy), medium‐term (between one month and one year following therapy) and long‐term (one year or longer).
Hierarchy of outcome measures
If two or more sets of data were available for any of these periods, we used the first data set. For example, if follow‐up data were reported at three months and six months, we used data for the three‐month follow‐up period.
Search methods for identification of studies
Cochrane Common Mental Disorders Group's Specialised Register (CCMDCTR)
The Cochrane Common Mental Disorders Group maintains a specialised register of randomized controlled trials, the CCMDCTR. This register contains over 40,000 reference records (reports of RCTs) for anxiety disorders, depression, bipolar disorder, eating disorders, self‐harm and other mental disorders within the scope of this Group. The CCMDCTR is a partially studies based register with >50% of reference records tagged to c12,500 individually PICO coded study records. Reports of trials for inclusion in the register are collated from (weekly) generic searches of Medline (1950‐), Embase (1974‐) and PsycINFO (1967‐), quarterly searches of the Cochrane Central Register of Controlled Trials (CENTRAL) and review specific searches of additional databases. Reports of trials are also sourced from international trial registries, drug companies, the hand‐searching of key journals, conference proceedings and other (non‐Cochrane) systematic reviews and meta‐analyses. Details of CCMD's core search strategies (used to identify RCTs) can be found on the Group's website with an example of the core Medline search displayed in Appendix 1.
Electronic searches
1. Cochrane Specialised Register
CCDMDCTR ‐ Studies Register
We searched the studies register (to 29‐May‐2015) using the following terms.
Diagnosis = ("post‐traumatic stress disorders" or "acute stress disorder" or stress)
and
Age‐Group = (child or adolescent)
and
Intervention = (counsel* or *therapy or intervention or training or *education).
CCDMDCTR ‐ References Register
We searched the References Register (to 29‐May‐2015) using a more sensitive set of free‐text terms to identify additional untagged/uncoded references.
Title/Abstract/Keywords = (PTSD or “post trauma*” or post‐trauma* or posttrauma* or trauma* or stress) and (adolesc* or preadolesc* or pre‐adolesc* or boy* or girl* or child* or infant* or juvenil* or minors or school* or pediatri* or paediatri* or pubescen* or puberty or student* or teen* or young or youth* or school* or high‐school or “high school” or college or undergrad*).
2. Interntional Trial Registers
We searched ClinicalTrials.gov and the WHO International Clinical Trials Registry Platform (ICTRP) to 29‐May‐2015
Searching other resources
We checked reference lists of relevant studies and reviews for additional references to potentially relevant studies. We included non‐English language studies.
Data collection and analysis
Selection of studies
Two review authors checked the results of database searches to exclude references that clearly were not relevant to the review. These review authors then assessed titles and/or abstracts of the remaining studies, as well as studies identified by other methods, to determine eligibility for the review. We resolved disagreements regarding selection of studies through consensus or, if necessary, by consultation with a third member of the review team. When doubt remained, we obtained and reviewed the full‐text article. When further clarification by study authors was needed for a decision, we made all reasonable attempts to contact them.
Data extraction and management
Members of the review team developed and piloted a data extraction form. Two members of the review group independently extracted methodological and outcome data from each study. Each pair then compared results to identify differences. If identified, we resolved differences by consensus or by referral to a third member of the review team. When further clarification or missing data were needed from study authors, we made all reasonable attempts to contact them.
Extracted data included information about participants, including inclusion criteria, exclusion criteria and number, age, ethnicity and gender; details of study setting and information on trauma exposure and symptoms; information on interventions, including major components of each therapy as described by study authors, whether treatment was manualised and length, frequency and format of sessions; the professional background of therapists, any intervention training received and supervision or fidelity; and outcomes, including which measures were used, who rated them and when they were measured. These study characteristics are reported in the Characteristics of included studies tables, with details provided by study authors.
The three main planned comparisons were:
-
psychological therapies versus control (wait list, treatment as usual, no treatment);
-
psychological therapies versus other psychological therapies; and
-
psychological therapies versus pharmacological therapies.
We organised data under the following categories of psychological therapies.
-
Cognitive‐behavioural therapy (CBT).
-
Eye movement desensitisation and reprocessing (EMDR).
-
Exposure‐based therapy.
-
Family therapy.
-
Narrative therapy.
-
Post‐trauma interventions (including debriefing and psychological first aid).
-
Psychodynamic psychotherapy (including play therapy).
-
Psychoeducation.
-
Supportive therapy (including non‐directive counselling).
Assessment of risk of bias in included studies
We independently assessed trials as having 'low', 'high' or 'unclear' risk of bias according to the following quality criteria (Higgins 2008).
-
Adequate sequence generation (selection bias).
-
Allocation concealment (selection bias).
-
Blinding of participants (performance bias).
-
Blinding of outcome assessment (detection bias).
-
Incomplete outcome data (attrition bias).
-
Free of selective reporting (selective reporting).
-
Free of any other bias.
When disagreement arose about whether a trial fulfilled particular quality criteria, we resolved differences by consensus or by referral to a third member of the review team.
As little is available to inform levels of attrition that are acceptable, it is difficult to make an objective judgement about the level of attrition bias; therefore, we considered two factors: percentage loss to follow‐up and use of imputed data; the latter was treated as a positive factor against attrition bias. Therefore, we considered attrition of less than 5% as associated with low risk of bias, whether completer or imputed data were reported. If attrition was between 5% and 15%, it was considered to involved unclear risk of bias if completer data were reported, and low risk if imputed data were reported. if attrition was greater than 15% up to 30%, completer data were considered to show high risk, and imputed data as unclear risk; if attrition was greater than 30%, both were considered to show high risk of attrition bias. If loss to follow‐up was greater than 50% in either group, we did not include study data. We investigated potential differences between groups in loss to follow‐up by performing meta‐analysis.
Measures of treatment effect
Dichotomous data
For binary outcomes, we calculated the odds ratio (OR) and the 95% confidence interval (95% CI) by using a random‐effects model.
Continuous data
We calculated the standardised mean difference (SMD) and the 95% CI of continuous outcomes by using a random‐effects model. SMDs were used to pool continuous outcomes when different measures were used. However, to ensure consistency of reporting in this review, we used SMDs throughout.
To calculate SMDs, we needed means and standard deviations (SDs). If SDs were not reported, we calculated them from reported measures of variance such as standard errors or 95% CIs, if possible.
Skewed data
As a meta‐analysis is based on assumptions of normality, we checked all continuous data for skew before inclusion. For a scale that starts from zero, we considered a standard deviation that is more than half the mean to show strong evidence of a skewed distribution (Higgins 2008). Therefore, if the standard deviation was greater than the mean for both groups, we did not include these data in a meta‐analysis and reported them separately.
Unit of analysis issues
Cross‐over trials
We identified no cross‐over trials. If we had found these, we would have used only first interval data, as the likelihood of a carryover effect is high when psychological therapy is provided.
Cluster‐randomised trials
We intended to correct data for cluster‐randomised trials for paired analysis; however, as intracluster correlations were not available for these trials, we conducted sensitivity analyses to identify whether inclusion of these trials had affected meta‐analytical findings.
Studies with multiple treatment groups
If a study included multiple treatment arms that described different comparisons, we would have analysed these separately. For example, if a three‐armed trial incorporated narrative therapy, supportive therapy and a control treatment arm, we would use these data in comparisons of narrative therapy versus control, supportive therapy versus control and narrative therapy versus supportive therapy. However, no studies in this review reported multiple treatment arms.
Dealing with missing data
We used intention‐to‐treat data and imputed values such as last observation carried forward when these were reported. We conducted sensitivity analyses to test for effects of loss to follow‐up on the stability of results.
Assessment of heterogeneity
We used a Mantel‐Haenszel Chi2 statistic test and I2 analysis to test for heterogeneity.
Based on the recommendations of Higgins 2008 (9.5.2), we interpreted heterogeneity by using the following values of I2.
-
0% to 40%: might not be important.
-
30% to 60%: may represent moderate heterogeneity.
-
50% to 90%: may represent substantial heterogeneity.
-
75% to 100%: shows considerable heterogeneity.
Assessment of reporting biases
We entered primary outcome data from all included studies into a funnel plot (trial effect against trial size) to investigate the possibility of publication bias (Egger 1997).
Data synthesis
We collected data for all follow‐up periods as long as loss to follow‐up did not exceed 50% for either group. We analysed data as short‐term (up to and including one month following completion of therapy), medium‐term (between one month and one year following therapy) and long‐term (one year or longer). If two or more more sets of useable data were provided for any of these periods, we used the first data set.
When studies reported data for more than one group (e.g. Tol 2012, which reported data for boys and girls separately), we calculated pooled means and standard deviations and used them in the meta‐analysis.
In meta‐analyses of psychological therapies versus control, we used studies that compared an added psychological therapy versus another psychological therapy (i.e. Berliner 1996, which compared exposure plus supportive therapy versus supportive therapy only, and Deblinger 2011, which compared narrative therapy plus CBT versus CBT) when the additional psychological therapy was considered the control intervention. We investigated effects of psychological therapies as controls in the sensitivity analysis for active versus inactive controls (Analysis 11.1; Analysis 11.2).
When cluster‐randomised trials were identified, we would have made appropriate corrections for the cluster design if appropriate data had been reported, and these data were incorporated into the meta‐analyses. However, data that could be used to make these corrections were not reported.
Subgroup analysis and investigation of heterogeneity
We explored whether clinical differences between studies may have resulted in different estimates of effectiveness through subgroup analyses. These included
-
type of therapy: CBT, debriefing, EMDR, family therapy, narrative therapy, psychoeducation, supportive therapy;
-
type of trauma: sexual abuse, maltreatment, physical trauma, life‐threatening illness, interpersonal violence, community violence or war, natural disaster. For studies that included participants who had experienced a range of traumas, if most experienced a particular type of trauma (e.g. Berkowitz 2011, in which most participants experienced physical trauma), we analysed them under this category;
-
therapy mode: individual versus group, child versus mother, child therapy;
-
type of control: active control (e.g. treatment as usual, which included elements of psychological therapy, or compared a particular psychological therapy as an adjunct to another therapy) or inactive control (e.g. no treatment, wait list, craft group); and
-
inclusion of symptoms as part of the inclusion criteria compared with symptom levels not defined.
Sensitivity analysis
We conducted sensitivity analysis for loss to follow‐up using best‐case and worst‐case analyses of the primary binary outcome ‐ improvement. For the best‐case analysis, we considered all participants lost to follow‐up to have improved, and for the worst‐case analysis, we considered participants lost to follow‐up to be not improved. Studies that did not report loss to follow‐up could not be included in this analysis.
We also carried out sensitivity analyses based on whether studies were rated as having low, unclear or high risk of selection, performance, detection and attrition bias. In addition, we assessed whether including data from cluster‐randomised trials had an effect on the analysis.
Therefore, sensitivity analyses were performed as follows.
-
Best‐case versus worst‐case analysis.
-
Selection bias: low versus unclear versus high risk.
-
Performance bias: low versus unclear versus high risk.
-
Detection bias: low versus unclear versus high risk.
-
Attrition bias: low versus unclear versus high risk.
-
Cluster versus individually randomised trials.
'Summary of findings' tables
We created 'Summary of findings' tables for primary outcomes, PTSD and symptoms for all psychological therapies compared with control, and for CBT compared with other psychological therapies in the short‐term. We used the five GRADE (Grades of Recommendation, Assessment, Development and Evaluation Working Group) considerations (study limitations, consistency of effect, imprecision, indirectness and publication bias) to assess the quality of evidence for each outcome, and to draw conclusions about quality of evidence within the text of the review.
Results
Description of studies
Results of the search
From 172 study records, we identified 116 studies for review (see Figure 1 for Search flow diagram), included 51 studies (88 citations) with a total of 6201 participants (see Characteristics of included studies) and excluded 46 studies (59 records) (Characteristics of excluded studies). We have not yet assessed 14 studies, three because they require translation and the remainder because data were not available at the time of writing the review (Characteristics of studies awaiting classification); we also identified five ongoing studies (Characteristics of ongoing studies).

PRISMA study flow diagram.
Included studies
See Characteristics of included studies.
Ten included studies were cluster‐randomised controlled trials. Berger 2009, Berger 2012, Berliner 1996, Qouta 2012 and Shechtman 2010 randomised classes; Tol 2008, Tol 2012 and Tol 2014 randomised schools; Barron 2013 randomised counsellors; and Overbeek 2013 randomised children and family therapists. All other included studies randomised participants to interventions.
Settings
Most (27) included trials were done in the United States (Baker 1985; Berkowitz 2011; Berliner 1996; Carbonell 1999; Carrion 2013; Celano 1996; Chapman 2001; Chemtob 2002; Cohen 1996; Cohen 2005; Cohen 2011; Danielson 2012; Deblinger 1996; Deblinger 2001; Deblinger 2011; Dominguez 2001; Glodich 2000; Kazak 2004; Lieberman 2005; Pace 2013; Raider 2008; Salloum 2008; Salloum 2012; Shirk 2014; Stein 2003; Taussig 2010); three in the the Democratic Republic of Congo (O'Callaghan 2013; O'Callaghan 2014; McMullen 2013); two each were carried out in Australia (Cox 2010; Kemp 2010),Israel (Berger 2012; Shechtman 2010), the Netherlands (Diehle 2014; Overbeek 2013), Palestine (Barron 2013; Qouta 2012), Sri Lanka (Berger 2009; Tol 2012) and the UK (Stallard 2006; Trowell 2002). One study each was done in Bosnia (Layne 2008), Burundi (Tol 2014), Canada (Farkas 2010), Indonesia (Tol 2008), Iran (Jaberghaderi 2004), Jordan (Damra 2014), Peru (Church 2012), Sierra Leone (Betancourt 2014) and Switzerland (Zehnder 2010).
Participants
Included studies consisted of 6201 participants, and the number in each trial ranged from 16 (Church 2012; Jaberghaderi 2004) to 482 (Qouta 2012).
Ages of participants ranged from two to 24 years. Twenty trials included children only (Berliner 1996; Carbonell 1999; Celano 1996; Chemtob 2002; Damra 2014; Deblinger 1996; Deblinger 2001; Deblinger 2011; Jaberghaderi 2004; Kemp 2010; Overbeek 2013; Qouta 2012; Salloum 2008; Salloum 2012; Schottelkorb 2012; Stein 2003; Taussig 2010; Tol 2008; Tol 2012; Tol 2014), and 18 trials included both children and adolescents (Barron 2013; Berger 2009; Berkowitz 2011; Carrion 2013; Chapman 2001; Church 2012; Cohen 2005; Cohen 2011; Cox 2010; Diehle 2014; Dominguez 2001; Kazak 2004; O'Callaghan 2013; O'Callaghan 2014; Shechtman 2010; Stallard 2006; Trowell 2002; Zehnder 2010). Nine trials included only adolescents (Baker 1985; Berger 2012; Danielson 2012; Farkas 2010; Glodich 2000; Layne 2008; Pace 2013; Raider 2008; Shirk 2014) and two preschool children only (Cohen 1996; Lieberman 2005). Betancourt 2014 included adolescents and young adults, but because the mean age of participants was 18 years, we included this study.
In 12 trials, the targeted trauma was sexual abuse (Baker 1985; Berliner 1996; Celano 1996; Cohen 1996; Cohen 2005; Danielson 2012; Deblinger 1996; Deblinger 2001; Deblinger 2011; Dominguez 2001; Jaberghaderi 2004; Trowell 2002). Participants were exposed to war or community violence in ten trials (Betancourt 2014; Glodich 2000; Layne 2008; O'Callaghan 2014; McMullen 2013; Qouta 2012; Stein 2003; Tol 2008; Tol 2012; Tol 2014); physical trauma (Berkowitz 2011; Chapman 2001; Cox 2010; Kemp 2010; Stallard 2006; Zehnder 2010) and natural disaster in six trials each (Barron 2013; Berger 2009; Berger 2012; Chemtob 2002; Salloum 2008; Salloum 2012); and interpersonal violence in three (Cohen 2011; Lieberman 2005; Overbeek 2013); and had suffered a life‐threatening illness (Kazak 2004), had been physically abused (Damra 2014) or were maltreated (Taussig 2010) in one trial each. Participants in the remaining trials were exposed to a range of traumas (Carbonell 1999; Carrion 2013; Church 2012; Diehle 2014; Farkas 2010; O'Callaghan 2013; Pace 2013; Raider 2008; Schottelkorb 2012; Shechtman 2010; Shirk 2014). Participants were frequently exposed to more than one type of trauma in most trials.
Fifteen studies included participants on the basis of some measure of post‐trauma symptoms or reported baseline symptoms. To be included, participants needed a score of at least 12 on the Post‐Traumatic Stress Disorder Index (PTSD‐I) in Chapman 2001, a score of at least 7 on the Weekly Behaviour Report in Cohen 1996, at least one post‐traumatic symptom in Berkowitz 2011, significant symptoms in Cohen 2005, at least five symptoms with one from each cluster in Cohen 2011 and Deblinger 2011, clinical symptoms of PTSD in Damra 2014, at least three symptoms including at least one re‐experiencing or avoidance symptom in Deblinger 1996 and full or partial PTSD (although 5/32 had no diagnosis of PTSD) in Diehle 2014, or they had to be one of 10 students with the highest Children's Revised Impact of Events Scale (CRIES) scores in each class in Barron 2013. Mean baseline Post‐Traumatic Stress Disorder Reaction Index (PTSD‐RI) item scores were 0.68 in the therapies group and 0.77 in the control group in Betancourt 2014, PTSD‐RI total scores ranged from 22.70 to 25.80 in Carrion 2013, and mean Impact of Events Scale (IES) score was 34.2 in Church 2012. A ‘chart diagnosis’ was recorded for 81% of participants in Berliner 1996, and 88% met self reported Diagnostic and Statistical Manual, Fourth Edition (DSM‐IV) criteria for PTSD in Chemtob 2002.
Interventions
Most included trials compared a psychological therapy versus control (i.e. wait list, treatment as usual or no treatment). The psychological therapy was categorised predominantly as CBT in 17 trials (Barron 2013; Berger 2009; Berger 2012; Betancourt 2014; Carrion 2013; Damra 2014; Deblinger 1996; Layne 2008; O'Callaghan 2013; McMullen 2013; Pace 2013; Qouta 2012; Shirk 2014; Stein 2003; Tol 2008; Tol 2012; Tol 2014); as family therapy in four trials (Danielson 2012; Kazak 2004; Lieberman 2005; Raider 2008); as debriefing (Chapman 2001; Stallard 2006; Zehnder 2010) and psychoeducation/skills training (Cox 2010; Glodich 2000; O'Callaghan 2014) in three trials each; as narrative therapy (Carbonell 1999; Salloum 2012), supportive therapy (Shechtman 2010; Taussig 2010) and EMDR (Farkas 2010; Kemp 2010) in two trials each; and as exposure (Church 2012) or CBT plus narrative therapy (O'Callaghan 2013) in one trial each. Although these trials were broadly categorised under these therapies, several psychotherapeutic elements were common to a range of therapies. In particular, psychoeducation and coping skills were common to most interventions.
Among trials that compared one form of therapy versus another, eight compared CBT with supportive therapy (Berkowitz 2011; Celano 1996; Cohen 1996; Cohen 2005; Cohen 2011; Deblinger 2001; Dominguez 2001; Overbeek 2013), two compared CBT with EMDR (Diehle 2014; Jaberghaderi 2004) and one compared CBT with psychodynamic therapy (Schottelkorb 2012). Berliner 1996 compared exposure plus supportive therapy with supportive therapy only, and Deblinger 2011 compared narrative therapy plus CBT with CBT alone.
Five trials compared different models of delivery for psychological therapies. Four trials compared individual delivery of a psychological therapy versus group delivery of the same therapy (Baker 1985; Chemtob 2002; Salloum 2008; Trowell 2002), and Deblinger 1996 compared CBT for children only versus CBT for both mothers and children.
Three trials used a single intervention session (Chapman 2001; Stallard 2006; Zehnder 2010), and the remaining trials used between four and 40 therapy sessions but most commonly 10 to 15 sessions of 45 minutes to two hours, usually on a weekly basis. Interventions were delivered in a group setting in 20 trials (Barron 2013; Berger 2009; Berger 2012; Berliner 1996; Betancourt 2014; Carbonell 1999; Deblinger 2001; Glodich 2000; Kazak 2004; Layne 2008; O'Callaghan 2013; O'Callaghan 2014; Overbeek 2013; Pace 2013; Qouta 2012; Shechtman 2010; Stein 2003; Tol 2008; Tol 2012; Tol 2014).
Eleven trials were based on individual sessions with children (Carrion 2013; Chapman 2001; Church 2012; Diehle 2014; Dominguez 2001; Farkas 2010; Jaberghaderi 2004; Kemp 2010; Schottelkorb 2012; Shirk 2014; Stallard 2006), eight used a combination of individual and group delivery modes (Baker 1985; Chemtob 2002; McMullen 2013; Raider 2008; Salloum 2008; Salloum 2012; Taussig 2010; Trowell 2002) and one used a Web‐based intervention (Cox 2010). All other therapies involved parents or caregivers. Most of these were individual sessions that included parents for at least part of the therapy (Berkowitz 2011; Celano 1996; Cohen 1996; Deblinger 2011; Lieberman 2005; Zehnder 2010) or run in parallel with child and parent (Cohen 2005; Damra 2014) or consisted of both joint and parallel sessions (Cohen 2011; Danielson 2012; Deblinger 1996). Overbeek 2013 ran parallel group sessions for children and parents, and Qouta 2012 ran groups that included both.
Outcomes
Children and adolescents were diagnosed with PTSD on the basis of the Anxiety Disorder Interview Schedule for DSM‐IV (ADIS‐P; Diehle 2014), the Clinician Administered PostTraumatic Stress Disorder Scale for Children (Stallard 2006), the Diagnostic Interview Schedule for Children (Farkas 2010), the Semi Structured Interview for Diagnostic Classification (Lieberman 2005) and the Kiddie Schedule for Affective Disorders and Schizophrenia for school‐aged children ‐ Epidemiologic version (K‐SADS‐E; Deblinger 1996). They were also considered to have PTSD if they had a score of 3 or higher on one item of the University of California, Los Angeles (UCLA) PTSD Index (Berger 2009; Berger 2012), a total score of 38 or higher on the UCLA PTSD Index (Salloum 2008; Salloum 2012) or a score of 17 or higher on the intrusion/avoidance subscales of the Children's Revised Impact of Events Scale (CRIES)‐13 (Barron 2013).
The most frequently used measure for PTSD symptoms was the UCLA PTSD Index (Berger 2009; Betancourt 2014; Carrion 2013; Chapman 2001; Cohen 2011; Danielson 2012; Kazak 2004; Layne 2008; McMullen 2013; O'Callaghan 2013; Salloum 2008; Salloum 2012; Schottelkorb 2012) or the earlier version, the Child Post‐Traumatic Stress Reaction Index (Kemp 2010; Shechtman 2010), followed by the Trauma Symptom Checklist for Children (Berkowitz 2011; Cohen 2005; Cox 2010; Farkas 2010; Overbeek 2013; Raider 2008; Taussig 2010) or the Trauma Symptom Checklist for Young Children (Overbeek 2013); the Impact of Events Scale ‐ Revised (Church 2012; Cox 2010; Glodich 2000; Kazak 2004) or the earlier Impact of Traumatic Events Scale (Dominguez 2001; Kemp 2010; Stallard 2006); the K‐SADS‐E (Deblinger 1996; Deblinger 2001) and the K‐SADS ‐ Present and Lifetime (PL) version (Deblinger 2011; Shirk 2014; Trowell 2002); and the Child PTSD Symptoms Scale (Stein 2003; Tol 2008; Tol 2012; Tol 2014). Trauma symptoms were also measured by the CRIES‐13 (Barron 2013; Celano 1996; Diehle 2014; Qouta 2012) or revised version (CRIES‐8; O'Callaghan 2013); the Clinician Administered PTSD Scale (CAPS‐CA; Diehle 2014; Zehnder 2010); the Child Report of Post‐Traumatic Symptoms and the Parent Report of Post‐Traumatic Symptoms (Jaberghaderi 2004; Schottelkorb 2012); the Kauai Recovery Index (Chemtob 2002); Post‐Traumatic Stress Symptoms in Children (PTSS‐C; Damra 2014); and the Semi Structured Interview for Diagnostic Classification 0 to 3 (Lieberman 2005).
For depression, most used the Children's Depression Inventory (Berliner 1996; Carrion 2013; Cohen 2005; Cohen 2011; Damra 2014; Danielson 2012; Deblinger 1996; Deblinger 2011; Dominguez 2001; Overbeek 2013; Stein 2003; Zehnder 2010), followed by the Depression Self Rating Scale (Barron 2013; Layne 2008; Qouta 2012; Stallard 2006; Tol 2008; Tol 2012; Tol 2014). Other trials used the Beck Depression Inventory (Berger 2009; Shirk 2014); the Birleson Depression Inventory (Stallard 2006); the Children’s Depression Scale (Kemp 2010); the Institute for Personality and Ability Testing Depression Scale (Baker 1985); the Mood and Feelings Questionnaire (Salloum 2008; Salloum 2012); Orvaschel's PTSD scale (Trowell 2002); the Trauma Symptom Checklist for Children‐A (TSCC‐A; Cox 2010; Farkas 2010); and the Quick Inventory of Depressive Symptomatology (Pace 2013). Depression was diagnosed by a score of 29 or higher on the Mood and Feelings Questionnaire in Salloum 2008 and Salloum 2012 or on the K‐SADS‐PL (Shirk 2014).
The scales most frequently used to measure anxiety were the Revised Children's Manifest Anxiety Scale (Berliner 1996; Carrion 2013; Kazak 2004; Shechtman 2010; Stallard 2006), the State‐Trait Anxiety Inventory for Children (Cohen 2005; Deblinger 1996; Kemp 2010); the Screen for Child Anxiety Related Emotional Disorders (SCARED; Berger 2012; Cohen 2011; Tol 2008; Tol 2012); and the Trauma Symptom Checklist for Children (Berkowitz 2011; Cox 2010; Farkas 2010). Anxiety was also measured with the Institute for Personality and Ability Testing Anxiety Scale (Baker 1985); the Revised Child Anxiety and Depression Scale (Diehle 2014); the Multidimensional Anxiety Scale for Children (Deblinger 2011); and the State‐Trait Anxiety Inventory (Pace 2013).
Most trials measured behaviour with the Child Behavior Checklist (Berliner 1996; Celano 1996; Cohen 1996; Cohen 2005; Deblinger 1996; Deblinger 2001; Deblinger 2011; Farkas 2010; Kemp 2010; Lieberman 2005; Overbeek 2013; Salloum 2012; Shirk 2014; Zehnder 2010). Other measures of behaviour included the Strengths and Difficulties Questionnaire (SDQ; Barron 2013; Diehle 2014; Stallard 2006; Tol 2012); the Behavioral Assessment System for Children (BASC‐2; Danielson 2012); the Children’s Aggression Scale for Parents (Tol 2008); internalising and externalising items from the Oxford Measure of Psychosocial Adjustment (Betancourt 2014); the Teacher’s Report Form (Overbeek 2013); the Teacher‐Child Rating Scale (Stein 2003); the Youth Self‐Report (Glodich 2000; Raider 2008); and the African Youth Psychosocial Assessment (McMullen 2013; O'Callaghan 2013; O'Callaghan 2014).
Psychosocial function was measured by the Children's Global Assessment Scale (Celano 1996); the Kiddie Global Assessment Scale (Trowell 2002); the Pediatric Symptom Checklist (Stein 2003); and the Word Health Organization (WHO) Disability Adjustment Scale (Betancourt 2014). Functional impairment was measured by the Child Diagnostic Interview Schedule in Berger 2012 and by a scale developed by study authors in Tol 2008, Tol 2012 and Tol 2014.
Quality of life was measured by the Life Satisfaction Survey in Taussig 2010.
Cost in Great Britain pounds was reported in Trowell 2002.
Most studies (42) reported outcomes recorded within the first month after treatment; 27 studies reported outcomes from one month up to a year, and eight reported data for a year or longer after completion of treatment.
Data that could not be added to the meta‐analysis
Data from six studies could not be used because loss to follow‐up was greater than 50% for at least one group. Data included post‐treatment function in Celano 1996, PTSD symptoms and behaviour at three and 12 months in Deblinger 1996, symptoms of PTSD and depression at four months in Layne 2008 and all post‐treatment outcomes in Carrion 2013. Other than behaviour post treatment in Cohen 1996, loss to follow‐up was greater than 50% in the supportive therapy group at six and 12 months in Cohen 1996 and for all intervals in Cohen 2005.
Data from three studies could not be used in meta‐analyses because the required data were not reported and could not be calculated or obtained from study authors. Sample numbers were not clear in Chemtob 2002, and outcomes were reported as the intercept and the slope of a growth curve in Dominguez 2001; no variance was given in Chapman 2001.
Data from two studies could not be used in meta‐analyses because they showed substantial evidence of skew. Standard deviations were greater than mean PTSD scores for all groups in Deblinger 2001 and greater than all PTSD subscores in Cox 2010.
Data from three studies (Church 2012; Damra 2014; McMullen 2013) are reported separately (Table 1; Table 2; Table 3) because the effect size in all studies was several times higher than the overall estimate and contributed from 45% to 90% heterogeneity if they were added to meta‐analyses.
| Outcome | Group | n | Mean | SD |
| PTSD symptoms One month | Exposure therapy | 8 | 3.38 | 2.60 |
| Control | 8 | 31.38 | 3.84 | |
| Avoidance One month | Exposure therapy | 8 | 2.88 | 2.62 |
| Control | 8 | 20.25 | 2.38 | |
| Intrusion One month | Exposure therapy | 8 | 0.50 | 0.50 |
| Control | 8 | 11.13 | 2.93 |
| Outcome | Group | n | Mean | SD |
| PTSD symptoms Post therapy | TF‐CBT | 9 | 13.00 | 1.12 |
| Control | 9 | 24.20 | 1.54 | |
| PTSD symptoms 4 months | TF‐CBT | 9 | 11.88 | 1.96 |
| Control | 9 | 23.98 | 1.47 |
| Outcome | Group | n | Mean | SD |
| PTSD symptoms Post therapy | TF‐CBT | 24 | 10.6 | 4.5 |
| Control | 24 | 34.8 | 11.6 | |
| Conduct Problems Post therapy | TF‐CBT | 24 | 0.7 | 0.9 |
| Control | 24 | 7.1 | 7.0 |
Excluded studies
See Characteristics of excluded studies.
We excluded 46 studies, but six of these (Catani 2009; Cohen 2004; Ertl 2011; King 2000; Ruf 2010; Schauer 2008) were included in the Cochrane review on psychological therapies for treatment of PTSD in children and adolescents (Gillies 2012), and seven will be reviewed in the update (Chen 2014; Jacob 2014; Jensen 2014; Murray 2015; Rosner 2014; Ruf 2012; Soltanifar 2012).
We obtained full copies of the remaining 33 studies, as it was not clear from the available title or abstract whether they would meet the inclusion criteria. We excluded most because allocation was not randomised (Burke 1988; Ehntholt 2005; Gellman 2001; Goenjian 1997; Jeffres 2004; Kenardy 2008; Krueger 2013; Pfeffer 2002; Shooshtary 2008; Thabet 2005; Wang 2011; Wolmer 2011a; Wolmer 2011b) or study participants were not screened for exposure to trauma (Berger 2007; Bolton 2007; Cooley‐Strickland 2011; Gelkopf 2009; Hardin 2002; Jordans 2010; Rubin 2001; Wang 2011). Less than 50% of participants in the intervention group were randomised in Scheeringa 2011, the average age of participants was 19 years in Schaal 2009, no comparison group was included in Goenjian 1997 and Shelby 1995, the intervention was not a psychological therapy in Kassam‐Adams 2011 and Phipps 2012 and was used with mothers only in Dybdahl 2001 and follow‐up was only 10% in Saxe 2012 and 25% in the control group in Pfeffer 2002. Data were not reported and could not be obtained for Ensink 2004 and McWhirter 2011, and no data for the control group could be obtained for Kataoka 2003. Lyshak‐Stelzer 2007 was an interim publication of a trial that had already reported very high loss to follow‐up.
Studies awaiting classification
Fourteen studies are awaiting assessment (see Characteristics of studies awaiting classification). We have not yet assessed three randomised controlled trials (RCTs) as translations of these findings are not yet available (Mahmoudi‐Gharaei 2006; Narimani 2013,Shen 2012). The remainder have not been assessed as data were not available at the time of writing this review.
In contrast to our included studies, which were mostly done in the United States, the studies awaiting assessment were conducted in African countries including Burundi (Crombach 2012), Northern Uganda (Elbert 2009); and South Africa (Elbert 2013), Australia (Ooi 2010), China (Shen 2012; Zang 2013), Iran (Mahmoudi‐Gharaei 2006; Narimani 2013), Sweden (Hultmann 2012), Switzerland (Kramer 2014), and the UK (Jessiman 2013), with three in the United States (Kassam‐Adams 2016; Rowe 2013; Ruggiero 2015).
Participants had been affected by natural disasters (Mahmoudi‐Gharaei 2006; Rowe 2013; Shen 2012; Zang 2013); by war (Elbert 2009; Ooi 2010); by interpersonal abuse (Jessiman 2013; Hultmann 2012); by physical illness or injury (Kramer 2014;Ruggiero 2015;Kassam‐Adams 2016); unspecified traumatic events (Elbert 2009; Narimani 2013); or were violent offenders who had been exposed to traumatic stress (Elbert 2013).
Controls were compared to CBT (Hultmann 2012; Ooi 2010; Mahmoudi‐Gharaei 2006; Narimani 2013); guided narrative technique (Crombach 2012; Elbert 2009; Elbert 2013; Zang 2013); 'Letting the Future in' for children affected by sexual abuse (Jessiman 2013); a debriefing, psychoeducation and coping intervention (Kramer 2014); and expressive group counselling (Shen 2012). Controls were also compared to two web‐based interventions, ‘Coping Coach’ (Kassam‐Adams 2016) and ‘Bounce Back’ (Ruggiero 2015). The other studies compared different psychological therapies: Elbert 2013 compared FORNET, a narrative exposure therapy, to CBT; and Rowe 2013 compared group‐based CBT to family therapy. Mahmoudi‐Gharaei 2006 compared CBT to CBT plus art and sport interventions, and an art and sport intervention alone.
Ongoing studies
We identified five ongoing RCTs (see Characteristics of ongoing studies). These are being conducted in Kenya or Tanzania (Dorsey 2012), Australia (Sansom‐Daly 2012), the Netherlands (Roos 2013) and the United States (Belcher 2009; Toth 2011).
Participants had one or both parents die (Dorsey 2012); were exposed to neglect (Belcher 2009) or maltreatment (Toth 2011); had recently completed cancer treatment (Sansom‐Daly 2012); or had been exposed to a single traumatic event (Roos 2013).
Interventions compared with controls in ongoing trials include trauma‐focused CBT (Dorsey 2012) and family‐based therapy (Belcher 2009). Three ongoing trials are comparing different psychological therapies: 'Recapture Life’, an online group‐based CBT, is being compared with online supportive therapy (Sansom‐Daly 2012); EMDR to cognitive‐behavioural writing therapy (Roos 2013); and interpersonal therapy to enhanced care (Toth 2011).
Risk of bias in included studies
For graphical representations of the overall risk of bias in included trials, see Figure 2 and Figure 3.

Risk of bias summary: review authors' judgements about each risk of bias item for each included study.

Risk of bias graph: review authors' judgements about each risk of bias item presented as percentages across all included studies.
Allocation
Barron 2013 was considered to have high risk of selection bias because even though counsellors were randomised, they then identified participant classes. The generation of a randomisation sequence was described and was considered to lead to low risk of bias in 25 trials (Baker 1985; Berger 2009; Berger 2012; Berkowitz 2011; Berliner 1996; Betancourt 2014; Chemtob 2002; Cohen 1996; Cohen 2005; Cohen 2011; Cox 2010; Danielson 2012; Deblinger 2001; Diehle 2014; Glodich 2000; Jaberghaderi 2004; McMullen 2013; O'Callaghan 2013; O'Callaghan 2014; Overbeek 2013; Pace 2013; Salloum 2012; Schottelkorb 2012; Stallard 2006; Stein 2003) and to unclear risk in the remainder.
Barron 2013 was also considered at high risk because of allocation concealment based on selection of participant classes. Eight included trials (Berliner 1996; Cohen 2011; Diehle 2014; O'Callaghan 2013; O'Callaghan 2014; Overbeek 2013; Stallard 2006; Stein 2003) were considered to have low risk. Allocation concealment was not described in the remaining 42 trials, which therefore were rated as having unclear risk.
Blinding
Participants were likely to be aware of whether they had been assigned to an intervention group or a control group in 32 trials (Barron 2013; Berger 2009; Berger 2012; Betancourt 2014; Carbonell 1999; Carrion 2013; Chapman 2001; Chemtob 2002; Church 2012; Cox 2010; Damra 2014; Danielson 2012; Deblinger 1996; Farkas 2010; Glodich 2000; Kazak 2004; Kemp 2010; Lieberman 2005; McMullen 2013; O'Callaghan 2013; O'Callaghan 2014; Pace 2013; Qouta 2012; Raider 2008; Shechtman 2010; Stallard 2006; Stein 2003; Taussig 2010; Tol 2008; Tol 2012; Tol 2014; Zehnder 2010); therefore, these were rated as having high risk of performance bias. Participants in both groups received therapy in Diehle 2014, Overbeek 2013 and Shirk 2014, and these studies were rated as having low risk. All other trials were rated as having unclear risk of performance bias.
Primary outcomes were self reported in most studies (30) in which participants were probably aware of whether they received an intervention; these studies were rated as having high risk of detection bias (Barron 2013; Berger 2009; Berger 2012; Betancourt 2014; Carbonell 1999; Carrion 2013; Chapman 2001; Chemtob 2002; Church 2012; Cox 2010; Damra 2014; Danielson 2012; Deblinger 1996; Farkas 2010; Glodich 2000; Kazak 2004; Kemp 2010; McMullen 2013; O'Callaghan 2013; O'Callaghan 2014; Pace 2013; Qouta 2012; Raider 2008; Shechtman 2010; Stein 2003; Taussig 2010; Tol 2008; Tol 2012; Tol 2014; Zehnder 2010). Trials were rated as having low risk of bias when blinded assessment of primary outcomes was described (Lieberman 2005; Shirk 2014; Stallard 2006), and when studies that used self reported primary measures provided therapy to both groups (Diehle 2014; Overbeek 2013). Risk was rated as unclear in the remaining 15 studies.
Incomplete outcome data
Risk of attrition bias was low in 10 studies. Berger 2009, Berger 2012, Church 2012 and Damra 2014 reported no apparent loss to follow‐up, and loss to follow‐up was less than 5% in Tol 2012 and Zehnder 2010. Loss to follow‐up in Betancourt 2014, Danielson 2012, O'Callaghan 2014 and Tol 2008 was between 5% and 15%, but imputed values were used to account for missing data.
Other trials that reported completer data were rated as having unclear risk of bias if loss to follow‐up was between 5% and 15% (Barron 2013; Glodich 2000; Jaberghaderi 2004; Kemp 2010; O'Callaghan 2013; Salloum 2012; Stein 2003; Taussig 2010). If loss to follow‐up was between 15% and 25% but imputed values were used to account for missing data, the risk was considered unclear (Berkowitz 2011; Cohen 2005; Cohen 2011; Cox 2010; Deblinger 2011; Diehle 2014; Overbeek 2013; Shirk 2014; Trowell 2002). In addition, if loss to follow‐up was not reported (Baker 1985; Chapman 2001; Chemtob 2002; Tol 2014), studies were rated as having unclear risk.
We considered 18 trials to have high risk of attrition bias because incomplete outcome data were reported and attrition rates were greater than 15% (i.e. Berliner 1996; Carbonell 1999; Celano 1996; Cohen 1996; Deblinger 1996; Deblinger 2001; Dominguez 2001; Farkas 2010; Layne 2008; Lieberman 2005; McMullen 2013; Pace 2013; Qouta 2012; Raider 2008; Salloum 2008; Schottelkorb 2012; Shechtman 2010; Stallard 2006). We also rated Kazak 2004 as having high risk of attrition bias even though imputed results were reported, because loss to follow‐up was differentially higher in the intervention group than in the control group (38% versus 7%). Studies that used imputed data but reported loss to follow‐up greater than 30% were also considered to have high risk of bias (Berliner 1996; Cohen 2005; Cohen 2011; Cox 2010; Diehle 2014; Farkas 2010).
Selective reporting
The primary outcome of PTSD symptoms were not reported in four trials (Berger 2009; Chapman 2001; Diehle 2014; Shirk 2014), which therefore were rated as having high risk of reporting bias. Studies that did not report secondary outcomes such as Trowell 2002, which did not report depression, anxiety and hyperarousal; Stallard 2006 did not report parent SDQ scores; and O'Callaghan 2014, which did not report function, were rated as having unclear risk of bias. It was not clear whether all outcomes were reported in Barron 2013, Church 2012, Damra 2014, Danielson 2012, Deblinger 1996, Glodich 2000, Lieberman 2005, O'Callaghan 2013, Overbeek 2013, Salloum 2008, Tol 2012 and Tol 2014, which therefore were rated as having unclear risk of bias. All other trials appeared to report all outcomes and were rated as having low risk of reporting bias.
Other potential sources of bias
We rated eight studies as having high risk of other bias because they reported a baseline imbalance in the primary outcome of a PTSD diagnosis, post‐trauma symptoms or exposure to trauma. The baseline diagnosis of PTSD in the usual care group was twice as high as in the intervention group (61% versus 30%) in Shirk 2014, and was 53% higher in Stallard 2006 (35.5% versus 23.2%). Baseline symptom scores were significantly higher in the wait list group in Kemp 2010 (34.6 versus 22.3) and 10% higher in Betancourt 2014. Wait list participants in Tol 2008 were twice as likely to be displaced (75%) compared with those in the intervention group (37%). More participants in the intervention group had a baseline diagnosis of PTSD in Farkas 2010 (37% versus 19%) and clinically significant symptoms in Qouta 2012 (64% versus 43%). Baseline PTSD symptoms were also higher in the treatment group in both Farkas 2010 (6.4 versus 3.7) and Qouta 2012 (32.8 versus 27.8). Participants who had undergone sexual abuse accounted for 19% of those in the intervention group compared with only 4% in the wait list group in Pace 2013, and neglect was 52.0% in the wait list group and 29.6% in the intervention group.
We considered three studies to have unclear risk of other potential bias because they were less likely to have a direct effect on primary outcomes. Participants in the intervention group in Taussig 2010 were more likely to have undergone physical abuse and maternal neglect and to have a mother with a criminal history, although their scores for IQ, coping and social support were higher. Baseline conduct scores were approximately 17% higher in the intervention group in O'Callaghan 2014. In Shirk 2014, therapists in the intervention group had a total of 38 years of clinical experience compared with seven years among those in the usual care group, and intervention therapists received 'more targeted and frequent' case supervision. Raider 2008 referred to five participants who dropped out in the early sessions of group therapy but did not appear to be included among the 23 randomised participants. In Glodich 2000, data from a student who joined the treatment group after randomisation were included. Church 2012 and Damra 2014 were also considered to have unclear risk of additional bias because potential differences between groups were not investigated.
We considered all other trials to have low risk because no other bias was apparent.
Effects of interventions
See: Summary of findings for the main comparison Psychological therapies versus wait list, treatment as usual or no treatment for children and adolescents exposed to trauma (short‐term); Summary of findings 2 CBT versus other psychological therapies for children and adolescents exposed to trauma (short‐term)
Outcomes collected over these trials included diagnosis of PTSD, PTSD symptoms (total scores and subscores for arousal, avoidance and intrusion), anxiety (total, state and trait), depression, behaviour (total, internalising and externalising), function, quality of life, cost and loss to follow‐up.
Comparison 1. All psychological therapies versus controls
Primary outcomes
1. Diagnosis of PTSD
Across all trials that compared a psychological therapy versus a control, a significantly smaller proportion of children and adolescents who received therapy interventions had been diagnosed with PTSD at the end of the study in the short term (odds ratio (OR) 0.51, 95% confidence interval (CI) 0.34 to 0.77; 874 participants; five studies; I2 = 22%; number needed to treat for an additional beneficial outcome (NNTB) 9, 95% CI 6 to 20; Analysis 1.1), but not in the medium (OR 0.66, 95% CI 0.26 to 1.69; 742 participants; four studies; I2 = 70%; Analysis 2.1) or long term (OR 0.56, 95% CI 0.09 to 3.62; 64 participants; one study; Analysis 3.1).
2. PTSD symptoms
Scores for PTSD symptoms were significantly lower in the psychological therapy group in the short term (standardised mean difference (SMD) ‐0.42, 95% CI ‐0.61 to ‐0.24; 2051 participants; 17 studies; high heterogeneity at I2 = 71%; Analysis 1.2) than in the medium (SMD ‐0.17, 95% CI ‐0.38 to 0.05; 2337 participants; 13 studies; I2 = 83%; Analysis 2.2) or long term (SMD 0.17, 95% CI ‐0.28 to 0.62; 141 participants; two studies; I2 = 44%; Analysis 3.2). Church 2012 and Damra 2014 also reported significant improvement in overall trauma symptoms, but because these differences were approximately 20 times greater than in the other included studies, data were included in the meta‐analysis but did not contribute to the overall estimate.
Investigators reported no differences between psychological therapy and control for any of the PTSD domains of avoidance, hyperarousal and intrusion in the short (Analysis 1.3; Analysis 1.4; Analysis 1.5) or medium term (Analysis 2.3; Analysis 2.4; Analysis 2.5). Long‐term PTSD domain data were not reported.
Secondary outcomes
3. Anxiety
Scores for anxiety symptoms were not significantly different in the psychological therapy groups compared with the control groups in the short term (SMD ‐0.13, 95% CI ‐0.26 to 0.00; 959 participants; seven studies; I2 = 3%; Analysis 1.6), medium term (SMD ‐0.10, 95% CI ‐0.20 to 0.00; 1470 participants; seven studies; I2 = 0%; Analysis 2.6) or long term (SMD ‐0.12, 95% CI ‐0.41 to 0.18; 176 participants; two studies; I2 = 0%; Analysis 3.3). State anxiety was significantly less in the therapy groups in the short (SMD ‐0.64, 95% CI ‐1.12 to ‐0.16; 70 participants; two studies; I2 = 0%; Analysis 1.7) and medium term (SMD ‐0.71, 95% CI ‐1.31 to ‐0.12; 46 participants; one study; Analysis 2.7). Trait anxiety was not different in the short term (Analysis 1.8) but was significantly less in the medium term (SMD ‐0.45, 95% CI ‐0.85 to ‐0.05; 101 participants; two studies; I2 = 0%; Analysis 2.8). State anxiety and trait anxiety were not reported in the long term.
4. Depression
Scores for depression symptoms were not significantly lower in the psychological therapy group in the short term (SMD ‐0.13, 95% CI ‐0.30 to 0.04; 1569 participants; 13 studies; I2 = 52%; Analysis 1.9), medium term (SMD ‐0.07, 95% CI ‐0.22 to 0.07; 2191 participants; 13 studies; I2 = 55%; Analysis 2.9) or long term (SMD ‐0.12, 95% CI ‐0.41 to 0.18; 176 participants; two studies; I2 = 0%; Analysis 3.4).
5. Behaviour
Total behaviour scores were not significantly lower in the psychological therapy group in the short (SMD ‐0.04, 95% CI ‐0.51 to 0.42; 166 participants; three studies; I2 = 51%; Analysis 1.10), medium (SMD ‐0.20, 95% CI ‐0.43 to 0.04; 281 participants; three studies; I2 = 0%; Analysis 2.10) or long term (SMD 0.39, 95% CI ‐0.07 to 0.85; 77 participants; one study; Analysis 3.5).
Scores for internalising behaviour were not different in the short (SMD ‐0.04, 95% CI ‐0.20 to 0.13; 719 participants; 10 studies; I2 = 16%; Analysis 1.11), medium (SMD 0.01, 95% CI ‐0.25 to 0.28; 291 participants; four studies; I2 = 16%; Analysis 2.11) or long term (SMD 0.04, 95% CI ‐0.51 to 0.59; 141 participants; two studies; I2 = 63%; Analysis 3.6). Researchers reported no differences between groups in externalising behaviour in the short (SMD ‐0.10, 95% CI ‐0.33 to 0.14; 1174 participants; 12 studies; I2 = 68%; Analysis 1.12), medium (SMD ‐0.11, 95% CI ‐0.38 to 0.17; 206 participants; two studies; I2 = 0%; Analysis 2.12) or long term (SMD 0.28, 95% CI ‐0.05 to 0.60; 298 participants; three studies; I2 = 46%; Analysis 3.7).
6. Functional impairment
Function was significantly improved in the group receiving psychological therapy in the short (SMD ‐0.41, 95% CI ‐0.59 to ‐0.24; 557 participants; two studies; I2 = 0%; Analysis 1.13) and medium term (SMD ‐0.46, 95% CI ‐0.88 to ‐0.05; three studies; I2 = 88%; Analysis 2.13). No study reported long‐term function scores.
7. Quality of life
Investigators reported no differences between groups in quality of life measures in the short (SMD 0.03, 95% CI ‐0.30 to 0.36; 144 participants; one study; Analysis 1.14) and medium term (SMD 0.13, 95% CI ‐0.19 to 0.46; 144 participants; one study; Analysis 2.14). Long‐term quality of life was not reported.
8. Adverse events
Researchers provided no adverse events data.
9. Cost
Researchers provided no cost data.
10. Loss to follow‐up
Among all trials that compared a psychological therapy versus a control, investigators reported no differences in the proportions of children and adolescents lost to follow‐up in the short term (risk ratio (RR) 0.98, 95% CI 0.69 to 1.39; 3872 participants; 26 studies; I2 = 59%; Analysis 1.15), medium term (OR 1.00, 95% CI 0.82 to 1.21; 3663 participants; 20 studies; I2 = 71%; Analysis 2.15) or long term (SMD 0.28, 95% CI ‐0.05 to 0.60; 298 participants; three studies; I2 = 46%; Analysis 3.7).
Subgroup analyses of psychological therapies
Primary outcomes
Diagnosis of PTSD
We noted no significant differences between the therapy subgroups of CBT, EMDR and family therapy in PTSD diagnosis in the short (Analysis 1.1), medium (Analysis 2.1) or long term (Analysis 3.1).
PTSD symptoms
In the short term, we observed significant differences between therapy subgroups in effects on symptoms of PTSD (P value < 0.0001; Analysis 1.2). With CBT (SMD ‐0.37, 95% CI ‐0.55 to ‐0.19; 1329 participants; seven studies; I2 = 55%), family therapy (SMD ‐0.53, 95% CI ‐0.94 to ‐0.12; 95 participants; two studies; I2 = 0%) and CBT plus narrative therapy (SMD ‐1.96, 95% CI ‐2.63 to ‐1.29; 52 participants; one study), all symptom scores were improved compared with control, and we noted no differences in scores when EMDR, psychoeducation and narrative, supportive and exposure therapies were compared with controls. We found no differences between therapy subgroups in the medium term (Analysis 2.2) and observed that none of the therapies (CBT, debriefing, family therapy, narrative therapy, psychoeducation and supportive therapy) were significantly different from controls. We observed no differences between the two single trials that compared exposure therapy versus control and narrative therapy versus control in the long term (Analysis 2.3), and no subgroup differences for any of the PTSD domains of avoidance (Analysis 1.3; Analysis 2.3), hyperarousal (Analysis 1.4; Analysis 2.4) and intrusion (Analysis 1.5; Analysis 2.5) in the short or medium term; we found no long‐term data.
Secondary outcomes
Anxiety
We found no significant differences between therapy groups when comparing anxiety scores with those of a control group in the short (Analysis 1.6), medium (Analysis 2.6) or long term (Analysis 3.3), nor did we note differences between therapy groups in state (Analysis 1.7; Analysis 2.7) or trait anxiety (Analysis 1.8; Analysis 2.8), which was reported in the short and medium term.
Depression
We found no significant differences between therapy subgroups for the outcome of depression in the short (Analysis 1.9), medium (Analysis 2.9) or long term (Analysis 3.4).
Behaviour
Although we noted no differences between therapy subgroups for total (Analysis 1.10; Analysis 2.10) or internalising behaviour (Analysis 1.11; Analysis 2.11; Analysis 3.6) scores, we observed a significant difference for externalising behaviour scores in the short term (P value = 0.004; Analysis 1.12). Externalising behaviours were significantly greater in the therapy groups in the single trials that compared exposure therapy versus control (SMD 0.49, 95% CI 0.03 to 0.95; 77 participants; Analysis 1.12) and fewer in the trial that compared CBT plus narrative therapy versus control (SMD ‐1.06, 95% CI ‐1.64 to ‐0.47; 52 participants; Analysis 1.12).
Function
Function was reported only in trials that compared CBT versus control in the short (Analysis 1.13) and medium term (Analysis 2.13).
Quality of life
Only one trial of supportive therapy compared with control reported quality of life in the short (Analysis 1.14) and medium term (Analysis 2.14).
Adverse events
No data were reported.
Cost
No data were reported.
Loss to follow‐up
We found no differences between therapy subgroups in loss to follow‐up in the short (Analysis 1.15), medium (Analysis 2.15) or long term (Analysis 3.8).
Comparison 2. Psychological therapies versus other psychological therapies
We were able to compare CBT with other pooled therapies for the primary outcomes only. We report these results below; thereafter, we report the results subgrouped by comparator.
CBT versus other psychological therapies
Primary outcomes
1. Diagnosis of PTSD
CBT was found to be no more or less effective than EMDR and supportive therapy in reducing diagnosis of PTSD in the short term (OR 0.74, 95% CI 0.29 to 1.91; 2 studies, 160 participants; Analysis 4.1). The quality of the evidence was very low.
2. PTSD symptoms
For reduction of PTSD symptoms in the short term, there was a small effect favouring CBT over EMDR, play therapy and supportive therapies (SMD ‐0.24, 95% CI ‐0.42 to ‐0.05, 7 studies, 466 participants; Analysis 4.2). The quality of the evidence was moderate.
CBT versus EMDR
One study compared CBT versus EMDR, and all reported outcomes were short term.
Primary outcomes
1. Diagnosis of PTSD
No data were reported.
2. PTSD symptoms
Scores for PTSD symptoms were not significantly different when CBT was compared with EMDR (SMD 0.06, 95% CI ‐0.44 to 0.56; 62 participants; two studies; I2 = 0%; Analysis 4.2).
Secondary outcomes
3. Anxiety
No data were reported.
4. Depression
No data were reported.
5. Behaviour
Total behaviour scores were not significantly different between groups (SMD ‐0.44, 95% CI ‐1.50 to 0.63; 14 participants; one study; Analysis 4.8).
6. Function
No data were reported.
7. Quality of life
No data were reported.
8. Adverse events
No data were reported.
9. Cost
No data were reported.
10. Loss to follow‐up
We observed no differences in loss to follow‐up at the end of the study (OR 0.76, 95% CI 0.23 to 2.52; 64 participants; two studies; I2 = 0%; Analysis 4.12).
CBT versus psychodynamic therapy
The one study that compared CBT versus psychodynamic therapy reported only short‐term outcomes.
Primary outcomes
1. Diagnosis of PTSD
No data were reported.
2. PTSD symptoms
PTSD symptom scores were not significantly different between groups (SMD 0.21, 95% CI ‐0.56 to 0.98; 26 participants; Analysis 5.1).
Secondary outcomes
3. Anxiety
No data were reported.
4. Depression
No data were reported.
5. Behaviour
No data were reported.
6. Function
No data were reported.
7. Quality of life
No data were reported.
8. Adverse events
No data were reported.
9. Cost
No data were reported.
10. Loss to follow‐up
We noted no differences in the proportions of children and adolescents lost to follow‐up at the end of the study (OR 0.08, 95% CI 0.00 to 1.56; 31 participants; Analysis 4.12).
CBT versus supportive therapy
Four trials compared CBT versus supportive therapy.
Primary outcomes
1. Diagnosis of PTSD
We found no differences in the proportions of children and adolescents diagnosed with PTSD in the short term (OR 0.71, 95% CI 0.26 to 1.95; 124 participants; one study; Analysis 4.1) when CBT was compared with supportive therapy. The diagnosis of PTSD was not reported in the medium or long term.
2. PTSD symptoms
Scores for PTSD symptoms were significantly lower in the CBT group in the short term (SMD ‐0.32, 95% CI ‐0.53 to ‐0.12; 378 participants; four studies; I2 = 0%; Analysis 4.2) but not in the medium term (SMD ‐0.16, 95% CI ‐0.43 to 0.11; 223 participants; two studies; I2 = 0%; Analysis 5.1).
Short‐term scores for PTSD avoidance (SMD ‐0.40, 95% CI ‐0.76 to ‐0.05; 124 participants; Analysis 4.3) and hyperarousal (SMD ‐0.52, 95% CI ‐0.87 to ‐0.16; 124 participants; Analysis 4.4) were also significantly lower in the CBT group, although we found no differences in intrusion (Analysis 4.5).
Secondary outcomes
3. Anxiety
Anxiety symptoms were significantly lower in the CBT group in the short (SMD ‐0.48, 95% CI ‐0.74 to ‐0.22; 230 participants; two studies; I2 = 0%) but not the medium term (Analysis 4.6).
4. Depression
We found no differences in depression symptoms in the short or medium term (Analysis 4.7).
5. Behaviour
We noted no differences between CBT and supportive therapy groups in total behaviour scores (Analysis 4.8) nor in scores for internalising (Analysis 4.9) or externalising behaviour (Analysis 4.10) at any interval.
6. Function
Function was reported by only one trial in the short term. We found no differences between groups (Analysis 4.11).
7. Quality of life
No data were reported.
8. Adverse events
No data were reported.
9. Cost
No data were reported.
10. Loss to follow‐up
We noted no differences between trials that compared CBT versus supportive therapy in short‐, medium‐ or long‐term loss to follow‐up (Analysis 4.12).
Comparison 3. Psychological therapies versus pharmacological therapies
We identified no trials that compared psychological therapies versus pharmacological therapies.
Subgroup analyses
Group versus individual therapy
Three trials compared delivery of psychological therapies in group and individual modes.
No data were reported for diagnosis of PTSD.
Total PTSD symptom scores were not different when group therapy was compared with individual therapy (Analysis 7.1). These scores were reported in the short term only.
Child versus child and parent therapy
Deblinger 1996 reported data for CBT therapy for children only and data for CBT for children and mothers.
No data were reported for diagnosis of PTSD.
We did not find any difference in symptoms of PTSD when CBT for children was compared to CBT for children and mothers (Analysis 8.1).
Type of trauma
We compared types of trauma including sexual abuse, maltreatment, physical trauma, life‐threatening illness, domestic violence, community violence and war and natural disaster in subgroup analyses.
Effects of psychological therapies on PTSD diagnosis were significantly different when participants exposed to different types of trauma were compared (P value = 0.007; Analysis 9.1). Intervention effects were significantly better compared with those of controls in children and adolescents exposed to community violence (OR 0.59, 95% CI 0.43 to 0.80; 769 participants; three studies; I2 = 0%), interpersonal violence (OR 0.11, 95% CI 0.02 to 0.56; 65 participants; one study) and natural disaster (OR 0.16, 95% CI 0.06 to 0.45; 166 participants; one study), but not in participants who had undergone physical trauma.
Effects on PTSD symptom scores were also significantly different between subgroups who had undergone different types of trauma (P value < 0.00001; Analysis 9.2). Scores were significantly improved for children and adolescents who had undergone sexual abuse (SMD ‐0.67, 95% CI ‐1.18 to ‐0.16; 76 participants; two studies; I2 = 16%) or were exposed to interpersonal violence (SMD ‐0.61, 95% CI ‐1.11 to ‐0.11; 65 participants; one study), natural disaster (SMD ‐1.27, 95% CI ‐1.60 to ‐0.94; 166 participants; one study) or community violence (SMD ‐0.24, 95% CI ‐0.41 to ‐0.06; 2170 participants; eight studies; I2 = 73%), although the latter subgroup was highly heterogeneous (I2 = 73%). We noted no differences between therapy and control groups among children and adolescents who had been maltreated or had undergone physical trauma or life‐threatening illness.
Types of control
We performed a subgroup analysis of active controls (e.g. treatment as usual, which included elements of psychological therapy, or psychological therapy as control, which is used in combination with another therapy in the intervention group) versus an inactive control (e.g. no treatment, wait list, craft group). We found no differences for diagnosis of PTSD (Analysis 11.1) or PTSD symptom scores (Analysis 11.2) when comparing active and inactive control subgroups.
Symptomatic inclusion criteria
We compared studies that included symptoms of PTSD or anxiety as well as exposure to trauma as the inclusion criteria versus studies in which symptoms were not part of the inclusion criteria. We found no significant differences between these subgroups for outcomes of PTSD diagnosis (Analysis 10.1) or symptoms (Analysis 10.2).
Sensitivity analyses
We performed all sensitivity analyses for the primary outcomes of a diagnosis of PTSD and symptoms of PTSD when a psychological therapy was compared with control.
Best‐case/Worst‐case analysis
We found no significant differences between best‐case and worst‐case analyses (Analysis 12.1).
Selection bias
For the outcome of PTSD diagnosis, we found no significant differences between the four trials rated as having low risk of selection bias compared with the single trials rated as having unclear and high risk of bias (Analysis 17.1). We noted no differences between low and unclear risk trials for PTSD symptoms (Analysis 17.2). We rated no trials reporting PTSD symptoms as having high risk of selection bias.
Performance bias
We found no significant differences in the diagnosis of PTSD when we compared the one trial rated as having unclear risk of performance bias versus the five trials rated as having high risk (Analysis 14.1). However, we noted significant differences between subgroups for symptoms of PTSD (one trial with unclear risk versus 17 trials with high risk; P value = 0.02; Analysis 14.2). We rated no trials as having low risk of performance bias.
Detection bias
We found no significant differences between trials rated as having low, unclear or high risk of detection bias for the diagnosis of PTSD (Analysis 15.1) or for symptoms of PTSD (Analysis 15.2).
Attrition bias
We noted significant differences between trials rated as having low, unclear and high risk of attrition bias for the diagnosis of PTSD (Analysis 16.1); however, both low‐ and high‐risk studies resulted in a significant reduction in the diagnosis or PTSD. We found no differences between studies rated as having low, unclear or high risk of attrition bias for symptoms of PTSD (Analysis 16.2).
Cluster‐randomised versus individually randomised trials
We found no significant differences between cluster‐randomised and individually randomised trials for the outcomes of PTSD diagnosis (Analysis 13.1) and symptoms (Analysis 13.2).
Assessment of reporting bias
We created a funnel plot for the primary outcome of PTSD symptoms using data provided by the 15 trials reporting these data in the short term (Figure 4). We noted no asymmetry in the funnel plot.
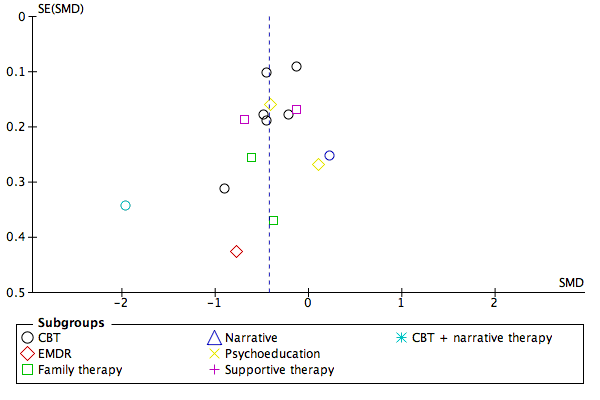
Funnel plot of comparison: 1 All psychotherapies versus control (short‐term), outcome: 1.2 PTSD total symptoms.
Discussion
Summary of main results
The likelihood of being diagnosed with post‐traumatic stress disorder (PTSD) and PTSD symptoms were significantly reduced in children and adolescents who received a psychological therapy compared to those who received treatment as usual, no treatment, or were on a wait list for up to a month following treatment. The GRADE quality of evidence for PTSD symptoms was rated low because participants probably were aware of whether they received the intervention and because high levels of heterogeneity between studies (see summary of findings Table for the main comparison). The evidence for diagnosis of PTSD was further limited by small study and participant numbers and therefore rated as very low (see summary of findings Table for the main comparison). The effects of psychological therapies were not apparent over the longer term.
Cognitive‐behavioural therapy (CBT) was found to be no more or less effective than eye movement desensitisation and reprocessing (EMDR) and supportive therapy in reducing diagnosis of PTSD in the short term, although there was evidence favouring CBT over EMDR, play therapy and supportive therapies in reducing symptoms of PTSD for up to a month after treatment. The GRADE quality of evidence for the role of CBT in preventing PTSD diagnosis was rated very low because of lack of blinding and small sample and study numbers. Evidence for the greater effectiveness of CBT in decreasing symptoms of PTSD was rated moderate quality (see summary of findings Table 2).
We did not identify any studies that compared pharmacological therapies to psychological therapies.
Overall completeness and applicability of evidence
Evidence indicates that psychological therapies were effective in preventing the development of PTSD and related symptoms across a range of psychotherapeutic approaches in the short term. Although evidence for the effectiveness of CBT was better, apparent lack of effect with other therapies may be due to lack of data.
Significant benefit from psychological therapies was evident only for up to one month following completion of treatment. Data were insufficient to permit conclusions about the effects of psychological therapies lasting longer than a month after therapy. However, lack of long‐term effects may be due in part to the small number of studies reporting data past one month and the lower rates of follow‐up for those that did so.
Difficulty is associated with conclusions about the applicability of evidence across different types of trauma, as significant differences between trials of children and adolescents with different types of trauma were reported, and generally only one study reported results for each type of trauma.
Although we noted differences in inclusion criteria in that some studies specifically included symptoms (although not a full diagnosis) of PTSD, we found no apparent differences in findings between these studies and those that did not require a predefined level of symptoms as part of the inclusion criteria.
We had intended to include only studies of children and adolescents who had been exposed to trauma within the previous year; however, time since trauma was not an inclusion criterion for any included study, and time since trauma was rarely reported. Therefore, time since trauma may also account for heterogeneity across studies.
Although evidence suggests that psychological therapies were effective in preventing the onset of PTSD and PTSD symptoms in the short term, the quality of studies comparing psychological therapies versus control was relatively low. Few studies compared psychological therapies versus other psychological therapies, and none compared psychological therapies versus pharmacological therapies or other treatments.
Quality of the evidence
Overall, risk of allocation, detection and attrition bias in included trials was unclear because inadequate details were provided by study authors to permit a judgement. Most trials were considered to have high risk of performance bias, and most were considered to have low risk of reporting bias. Marked heterogeneity was evident in several analyses. We conducted several exploratory analyses to identify sources of heterogeneity and noted differences between types of therapy and types of trauma; additional data are needed before conclusions can be drawn about the effectiveness of different therapies and the types of trauma for which they are effective. We identified no differences between trials that used active and inactive controls, but the inactive control subgroup itself was highly heterogeneous. Although we found significant differences between trials rated as having low and unclear risk of selection bias, we noted only one trial determined to have low risk and none determined to have high risk. Performance bias due to the predominance of child‐ or parent‐rated measures may have resulted in an overestimation of effects, but these findings are based on limited data. Although we found differences between risk categories in bias due to attrition, we did not note this effect with symptoms of PTSD. We found no evidence of publication bias when preparing this review. When effects of psychological therapies were apparent, GRADE ratings of the quality of evidence were very low to moderate as the result of study limitations of non‐blinded outcome measurement, lack of consistency across studies in effect size and imprecision due to small numbers of included studies and relatively small sample sizes.
Potential biases in the review process
Data generated from these included trials had some limitations. Most trials were very small, often including fewer than 100 participants and in some cases fewer than 20. Therefore, negative findings with many of these analyses may well be due to lack of power. In addition, most trials reported only short‐term outcomes. Another limitation was that large portions of the continuous data reported in these trials were skewed, and this limited the useability of data.
We used a large range of tools to measure continuous outcomes in this review (more than 20 for PTSD), making integration and interpretation of data difficult. As in the narrative review by Forman‐Hoffman 2013 of interventions for children exposed to non‐relational traumatic events, trials did not replicate interventions, short‐term interventions were reported and most were self reported outcomes.
Agreements and disagreements with other studies or reviews
Findings of this review are in line with those of Cochrane reviews that found good evidence for the effectiveness of CBT in the treatment of adults with PTSD (Bisson 2013) and acute traumatic stress symptoms (Roberts 2010) and in the prevention of adverse consequences of child sexual abuse (MacDonald 2012). In addition, a systematic review by Leenarts 2013 concluded that CBT yielded the best evidence of effectiveness among psychological therapies for children who had been maltreated, and Kramer 2011 concluded from a meta‐analysis of psychological interventions within one month following trauma that interventions should include psychoeducation, coping skills and exposure.
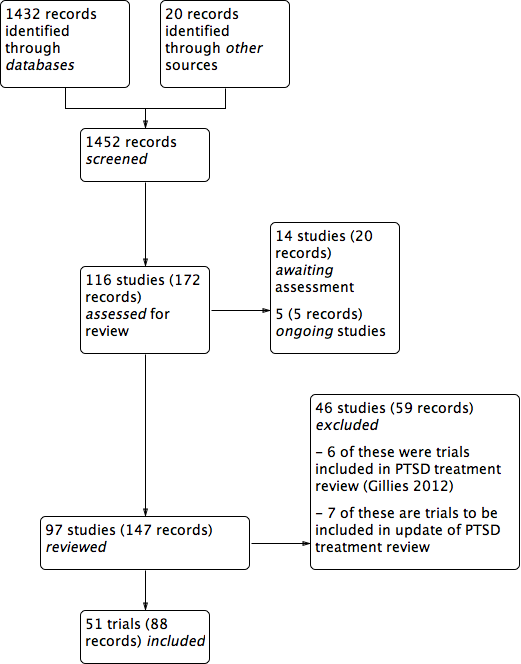
PRISMA study flow diagram.
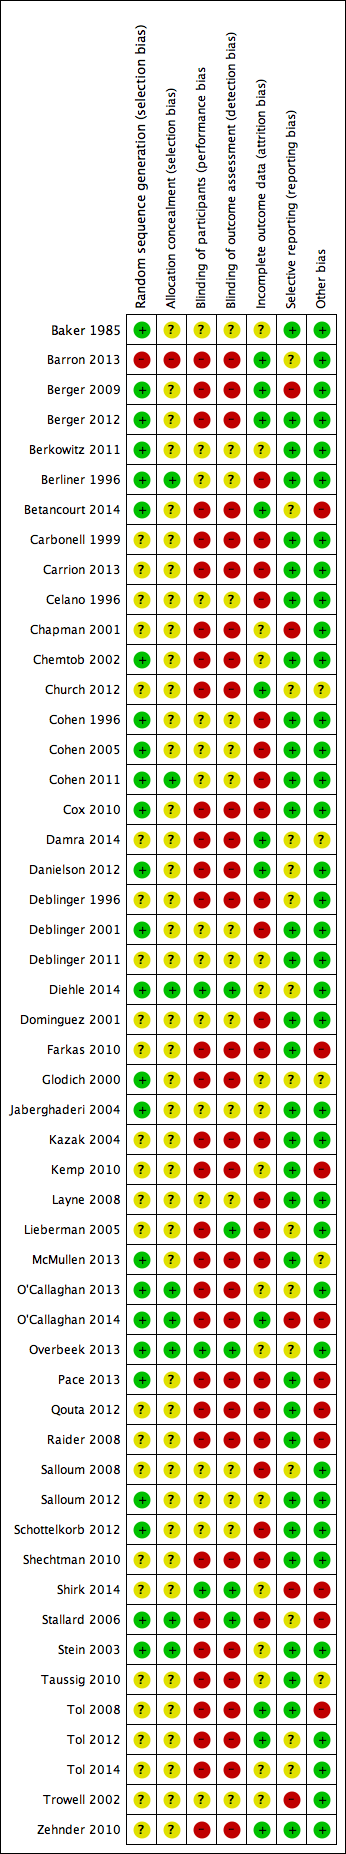
Risk of bias summary: review authors' judgements about each risk of bias item for each included study.
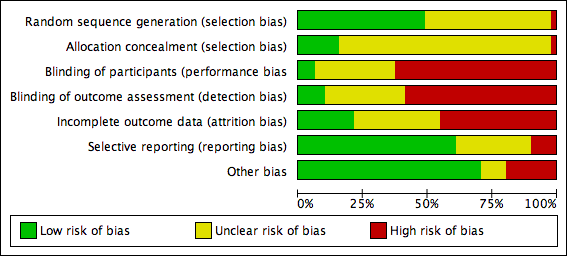
Risk of bias graph: review authors' judgements about each risk of bias item presented as percentages across all included studies.

Funnel plot of comparison: 1 All psychotherapies versus control (short‐term), outcome: 1.2 PTSD total symptoms.

Comparison 1 All psychotherapies versus control (short‐term), Outcome 1 PTSD diagnosis.

Comparison 1 All psychotherapies versus control (short‐term), Outcome 2 PTSD total symptoms.

Comparison 1 All psychotherapies versus control (short‐term), Outcome 3 PTSD avoidance.

Comparison 1 All psychotherapies versus control (short‐term), Outcome 4 PTSD hyperarousal.

Comparison 1 All psychotherapies versus control (short‐term), Outcome 5 PTSD intrusion.

Comparison 1 All psychotherapies versus control (short‐term), Outcome 6 Anxiety total symptoms.
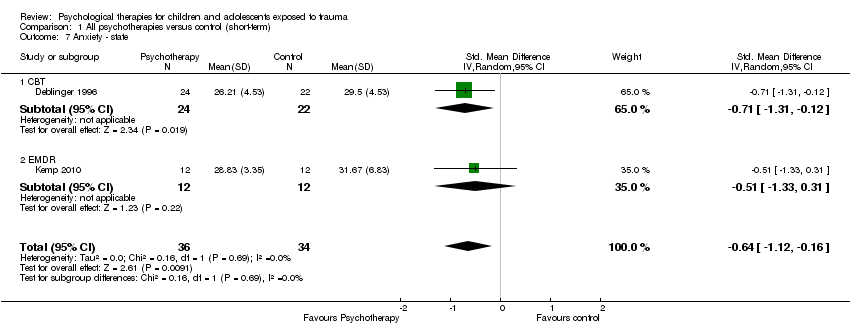
Comparison 1 All psychotherapies versus control (short‐term), Outcome 7 Anxiety ‐ state.

Comparison 1 All psychotherapies versus control (short‐term), Outcome 8 Anxiety ‐ trait.
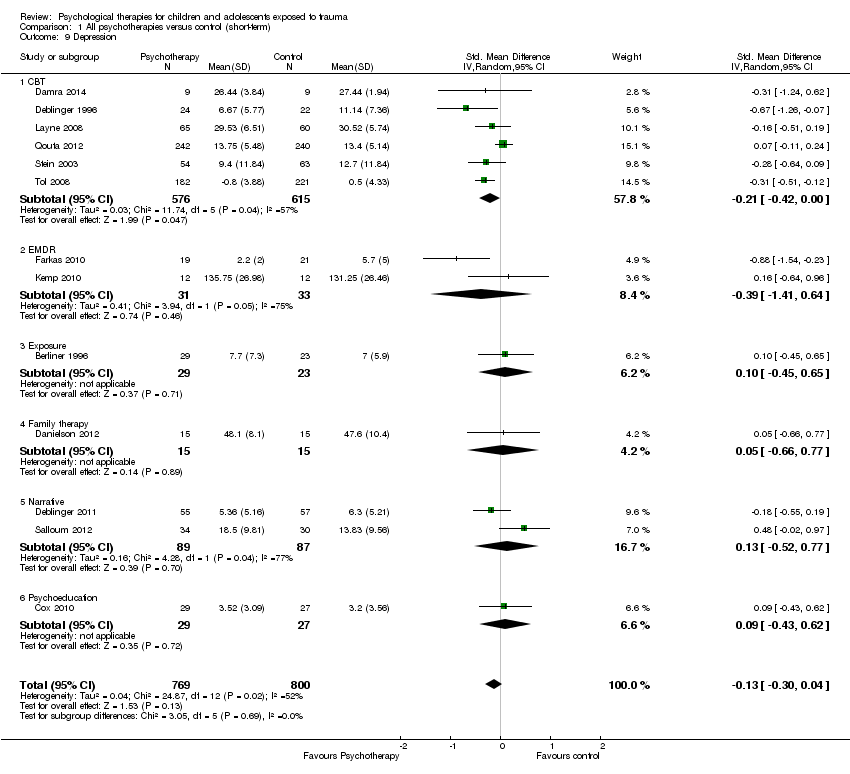
Comparison 1 All psychotherapies versus control (short‐term), Outcome 9 Depression.

Comparison 1 All psychotherapies versus control (short‐term), Outcome 10 Behaviour ‐ total.

Comparison 1 All psychotherapies versus control (short‐term), Outcome 11 Behaviour ‐ internalising.

Comparison 1 All psychotherapies versus control (short‐term), Outcome 12 Behaviour ‐ externalising.
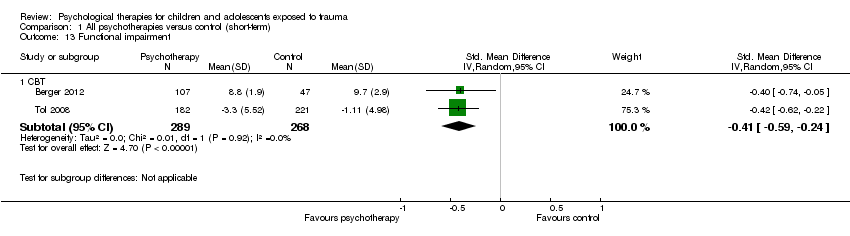
Comparison 1 All psychotherapies versus control (short‐term), Outcome 13 Functional impairment.

Comparison 1 All psychotherapies versus control (short‐term), Outcome 14 Quality of life.
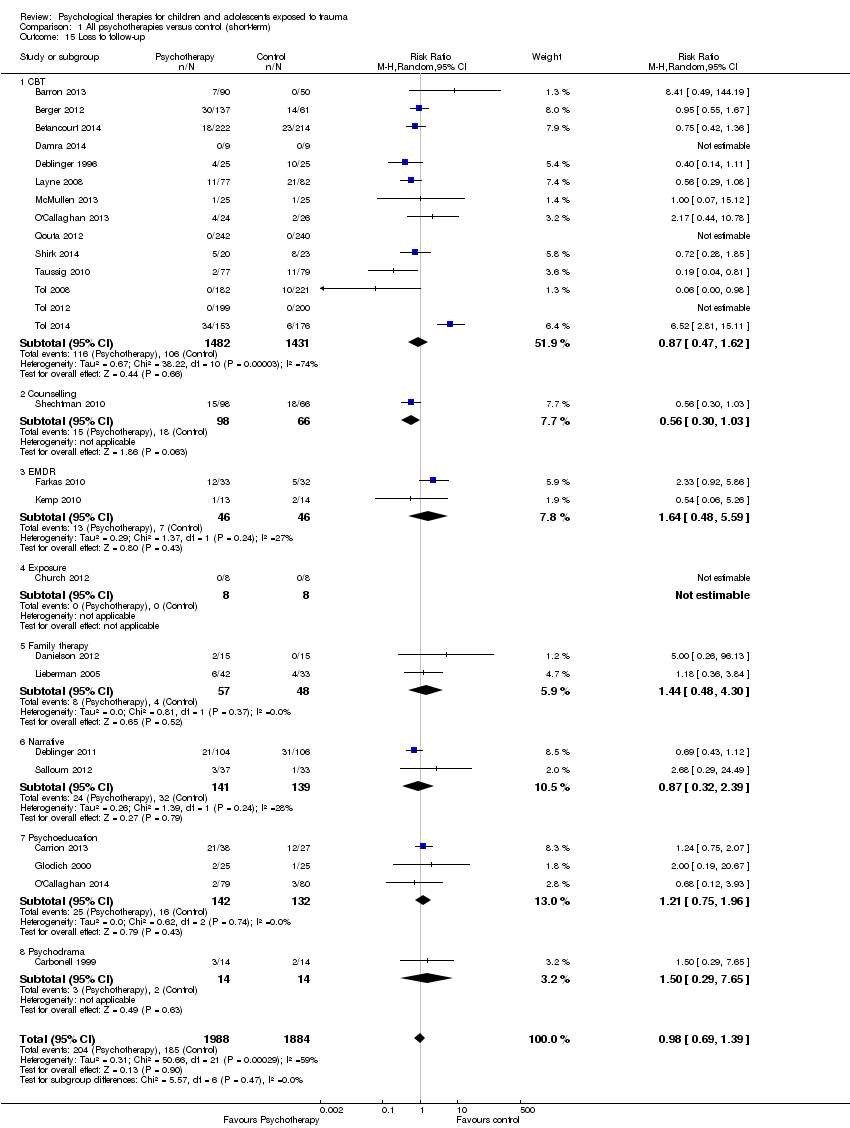
Comparison 1 All psychotherapies versus control (short‐term), Outcome 15 Loss to follow‐up.

Comparison 2 All psychotherapies versus control (medium‐term), Outcome 1 PTSD diagnosis.

Comparison 2 All psychotherapies versus control (medium‐term), Outcome 2 PTSD total symptoms.

Comparison 2 All psychotherapies versus control (medium‐term), Outcome 3 PTSD ‐ avoidance.

Comparison 2 All psychotherapies versus control (medium‐term), Outcome 4 PTSD ‐ hyperarousal.
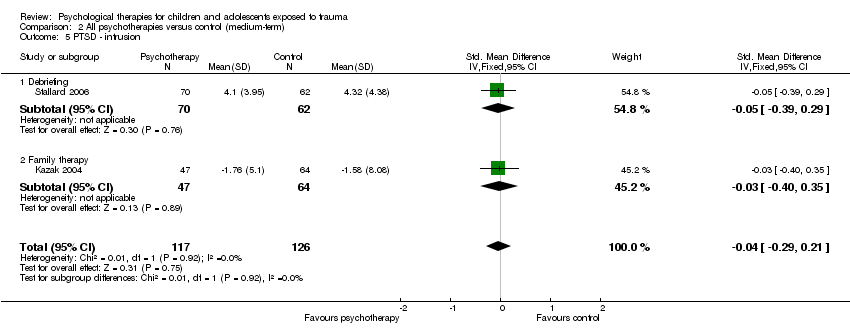
Comparison 2 All psychotherapies versus control (medium‐term), Outcome 5 PTSD ‐ intrusion.

Comparison 2 All psychotherapies versus control (medium‐term), Outcome 6 Anxiety total symptoms.

Comparison 2 All psychotherapies versus control (medium‐term), Outcome 7 Anxiety ‐ state.

Comparison 2 All psychotherapies versus control (medium‐term), Outcome 8 Anxiety ‐ trait.

Comparison 2 All psychotherapies versus control (medium‐term), Outcome 9 Depression.

Comparison 2 All psychotherapies versus control (medium‐term), Outcome 10 Behaviour ‐ total.
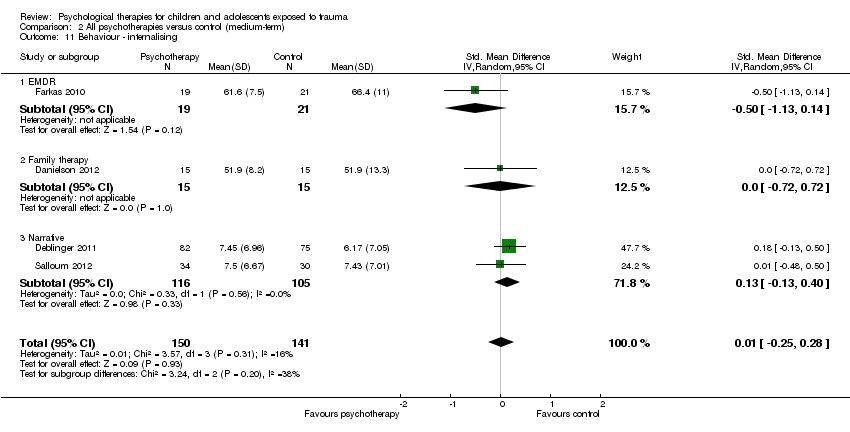
Comparison 2 All psychotherapies versus control (medium‐term), Outcome 11 Behaviour ‐ internalising.

Comparison 2 All psychotherapies versus control (medium‐term), Outcome 12 Behaviour ‐ externalising.

Comparison 2 All psychotherapies versus control (medium‐term), Outcome 13 Function.

Comparison 2 All psychotherapies versus control (medium‐term), Outcome 14 Quality of life.

Comparison 2 All psychotherapies versus control (medium‐term), Outcome 15 Loss to follow‐up.

Comparison 3 All psychotherapies versus control (long‐term), Outcome 1 PTSD diagnosis.

Comparison 3 All psychotherapies versus control (long‐term), Outcome 2 PTSD total symptoms.

Comparison 3 All psychotherapies versus control (long‐term), Outcome 3 Anxiety.

Comparison 3 All psychotherapies versus control (long‐term), Outcome 4 Depression.

Comparison 3 All psychotherapies versus control (long‐term), Outcome 5 Behaviour ‐ total.

Comparison 3 All psychotherapies versus control (long‐term), Outcome 6 Behaviour ‐ internalising.
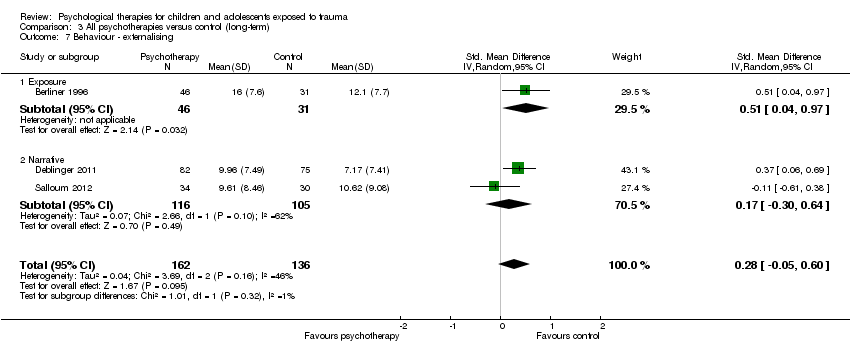
Comparison 3 All psychotherapies versus control (long‐term), Outcome 7 Behaviour ‐ externalising.
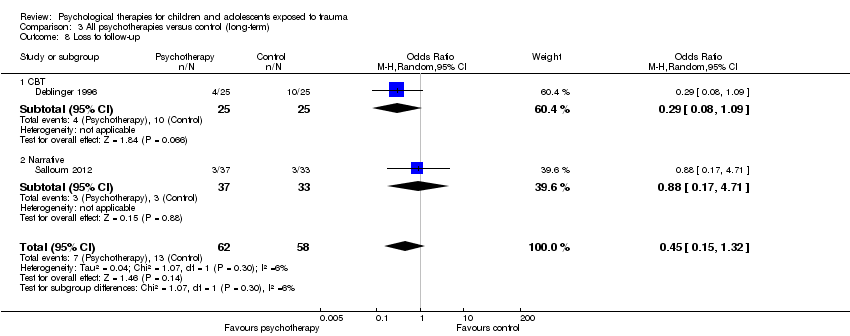
Comparison 3 All psychotherapies versus control (long‐term), Outcome 8 Loss to follow‐up.
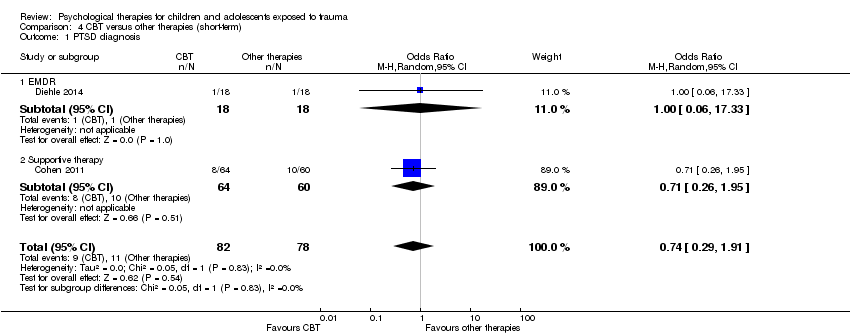
Comparison 4 CBT versus other therapies (short‐term), Outcome 1 PTSD diagnosis.
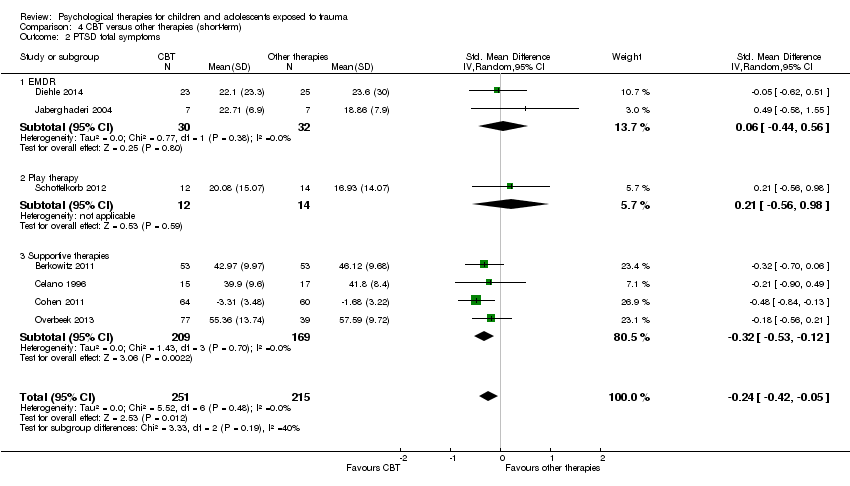
Comparison 4 CBT versus other therapies (short‐term), Outcome 2 PTSD total symptoms.

Comparison 4 CBT versus other therapies (short‐term), Outcome 3 PTSD avoidance.

Comparison 4 CBT versus other therapies (short‐term), Outcome 4 PTSD hyperarousal.
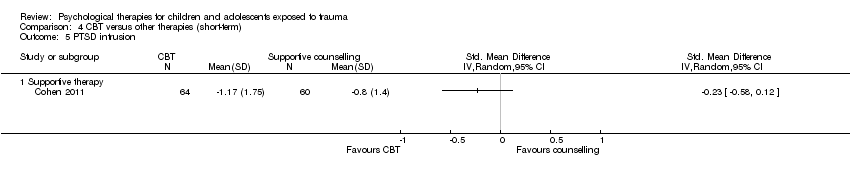
Comparison 4 CBT versus other therapies (short‐term), Outcome 5 PTSD intrusion.

Comparison 4 CBT versus other therapies (short‐term), Outcome 6 Anxiety total symptoms.

Comparison 4 CBT versus other therapies (short‐term), Outcome 7 Depression.

Comparison 4 CBT versus other therapies (short‐term), Outcome 8 Behaviour ‐ total.
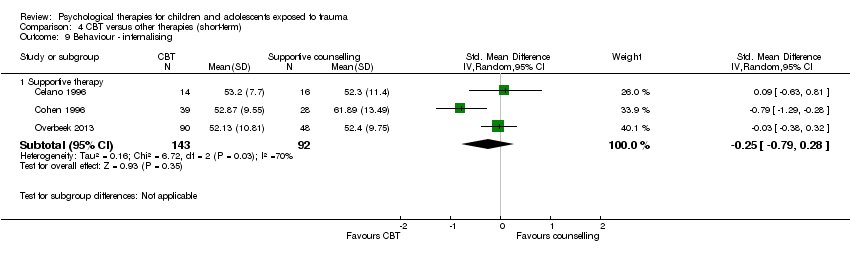
Comparison 4 CBT versus other therapies (short‐term), Outcome 9 Behaviour ‐ internalising.

Comparison 4 CBT versus other therapies (short‐term), Outcome 10 Behaviour ‐ externalising.

Comparison 4 CBT versus other therapies (short‐term), Outcome 11 Function.

Comparison 4 CBT versus other therapies (short‐term), Outcome 12 Loss to follow‐up.
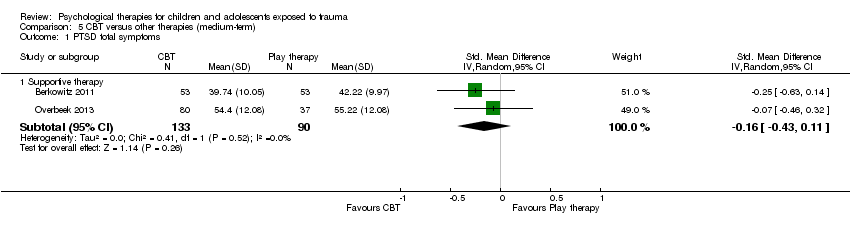
Comparison 5 CBT versus other therapies (medium‐term), Outcome 1 PTSD total symptoms.

Comparison 5 CBT versus other therapies (medium‐term), Outcome 2 Anxiety total symptoms.

Comparison 5 CBT versus other therapies (medium‐term), Outcome 3 Depression.

Comparison 5 CBT versus other therapies (medium‐term), Outcome 4 Behaviour ‐ total.

Comparison 5 CBT versus other therapies (medium‐term), Outcome 5 Behaviour ‐ internalising.

Comparison 5 CBT versus other therapies (medium‐term), Outcome 6 Behaviour ‐ externalising.
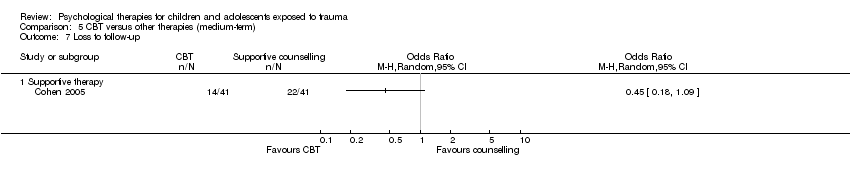
Comparison 5 CBT versus other therapies (medium‐term), Outcome 7 Loss to follow‐up.
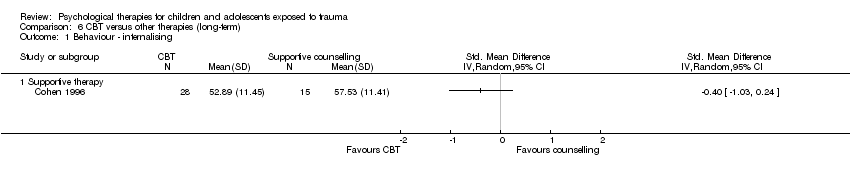
Comparison 6 CBT versus other therapies (long‐term), Outcome 1 Behaviour ‐ internalising.

Comparison 6 CBT versus other therapies (long‐term), Outcome 2 Behaviour ‐ externalising.
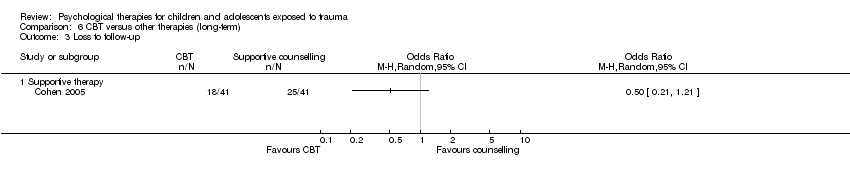
Comparison 6 CBT versus other therapies (long‐term), Outcome 3 Loss to follow‐up.
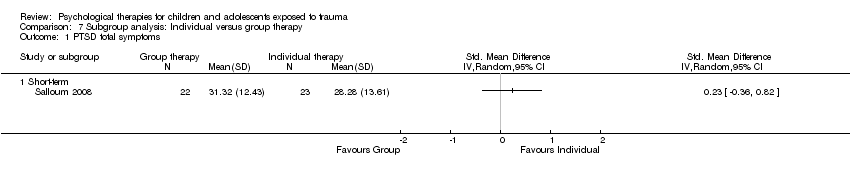
Comparison 7 Subgroup analysis: Individual versus group therapy, Outcome 1 PTSD total symptoms.

Comparison 8 Subgroup analysis: Child versus mother and child therapy, Outcome 1 PTSD total symptoms.
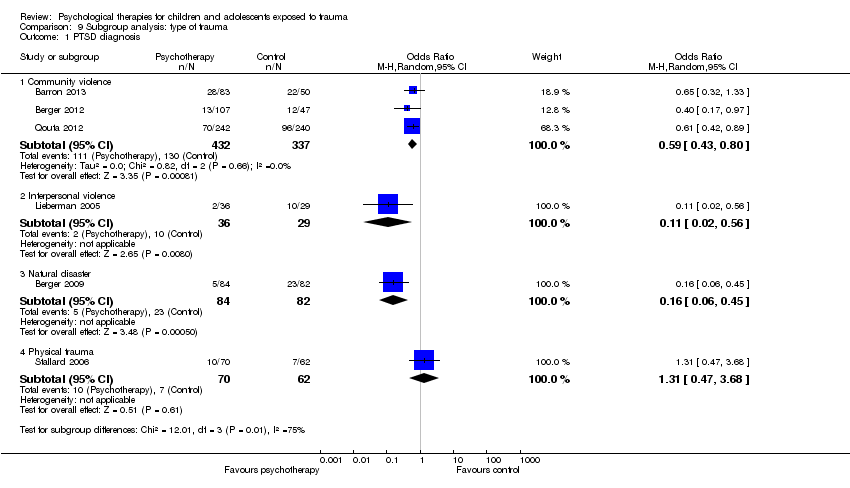
Comparison 9 Subgroup analysis: type of trauma, Outcome 1 PTSD diagnosis.
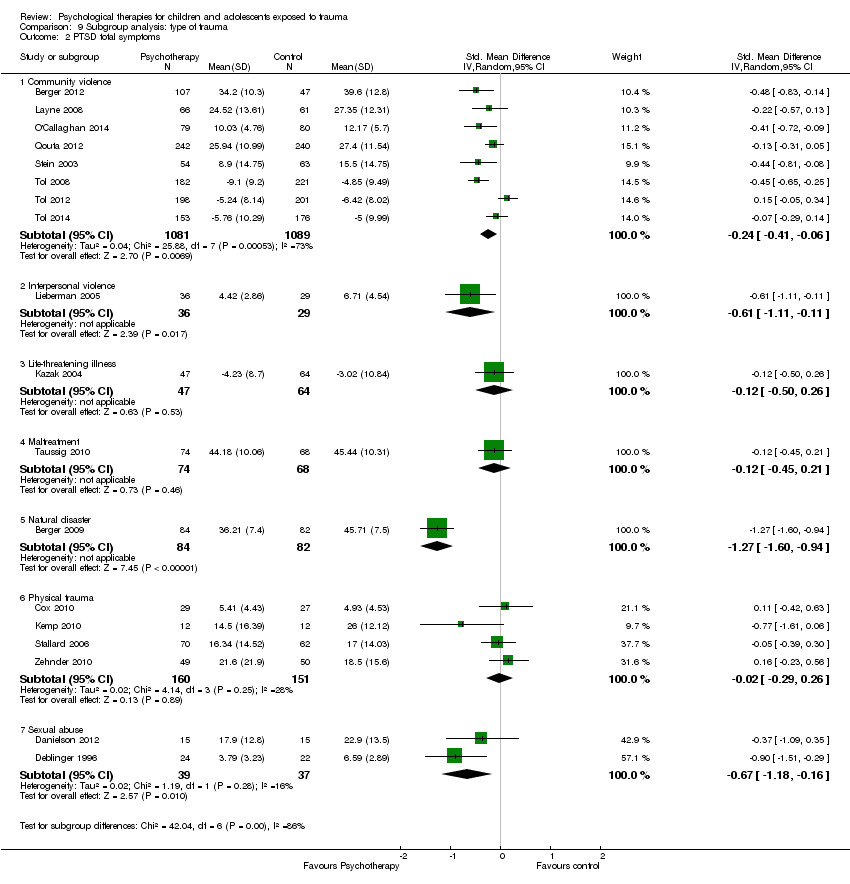
Comparison 9 Subgroup analysis: type of trauma, Outcome 2 PTSD total symptoms.

Comparison 10 Subgroup analysis: symptomatic participants, Outcome 1 PTSD diagnosis.

Comparison 10 Subgroup analysis: symptomatic participants, Outcome 2 PTSD total symptoms.

Comparison 11 Sensitivity analysis: type of control, Outcome 1 PTSD diagnosis.

Comparison 11 Sensitivity analysis: type of control, Outcome 2 PTSD total symptoms.

Comparison 12 Sensitivity analysis: best‐/worst‐case analysis, Outcome 1 PTSD diagnosis.

Comparison 13 Sensitivity analysis: cluster‐randomisation, Outcome 1 PTSD diagnosis.
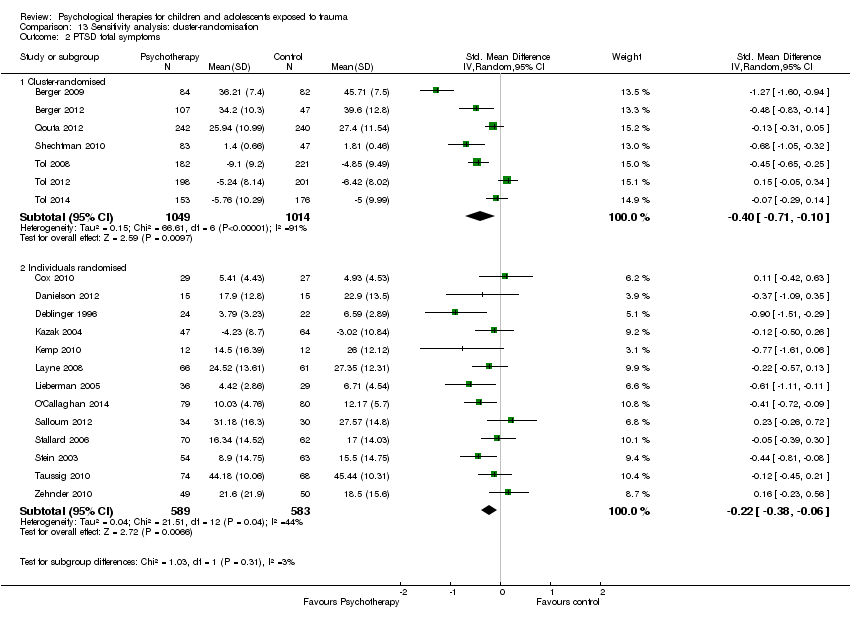
Comparison 13 Sensitivity analysis: cluster‐randomisation, Outcome 2 PTSD total symptoms.

Comparison 14 Sensitivity analysis: performance bias, Outcome 1 PTSD diagnosis.
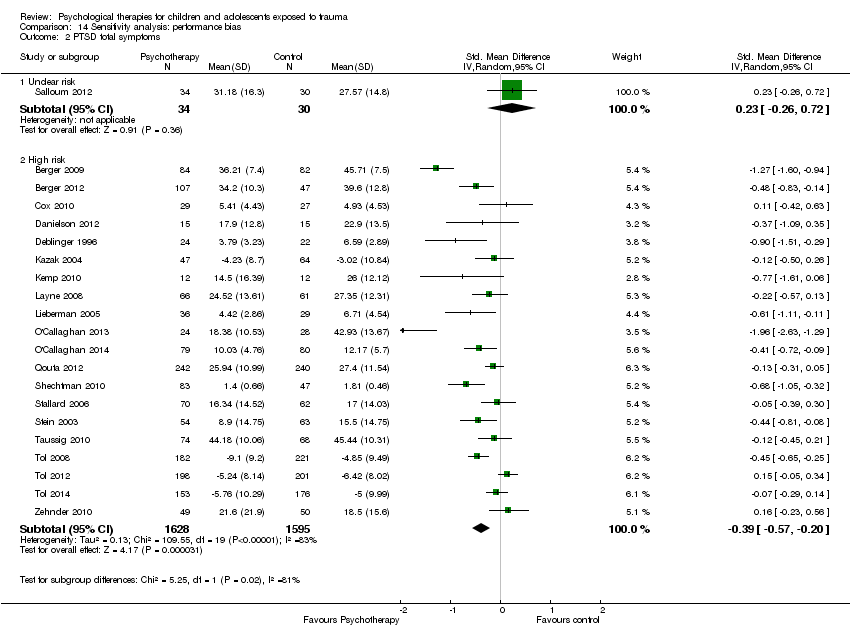
Comparison 14 Sensitivity analysis: performance bias, Outcome 2 PTSD total symptoms.

Comparison 15 Sensitivity analysis: detection bias, Outcome 1 PTSD diagnosis.

Comparison 15 Sensitivity analysis: detection bias, Outcome 2 PTSD total symptoms.

Comparison 16 Sensitivity analysis: attrition bias, Outcome 1 PTSD diagnosis.
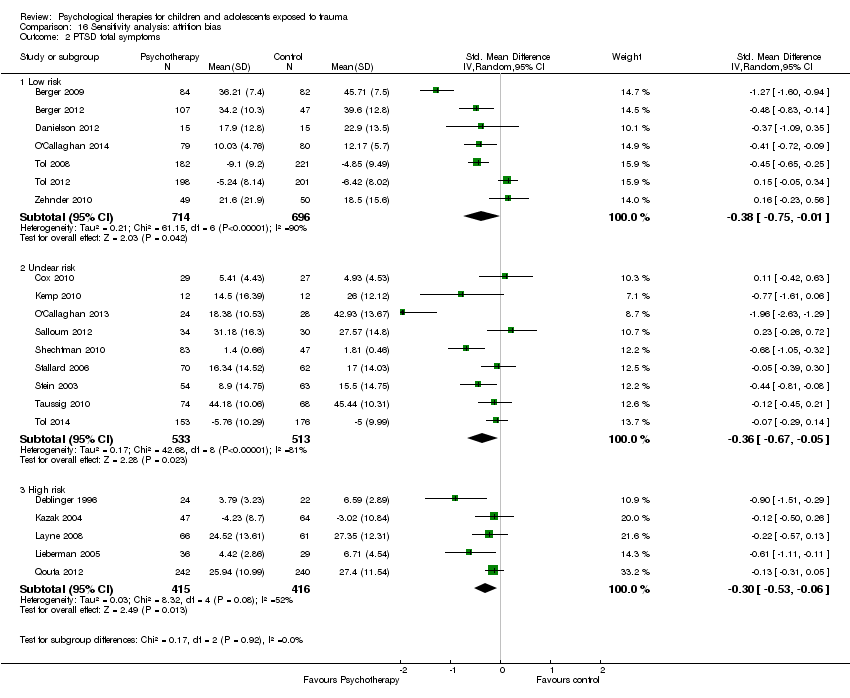
Comparison 16 Sensitivity analysis: attrition bias, Outcome 2 PTSD total symptoms.

Comparison 17 Sensitivity analysis: selection bias, Outcome 1 PTSD diagnosis.
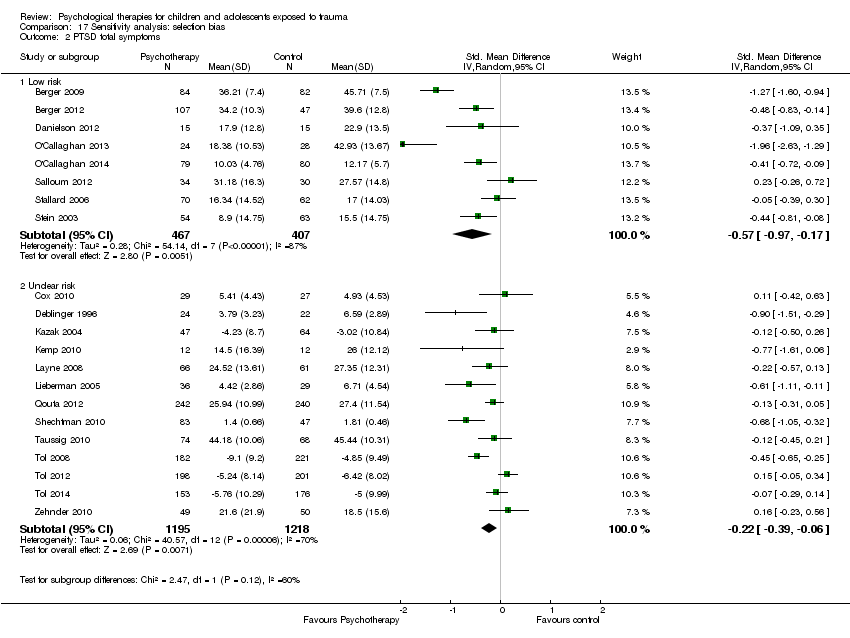
Comparison 17 Sensitivity analysis: selection bias, Outcome 2 PTSD total symptoms.
| Patient or population: children and adolescents exposed to trauma | ||||||
| Outcomes | Anticipated absolute effects* (95% CI) | Relative effect | Number of participants | Quality of the evidence | Comments | |
| Risk with control (short‐term) | Risk with all psychotherapies | |||||
| PTSD diagnosis | Study population | OR 0.51 | 874 | ⊕⊝⊝⊝ | ||
| 367 per 1000 | 228 per 1000 | |||||
| Moderate | ||||||
| 345 per 1000 | 212 per 1000 | |||||
| PTSD total symptoms | Mean PTSD total symptoms in the intervention group 0.42 standard deviations undefined fewer (0.61 fewer to 0.24 fewer) | Moderate effect size | 2051 | ⊕⊕⊝⊝ | ||
| *The risk in the intervention group (and its 95% confidence interval) is based on assumed risk in the comparison group and relative effect of the intervention (and its 95% CI) | ||||||
| GRADE Working Group grades of evidence | ||||||
| aParticipants are likely to have been aware of whether they received the active or inactive intervention in all studies, and diagnosis was based on self reported measures in 2 studies dParticipants were likely to have been aware of whether they received active or inactive intervention in all but one study, and scores were based on self reported measures in 10 studies eSubstantial heterogeneity between different types of psychological therapy (I2 = 71%) | ||||||
| Patient or population: children and adolescents exposed to trauma | ||||||
| Outcomes | Anticipated absolute effects* (95% CI) | Relative effect | Numer of participants | Quality of the evidence | Comments | |
| Risk with other therapies (short‐term) | Risk with CBT | |||||
| PTSD diagnosis | Study population | OR 0.74 | 160 | ⊕⊝⊝⊝ | ||
| 141 per 1000 | 108 per 1000 | |||||
| Moderate | ||||||
| 111 per 1000 | 85 per 1000 | |||||
| PTSD total symptoms | Mean PTSD total symptoms in the intervention group 0.24 standard deviations undefined fewer (0.42 fewer to 0.05 fewer) | Small effect size | 466 | ⊕⊕⊕⊝ | ||
| *The risk in the intervention group (and its 95% confidence interval) is based on assumed risk in the comparison group and relative effect of the intervention (and its 95% CI) | ||||||
| GRADE Working Group grades of evidence | ||||||
| aParticipants are likely to have been aware of whether they received active or inactive intervention in both studies, and diagnosis was based on self reported measures in both cParticipants are likely to have been aware of whether they received active or inactive intervention in all studies, and scores were based on self reported measures in 4 studies | ||||||
| Outcome | Group | n | Mean | SD |
| PTSD symptoms One month | Exposure therapy | 8 | 3.38 | 2.60 |
| Control | 8 | 31.38 | 3.84 | |
| Avoidance One month | Exposure therapy | 8 | 2.88 | 2.62 |
| Control | 8 | 20.25 | 2.38 | |
| Intrusion One month | Exposure therapy | 8 | 0.50 | 0.50 |
| Control | 8 | 11.13 | 2.93 |
| Outcome | Group | n | Mean | SD |
| PTSD symptoms Post therapy | TF‐CBT | 9 | 13.00 | 1.12 |
| Control | 9 | 24.20 | 1.54 | |
| PTSD symptoms 4 months | TF‐CBT | 9 | 11.88 | 1.96 |
| Control | 9 | 23.98 | 1.47 |
| Outcome | Group | n | Mean | SD |
| PTSD symptoms Post therapy | TF‐CBT | 24 | 10.6 | 4.5 |
| Control | 24 | 34.8 | 11.6 | |
| Conduct Problems Post therapy | TF‐CBT | 24 | 0.7 | 0.9 |
| Control | 24 | 7.1 | 7.0 |
| Outcome or subgroup title | No. of studies | No. of participants | Statistical method | Effect size |
| 1 PTSD diagnosis Show forest plot | 5 | 874 | Odds Ratio (M‐H, Random, 95% CI) | 0.51 [0.34, 0.77] |
| 1.1 CBT | 3 | 769 | Odds Ratio (M‐H, Random, 95% CI) | 0.59 [0.43, 0.80] |
| 1.2 EMDR | 1 | 40 | Odds Ratio (M‐H, Random, 95% CI) | 0.2 [0.01, 4.44] |
| 1.3 Family therapy | 1 | 65 | Odds Ratio (M‐H, Random, 95% CI) | 0.11 [0.02, 0.56] |
| 2 PTSD total symptoms Show forest plot | 15 | 2051 | Std. Mean Difference (IV, Random, 95% CI) | ‐0.42 [‐0.61, ‐0.24] |
| 2.1 CBT | 6 | 1329 | Std. Mean Difference (IV, Random, 95% CI) | ‐0.37 [‐0.55, ‐0.19] |
| 2.2 EMDR | 1 | 24 | Std. Mean Difference (IV, Random, 95% CI) | ‐0.77 [‐1.61, 0.06] |
| 2.3 Family therapy | 2 | 95 | Std. Mean Difference (IV, Random, 95% CI) | ‐0.53 [‐0.94, ‐0.12] |
| 2.4 Narrative | 1 | 64 | Std. Mean Difference (IV, Random, 95% CI) | 0.23 [‐0.26, 0.72] |
| 2.5 Psychoeducation | 2 | 215 | Std. Mean Difference (IV, Random, 95% CI) | ‐0.19 [‐0.69, 0.30] |
| 2.6 Supportive therapy | 2 | 272 | Std. Mean Difference (IV, Random, 95% CI) | ‐0.40 [‐0.95, 0.15] |
| 2.7 CBT + narrative therapy | 1 | 52 | Std. Mean Difference (IV, Random, 95% CI) | ‐1.96 [‐2.63, ‐1.29] |
| 3 PTSD avoidance Show forest plot | 2 | 205 | Std. Mean Difference (IV, Random, 95% CI) | ‐0.02 [‐0.29, 0.26] |
| 3.1 Narrative | 1 | 158 | Std. Mean Difference (IV, Random, 95% CI) | 0.05 [‐0.27, 0.36] |
| 3.2 Psychoeducation | 1 | 47 | Std. Mean Difference (IV, Random, 95% CI) | ‐0.23 [‐0.80, 0.35] |
| 4 PTSD hyperarousal Show forest plot | 2 | 205 | Std. Mean Difference (IV, Random, 95% CI) | 0.05 [‐0.22, 0.32] |
| 4.1 Narrative | 1 | 158 | Std. Mean Difference (IV, Random, 95% CI) | 0.10 [‐0.21, 0.41] |
| 4.2 Psychoeducation | 1 | 47 | Std. Mean Difference (IV, Random, 95% CI) | ‐0.12 [‐0.70, 0.45] |
| 5 PTSD intrusion Show forest plot | 2 | 205 | Std. Mean Difference (IV, Random, 95% CI) | 0.11 [‐0.16, 0.39] |
| 5.1 Narrative | 1 | 158 | Std. Mean Difference (IV, Random, 95% CI) | 0.15 [‐0.16, 0.46] |
| 5.2 Psychoeducation | 1 | 47 | Std. Mean Difference (IV, Random, 95% CI) | ‐0.02 [‐0.59, 0.55] |
| 6 Anxiety total symptoms Show forest plot | 7 | 959 | Std. Mean Difference (IV, Random, 95% CI) | ‐0.13 [‐0.26, 0.00] |
| 6.1 CBT | 2 | 557 | Std. Mean Difference (IV, Random, 95% CI) | ‐0.13 [‐0.30, 0.04] |
| 6.2 Counselling | 1 | 130 | Std. Mean Difference (IV, Random, 95% CI) | ‐0.20 [‐0.56, 0.16] |
| 6.3 EMDR | 1 | 40 | Std. Mean Difference (IV, Random, 95% CI) | ‐0.66 [‐1.30, ‐0.03] |
| 6.4 Exposure | 1 | 65 | Std. Mean Difference (IV, Random, 95% CI) | 0.01 [‐0.48, 0.51] |
| 6.5 Narrative | 1 | 111 | Std. Mean Difference (IV, Random, 95% CI) | ‐0.21 [‐0.58, 0.17] |
| 6.6 Psychoeducation | 1 | 56 | Std. Mean Difference (IV, Random, 95% CI) | 0.32 [‐0.21, 0.85] |
| 7 Anxiety ‐ state Show forest plot | 2 | 70 | Std. Mean Difference (IV, Random, 95% CI) | ‐0.64 [‐1.12, ‐0.16] |
| 7.1 CBT | 1 | 46 | Std. Mean Difference (IV, Random, 95% CI) | ‐0.71 [‐1.31, ‐0.12] |
| 7.2 EMDR | 1 | 24 | Std. Mean Difference (IV, Random, 95% CI) | ‐0.51 [‐1.33, 0.31] |
| 8 Anxiety ‐ trait Show forest plot | 2 | 70 | Std. Mean Difference (IV, Random, 95% CI) | ‐0.34 [‐0.81, 0.14] |
| 8.1 CBT | 1 | 46 | Std. Mean Difference (IV, Random, 95% CI) | ‐0.36 [‐0.94, 0.22] |
| 8.2 EMDR | 1 | 24 | Std. Mean Difference (IV, Random, 95% CI) | ‐0.29 [‐1.10, 0.51] |
| 9 Depression Show forest plot | 13 | 1569 | Std. Mean Difference (IV, Random, 95% CI) | ‐0.13 [‐0.30, 0.04] |
| 9.1 CBT | 6 | 1191 | Std. Mean Difference (IV, Random, 95% CI) | ‐0.21 [‐0.42, ‐0.00] |
| 9.2 EMDR | 2 | 64 | Std. Mean Difference (IV, Random, 95% CI) | ‐0.39 [‐1.41, 0.64] |
| 9.3 Exposure | 1 | 52 | Std. Mean Difference (IV, Random, 95% CI) | 0.10 [‐0.45, 0.65] |
| 9.4 Family therapy | 1 | 30 | Std. Mean Difference (IV, Random, 95% CI) | 0.05 [‐0.66, 0.77] |
| 9.5 Narrative | 2 | 176 | Std. Mean Difference (IV, Random, 95% CI) | 0.13 [‐0.52, 0.77] |
| 9.6 Psychoeducation | 1 | 56 | Std. Mean Difference (IV, Random, 95% CI) | 0.09 [‐0.43, 0.62] |
| 10 Behaviour ‐ total Show forest plot | 3 | 166 | Std. Mean Difference (IV, Random, 95% CI) | ‐0.04 [‐0.51, 0.42] |
| 10.1 EMDR | 1 | 24 | Std. Mean Difference (IV, Random, 95% CI) | ‐0.44 [‐1.25, 0.37] |
| 10.2 Exposure | 1 | 77 | Std. Mean Difference (IV, Random, 95% CI) | 0.34 [‐0.11, 0.80] |
| 10.3 Family therapy | 1 | 65 | Std. Mean Difference (IV, Random, 95% CI) | ‐0.23 [‐0.72, 0.26] |
| 11 Behaviour ‐ internalising Show forest plot | 10 | 719 | Std. Mean Difference (IV, Random, 95% CI) | ‐0.04 [‐0.20, 0.13] |
| 11.1 CBT | 2 | 162 | Std. Mean Difference (IV, Random, 95% CI) | ‐0.13 [‐0.44, 0.18] |
| 11.2 EMDR | 2 | 64 | Std. Mean Difference (IV, Random, 95% CI) | ‐0.57 [‐1.07, ‐0.07] |
| 11.3 Exposure | 1 | 77 | Std. Mean Difference (IV, Random, 95% CI) | 0.38 [‐0.08, 0.84] |
| 11.4 Family therapy | 1 | 30 | Std. Mean Difference (IV, Random, 95% CI) | 0.32 [‐0.40, 1.04] |
| 11.5 Narrative | 2 | 180 | Std. Mean Difference (IV, Random, 95% CI) | 0.12 [‐0.18, 0.41] |
| 11.6 Psychoeducation | 2 | 206 | Std. Mean Difference (IV, Random, 95% CI) | ‐0.11 [‐0.38, 0.17] |
| 12 Behaviour ‐ externalising Show forest plot | 12 | 1174 | Std. Mean Difference (IV, Random, 95% CI) | ‐0.10 [‐0.33, 0.14] |
| 12.1 CBT | 3 | 565 | Std. Mean Difference (IV, Random, 95% CI) | ‐0.11 [‐0.28, 0.06] |
| 12.2 EMDR | 2 | 64 | Std. Mean Difference (IV, Random, 95% CI) | ‐0.55 [‐1.19, 0.10] |
| 12.3 Exposure | 1 | 77 | Std. Mean Difference (IV, Random, 95% CI) | 0.49 [0.03, 0.95] |
| 12.4 Family therapy | 1 | 30 | Std. Mean Difference (IV, Random, 95% CI) | 0.23 [‐0.49, 0.95] |
| 12.5 Narrative | 2 | 180 | Std. Mean Difference (IV, Random, 95% CI) | 0.20 [‐0.41, 0.81] |
| 12.6 Psychoeducation | 2 | 206 | Std. Mean Difference (IV, Random, 95% CI) | ‐0.03 [‐0.52, 0.46] |
| 12.7 CBT + narrative therapy | 1 | 52 | Std. Mean Difference (IV, Random, 95% CI) | ‐1.06 [‐1.64, ‐0.47] |
| 13 Functional impairment Show forest plot | 2 | Std. Mean Difference (IV, Random, 95% CI) | Subtotals only | |
| 13.1 CBT | 2 | 557 | Std. Mean Difference (IV, Random, 95% CI) | ‐0.41 [‐0.59, ‐0.24] |
| 14 Quality of life Show forest plot | 1 | Std. Mean Difference (IV, Random, 95% CI) | Totals not selected | |
| 14.1 Supportive therapy | 1 | Std. Mean Difference (IV, Random, 95% CI) | 0.0 [0.0, 0.0] | |
| 15 Loss to follow‐up Show forest plot | 26 | 3872 | Risk Ratio (M‐H, Random, 95% CI) | 0.98 [0.69, 1.39] |
| 15.1 CBT | 14 | 2913 | Risk Ratio (M‐H, Random, 95% CI) | 0.87 [0.47, 1.62] |
| 15.2 Counselling | 1 | 164 | Risk Ratio (M‐H, Random, 95% CI) | 0.56 [0.30, 1.03] |
| 15.3 EMDR | 2 | 92 | Risk Ratio (M‐H, Random, 95% CI) | 1.64 [0.48, 5.59] |
| 15.4 Exposure | 1 | 16 | Risk Ratio (M‐H, Random, 95% CI) | 0.0 [0.0, 0.0] |
| 15.5 Family therapy | 2 | 105 | Risk Ratio (M‐H, Random, 95% CI) | 1.44 [0.48, 4.30] |
| 15.6 Narrative | 2 | 280 | Risk Ratio (M‐H, Random, 95% CI) | 0.87 [0.32, 2.39] |
| 15.7 Psychoeducation | 3 | 274 | Risk Ratio (M‐H, Random, 95% CI) | 1.21 [0.75, 1.96] |
| 15.8 Psychodrama | 1 | 28 | Risk Ratio (M‐H, Random, 95% CI) | 1.5 [0.29, 7.65] |
| Outcome or subgroup title | No. of studies | No. of participants | Statistical method | Effect size |
| 1 PTSD diagnosis Show forest plot | 4 | 742 | Odds Ratio (M‐H, Random, 95% CI) | 0.66 [0.26, 1.69] |
| 1.1 CBT | 2 | 570 | Odds Ratio (M‐H, Random, 95% CI) | 0.49 [0.09, 2.61] |
| 1.2 Debriefing | 1 | 132 | Odds Ratio (M‐H, Random, 95% CI) | 1.31 [0.47, 3.68] |
| 1.3 EMDR | 1 | 40 | Odds Ratio (M‐H, Random, 95% CI) | 0.35 [0.01, 9.13] |
| 2 PTSD total symptoms Show forest plot | 12 | 2337 | Std. Mean Difference (IV, Random, 95% CI) | ‐0.17 [‐0.38, 0.05] |
| 2.1 CBT | 5 | 1701 | Std. Mean Difference (IV, Random, 95% CI) | ‐0.34 [‐0.72, 0.03] |
| 2.2 Debriefing | 2 | 231 | Std. Mean Difference (IV, Random, 95% CI) | 0.04 [‐0.22, 0.30] |
| 2.3 Family therapy | 2 | 141 | Std. Mean Difference (IV, Random, 95% CI) | ‐0.06 [‐0.39, 0.27] |
| 2.4 Narrative | 1 | 64 | Std. Mean Difference (IV, Random, 95% CI) | 0.23 [‐0.26, 0.73] |
| 2.5 Psychoeducation | 1 | 56 | Std. Mean Difference (IV, Random, 95% CI) | ‐0.13 [‐0.65, 0.40] |
| 2.6 Supportive therapy | 1 | 144 | Std. Mean Difference (IV, Random, 95% CI) | ‐0.21 [‐0.54, 0.12] |
| 3 PTSD ‐ avoidance Show forest plot | 2 | 243 | Std. Mean Difference (IV, Fixed, 95% CI) | 0.04 [‐0.22, 0.29] |
| 3.1 Debriefing | 1 | 132 | Std. Mean Difference (IV, Fixed, 95% CI) | ‐0.08 [‐0.42, 0.26] |
| 3.2 Family therapy | 1 | 111 | Std. Mean Difference (IV, Fixed, 95% CI) | 0.18 [‐0.20, 0.55] |
| 4 PTSD ‐ hyperarousal Show forest plot | 2 | 243 | Std. Mean Difference (IV, Random, 95% CI) | ‐0.13 [‐0.43, 0.17] |
| 4.1 Debriefing | 1 | 132 | Std. Mean Difference (IV, Random, 95% CI) | 0.01 [‐0.33, 0.35] |
| 4.2 Family therapy | 1 | 111 | Std. Mean Difference (IV, Random, 95% CI) | ‐0.29 [‐0.67, 0.09] |
| 5 PTSD ‐ intrusion Show forest plot | 2 | 243 | Std. Mean Difference (IV, Fixed, 95% CI) | ‐0.04 [‐0.29, 0.21] |
| 5.1 Debriefing | 1 | 132 | Std. Mean Difference (IV, Fixed, 95% CI) | ‐0.05 [‐0.39, 0.29] |
| 5.2 Family therapy | 1 | 111 | Std. Mean Difference (IV, Fixed, 95% CI) | ‐0.03 [‐0.40, 0.35] |
| 6 Anxiety total symptoms Show forest plot | 7 | 1470 | Std. Mean Difference (IV, Random, 95% CI) | ‐0.10 [‐0.20, 0.00] |
| 6.1 CBT | 3 | 1131 | Std. Mean Difference (IV, Random, 95% CI) | ‐0.07 [‐0.19, 0.04] |
| 6.2 Debriefing | 1 | 132 | Std. Mean Difference (IV, Random, 95% CI) | ‐0.08 [‐0.42, 0.27] |
| 6.3 EMDR | 1 | 40 | Std. Mean Difference (IV, Random, 95% CI) | ‐0.72 [‐1.36, ‐0.07] |
| 6.4 Psychoeducation | 1 | 56 | Std. Mean Difference (IV, Random, 95% CI) | ‐0.21 [‐0.73, 0.32] |
| 6.5 Narrative | 1 | 111 | Std. Mean Difference (IV, Random, 95% CI) | ‐0.17 [‐0.54, 0.21] |
| 7 Anxiety ‐ state Show forest plot | 1 | Std. Mean Difference (IV, Fixed, 95% CI) | Totals not selected | |
| 7.1 CBT | 1 | Std. Mean Difference (IV, Fixed, 95% CI) | 0.0 [0.0, 0.0] | |
| 8 Anxiety ‐ trait Show forest plot | 2 | Std. Mean Difference (IV, Fixed, 95% CI) | Subtotals only | |
| 8.1 CBT | 2 | 101 | Std. Mean Difference (IV, Fixed, 95% CI) | ‐0.45 [‐0.85, ‐0.05] |
| 9 Depression Show forest plot | 13 | 2191 | Std. Mean Difference (IV, Random, 95% CI) | ‐0.07 [‐0.22, 0.07] |
| 9.1 CBT | 8 | 1810 | Std. Mean Difference (IV, Random, 95% CI) | ‐0.12 [‐0.31, 0.07] |
| 9.2 Debriefing | 2 | 231 | Std. Mean Difference (IV, Random, 95% CI) | ‐0.12 [‐0.38, 0.14] |
| 9.3 Family therapy | 1 | 30 | Std. Mean Difference (IV, Random, 95% CI) | 0.34 [‐0.38, 1.06] |
| 9.4 Narrative | 1 | 64 | Std. Mean Difference (IV, Random, 95% CI) | 0.34 [‐0.15, 0.84] |
| 9.5 Psychoeducation | 1 | 56 | Std. Mean Difference (IV, Random, 95% CI) | ‐0.14 [‐0.67, 0.38] |
| 10 Behaviour ‐ total Show forest plot | 3 | 281 | Std. Mean Difference (IV, Fixed, 95% CI) | ‐0.20 [‐0.43, 0.04] |
| 10.1 Debriefing | 1 | 132 | Std. Mean Difference (IV, Fixed, 95% CI) | ‐0.28 [‐0.62, 0.06] |
| 10.2 Family therapy | 1 | 50 | Std. Mean Difference (IV, Fixed, 95% CI) | ‐0.37 [‐0.93, 0.19] |
| 10.3 Narrative | 1 | 99 | Std. Mean Difference (IV, Fixed, 95% CI) | 0.0 [‐0.39, 0.39] |
| 11 Behaviour ‐ internalising Show forest plot | 4 | 291 | Std. Mean Difference (IV, Random, 95% CI) | 0.01 [‐0.25, 0.28] |
| 11.1 EMDR | 1 | 40 | Std. Mean Difference (IV, Random, 95% CI) | ‐0.50 [‐1.13, 0.14] |
| 11.2 Family therapy | 1 | 30 | Std. Mean Difference (IV, Random, 95% CI) | 0.0 [‐0.72, 0.72] |
| 11.3 Narrative | 2 | 221 | Std. Mean Difference (IV, Random, 95% CI) | 0.13 [‐0.13, 0.40] |
| 12 Behaviour ‐ externalising Show forest plot | 5 | 694 | Std. Mean Difference (IV, Random, 95% CI) | 0.02 [‐0.32, 0.35] |
| 12.1 CBT | 1 | 403 | Std. Mean Difference (IV, Random, 95% CI) | 0.07 [‐0.13, 0.27] |
| 12.2 EMDR | 1 | 40 | Std. Mean Difference (IV, Random, 95% CI) | 1.00 [‐1.66, ‐0.33] |
| 12.3 Family therapy | 1 | 30 | Std. Mean Difference (IV, Random, 95% CI) | ‐0.01 [‐0.72, 0.71] |
| 12.4 Narrative | 2 | 221 | Std. Mean Difference (IV, Random, 95% CI) | 0.31 [0.05, 0.58] |
| 13 Function Show forest plot | 3 | Std. Mean Difference (IV, Random, 95% CI) | Subtotals only | |
| 13.1 CBT | 3 | 814 | Std. Mean Difference (IV, Random, 95% CI) | ‐0.46 [‐0.88, ‐0.05] |
| 14 Quality of life Show forest plot | 1 | Std. Mean Difference (IV, Random, 95% CI) | Totals not selected | |
| 14.1 Supportive therapy | 1 | Std. Mean Difference (IV, Random, 95% CI) | 0.0 [0.0, 0.0] | |
| 15 Loss to follow‐up Show forest plot | 20 | 3663 | Odds Ratio (M‐H, Fixed, 95% CI) | 1.00 [0.82, 1.21] |
| 15.1 CBT | 11 | 2856 | Odds Ratio (M‐H, Fixed, 95% CI) | 1.01 [0.81, 1.27] |
| 15.2 Counselling | 1 | 23 | Odds Ratio (M‐H, Fixed, 95% CI) | 7.0 [0.32, 152.95] |
| 15.3 Debriefing | 1 | 158 | Odds Ratio (M‐H, Fixed, 95% CI) | 0.76 [0.33, 1.76] |
| 15.4 EMDR | 1 | 65 | Odds Ratio (M‐H, Fixed, 95% CI) | 1.41 [0.52, 3.84] |
| 15.5 Family therapy | 1 | 75 | Odds Ratio (M‐H, Fixed, 95% CI) | 1.28 [0.48, 3.39] |
| 15.6 Narrative | 2 | 171 | Odds Ratio (M‐H, Fixed, 95% CI) | 0.70 [0.16, 2.99] |
| 15.7 Psychoeducation | 2 | 244 | Odds Ratio (M‐H, Fixed, 95% CI) | 0.77 [0.40, 1.47] |
| 15.8 Other | 1 | 71 | Odds Ratio (M‐H, Fixed, 95% CI) | 0.90 [0.29, 2.73] |
| Outcome or subgroup title | No. of studies | No. of participants | Statistical method | Effect size |
| 1 PTSD diagnosis Show forest plot | 1 | Odds Ratio (M‐H, Random, 95% CI) | Totals not selected | |
| 1.1 Narrative | 1 | Odds Ratio (M‐H, Random, 95% CI) | 0.0 [0.0, 0.0] | |
| 2 PTSD total symptoms Show forest plot | 2 | 141 | Std. Mean Difference (IV, Random, 95% CI) | 0.17 [‐0.28, 0.62] |
| 2.1 Exposure | 1 | 77 | Std. Mean Difference (IV, Random, 95% CI) | 0.39 [‐0.07, 0.85] |
| 2.2 Narrative | 1 | 64 | Std. Mean Difference (IV, Random, 95% CI) | ‐0.07 [‐0.56, 0.42] |
| 3 Anxiety Show forest plot | 2 | 176 | Std. Mean Difference (IV, Random, 95% CI) | ‐0.12 [‐0.41, 0.18] |
| 3.1 Exposure | 1 | 65 | Std. Mean Difference (IV, Random, 95% CI) | ‐0.30 [‐0.80, 0.19] |
| 3.2 Narrative | 1 | 111 | Std. Mean Difference (IV, Random, 95% CI) | ‐0.01 [‐0.39, 0.36] |
| 4 Depression Show forest plot | 3 | 152 | Std. Mean Difference (IV, Fixed, 95% CI) | ‐0.24 [‐0.56, 0.08] |
| 4.1 CBT | 1 | 36 | Std. Mean Difference (IV, Fixed, 95% CI) | ‐0.59 [‐1.27, 0.09] |
| 4.2 Exposure | 1 | 52 | Std. Mean Difference (IV, Fixed, 95% CI) | ‐0.29 [‐0.84, 0.26] |
| 4.3 Narrative | 1 | 64 | Std. Mean Difference (IV, Fixed, 95% CI) | ‐0.02 [‐0.51, 0.47] |
| 5 Behaviour ‐ total Show forest plot | 1 | Std. Mean Difference (IV, Random, 95% CI) | Totals not selected | |
| 5.1 Exposure | 1 | Std. Mean Difference (IV, Random, 95% CI) | 0.0 [0.0, 0.0] | |
| 6 Behaviour ‐ internalising Show forest plot | 2 | 141 | Std. Mean Difference (IV, Random, 95% CI) | 0.04 [‐0.51, 0.59] |
| 6.1 Exposure | 1 | 77 | Std. Mean Difference (IV, Random, 95% CI) | 0.31 [‐0.15, 0.77] |
| 6.2 Narrative | 1 | 64 | Std. Mean Difference (IV, Random, 95% CI) | ‐0.25 [‐0.75, 0.24] |
| 7 Behaviour ‐ externalising Show forest plot | 3 | 298 | Std. Mean Difference (IV, Random, 95% CI) | 0.28 [‐0.05, 0.60] |
| 7.1 Exposure | 1 | 77 | Std. Mean Difference (IV, Random, 95% CI) | 0.51 [0.04, 0.97] |
| 7.2 Narrative | 2 | 221 | Std. Mean Difference (IV, Random, 95% CI) | 0.17 [‐0.30, 0.64] |
| 8 Loss to follow‐up Show forest plot | 2 | 120 | Odds Ratio (M‐H, Random, 95% CI) | 0.45 [0.15, 1.32] |
| 8.1 CBT | 1 | 50 | Odds Ratio (M‐H, Random, 95% CI) | 0.29 [0.08, 1.09] |
| 8.2 Narrative | 1 | 70 | Odds Ratio (M‐H, Random, 95% CI) | 0.88 [0.17, 4.71] |
| Outcome or subgroup title | No. of studies | No. of participants | Statistical method | Effect size |
| 1 PTSD diagnosis Show forest plot | 2 | 160 | Odds Ratio (M‐H, Random, 95% CI) | 0.74 [0.29, 1.91] |
| 1.1 EMDR | 1 | 36 | Odds Ratio (M‐H, Random, 95% CI) | 1.0 [0.06, 17.33] |
| 1.2 Supportive therapy | 1 | 124 | Odds Ratio (M‐H, Random, 95% CI) | 0.71 [0.26, 1.95] |
| 2 PTSD total symptoms Show forest plot | 7 | 466 | Std. Mean Difference (IV, Random, 95% CI) | ‐0.24 [‐0.42, ‐0.05] |
| 2.1 EMDR | 2 | 62 | Std. Mean Difference (IV, Random, 95% CI) | 0.06 [‐0.44, 0.56] |
| 2.2 Play therapy | 1 | 26 | Std. Mean Difference (IV, Random, 95% CI) | 0.21 [‐0.56, 0.98] |
| 2.3 Supportive therapies | 4 | 378 | Std. Mean Difference (IV, Random, 95% CI) | ‐0.32 [‐0.53, ‐0.12] |
| 3 PTSD avoidance Show forest plot | 1 | Std. Mean Difference (IV, Random, 95% CI) | Totals not selected | |
| 3.1 Supportive therapy | 1 | Std. Mean Difference (IV, Random, 95% CI) | 0.0 [0.0, 0.0] | |
| 4 PTSD hyperarousal Show forest plot | 1 | Std. Mean Difference (IV, Random, 95% CI) | Totals not selected | |
| 4.1 Supportive therapy | 1 | Std. Mean Difference (IV, Random, 95% CI) | 0.0 [0.0, 0.0] | |
| 5 PTSD intrusion Show forest plot | 1 | Std. Mean Difference (IV, Random, 95% CI) | Totals not selected | |
| 5.1 Supportive therapy | 1 | Std. Mean Difference (IV, Random, 95% CI) | 0.0 [0.0, 0.0] | |
| 6 Anxiety total symptoms Show forest plot | 2 | Std. Mean Difference (IV, Random, 95% CI) | Subtotals only | |
| 6.1 Supportive therapy | 2 | 230 | Std. Mean Difference (IV, Random, 95% CI) | ‐0.48 [‐0.74, ‐0.22] |
| 7 Depression Show forest plot | 2 | Std. Mean Difference (IV, Random, 95% CI) | Subtotals only | |
| 7.1 Supportive therapy | 2 | 237 | Std. Mean Difference (IV, Random, 95% CI) | ‐0.14 [‐0.42, 0.14] |
| 8 Behaviour ‐ total Show forest plot | 3 | 182 | Std. Mean Difference (IV, Random, 95% CI) | 0.02 [‐0.27, 0.31] |
| 8.1 EMDR | 1 | 14 | Std. Mean Difference (IV, Random, 95% CI) | ‐0.44 [‐1.50, 0.63] |
| 8.2 Supportive therapy | 2 | 168 | Std. Mean Difference (IV, Random, 95% CI) | 0.05 [‐0.25, 0.36] |
| 9 Behaviour ‐ internalising Show forest plot | 3 | Std. Mean Difference (IV, Random, 95% CI) | Subtotals only | |
| 9.1 Supportive therapy | 3 | 235 | Std. Mean Difference (IV, Random, 95% CI) | ‐0.25 [‐0.79, 0.28] |
| 10 Behaviour ‐ externalising Show forest plot | 3 | Std. Mean Difference (IV, Random, 95% CI) | Subtotals only | |
| 10.1 Supportive therapy | 3 | 235 | Std. Mean Difference (IV, Random, 95% CI) | ‐0.31 [‐0.58, ‐0.05] |
| 11 Function Show forest plot | 1 | Std. Mean Difference (IV, Random, 95% CI) | Totals not selected | |
| 11.1 Supportive therapy | 1 | Std. Mean Difference (IV, Random, 95% CI) | 0.0 [0.0, 0.0] | |
| 12 Loss to follow‐up Show forest plot | 8 | 544 | Odds Ratio (M‐H, Random, 95% CI) | 0.69 [0.41, 1.18] |
| 12.1 EMDR | 2 | 64 | Odds Ratio (M‐H, Random, 95% CI) | 0.76 [0.23, 2.52] |
| 12.2 Play therapy | 1 | 31 | Odds Ratio (M‐H, Random, 95% CI) | 0.08 [0.00, 1.56] |
| 12.3 Supportive therapy | 5 | 449 | Odds Ratio (M‐H, Random, 95% CI) | 0.74 [0.38, 1.43] |
| Outcome or subgroup title | No. of studies | No. of participants | Statistical method | Effect size |
| 1 PTSD total symptoms Show forest plot | 2 | Std. Mean Difference (IV, Random, 95% CI) | Subtotals only | |
| 1.1 Supportive therapy | 2 | 223 | Std. Mean Difference (IV, Random, 95% CI) | ‐0.16 [‐0.43, 0.11] |
| 2 Anxiety total symptoms Show forest plot | 1 | Std. Mean Difference (IV, Random, 95% CI) | Totals not selected | |
| 2.1 Supportive therapy | 1 | Std. Mean Difference (IV, Random, 95% CI) | 0.0 [0.0, 0.0] | |
| 3 Depression Show forest plot | 1 | Std. Mean Difference (IV, Random, 95% CI) | Totals not selected | |
| 3.1 Supportive therapy | 1 | Std. Mean Difference (IV, Random, 95% CI) | 0.0 [0.0, 0.0] | |
| 4 Behaviour ‐ total Show forest plot | 1 | Std. Mean Difference (IV, Random, 95% CI) | Totals not selected | |
| 4.1 Supportive therapy | 1 | Std. Mean Difference (IV, Random, 95% CI) | 0.0 [0.0, 0.0] | |
| 5 Behaviour ‐ internalising Show forest plot | 2 | Std. Mean Difference (IV, Random, 95% CI) | Subtotals only | |
| 5.1 Supportive therapy | 2 | 178 | Std. Mean Difference (IV, Random, 95% CI) | ‐0.05 [‐0.36, 0.26] |
| 6 Behaviour ‐ externalising Show forest plot | 2 | Std. Mean Difference (IV, Random, 95% CI) | Subtotals only | |
| 6.1 Supportive therapy | 2 | 178 | Std. Mean Difference (IV, Random, 95% CI) | ‐0.06 [‐0.37, 0.25] |
| 7 Loss to follow‐up Show forest plot | 1 | Odds Ratio (M‐H, Random, 95% CI) | Totals not selected | |
| 7.1 Supportive therapy | 1 | Odds Ratio (M‐H, Random, 95% CI) | 0.0 [0.0, 0.0] | |
| Outcome or subgroup title | No. of studies | No. of participants | Statistical method | Effect size |
| 1 Behaviour ‐ internalising Show forest plot | 1 | Std. Mean Difference (IV, Random, 95% CI) | Totals not selected | |
| 1.1 Supportive therapy | 1 | Std. Mean Difference (IV, Random, 95% CI) | 0.0 [0.0, 0.0] | |
| 2 Behaviour ‐ externalising Show forest plot | 1 | Std. Mean Difference (IV, Random, 95% CI) | Totals not selected | |
| 2.1 Supportive therapy | 1 | Std. Mean Difference (IV, Random, 95% CI) | 0.0 [0.0, 0.0] | |
| 3 Loss to follow‐up Show forest plot | 1 | Odds Ratio (M‐H, Random, 95% CI) | Totals not selected | |
| 3.1 Supportive therapy | 1 | Odds Ratio (M‐H, Random, 95% CI) | 0.0 [0.0, 0.0] | |
| Outcome or subgroup title | No. of studies | No. of participants | Statistical method | Effect size |
| 1 PTSD total symptoms Show forest plot | 1 | Std. Mean Difference (IV, Random, 95% CI) | Totals not selected | |
| 1.1 Short‐term | 1 | Std. Mean Difference (IV, Random, 95% CI) | 0.0 [0.0, 0.0] | |
| 1.2 Medium‐term | 1 | Std. Mean Difference (IV, Random, 95% CI) | 0.0 [0.0, 0.0] | |
| 1.3 Long‐term | 1 | Std. Mean Difference (IV, Random, 95% CI) | 0.0 [0.0, 0.0] | |
| Outcome or subgroup title | No. of studies | No. of participants | Statistical method | Effect size |
| 1 PTSD diagnosis Show forest plot | 6 | Odds Ratio (M‐H, Random, 95% CI) | Subtotals only | |
| 1.1 Community violence | 3 | 769 | Odds Ratio (M‐H, Random, 95% CI) | 0.59 [0.43, 0.80] |
| 1.2 Interpersonal violence | 1 | 65 | Odds Ratio (M‐H, Random, 95% CI) | 0.11 [0.02, 0.56] |
| 1.3 Natural disaster | 1 | 166 | Odds Ratio (M‐H, Random, 95% CI) | 0.16 [0.06, 0.45] |
| 1.4 Physical trauma | 1 | 132 | Odds Ratio (M‐H, Random, 95% CI) | 1.31 [0.47, 3.68] |
| 2 PTSD total symptoms Show forest plot | 18 | Std. Mean Difference (IV, Random, 95% CI) | Subtotals only | |
| 2.1 Community violence | 8 | 2170 | Std. Mean Difference (IV, Random, 95% CI) | ‐0.24 [‐0.41, ‐0.06] |
| 2.2 Interpersonal violence | 1 | 65 | Std. Mean Difference (IV, Random, 95% CI) | ‐0.61 [‐1.11, ‐0.11] |
| 2.3 Life‐threatening illness | 1 | 111 | Std. Mean Difference (IV, Random, 95% CI) | ‐0.12 [‐0.50, 0.26] |
| 2.4 Maltreatment | 1 | 142 | Std. Mean Difference (IV, Random, 95% CI) | ‐0.12 [‐0.45, 0.21] |
| 2.5 Natural disaster | 1 | 166 | Std. Mean Difference (IV, Random, 95% CI) | ‐1.27 [‐1.60, ‐0.94] |
| 2.6 Physical trauma | 4 | 311 | Std. Mean Difference (IV, Random, 95% CI) | ‐0.02 [‐0.29, 0.26] |
| 2.7 Sexual abuse | 2 | 76 | Std. Mean Difference (IV, Random, 95% CI) | ‐0.67 [‐1.18, ‐0.16] |
| Outcome or subgroup title | No. of studies | No. of participants | Statistical method | Effect size |
| 1 PTSD diagnosis Show forest plot | 7 | Odds Ratio (M‐H, Random, 95% CI) | Subtotals only | |
| 1.1 Symptoms not stated | 5 | 999 | Odds Ratio (M‐H, Random, 95% CI) | 0.41 [0.20, 0.83] |
| 1.2 Symptomatic | 2 | 197 | Odds Ratio (M‐H, Random, 95% CI) | 0.64 [0.32, 1.25] |
| 2 PTSD total symptoms Show forest plot | 21 | Std. Mean Difference (IV, Random, 95% CI) | Subtotals only | |
| 2.1 Symptoms not stated | 12 | 1648 | Std. Mean Difference (IV, Random, 95% CI) | ‐0.41 [‐0.68, ‐0.13] |
| 2.2 Symptomatic | 9 | 1639 | Std. Mean Difference (IV, Random, 95% CI) | ‐0.30 [‐0.53, ‐0.06] |
| Outcome or subgroup title | No. of studies | No. of participants | Statistical method | Effect size |
| 1 PTSD diagnosis Show forest plot | 7 | Odds Ratio (M‐H, Random, 95% CI) | Subtotals only | |
| 1.1 Inactive control | 5 | 1067 | Odds Ratio (M‐H, Random, 95% CI) | 0.53 [0.32, 0.88] |
| 1.2 Active control | 2 | 129 | Odds Ratio (M‐H, Random, 95% CI) | 0.23 [0.05, 1.14] |
| 2 PTSD total symptoms Show forest plot | 21 | Std. Mean Difference (IV, Random, 95% CI) | Subtotals only | |
| 2.1 Inactive control | 15 | 2856 | Std. Mean Difference (IV, Random, 95% CI) | ‐0.40 [‐0.61, ‐0.19] |
| 2.2 Active control | 6 | 431 | Std. Mean Difference (IV, Random, 95% CI) | ‐0.25 [‐0.58, 0.09] |
| Outcome or subgroup title | No. of studies | No. of participants | Statistical method | Effect size |
| 1 PTSD diagnosis Show forest plot | 7 | Odds Ratio (M‐H, Random, 95% CI) | Subtotals only | |
| 1.1 Best case | 7 | 1282 | Odds Ratio (M‐H, Random, 95% CI) | 0.52 [0.28, 0.99] |
| 1.2 Worst case | 7 | 1252 | Odds Ratio (M‐H, Random, 95% CI) | 0.64 [0.42, 0.98] |
| Outcome or subgroup title | No. of studies | No. of participants | Statistical method | Effect size |
| 1 PTSD diagnosis Show forest plot | 7 | Odds Ratio (M‐H, Random, 95% CI) | Subtotals only | |
| 1.1 Cluster‐randomised | 4 | 935 | Odds Ratio (M‐H, Random, 95% CI) | 0.46 [0.27, 0.76] |
| 1.2 Individuals randomised | 3 | 261 | Odds Ratio (M‐H, Random, 95% CI) | 0.47 [0.10, 2.19] |
| 2 PTSD total symptoms Show forest plot | 20 | Std. Mean Difference (IV, Random, 95% CI) | Subtotals only | |
| 2.1 Cluster‐randomised | 7 | 2063 | Std. Mean Difference (IV, Random, 95% CI) | ‐0.40 [‐0.71, ‐0.10] |
| 2.2 Individuals randomised | 13 | 1172 | Std. Mean Difference (IV, Random, 95% CI) | ‐0.22 [‐0.38, ‐0.06] |
| Outcome or subgroup title | No. of studies | No. of participants | Statistical method | Effect size |
| 1 PTSD diagnosis Show forest plot | 7 | Odds Ratio (M‐H, Random, 95% CI) | Subtotals only | |
| 1.1 Unclear risk | 1 | 64 | Odds Ratio (M‐H, Random, 95% CI) | 0.56 [0.09, 3.62] |
| 1.2 High risk | 6 | 1132 | Odds Ratio (M‐H, Random, 95% CI) | 0.46 [0.27, 0.79] |
| 2 PTSD total symptoms Show forest plot | 21 | Std. Mean Difference (IV, Random, 95% CI) | Subtotals only | |
| 2.1 Unclear risk | 1 | 64 | Std. Mean Difference (IV, Random, 95% CI) | 0.23 [‐0.26, 0.72] |
| 2.2 High risk | 20 | 3223 | Std. Mean Difference (IV, Random, 95% CI) | ‐0.39 [‐0.57, ‐0.20] |
| Outcome or subgroup title | No. of studies | No. of participants | Statistical method | Effect size |
| 1 PTSD diagnosis Show forest plot | 7 | Odds Ratio (M‐H, Random, 95% CI) | Subtotals only | |
| 1.1 Low risk | 2 | 197 | Odds Ratio (M‐H, Random, 95% CI) | 0.41 [0.04, 4.68] |
| 1.2 Unclear risk | 1 | 64 | Odds Ratio (M‐H, Random, 95% CI) | 0.56 [0.09, 3.62] |
| 1.3 High risk | 4 | 935 | Odds Ratio (M‐H, Random, 95% CI) | 0.46 [0.27, 0.76] |
| 2 PTSD total symptoms Show forest plot | 21 | Std. Mean Difference (IV, Random, 95% CI) | Subtotals only | |
| 2.1 Low risk | 1 | 132 | Std. Mean Difference (IV, Random, 95% CI) | ‐0.05 [‐0.39, 0.30] |
| 2.2 Unclear risk | 2 | 191 | Std. Mean Difference (IV, Random, 95% CI) | ‐0.03 [‐0.46, 0.40] |
| 2.3 High risk | 18 | 2964 | Std. Mean Difference (IV, Random, 95% CI) | ‐0.42 [‐0.62, ‐0.22] |
| Outcome or subgroup title | No. of studies | No. of participants | Statistical method | Effect size |
| 1 PTSD diagnosis Show forest plot | 7 | Odds Ratio (M‐H, Random, 95% CI) | Subtotals only | |
| 1.1 Low risk | 2 | 320 | Odds Ratio (M‐H, Random, 95% CI) | 0.27 [0.11, 0.65] |
| 1.2 Unclear risk | 3 | 329 | Odds Ratio (M‐H, Random, 95% CI) | 0.79 [0.45, 1.38] |
| 1.3 High risk | 2 | 547 | Odds Ratio (M‐H, Random, 95% CI) | 0.32 [0.06, 1.60] |
| 2 PTSD total symptoms Show forest plot | 21 | Std. Mean Difference (IV, Random, 95% CI) | Subtotals only | |
| 2.1 Low risk | 7 | 1410 | Std. Mean Difference (IV, Random, 95% CI) | ‐0.38 [‐0.75, ‐0.01] |
| 2.2 Unclear risk | 9 | 1046 | Std. Mean Difference (IV, Random, 95% CI) | ‐0.36 [‐0.67, ‐0.05] |
| 2.3 High risk | 5 | 831 | Std. Mean Difference (IV, Random, 95% CI) | ‐0.30 [‐0.53, ‐0.06] |
| Outcome or subgroup title | No. of studies | No. of participants | Statistical method | Effect size |
| 1 PTSD diagnosis Show forest plot | 7 | Odds Ratio (M‐H, Random, 95% CI) | Subtotals only | |
| 1.1 Low risk | 4 | 516 | Odds Ratio (M‐H, Random, 95% CI) | 0.46 [0.18, 1.15] |
| 1.2 Unclear risk | 2 | 547 | Odds Ratio (M‐H, Random, 95% CI) | 0.32 [0.06, 1.60] |
| 1.3 High risk | 1 | 133 | Odds Ratio (M‐H, Random, 95% CI) | 0.65 [0.32, 1.33] |
| 2 PTSD total symptoms Show forest plot | 21 | Std. Mean Difference (IV, Random, 95% CI) | Subtotals only | |
| 2.1 Low risk | 8 | 874 | Std. Mean Difference (IV, Random, 95% CI) | ‐0.57 [‐0.97, ‐0.17] |
| 2.2 Unclear risk | 13 | 2413 | Std. Mean Difference (IV, Random, 95% CI) | ‐0.22 [‐0.39, ‐0.06] |