Intervensi untuk meningkatkan kepatuhan terapi kelasi besi dalam kalangan orang dengan penyakit sel sabit atau talasemia
Referencias
References to studies included in this review
References to studies excluded from this review
References to studies awaiting assessment
References to ongoing studies
Additional references
References to other published versions of this review
Characteristics of studies
Characteristics of included studies [ordered by study ID]
| Methods | Study design: single‐centre RCT Study grouping: parallel group | |
| Participants | Baseline characteristics DFP, DFO
DFP
Inclusion criteria: iron‐overloaded people with thalassaemia at least 4 years old Exclusion criteria: lack of compliance, known toxicity or intolerance preventing therapy with DFO and DFP, neutropenia (neutrophils < 1.5×10⁹/L), thrombocytopenia (platelets < 100×109/L), renal, hepatic or decompensated heart failure, active viral illness being treated with interferon‐α/ribavirin, repeated Yersinia infections, HIV–positivity, pregnancy or nursing, and patients of reproductive age not taking adequate contraceptive precautions | |
| Interventions | Treatment arm: DFO (50 mg/kg/day subcutaneously twice weekly (mean (SD) dose: 43.8 (2.8) mg/kg)) combined with DFP (75 mg/kg/day, daily (mean (SD) dose: 78.2 (1.4) mg/kg/day)) | |
| Outcomes | Adherence: compliance was assessed by drug accounting at each visit (by counting the returned empty blisters of DFP and used vials of DFO) as well as by a trial‐specific questionnaire completed by the participants and/or their legal representative/guardian at quarterly intervals. The same questionnaire also served for the assessment of tolerance to treatment and QoL Trial‐reported outcomes 1. Changes in LIC and SF (primary outcome) | |
| Identification | Source of funding: none stated although the drugs were supplied by Lipomed AG, Switzerland | |
| Notes | All participants had prior exposure to DFO (dose, schedule and duration were not reported) and all had a washout period of 2 weeks with no iron chelation before initiating trial treatment Country: Turkey | |
| Risk of bias | ||
| Bias | Authors' judgement | Support for judgement |
| Random sequence generation (selection bias) | Low risk | "The randomization sequence was generated by the Department of Mathematical Statistics at the University of Berne, Switzerland according to local policy". Following central registration of a subject by the investigator, the trial co‐ordinator assigned the intervention according to the randomisation sequence |
| Allocation concealment (selection bias) | High risk | The trial report states that the intervention was assigned according to the randomisation sequence “without concealing the sequence prior to allocation” |
| Blinding of participants and personnel (performance bias) | High risk | The authors did not report any information as to whether participants, personnel were blinded to treatment allocation but one treatment subcutaneous and other oral so difficult to blind |
| Blinding of outcome assessment (detection bias) | Unclear risk | The authors did not report any information as to whether outcome assessors were blinded to treatment allocation |
| Incomplete outcome data (attrition bias) | High risk | There was an imbalance in missing data across the treatment arms. 4 participants from the comparator group (DFO) were not included in the outcome analysis: 2 withdrew consent due to refusal to take DFO; 1 died from arrhythmia induced congestive heart failure at start of trial; and 1 developed agranulocytosis at week 14 |
| Selective reporting (reporting bias) | Low risk | All outcomes were reported |
| Other bias | Unclear risk | There is an imbalance in baseline LIC and Ferritin between groups |
| Methods | Study design: RCT Study grouping: parallel group Length of trial or follow‐up not stated. Not stated if open label; but no mention of blinding and DFO is infusion versus tablet | |
| Participants | Baseline characteristics DFP, DFO
DFP
DFO
Inclusion criteria: 8 years, RBC transfusion every 3 to 4 weeks, on DFO prior to study as single therapy. Exclusion criteria: not stated Participants PRBCs /3 – 4 weeks to maintain Hb > 9 g/dL | |
| Interventions | DFP, DFO
DFP
DFO
| |
| Outcomes | Adherence to iron chelation therapy rates Questionnaire on chelation therapy, reasons for non‐compliance, side effects, life activities, transfusion regimen Trial‐reported outcomes 1. CBC monthly 2. SF levels 3. liver and kidney functions 4. blood glucose level 5. serum calcium and phosphorus/3 months and T3, T4,TSH, LH, FSH 6. echocardiography 7. bone density 8. auditory and visual examination twice | |
| Identification | Sponsorship source: Zagazig University Hospital, Zagazig Country: Egypt Setting: University Hospital Comments: Abstract Poster 124 Authors name: Sherif Badawy Institution: Ann Robert H. Lurie Children’s Hospital of Chicago Email: [email protected] Address: Ann Robert H. Lurie Children’s Hospital of Chicago Northwestern University Feinberg School of Medicine225 East Chicago Avenue, Box 30, Chicago, Illinois 60611‐2605 | |
| Notes | Contacted author and study data not available at this time. Sample‐size calculation not reported | |
| Risk of bias | ||
| Bias | Authors' judgement | Support for judgement |
| Random sequence generation (selection bias) | Unclear risk | Judgement comment: no description of sequence generation |
| Allocation concealment (selection bias) | Unclear risk | Judgement comment: no description of allocation concealment |
| Blinding of participants and personnel (performance bias) | High risk | Judgement comment no description, but one drug is subcutaneous injection (DFO). Open label |
| Blinding of outcome assessment (detection bias) | Unclear risk | Judgement comment: no description of blinding of assessors |
| Incomplete outcome data (attrition bias) | High risk | Judgement comment: no data on number of participants who completed the study and how many in each group experienced complications. Lack of detail on number of compliant or non‐compliant participants |
| Selective reporting (reporting bias) | High risk | Judgement comment: not clear which groups and how many experienced adverse events. No data reported on SF or other outcomes |
| Other bias | Unclear risk | Judgement comment: results of the trial were not published in detail and no data available when authors were contacted |
| Methods | Study design: single‐centre RCT Study grouping: parallel group Study duration: 6 months | |
| Participants | Baseline characteristics Comprehensive medication management
Standard care (as defined in the trial)
Inclusion criteria: transfusion‐dependent children with β‐thalassaemia major aged 8 to 18 years with SF level of more than 1000 µg/L Exclusion criteria: people with cognitive impairment | |
| Interventions | Comprehensive medication management
Standard care (as defined in the trial)
| |
| Outcomes | Adherence to iron chelation therapy rates "DRP identification: The clinical pharmacist analysed the collected data to detect whether any DRPs existed and allocated them to one of the seven categories as classified by Cipolle et al. [18]: unnecessary drug therapy, need for additional drug therapy, ineffective drug product, dosage too low, adverse drug reaction, dosage too high, non‐compliance" Trial‐reported outcomes 1. SF levels were measured at baseline, 3 months and after 6 months 2. CBC with WBC differential was assessed at every visit, and SCr and ALT were measured routinely for all the participants every 3 months 3. Health‐related QoL was assessed at baseline and at the end of the trial (after 6 months) using PedsQL™ 4.0 Generic Core Scale questionnaire. PedsQL is a 23‐item multidimensional model with 4 domains for paediatric health‐related QoL measurement: physical functioning (8 items), emotional functioning (5 items), social functioning (5 items) and school functioning (5 items) (19). | |
| Identification | Sponsorship source: not stated Country: Egypt Setting: Hematology clinic Authors name: Lamia El Wakeel Institution: Pediatric Hematology Clinic, Children’s Hospital, Ain Shams University, Email: [email protected] Address: Lamia El Wakeel, Pediatric Hematology Clinic, Children’s Hospital, AinShams University, 4, Street 292 New Maadi, Cairo, Egypt | |
| Notes | Sample‐size calculation not reported. | |
| Risk of bias | ||
| Bias | Authors' judgement | Support for judgement |
| Random sequence generation (selection bias) | Unclear risk | Quote: "The study was a prospective, randomized, controlled study. It was conducted on pediatric BTM patients admitted to the Pediatric Hematology Clinic," Stratified randomization was used considering the iron chelation therapy as the stratification factor Judgement comment: no description of how randomisation was done or by whom |
| Allocation concealment (selection bias) | Unclear risk | The control group (n = 24) received standard medical care by a physician while the intervention group received standard medical care plus clinical pharmacist‐provided services. Judgement comment: no description of how participants were allocated to the pharmacist intervention or standard care |
| Blinding of participants and personnel (performance bias) | High risk | Judgement comment: not possible to blind a pharmacist intervention versus no pharmacist intervention |
| Blinding of outcome assessment (detection bias) | High risk | Judgement comment: no indication that outcome assessors where different from pharmacists who implemented the intervention. Also most outcomes were reported only in the intervention group except for ferritin levels and health‐related QoL |
| Incomplete outcome data (attrition bias) | High risk | Judgement comment: all drug‐related outcomes were only reported in the intervention group including adherence ‐ no comparative data available. Multiple interventions in small number of participants |
| Selective reporting (reporting bias) | High risk | Judgement comment: drug‐related outcomes reported only in intervention group. No comparative data. The participants within the intervention arm seem to have complex and multiple changes. Difficult to tease out the actual intervention that effected a change |
| Other bias | Unclear risk | Judgement comment: small sample size and only report intervention group |
| Methods | Study design: RCT Study grouping: parallel group This trial was designed as a 5‐year, multicentre, randomised, open‐label trial with blinded data management and data analyses to evaluate whether the DFP treatment is superior to the DFO treatment Follow‐up after trial. An additional 5 years of follow‐up after the end of the trial was planned to collect data on the survival, cause of death and chelation treatment of this cohort of participants. During this period, the participants were allowed to change their chelation treatment | |
| Participants | Baseline characteristics DFP
DFO
Inclusion criteria: people with thalassaemia intermedia (based on clinical and molecular criteria), SF between 800 and 3000 µg/L, 13 years of age, consent from patient or parent or guardian (if 13 to 18) Exclusion criteria: known intolerance to treatment, platelet count < 100 ×109/L, white cell count of < 3 ×10⁹/L, severe liver damage, sepsis or heart failure (or both) Pretreatment: none of the participants in the DFP group and 8 in the DFO group withdrew from the trial. 1 participant in the DFP group and 3 in the DFO group changed their chelation therapy (P value = 0.357) If the participants were treated with a subcutaneous administration of DFO (30 ‐ 50 mg/kg per day, 8 – 12 hours for 5 days a week) before inclusion in the trial, a DFO washout was executed for 1 week before randomisation.The minimum number of participants required for each treatment group was calculated, assuming equal allocation under the hypothesis of equality between the 2 treatment groups at each point during the course.The recommended number of participants was 30. One participant in the DFP group and 3 in the DFO group changed their chelation therapy | |
| Interventions | DFP
DFO
Treatment failure was defined as an increase in the SF level to greater than 1000 lg/L from baseline, confirmed by at least 2 consecutive determinations. Participants who failed were switched to the alternative treatment and followed until the end of the trial. The criteria for a dosage reduction to 50 mg/kg of DFP per day were arthralgia and nausea, and the criterion for a reduction to 30 mg/kg of DFO per day was a local reaction at the site of infusion. Both treatments were reduced if the ferritin levels for 2 consecutive determinations were less than 400 lg/L. The treatment was resumed when the ferritin levels were greater than 700 lg/L for at least 2 determinations | |
| Outcomes | Adherence to iron chelation therapy rates Compliance was assessed by counting the number of DFP pills in each returned bag and by assessing the number of infusions of DFO registered on the electronic pump Trial‐reported outcomes 2. The secondary endpoints were safety and survival analysis after 5 years | |
| Identification | Sponsorship source: contract grant sponsor: Franco and Piera Cutino Foundation Country: Italy (17 centres) Setting: haematology and thalassaemia clinical centres at institutions Recruitment: January 2001 to January 2006 Trial registration: NCT00733811 Authors name: Aurelio Maggio Institution: Unita Operativa Complessa Ematologia II, Email: [email protected] Address: U.O.C. Ematologia II, A.O.R. “Villa Sofia – V. Cervello”, Palermo, Italy | |
| Notes | Sample‐size calculation reported for primary outcome Notes: 9 participants changed from DFP therapy 5 to DFO 2 to none 1 to DFX 1 to 6 participants changed from DFO therapy 4 to DFP | |
| Risk of bias | ||
| Bias | Authors' judgement | Support for judgement |
| Random sequence generation (selection bias) | Low risk | Quote: "The randomization sequence was based on a computer‐ randomized list arranged in permuted blocks of 10 with a 1:1 ratio." |
| Allocation concealment (selection bias) | Low risk | To ensure for allocation concealment, treatments were assigned by telephone contact from the coordinating centre. The sequence was concealed until the interventions were assigned. Randomization was performed for each consecutive patient after verification of the exclusion criteria |
| Blinding of participants and personnel (performance bias) | High risk | Quote: "open‐label trial" Judgement comment: 1 of 2 arms was desferal pump infusers, participants would know. Participants on DFO attended for weekly blood tests. |
| Blinding of outcome assessment (detection bias) | Low risk | Quote: "with blinded data management and data analysis" |
| Incomplete outcome data (attrition bias) | Low risk | No loss to follow‐up for 5‐year trial |
| Selective reporting (reporting bias) | Low risk | All outcomes reported |
| Other bias | Unclear risk | Unclear how participant variation relating to SF levels may have had effect on results. Although all outcomes were reported for the 5 year trial in the 5 years of follow‐up only mortality was reported |
| Methods | Study design: single‐centre RCT Study grouping: parallel group, follow‐up for 54 weeks | |
| Participants | Baseline characteristics DFP/DFO
DFP
DFO
Inclusion criteria: males or females with thalassaemia major attending the Hematology Clinic at Cairo University Children Hospital; participants had to be iron overloaded with transfusion dependency and older than 4 years of age Exclusion criteria: known to have DFP or DFO toxicity; neutrophil count less than 1.5×10⁹/L; platelet count less than 100×109/L; renal or hepatic insufficiency; decompensated heart failure; without contraceptive precaution; pregnant or nursing | |
| Interventions | DFP/DFO
DFP
DFO
| |
| Outcomes | Adherence to iron chelation therapy rates Compliance was assessed by performing a drug accounting at each patient visit by counting the returned empty blisters of DFP and used vials of DFO Trial‐reported outcomes 1. Incidence of chelation therapy‐related SAEs (reported in AEs) 2. Iron overload defined by ferritin over 1000 µg/L and/or clinical symptoms and/or signs of iron overload and/or need for medically indicated additional or change in chelation therapy (mean ferritin levels extrapolated from graph ‐ no SD provided) 3. Other AEs related to iron chelation (in this trial participants with an event are reported. 1 person could experience more than 1 event) 4. LIC mg/g dry weight (change from baseline (extrapolated from graph Least squares means / lower and upper value)) | |
| Identification | Sponsorship source Country: Egypt Setting: Hematology Clinic at Cairo University Children Hospital, Egypt Comments: 2 authors from Lipomed (DFP): C. Manz : C. Tarabishi Clinical Research Development, Lipomed AG, Arlesheim, Switzerland Authors name: A. El‐Beshlawy Institution: Faculty of Medicine, Cairo University, Email: [email protected] Address: Faculty of Medicine, Cairo University, 32 Falaky Street, Bab El‐Louk, Cairo, Egypt | |
| Notes | Sample‐size calculation reported | |
| Risk of bias | ||
| Bias | Authors' judgement | Support for judgement |
| Random sequence generation (selection bias) | Unclear risk | Judgement comment: no description of how randomisation was accomplished: The participants were randomly assigned into 1 of 3 treatment arms |
| Allocation concealment (selection bias) | Unclear risk | Judgement comment: no description of allocation concealment |
| Blinding of participants and personnel (performance bias) | High risk | No mention of blinding ‐ since DFO is an injection and DFP is oral likely participants and personnel not blinded |
| Blinding of outcome assessment (detection bias) | Unclear risk | Judgement comment: no blinding mentioned |
| Incomplete outcome data (attrition bias) | High risk | Judgement comment: a total of 10 participants dropped out of the trial as a result of several complications. Only 56 participants completed 54 weeks of treatment. Evaluation of LIC could not be done in another 8 participants. Reports on per protocol participants |
| Selective reporting (reporting bias) | High risk | Compliance not reported as number or percentage of participants compliant throughout trial: "Four patients, all treated with DFO‐based regimen, were excluded from the study due to lack of compliance. Compliance was otherwise excellent during the entire study. The majority of patients had no problems with the intake and swallowing of the DFP tablets. By contrast, 80% of patients in the combination arm and 76% of patients in the DFO monotherapy arm complained about difficulties in the parenteral use of DFO or problems to insert a needle", SF and LIC are partially reported in charts and no actual numbers are provided in the text. Also the focus on UIE over LIC and SF measures is misleading as DFP is known to have a higher UIE but this can be highly variable over multiple measurements. LIC is the gold standard and there was no difference in this outcome between groups. |
| Other bias | Unclear risk | There was a higher incidence of AEs in the combined group and the DFP group versus the DFO group |
| Methods | Study design: RCT in 2 treatment centres Study grouping: parallel group Study duration: 1 year | |
| Participants | Baseline characteristics Group A: DFP/DFO
Group B: DFP/DFX
Inclusion criteria: people with β‐thalassaemia major aged 10 – 18 years with severe iron overload defined as: ferritin > 2500 μg/L on maximum tolerated dose of a single iron chelator with up trend of ferritin over the last 12 months prior to the study. People with LIC more than 7 mg/g by MRI R2* and mean cardiac T2* less than 20 and more than 6 ms calculated as geometric mean without clinical symptoms of cardiac dysfunction (shortness of breath at rest or exertion, orthopnoea, exercise intolerance, lower extremity oedema, arrhythmias). Adequacy of prior chelation defined as taking 75% of the calculated dose/month on maximum tolerated dose with upward ferritin trend Exclusion criteria: past history of agranulocytosis, clinically significant GI or renal disease, clinical cardiac disease, or with LVEF < 50% on baseline echocardiography; evidence of active hepatitis or serum transaminases > 3 times above ULN or renal impairment (serum creatinine > ULN) participation in a previous investigational drug study within the 30 days preceding screening, known allergy to DFX, DFP, and DFO. Pre‐treatment: baseline difference in mean Hb (P 0.004) | |
| Interventions | DFP/DFO
DFP/DFX
To achieve an acceptable treatment washout, chelation therapy was withdrawn for 2 weeks before randomisation, after verifying inclusion and exclusion criteria. The transfusion regimen aimed to maintain the participants pre‐transfusion Hb ≥80 g/L by receiving approximately 15 mL/kg packed RBCs every 3 – 4 weeks | |
| Outcomes | Adherence to iron chelation therapy rates Compliance was evaluated by counting of returned tablets for the oral chelators and of the vials for DFO. The percentage of actual dose that participant had taken in relation to the total prescribed dose was calculated Trial‐reported outcomes 1. % change in SF (from baseline to the end of trial) 2. % change in LIC (from baseline to the end of trial) 3. % change in cardiac MRI (from baseline to the end of trial) 4. SAEs and AEs (safety assessment) 5. Compliance 6. Satisfaction 7. QoL | |
| Identification | Sponsorship source: Ain Shams University Country: Egypt and Oman Setting: Thalassemia treatment centres (Ain Shams University, Egypt and Sultan Qaboos University Hospital, Oman) Comments: Government Clinical Trial NCT01511848 Authors name: Amira Abdel Moneam Adly, Institution: Department of Pediatrics, Ain Shams University, Cairo, Egypt Email: [email protected] Address: 6 A ElSheshini street, Shoubra, Soudia buildings, Cairo, Egypt | |
| Notes | The chelation regimens in the last year prior to the trial were daily DFX (14 participants), daily DFP (29 participants), and DFP 4 days/week alternating with subcutaneous DFO 3 days/week (53 participants) Sample‐size calculation reported | |
| Risk of bias | ||
| Bias | Authors' judgement | Support for judgement |
| Random sequence generation (selection bias) | Low risk | Quote: "The randomisation sequence was based on a computer randomised list in permuted blocks of 10 with a 1 : 1 ratio, generated at both University of Ain Shams and Sultan Qaboos" |
| Allocation concealment (selection bias) | Low risk | Quote: "To ensure no allocation bias, treatment group was assigned by telephone contact from the coordinating center in Ain Shams" |
| Blinding of participants and personnel (performance bias) | High risk | Oral versus subcutaneous medication therefore participants would be aware which medication arm they had been randomised to |
| Blinding of outcome assessment (detection bias) | Low risk | Quote: "open‐label study with blinded data management and data analyses" |
| Incomplete outcome data (attrition bias) | Low risk | Judgement comment: treatment was started within the following 24 hr, and all the included participants continued till the end of study with no participants were lost follow‐up |
| Selective reporting (reporting bias) | Unclear risk | Judgement comment: provide only P values for patient satisfaction, satisfaction with ICT self‐reported satisfaction and all 'significantly' higher in group B; no actual end of trial data provided (mean (SD)). All outcomes are reported |
| Other bias | Unclear risk | Judgement comment: it is not clear how the investigators would have known that infections, GI disorders or skin disorders were not related to the drug therapies |
| Methods | Study Design: 2‐arm parallel RCT conducted in Italy and Greece | |
| Participants | DFP/DFO
DFP/DFO
Inclusion criteria: participants were 10 years or older with a diagnosis of thalassaemia major undergoing iron chelation therapy with subcutaneous DFO, with a SF value between 1000 ‐ 4000 μg/L over the previous year. Exclusion criteria: not reported | |
| Interventions | DFO: 20 ‐ 60 mg/kg/day subcutaneously on 5 ‐ 7 days a week (mean (SD) dose at baseline: 34.8 (8.9) mg/kg/day and at end of trial: 37.8 (8.9) mg/kg/day)) | |
| Outcomes | Adherence see compliance below Trial‐reported outcomes 1. SF change at 1 year | |
| Identification | Source of funding: Apotex Research Inc, Toronto, Canada. The last author of the study is an Apotex employee | |
| Notes | The trial inferred that participants had previously received DFO treatment but no details as to dose, schedule or duration were reported | |
| Risk of bias | ||
| Bias | Authors' judgement | Support for judgement |
| Random sequence generation (selection bias) | Unclear risk | The authors did not report any information about how randomisation was undertaken |
| Allocation concealment (selection bias) | Unclear risk | The authors did not report any information about how treatment allocation was concealed |
| Blinding of participants and personnel (performance bias) | Unclear risk | The authors did not report any information as to whether participants, personnel or outcome assessors were blinded to treatment allocation |
| Blinding of outcome assessment (detection bias) | Unclear risk | The authors did not report any information as to whether outcome assessors were blinded to treatment allocation |
| Incomplete outcome data (attrition bias) | Low risk | Although 1 participant in the treatment group was withdrawn due to intolerance to DFP, this is unlikely to effect the findings of the trial |
| Selective reporting (reporting bias) | Unclear risk | Compliance to DFP was pre‐specified as an outcome but was not measured or reported in the manuscript |
| Other bias | Low risk | The trial appears to be free of other sources of bias |
| Methods | Study design: single‐centre RCT Study grouping: parallel group Trial duration: September 2014 to September 2015 | |
| Participants | Baseline characteristics DFX
DFO
Inclusion criteria: transfusion‐dependent β‐thalassaemia major, ages were ≥ 6 years, and they had SF levels greater than 1500 µg/L and were on irregular subcutaneous DFO chelation therapy Exclusion criteria: serum creatinine above the upper age‐related normal range, significant proteinuria (urinary protein/creatinine ratio 1.0 in a non–first‐void urine sample at baseline), elevated ALT more than 3‐fold of the ULN, GI diseases, clinically relevant auditory and/or ocular toxicity related to iron chelation therapy, cardiac disease, and/or SAEs with DFO or DFX, and absolute heutrophilic count 1500/mm3 or platelet count 100,000/mm3 Pre‐treatment: significant difference between the 2 groups with participants having splenectomy 4 in DFX group compared to 17 in DFO group (P = 0.001), hepatitis C status 2 in DFX group compared to 11 in DFO group (P = 0.005) and baseline ALT baseline mean of 28.2 in the DFX group compared to 46.1 in the DFO group (P = 0.001) | |
| Interventions | DFX
DFO
7‐day washout phase | |
| Outcomes | Adherence to iron chelation therapy rates During the study, we kept records of all dosages administered, all study medications that were dispensed and returned, and intervals between visits to determine compliance with the treatment. The patients’ parents were instructed to contact the investigator if the patients were unable to take the study drug as prescribed Trial‐reported outcomes 1. decrease in the SF level to < 1500 μg/L 2. Safety of the drugs that were used | |
| Identification | Sponsorship source: not stated Country: Egypt Setting: out‐patient paediatric hematology clinic Al‐ Hussein University Hospital, Al‐Azhar University, Cairo, Egypt Comments: no conflict of interest. Authors name: Dr Omar Atef Tolba Institution: Cairo University Children's Hospital Email: [email protected] Address: Dr Omar Atef Tolba, Cairo University Children's Hospital, Department of Pediatrics, Cairo University, Egypt. Tel: +201222101717, +20233025539, Fax: +20233025539 There is no conflict of interest declared | |
| Notes | Sample‐size calculation not reported | |
| Risk of bias | ||
| Bias | Authors' judgement | Support for judgement |
| Random sequence generation (selection bias) | Unclear risk | Quote: "the patients were randomized in a 1:1 ratio based on permuted blocks to receive deferasirox (DFX) or deferoxamine (DFO) for one year." Judgement comment: it is unclear risk as there is imbalance in the groups on several variables |
| Allocation concealment (selection bias) | Unclear risk | Judgement comment: allocation concealment not described and imbalance between groups |
| Blinding of participants and personnel (performance bias) | High risk | Judgement comment: oral tablet versus subcutaneous infusion ‐ unable to blind participants or personnel |
| Blinding of outcome assessment (detection bias) | High risk | Quote: "During the study, we kept records of all dosages administered, all study medications that were dispensed and returned, and intervals between visits to determine compliance with the treatment." Judgement Comment: Does not state if outcome assessors were blinded. Assessors would be aware the treatment participants were on. |
| Incomplete outcome data (attrition bias) | Low risk | Quote: "no discontinuation of drugs or drop‐out of follow‐up occurred." |
| Selective reporting (reporting bias) | High risk | Quote: "Post‐treatment levels of ALT and AST were significantly higher in the DFO group (p = 0.022, p = 0.020, respectively), both drugs have comparable safety profiles, as the adverse effects noted did not reach clinical significance or lead to discontinuation of treatment with either agent. In the light of the comparable efficacy and safety of both agents for the reduction of iron overload, as was reported in the monotherapy of patients with transfusion‐dependent thalassaemia (31, 32), the oral preparation merits convenience and therefore patient compliance and adherence to treatment regimen that needs to be taken on a long‐term basis." "The oral DFX is recommended due to more convenience to assure adherence to treatment regimen." Judgement comment: the data within this trial do not provide evidence that DFX assures adherence. Pre‐treatment ALT, AST were also higher in the DFO group ‐ and also reflects imbalance in randomisation. Most outcomes vaguely reported (i.e. compliance ‐ not percentages even though did a count and closely monitored). Also not clear if all drug‐related AEs reported (i.e. agranulocytosis). Further the evidence is uncertain from this trial that both drugs of comparable efficacy and safety |
| Other bias | Unclear risk | Small trial N = 60 and short‐term follow‐up. Sample‐size calculation not reported, and single‐centre trial |
| Methods | Study design: multicentre RCT Study grouping: parallel group Consecutive thalassaemia major participants (n = 275) were observed at the 25 SoSTE centres from September 30, 2000 to January 31, 2008 9 participants did not meet inclusion criteria and 53 patients declined to participate. The remaining 213 participants were included; 105 and 108 respectively, were randomly allocated to DFP–DFO sequential treatment or DFP alone (Fig 1). None of the participants were lost to follow‐up Study duration: 5 year follow‐up | |
| Participants | Baseline characteristics DFP/DFO
DFP
Inclusion criteria: thalassaemia major, SF between 800 and 3000 ug/L over 13 years of age Exclusion criteria: known intolerance treatment, platelet count 100 x 109/l or leucocyte count 3.0 x 10⁹/l, severe liver damage, heart failure | |
| Interventions | DFP/DFO
DFP
| |
| Outcomes | Adherence Compliance was assessed by counting the pills in each returned bag of DFP and by assessing the number of infusions of DFO registered on the electronic pump Trial‐reported outcomes 1. Difference between multiple observations of SF concentrations during the 5‐year treatment. A correlation between LIC and SF levels has previously been shown in cohort of people with thalassaemia major treated with DFP (Olivieri et al, 1995). 2. Survival analysis 3. AEs 4. Costs 5. Multislice‐multiecho T2* MRI scan, available since June 2004, was used in a subgroup of participants to evaluate variations in the iron content of the heart and liver during the trial | |
| Identification | Sponsorship source: Italian Society for the Study of Thalassaemia and Haemoglobinopathies (SoSTE) Country: Italy Setting: 25 SoSTE centres in Italy Comments: NCT 00733811 Authors name: Aurelio Maggio Institution: A.O.V. Cervello, U.O.C. di Ematologia Email: [email protected] Address: A.O.V. Cervello, U.O.C. di Ematologia II,Cervello’’, Palermo, Italy | |
| Notes | Follow‐up was planned for 5 years; however, because of the beneficial effects, in terms of SF levels reduction in the sequential DFP–DFO group, observed after the interim analysis performed at 31 January 2008 the trial was stopped before the planned 5 years of treatment were completed for all participants years but mean (SD) duration of treatment was 2.5 (2.2) and 2.9 ( 2.1) years for DFP and sequential DFP–DFO groups, respectively Sample‐size calculation reported | |
| Risk of bias | ||
| Bias | Authors' judgement | Support for judgement |
| Random sequence generation (selection bias) | Low risk | Quote: "The randomization sequence was based on a computer‐randomized list in permuted blocks of 10 with a 1:1 ratio," Judgement comment: the randomization sequence was based on a computer‐randomized list in permuted blocks of 10 with a 1:1 ratio. The sequence was concealed until interventions were assigned. Randomization was performed per each consecutive participant after verification of the exclusion criteria |
| Allocation concealment (selection bias) | Low risk | Quote: "To ensure allocation concealment, treatment was assigned by telephone contact from the coordinating centre" |
| Blinding of participants and personnel (performance bias) | High risk | Trial was open‐label |
| Blinding of outcome assessment (detection bias) | Low risk | Quote: "All outcome assessments were done under code by physicians blinded to the trial treatment." |
| Incomplete outcome data (attrition bias) | Unclear risk | The statistical analysis was based on the 'intention‐to‐treat' principle. None of the participants were lost to follow‐up. However, SF measurements were only complete for all participants in the first year of the trial and decrease substantially thereafter to n = 32 in the combined group and n = 26 in the DFP group |
| Selective reporting (reporting bias) | Low risk | All outcomes reported |
| Other bias | Unclear risk | "Only 21 (35%) subjects in the DFP‐alone and 12 (24%) in the sequential DFP–DFO group withdrew definitely from the trial (Table V). The mean time for definitive withdrawal was 152 ± 103 (days) in DFP‐alone versus 112 ± 76 (days) in the sequential DFP–DFO group respectively." "The planned duration of treatment was 5 years. However, because of the beneficial effects, in terms of serum ferritin levels reduction in the sequential DFP–DFO group, observed after the interim analysis performed at January 31, 2008 the trial was stopped before the planned 5 years of treatment were completed for all patients. Therefore, the mean duration of treatment was 2.5 ± 2.2 and 2.9 ± 2.1 years for DFP and sequential DFP–DFO group respectively" Judgement comment: withdrawal rate is high and the trial stopped early |
| Methods | 2‐arm parallel RCT. Trial undertaken: Chronic Care Centre, Beirut, Lebanon. | |
| Participants | Number randomised: 25 (treatment group: 14; comparator group: 11) β‐thalassaemia participants, severely iron overloaded and previously poorly chelated | |
| Interventions | DFO
DFP/DFO
| |
| Outcomes | Adherence see compliance below Trial‐reported outcomes 1. Mean serum iron concentration at baseline, 6 & 12 months (primary outcome) | |
| Identification | Source of funding: not stated. | |
| Notes | Prior exposure to iron chelators: DFO, less than 4 times a week, dose and duration not reported. Sample‐size calculation not reported | |
| Risk of bias | ||
| Bias | Authors' judgement | Support for judgement |
| Random sequence generation (selection bias) | Unclear risk | The authors did not report any information about how randomisation was undertaken |
| Allocation concealment (selection bias) | Unclear risk | The authors did not report any information about how treatment allocation was concealed |
| Blinding of participants and personnel (performance bias) | Unclear risk | The authors did not report any information as to whether participants, personnel were blinded to treatment allocation |
| Blinding of outcome assessment (detection bias) | Unclear risk | The authors did not report any information as to whether outcome assessors were blinded to treatment allocation |
| Incomplete outcome data (attrition bias) | Low risk | All randomised participants were included in the analysis for all outcomes: there were no missing outcome data |
| Selective reporting (reporting bias) | High risk | Data for 2 pre‐specified outcomes were not reported in the paper: iron excretion at 1 and 12 months and renal function. Both are important clinical markers of the efficacy of iron chelation therapy |
| Other bias | Low risk | The trial appears to be free of other sources of bias |
| Methods | 2‐arm parallel RCT Trial undertaken: Hospital Centres in Toronto and Montreal, Canada. These data are from the Toronto participants only | |
| Participants | Baseline characteristics Number randomised: 64 (DFO: 32; DFP: 32) DFP (L1)
DFO
Inclusion criteria: diagnosed with homozygous β‐thalassaemia, 10 years of age or older, willing to participate in the trial Exclusion criteria:
Pre‐treatment:
| |
| Interventions | DFP (L1)
DFO
| |
| Outcomes | Adherence see adherence below Trial‐reported outcomes 1. Change in LIC (measured by SQUID or biopsy) between 12 months prior to randomisation & 24 months duration on trial treatment 2. Adherence to iron chelation therapy rates defined as per cent of doses administered (number of doses of the iron chelator taken, out of number prescribed), measured for a minimum of 3 months | |
| Identification | Sponsorship source: no sponsorship stated Country: Canada Setting: Transfusion Clinic Authors name: Nancy Olivieri Institution: University of Toronto Source of funding: not stated | |
| Notes | Prior exposure to iron chelators: not reported Sample‐size calculation not reported | |
| Risk of bias | ||
| Bias | Authors' judgement | Support for judgement |
| Random sequence generation (selection bias) | High risk | Quote: "After stratification patients by LIC (>7mg Fe/g; < 7mg Fe/g) 'patients were assigned by a research pharmacist who did not know the patients" |
| Allocation concealment (selection bias) | Unclear risk | The authors did not report any information about how treatment allocation was concealed |
| Blinding of participants and personnel (performance bias) | High risk | 1 treatment a pump and 1 treatment a tablet, participants and researchers would not be blinded to treatment |
| Blinding of outcome assessment (detection bias) | Unclear risk | The authors did not report any information as to whether outcome assessors were blinded to treatment allocation |
| Incomplete outcome data (attrition bias) | High risk | The trial analysed data from 58% of randomised participants. Of the 42% randomised participants who were not available for outcome analysis: This missing data may inappropriately affect the statistical findings of the trial |
| Selective reporting (reporting bias) | Low risk | All outcomes pre‐specified were reported in the manuscript |
| Other bias | Unclear risk | The trial was reported in an abstract, thus there are few data available to make an assessment of whether the trial was free of other bias. Trial stopped early by manufacturer |
| Methods | 2‐arm parallel RCT Trial undertaken: 4 participating centres in Italy and Greece | |
| Participants | Number randomised: 61 DFO: 32; DFP: 29 Transfusion‐dependent homozygous participants with β‐thalassaemia major | |
| Interventions | DFO
DFP
| |
| Outcomes | Adherence rates: DFP compliance was measured using the Medication Event Monitoring System device (Aardex, Zug, Switzerland) and calculated as the percent of openings with an interval longer than 4 hours recorded, divided by number of doses prescribed. DFO compliance was calculated as the percentage of completed infusions, as determined by the Crono pumps, divided by the number of infusions prescribed. Trial‐reported outcomes 1. Change over 1 year in myocardial T2* (primary outcome) | |
| Identification | Trial sponsor: Apotex (manufacturer of DFP) | |
| Notes | Prior exposure to iron chelators: DFO at a mean (SD) dose of 39 (8) mg/kg/day for 5 ‐ 7 days/week Sample‐size calculation reported | |
| Risk of bias | ||
| Bias | Authors' judgement | Support for judgement |
| Random sequence generation (selection bias) | Unclear risk | The authors did not report any information about how randomisation was undertaken |
| Allocation concealment (selection bias) | Unclear risk | The authors did not report any information about whether treatment allocation was concealed |
| Blinding of participants and personnel (performance bias) | High risk | Open label one treatment subcutaneous and the other oral so not possible to mask treatments |
| Blinding of outcome assessment (detection bias) | Low risk | The primary outcome was independently measured in a different country (UK) to where the trial took place and the findings were not communicated back to the clinicians during the course of the trial |
| Incomplete outcome data (attrition bias) | Low risk | All participants were included in the analysis of the outcomes SF and AEs |
| Selective reporting (reporting bias) | High risk | The following pre‐specified outcomes were not reported in the manuscript: ANC; ALT; serum zinc levels; and serum creatinine levels |
| Other bias | High risk | There are several imbalances in baseline characteristics between the 2 interventions including a major imbalance in SF measures with the DFO group having much higher levels as well as a greater proportion of participants with severe iron overload (above 2500 µg/L) |
| Methods | Study design: RCT Study grouping: parallel group CORDELIA was a prospective, multinational, randomised, open‐label, parallel‐group, phase 2 trial. A total of 81.2% of participants (n = 160) completed 1 year of treatment | |
| Participants | "Overall, 925 patients were screened and 197 randomized. The majority of patients screened were β‐thalassemia major patients (902/925; 99.1%). Other patients who were screened and for whom underlying anaemia was captured had low/intermediate 1 myelodysplastic syndrome (n = 4), Diamond–Blackfan anaemia, β‐thalassemia intermedia, congenital dyserythropoietic anaemia, and paroxysmal nocturnal haemoglobinuria (all n = 1). Only β‐thalassemia major patients fulfilled the inclusion criteria and were enrolled in the study. A total of 81.2% of patients (n = 160) completed 1 year of treatment" Baseline characteristics DFX (Exjade)
DFO (Desferal)
Inclusion criteria: people with β‐thalassemia major, Diamond–Blackfan anaemia, low/intermediate myelodysplastic syndromes, or sideroblastic anaemia, aged ≥ 10 years with myocardial T2* 6 ‐ 20 ms, LVEF ≥ 56%, R2 MRI LIC ≥ 3 mg Fe/g dw, lifetime history of ≥ 50 units RBC transfusions, and receiving ≥10 unit/year of RBC transfusions Exclusion criteria: participants with serum creatinine above the ULN or significant proteinuria (urinary protein/creatinine ratio ≥1.0 mg/mg in a non–first‐void urine sample at baseline; people with ALT 5 x the ULN only if their LIC was 10 mg Fe/g dw; considerable impaired GI function or GI disease; history of clinically relevant ocular and/or auditory toxicity related to iron chelation; therapy, and history of HIV seropositivity or malignancy within the past 5 years; clinical symptoms of cardiac dysfunction (shortness of breath at rest or exertion, orthopnoea, exercise intolerance, lower‐extremity edema, arrhythmias) | |
| Interventions | DFX (Exjade)
DFO (Desferal)
Mean actual dose over 1‐year treatment was 36.7 6 4.2 mg/kg per day DFX (range, 19.7‐ 43.3 mg/kg per day). Mean actual dose of DFO was 41.5 6 8.7 (13.2 ‐ 60.2) mg/kg per day, when normalized to a 7‐day regimen | |
| Outcomes | Adherence to iron chelation therapy rates: not stated how adherence was measured Trial‐reported outcomes 1. Ratio of Gmean myocardial T2* after 1 year of treatment with DFX divided by the ratio of Gmean for DFO 3. Absolute change from baseline in LIC after 1‐year treatment 4. Absolute change from baseline in SF after 1‐year treatment | |
| Identification | Sponsorship source: Novartis Pharma AG Country: multinational, 11 countries Setting: 22 centres across 11 countries Comments: the authors thank Debbi Gorman of Mudskipper Business Ltd for medical editorial assistance. Financial support for medical editorial assistance was provided by Novartis Pharmaceuticals Authors name: Dudley J. Pennell Institution: National Institute for Health, Research Cardiovascular Biomedical Research Unit Email: [email protected] Address: National Institute for Health Research Cardiovascular Biomedical Research Unit, Royal Brompton Hospital, Sydney Street, London, SW3 6NP, UK | |
| Notes | Novartis Pharmaceuticals Corporation (East Hanover, NJ, USA) co‐ordinated the design and execution of this trial and contributed to the analysis and interpretation of the trial data. Novartis Pharmaceuticals Corporation also collaborated with the external authors to assist in the development and approval of the manuscript for publication | |
| Risk of bias | ||
| Bias | Authors' judgement | Support for judgement |
| Random sequence generation (selection bias) | Low risk | Quote: "22 centers across 11 countries. Following a 35‐day screening phase, patients were randomized in a 1:1 ratio" Randomisation was based on permuted blocks; stratification by centre was not conducted |
| Allocation concealment (selection bias) | Unclear risk | Judgement comment: no description of allocation concealment except that randomisation was based on permuted blocks |
| Blinding of participants and personnel (performance bias) | High risk | Judgement comment: open‐label trial ‐ subcutaneous pump versus oral tablet ‐ difficult to blind |
| Blinding of outcome assessment (detection bias) | Low risk | Quote: "Core laboratories were blinded to treatment allocation.In order to eliminate potential unrecognized biases, the core clinical trial team was blinded to the treatment assignment prior to the database lock for the primary analysis." |
| Incomplete outcome data (attrition bias) | Unclear risk | Judgement comment: 21 withdrawn DFO arm 16 in DFX (78 to 82 completed trial) Efficacy outcomes reported in per protocol and safety in the participants who received the trial drug |
| Selective reporting (reporting bias) | Unclear risk | Investigator‐reported AEs, regardless of causality, were reported in 65 (67.7%) DFX participants and 69 (75.8%) DFO participants (supplemental Table 2). AEs suspected to be related to trial drug occurred in 35.4% of DFX participants and 30.8% of DFO participants Judgement comments: It is unclear if investigator‐reported AEs and those suspected to be related to trial drug include the same AEs. Also, they only report the end of trial LIC value for the DFX group |
| Other bias | Low risk | The trial appears to be free of other sources of bias |
| Methods | Study design: multicentre RCT conducted in several countries Study grouping: parallel group Study duration: 24 weeks | |
| Participants | Baseline characteristics DFX film‐coated tablet
DFX dispersible tablet
Inclusion criteria:
Exclusion criteria:
| |
| Interventions | DFX film‐coated tablets
DFX dispersible tablet
| |
| Outcomes | Adherence to iron chelation therapy rates Compliance with medication as assessed by relative consumed tablet count Trial‐reported outcomes 1. Overall safety of both DFX formulations, measured by frequency and severity of AEs and changes in laboratory values from baseline to 24 weeks. 2. Evaluation of both formulations on selected GI AEs (diarrhoea, constipation, nausea, vomiting, and abdominal pain) during treatment 3. Estimation of treatment compliance 4. Evaluation of both formulations on participant satisfaction, palatability, and GI symptoms using PROs 5. Evaluation of the pharmacokinetics of both formulations 6. Reported % compliant with upper and lower percentages | |
| Identification | Sponsorship source: Novartis Pharmaceuticals Country: USA Comments: NCT02125877 Authors name: Ali Taher Institution: American University of Beirut Medical Center Email: [email protected] Address: Haematology and Oncology, Department of Internal Medicine, Faculty of Medicine, American University of Beirut Medical Center, Beirut, Lebanon | |
| Notes | Sample‐size calculation not reported | |
| Risk of bias | ||
| Bias | Authors' judgement | Support for judgement |
| Random sequence generation (selection bias) | Unclear risk | "Randomization was stratified by underlying disease and previous chelation treatment." No clear description of randomisation or if participants were randomised centrally |
| Allocation concealment (selection bias) | High risk | Quote: "Post‐ hoc analyses identified that 23 patients on FCT (26%) were started on a dose that was higher than recommended in the protocol compared with 8 patients (9.3%) on DT (not recognized or reported by the investigators as dosing error)." Judgement comment: the trial was open label and most participants had been on 1 or the other of the trial drugs prior to the trial ‐ doses may have corresponded to prior dosing since there was no description of allocation concealment |
| Blinding of participants and personnel (performance bias) | High risk | Judgement comment: open‐label |
| Blinding of outcome assessment (detection bias) | High risk | No description of how outcome assessment was performed ‐ centrally or blinded open‐label trial |
| Incomplete outcome data (attrition bias) | Unclear risk | Quote: "Overall, all patients were satisfied with their medicine during the study period; satisfaction scores were higher with deferasirox FCT compared with DT at all visits." Judgement comment: no data provided on number of participants or scores just general statements |
| Selective reporting (reporting bias) | High risk | Quote: "patients discontinued treatment because of AEs (n = 10), protocol deviation (n = 5), withdrawal of consent (n = 3), patient guardian decision (n = 2), and other reasons (administrative problems, death, and physician’s decision, n = 1 each)." Judgement comment: investigators do not report all outcomes by treatment assignment, and AEs and SAEs are reported as suspected relationship to trial drug and occurring in > or equal to 10% |
| Other bias | Unclear risk | "The absolute reduction in median serum ferritin (range) in patients receiving FCT was –350 (–4440–3572) ng/mL and in those receiving DT was –85.5 (–2146–8250) ng/mL); these correspond to a relative change of –14.0% with FCT and –4.1% with DT." Judgement comment: some of difference in change could be accounted for more participants starting on a higher dose of film‐coated tablet |
| Methods | 2‐arm parallel RCT Trial undertaken: thalassaemia out‐patient clinics in Sardinia | |
| Participants | Number randomised: 65 (treatment group: 33; comparator group: 32) Number completing treatment: 60 (treatment group: 32; comparator group: 28). The reason for the withdrawal was not fully reported by the trial authors Participants aged 18 years or older with a diagnosis of β‐thalassaemia, currently maintained on subcutaneous DFO and with a myocardial T2* between 8 ‐ 20 ms | |
| Interventions | DFO
DFO/DFP
| |
| Outcomes | Adherence see compliance below Trial‐reported outcomes 1. Change over 1 year in myocardial T2* (primary outcome) | |
| Identification | Source of funding: CORDA, Royal Brompton & Harefield Hospitals Charitable funds, Cooley’s Anemia Foundation, Apotex, UK Thalassaemia Society, University College London Special trustees Chairty | |
| Notes | Prior exposure to iron chelation: DFO mean (SD) dose 36.4 (11.1) mg/kg per day for 5.5 day/week (equivalent to 40.5 mg/kg for 5 day/week). Participants were excluded if they had previously received DFP Sample‐size calculation reported | |
| Risk of bias | ||
| Bias | Authors' judgement | Support for judgement |
| Random sequence generation (selection bias) | Unclear risk | The authors did not report any information about how randomisation was undertaken |
| Allocation concealment (selection bias) | High risk | Trial reports that the participants and clinicians were aware of how treatment was to be allocated |
| Blinding of participants and personnel (performance bias) | Unclear risk | The authors did not report any information as to whether participants or personnel were blinded to treatment allocation |
| Blinding of outcome assessment (detection bias) | Unclear risk | The authors did not report any information as to whether outcome assessors were blinded to treatment allocation |
| Incomplete outcome data (attrition bias) | Unclear risk | As the trial does not report the number of participants included in each outcome assessment. The trial reports the number completing treatment and the reasons why 3 participants in the treatment group (1 adverse event & 2 participant requests) and 4 participants in the comparator group (3 adverse events & 1 participant request) were withdrawn from the trial |
| Selective reporting (reporting bias) | Low risk | All outcomes pre‐specified were reported in the manuscript |
| Other bias | Low risk | The trial appears to be free of other sources of bias |
| Methods | Study design: RCT Study grouping: parallel group The study duration was 52 weeks. Participants were recruited by investigators at 44 sites in the USA, France, Italy, UK and Canada | |
| Participants | Baseline characteristics DFX
DFO
Age group (% DFX, DFO) Inclusion criteria:
Exclusion criteria
| |
| Interventions | DFX
DFO
| |
| Outcomes | Adherence to iron chelation therapy rates Compliance. For DFX, compliance was assessed by counting the number of tablets returned in bottles at each visit. For DFO, the numbers of vials returned at each visit were counted Trial‐reported outcomes 1. Safety assessments 2. Laboratory assessments were performed at least monthly and included complete blood counts with differential counts. Biochemistry testing included electrolytes, glucose, liver function tests, gamma‐glutaryl‐transferase, lactate dehydrogenase, cholesterol, triglycerides, uric acid, total protein, C‐reactive protein, copper and zinc levels. Iron parameters included total iron, transferrin, transferrin saturation and ferritin. Urinary testing performed on random collections included determination of creatinine, total protein and albumin 3. Physical examinations, ECGs, audiometry and ophthalmological tests were performed at baseline, 12, 24, 36 and 52 weeks. In participants less than 16 years of age, additional assessments included growth velocity and pubertal stage 4. Efficacy assessments. LIC was determined by SQUID biospectrometry at baseline, 24 and 52 weeks. The 24‐week assessment was performed primarily for safety purposes, and the change in LIC was calculated between baseline and 52 weeks. SF was assessed monthly during the trial and the change was determined using the baseline and final ferritin level | |
| Identification | Sponsorship source: Novartis Pharmaceuticals Country: international (Canada, France, Italy, UK and USA) Setting: medical centre outpatient Authors name: Elliott Vichinsky Institution: Children’s Hospital and Research Center at Oakland, Email: [email protected] Address: Children’s Hospital and Research Center at Oakland, 747 52nd Street, Oakland, CA 94609, USA Novartis Pharmaceuticals Corporation (East Hanover, NJ, USA) co‐ordinated the design and execution of this trial and contributed to the analysis and interpretation of the trial data. Novartis Pharmaceuticals Corporation also collaborated with the external authors to assist in the development and approval of the manuscript for publication | |
| Notes | Sample‐size calculation reported | |
| Risk of bias | ||
| Bias | Authors' judgement | Support for judgement |
| Random sequence generation (selection bias) | Low risk | Quote: "The randomisation was performed using an interactive voice response system" |
| Allocation concealment (selection bias) | Unclear risk | Quote: "stratified according to the following age groups: 2 to < 6 years, 6 to < 12 years, 12 to < 16 years and 16 years and older. The randomisation sequence included permuted block groups of six patients for each of the three age strata." Judgement comment: some of the age groups had few participants and unclear if allocation would remain concealed with permuted block groups of 6 participants |
| Blinding of participants and personnel (performance bias) | High risk | Judgement comment: no mention of blinding, but DFO is delivered by infusion pumps and DFX is a solution in water, so blinding not feasible |
| Blinding of outcome assessment (detection bias) | High risk | Judgement comment: no description of blinding: Novartis Pharmaceuticals Corporation (East Hanover, NJ, USA) co‐ordinated the design and execution of this trial and contributed to the analysis and interpretation of the trial data. The data were analysed under supervision of the trial statistician and were reviewed by the investigators |
| Incomplete outcome data (attrition bias) | Low risk | All outcomes reported. 8 participants did not complete and were not included. 6 DFX arm withdraw consent, one in DFO arm. 3 DFO non compliant, 2 DFX and 1 DFO lost to follow‐up |
| Selective reporting (reporting bias) | Unclear risk | Quote: "Adverse events, irrespective of the relationship to study medication, which occurred in more than 10% of patients receiving either treatment, are shown in Table III. As arbitrarily defined by an increased frequency of at least 5% indicating a potential relationship to drug administration." Judgement comment: do not report the total number of AEs in all participants, as well there was a substantial number of participants experience SAEs and there is no list of the type except for pain crisis: The number of participants receiving DFX and DFO that reported SAEs was similar (46.2% and 42.9% respectively) and the most common SAE in both groups was sickle cell anaemia with crisis (33.3% and 31.7% respectively). Also table of AEs report % and no totals so impossible to determine total number of participants with an AE |
| Other bias | Unclear risk | Quote: "The reasons for withdrawal of consent were not included in the database." Quote: "The initial 24 patients enrolled were randomised to receive deferasirox 10 mg/kg or deferoxamine at recommended doses of 20–60 mg/kg based on initial LIC. Subsequently, additional safety information became available for deferasirox suggesting a need to modify the starting dose (Cappellini et al, 2006). Therefore, following the enrolment of the first 24 patients, the study was amended so that all subsequent patients randomised to deferasirox were dosed at 10–30 mg/kg according to baseline LIC" Judgement comment: it is important to understand reasons for withdrawals and also the nature of the missing safety information which may have implications for dosing and effects of the dosing amendment |
ADRs: adverse drug reactions
AEs: adverse events
ALT: alanine aminotransferase
ANC: absolute neutrophil count
BNP: brain natriuretic peptide
CBC: complete blood count
CMR: cardiovascular magnetic resonance imaging
DFO: deferoxamine
DFP: deferiprone
DFX: deferasirox
dw: dry weight
ECGs: electrocardiograms
FBC: full blood count
Hb: haemoglobin
HRQoL: health‐related quality of life
ICT: iron chelation therapies
IQR: interquartile range
LVEF: left ventricular ejection fraction
LIC: liver iron concentration
MRI: magnetic resonance imaging
PK: pharmacokinetic
PRBC: packed red blood cell
QoL: quality of life
RBCs: red blood cells
RCT: randomised controlled trial
SAEs: serious adverse events
SCr: sickle cell retinopathy
SD: standard deviation
SF: serum ferritin
SGPT: serum glutamate‐pyruvate transaminase
SQUID: Superconducting Quantum Interference Device
UIE: urinary iron excretion
ULN: upper limit of normal
WBC: white blood count
Characteristics of excluded studies [ordered by study ID]
| Study | Reason for exclusion |
| Wrong study design ‐ qualitative interview questionnaire used. | |
| Wrong study design ‐ qualitative interview questionnaire used. | |
| Wrong study design ‐ cross‐sectional study. | |
| Wrong study design ‐ medication study ‐ not an RCT. | |
| Wrong study design ‐ medication study ‐ not an RCT. | |
| No intervention. | |
| No intervention. | |
| No intervention. | |
| Not designed to measure adherence to iron chelation therapy. | |
| Not designed to measure adherence to iron chelation therapy. | |
| Wrong setting ‐ single‐centre study. | |
| No intervention. | |
| Wrong study design ‐ clinical audit of medication use. | |
| Wrong study design ‐ medication study not RCT. | |
| Wrong study design ‐ single‐treatment study. | |
| Review. | |
| Wrong comparator ‐ healthy children not taking iron chelation therapy. | |
| Not designed to measure adherence to iron chelation therapy. | |
| Not designed to measure adherence to iron chelation therapy. | |
| Wrong study design ‐ single‐centre study with no control. | |
| Wrong study design ‐ single‐centre study with no control. | |
| Wrong study design ‐ single‐centre study with no control. | |
| Wrong study design ‐ single‐centre study with no control. | |
| Wrong study design ‐ medication intervention not a RCT. | |
| Wrong study design ‐ medication intervention not a RCT. | |
| Not designed to measure adherence to iron chelation therapy. | |
| Not designed to measure adherence to iron chelation therapy. | |
| Not designed to measure adherence to iron chelation therapy. | |
| Review. | |
| Not designed to measure adherence to iron chelation therapy. |
RCT: randomised controlled trial
Characteristics of studies awaiting assessment [ordered by study ID]
| Methods | Prospective cohort study; parallel group |
| Participants | Participants using DFX ‐ we do not know the disease diagnosis and therefore awaiting classification Exclusion criteria: not stated |
| Interventions | Educational intervention, standard care (as defined in the study) |
| Outcomes | Exjade Patient Compliance Program (EX‐PAT) was established to increase patients’ knowledge about DFX usage. This abstract aimed to represent the results of the pilot EX‐PAT program It is highly recommended to educate the patients under iron chelating treatment about possible complication and usage of chelating agent |
| Notes | Email sent to author asking for the following information so we could include the study: a full study report of this abstract? If this is not available would it be possible to have more information on: 1. The disease diagnosis of the participants (were they sickle cell (phenotypes) or thalassaemia (phenotypes) or other); 2. How participants were assigned to intervention or control; 3. Any inclusion/exclusion criteria; 4. Any group differences; 5. Is the age range for the whole group or is it for the intervention group only? If so could we have the age range for the control group; 6. Baseline and end of study ferritin levels; 7. SAEs or any AEs |
| Methods | RCT; parallel group |
| Participants | Inclusion criteria: ages eligible for trial: 7 years and older (child, adult, senior); genders eligible for study: both Exclusion criteria: overt cardiac disease |
| Interventions | Combination iron chelation therapy, standard care (as defined in the trial) |
| Outcomes | This small trial is testing the premise that a combination of drugs as a new approach to iron chelation therapy may reduce side effects and increase efficacy. If both drugs can be given orally, there may be a better chance of finding a suitable alternative to Desferal. Several combinations of experimental iron chelating drugs are being used in this trial |
| Notes | This trial has been completed. Sponsor: National Institute of Diabetes and Digestive and Kidney Diseases (NIDDK). No study results posted NCT00004982: scant information about the trial was documented on the clinicaltrials.gov web site. We have been unable to identify any publications from this trial and despite repeated emails to the trial co‐ordinator and searching the funders web site, we have been unable to identify any further details about the trial. Start date: December 1998; estimated completion November 2002 |
AEs: adverse events
DFX: deferasirox
RCT: randomised controlled trial
SAEs: serious adverse events
Characteristics of ongoing studies [ordered by study ID]
| Trial name or title | Multicentre, randomised, open‐label, non‐inferiority active‐controlled trial to evaluate the efficacy and safety of DFP compared to DFX in paediatric patients aged from 1 month to less than 18 years of age affected by transfusion‐dependent haemoglobinopathies |
| Methods | Randomised trial, parallel group |
| Participants | 1. Children on current treatment with DFO or DFX or DFP in a chronic transfusion program receiving at least 150 mL/kg/year of packed RBCs (corresponding approximately to 12 transfusions); |
| Interventions | DFP compared to DFX |
| Outcomes | Percentage of successfully chelated children assessed by SF levels (all participants) and cardiac MRI T2* (children above 10 years of age able to have an MRI scan without sedation) 1. LlC as measured by MRI in those able to undergo MRI scan without sedation |
| Starting date | Not stated |
| Contact information | Consorzio per le Valutazioni Biologiche e Farmacologiche via Luigi Porta, 14 Pavia 27100 Italy deep.2@deep‐project.net |
| Notes |
| Trial name or title | To assess compliance, efficacy and satisfaction with two different formulation of deferasirox in people with transfusion‐dependent beta‐thalassaemia |
| Methods | RCT; parallel group |
| Participants | Inclusion criteria: signing informed consent; male or female aged ≥ 2 years at screening; people with transfusion‐dependent thalassaemia major; regular transfusion indicated by a blood requirement ≥ 8 blood transfusions per year at screening. Exclusion criteria: people with mean levels of ALT above 5‐fold the ULN; people with serum creatinine above ULN; significant proteinuria as indicated by a urinary protein/creatinine ratio > 0.6 (mg/mg); creatinine clearance ≤ 60 mL/min; chronic hepatitis B infection; active hepatitis C infection; pregnancy or breastfeeding; non‐transfusion dependent thalassaemia |
| Interventions | DFX (new formulation JadenuTM), DFX (Exjade®) |
| Outcomes | Participants compliance and satisfaction; 3 months after drug consumption; designed questionnaire to assess participant compliance and satisfaction; ferritin serum amount; safety; possible GI side effects, including diarrhoea, and dermatologic symptoms |
| Starting date | 22 December 2015 |
| Contact information | Vice chancellor of research, Shiaz Univeisity of Medical Sciences COUNTRY: Iran SETTING: multicentre (outpatient) Dr. Sezaneh Haghpanah INSTITUTION:Hematology Research Center, Nemazee Hospital, Shiraz, Iran EMAIL: [email protected] ADDRESS: Dr Sezaneh Haghpan Professor of community medicine Hematology Research Center, Nemazee Hospital, Zand Street, Shiraz, Ira |
| Notes |
| Trial name or title | A randomised controlled trial studying the effectiveness of group medical appointments on self‐efficacy and adherence in sickle cell disease (TEAM study): study protocol |
| Methods | RCT; parallel group |
| Participants | Inclusion criteria: individuals with homozygous or compound heterozygous SCD Exclusion criteria: individuals with a first visit to the outpatient clinic, patients who cannot communicate adequately due to language difficulties and/or hearing problems or patients who have behavioral problems which will limit group functioning |
| Interventions | Group Medical Appointment, Individual Medical Appointment (IMA; care‐as‐usual) |
| Outcomes | Primary and secondary endpoints will be measured at baseline (start of the study), after 1.5 years (after two GMA visits) and after 3 years (after four GMA visits), in both groups. Assessments are performed at the hospital, directly before the outpatient visit and in presence of a psychologist. Primary endpoint: 1. Self‐efficacy as measured by the validated Sickle Cell Self‐ Efficacy Scale; Secondary endpoints; 2. Adherence to prescribed treatment by (paediatric) hematologist; 3. QoL as measured with the validated Pediatric Quality of Life Inventory for children and SF‐36 for adults. 4. Emergency visits and hospital admissions for SCD related symptoms and complications. 5. Satisfaction with treating physician and nurse (by visual analogue scale: score 1 – 10); 6. Measurement of costs and effects in the GMA and IMA group by an economic analysis according to Dutch guidelines and with respect to an increase in self‐ efficacy |
| Starting date | The trial opened to recruitment in January 2013 for the children and in September 2015 for the adults and is still ongoing. |
| Contact information | Marjon H. Cnossen INSTITUTION: Department of Pediatric Hematology, Erasmus University Medical Center ‐ Sophia Children’s Hospital EMAIL: [email protected] ADDRESS: Department of Pediatric Hematology, Erasmus University Medical Center ‐ Sophia Children’s Hospital, Wytemaweg 80, PO Box 2060, 3000 CB Rotterdam, The NetherlandsAdditional data |
| Notes | Trial registration: NTR4750 (NL42182.000.12) |
| Trial name or title | An algorithm to start iron chelation in minimally transfused young beta‐thalassaemia major patients |
| Methods | RCT; parallel group |
| Participants | Inclusion criteria: young individuals with β‐thalassaemia major (diagnosed by HPLC, CBC) who started transfusion therapy who received 5 ‐ 7 transfusions or less, aged more than 6 months. Pre‐transfusional Hb should be >9 g/dL. Serum ferritin should be ≤ 500 ng/mL, transferrin saturation ≤ 50%. Exclusion criteria: 1. individuals with β‐thalassaemia intermedia, those with other transfusion‐dependent anemias (myelodysplasia, other chronic haemolytic anemias, pure red cell aplasia, aplastic anaemia); 2. Individuals with levels of ALT > 5 the ULN, serum creatinine > ULN on 2 measurements; 3. Indiviudals with history of agranulocytosis (ANC < 0.5×10⁹/L). 4. Non‐complaint individuals acknowledged by reviewing the patient's records. |
| Interventions | DFP, placebo |
| Outcomes | Primary outcome measures: determine the time and number of transfusion units as well as amount of infused iron that will lead to appearance of LPI > 0.2 or TSAT > 50 % , serum ferritin ≥ 500 ng/mL in the studied thalassaemic patients which warrant start of iron chelation Time frame: 12 months To determine the time as well as amount of transfused iron (calculated in mg iron/kg) at which there is LPI appearance of > 0.2 as well as TSAT reaching 70 %, a serum ferritin ≥ 500 in order to start iron chelation therapy Evaluation of safety of early use of iron chelation therapy in terms of drug related AEs or SAEs Time frame: 12 months To determine the tolerability and safety of early low dose DFP 50mg/kg and effectiveness to postpone or prevent SF from reaching 1000 ng/mL or LPI > 0.6 or TSAT > 70% in comparison to participants not starting chelation therapy |
| Starting date | July 2014 |
| Contact information | Amira AM Adly, INSTITUTION: Pediatric Hematology clinic, Ain Shams University Cairo, Egypt EMAIL: [email protected] |
| Notes |
| Trial name or title | Study to evaluate treatment compliance, efficacy and safety of an improved deferasirox formulation (granules) in paediatric patients (2 ‐ < 18 years old) with iron overload |
| Methods | RCT; parallel group |
| Participants | Inclusion criteria: written informed consent/assent before any study‐specific procedures. Consent will be obtained from parent(s) or legal guardians. Investigators will also obtain assent of patients according to local guidelines. Male and female children and adolescents aged ≥ 2 and < 18 years. Any transfusion‐dependent anaemia associated with iron overload requiring iron chelation therapy and with a history of transfusion of approximately 20 PRBC units and a treatment goal to reduce iron burden (300 mL PRBC = 1 unit in adults whereas 4 mL/kg PRBC is considered 1 unit for children). Serum ferritin > 1000 ng/mL, measured at screening visit 1 and screening visit 2 (the mean value will be used for eligibility criteria). Exclusion criteria: creatinine clearance below the contraindication limit in the locally approved prescribing information. Creatinine clearance will be estimated from serum creatinine (using the Schwartz formula) at screening visit 1 and screening visit 2 and the mean value will be used for eligibility criteria. Serum creatinine > 1.5 x ULN at screening measured at screening visit 1 and screening visit 2 (the mean value will be used for eligibility criteria). ALT and/or AST > 3.0 x ULN (Criterion no longer applicable, removed as part of amendment 1): prior iron chelation therapy. Liver disease with severity of Child‐Pugh class B or C. Significant proteinuria as indicated by a urinary protein/creatinine ratio > 0.5 mg/mg in a non‐first void urine sample at screening visit 1 or screening visit 2. Those with significant impaired GI function or GI disease that may significantly alter the absorption of oral DFX (e.g. ulcerative diseases, uncontrolled nausea, vomiting, diarrhoea, malabsorption syndrome or small bowel resection |
| Interventions | DFX granule formulation, DFX DT formulation |
| Outcomes | Primary outcome measures: compliance Pre‐dose PK data from all patients will be analysed to support the assessment of compliance. |
| Starting date | 21 October 2015 |
| Contact information | Principal Investigator: Janet L. KwiatkowskiI; NSTITUTION: Children's Hospital of Philadelphia Onc. Dept; EMAILContact: John Hammond 267‐426‐5602 [email protected] ADDRESS: Children's Hospital of Philadelphia, Oncology Dept, Philadelphia, Pennsylvania, USA, 19104‐4399 |
| Notes | March 30, 2023 (Final data collection date for primary outcome measure) |
AEs: adverse events
ALT: alanine transaminase
ANC: absolute neutrophil count
AST: aspartate transaminase
CBC: complete blood count
DFO: deferoxamine
DFP: deferiprone
DFX: deferasirox
DT: dispersible tablet
GI: gastrointestinal
HPLC: high‐performance liquid chromatography
LIC: liver iron concentration
LPI: labile plasma iron
MRI: magnetic resonance imaging
PK/PD: pharmacokinetic/pharmacodynamic
QoL: quality of life
RBCs: red blood cells
RCT: randomised controlled trial
SAEs: serious adverse events
SF: serum ferritin
TSAT: transferrin saturation
ULN: upper limit of normal
WBC: white blood cell
Data and analyses
| Outcome or subgroup title | No. of studies | No. of participants | Statistical method | Effect size |
| 1 Adherence to iron chelation therapy (%, SD) Show forest plot | 3 | Mean Difference (IV, Random, 95% CI) | Subtotals only | |
| Analysis 1.1  Comparison 1 DFP versus DFO, Outcome 1 Adherence to iron chelation therapy (%, SD). | ||||
| 2 SAEs (from therapy, disease, non‐adherence) Show forest plot | 1 | Risk Ratio (M‐H, Random, 99% CI) | Totals not selected | |
| Analysis 1.2 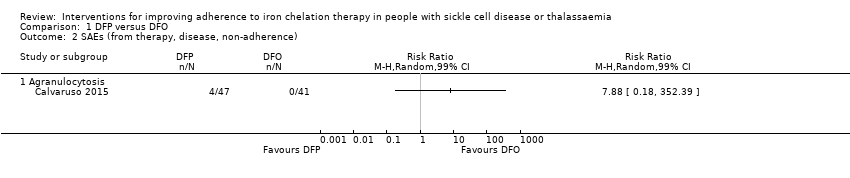 Comparison 1 DFP versus DFO, Outcome 2 SAEs (from therapy, disease, non‐adherence). | ||||
| 2.1 Agranulocytosis | 1 | Risk Ratio (M‐H, Random, 99% CI) | 0.0 [0.0, 0.0] | |
| 3 All‐cause mortality Show forest plot | 1 | Risk Ratio (IV, Random, 95% CI) | Totals not selected | |
| Analysis 1.3  Comparison 1 DFP versus DFO, Outcome 3 All‐cause mortality. | ||||
| 4 Iron overload: defined as proportion of participants with serum ferritin ≥ 800 (µg/L) Show forest plot | 1 | Risk Ratio (M‐H, Fixed, 95% CI) | Totals not selected | |
| Analysis 1.4 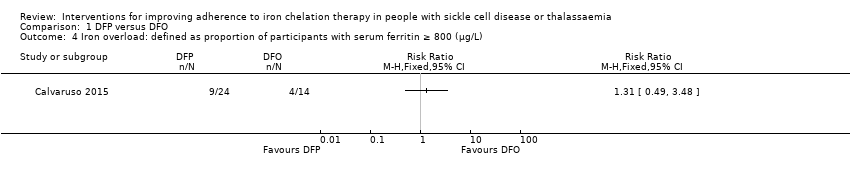 Comparison 1 DFP versus DFO, Outcome 4 Iron overload: defined as proportion of participants with serum ferritin ≥ 800 (µg/L). | ||||
| 5 Organ damage Show forest plot | 1 | Risk Ratio (M‐H, Random, 95% CI) | Totals not selected | |
| Analysis 1.5 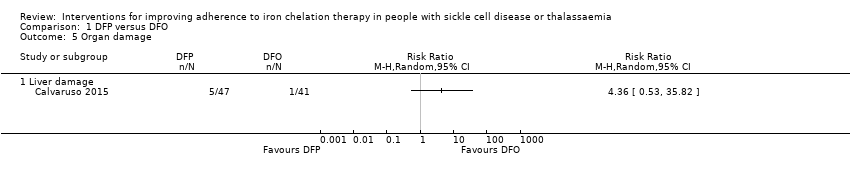 Comparison 1 DFP versus DFO, Outcome 5 Organ damage. | ||||
| 5.1 Liver damage | 1 | Risk Ratio (M‐H, Random, 95% CI) | 0.0 [0.0, 0.0] | |
| 6 Other AEs related to iron chelation Show forest plot | 3 | Risk Ratio (IV, Random, 99% CI) | Subtotals only | |
| Analysis 1.6  Comparison 1 DFP versus DFO, Outcome 6 Other AEs related to iron chelation. | ||||
| 6.1 Risk of leukopenia, neutropenia and/or agranulocytosis | 3 | 192 | Risk Ratio (IV, Random, 99% CI) | 3.94 [0.44, 35.50] |
| 6.2 Risk of pain or swelling in joints | 3 | 192 | Risk Ratio (IV, Random, 99% CI) | 3.38 [0.54, 21.31] |
| 6.3 Risk of nausea/vomiting | 2 | 132 | Risk Ratio (IV, Random, 99% CI) | 13.68 [0.99, 188.88] |
| 6.4 Risk of increased liver transaminase | 1 | 44 | Risk Ratio (IV, Random, 99% CI) | 1.10 [0.03, 38.47] |
| 6.5 Local reactions at infusion site | 1 | 88 | Risk Ratio (IV, Random, 99% CI) | 0.17 [0.00, 9.12] |
| Outcome or subgroup title | No. of studies | No. of participants | Statistical method | Effect size |
| 1 Adherence to iron chelation therapy (%, SD) Show forest plot | 1 | Mean Difference (IV, Random, 95% CI) | Totals not selected | |
| Analysis 2.1  Comparison 2 DFX versus DFO, Outcome 1 Adherence to iron chelation therapy (%, SD). | ||||
| 2 SAEs Show forest plot | 3 | Risk Ratio (M‐H, Random, 95% CI) | Totals not selected | |
| Analysis 2.2  Comparison 2 DFX versus DFO, Outcome 2 SAEs. | ||||
| 2.1 Thalassaemia‐related SAEs | 2 | Risk Ratio (M‐H, Random, 95% CI) | 0.0 [0.0, 0.0] | |
| 2.2 SCD‐related SAE ‐ painful crisis | 1 | Risk Ratio (M‐H, Random, 95% CI) | 0.0 [0.0, 0.0] | |
| 2.3 SCD‐related SAEs ‐ other SCD‐related SAEs | 1 | Risk Ratio (M‐H, Random, 95% CI) | 0.0 [0.0, 0.0] | |
| 3 All‐cause mortality (thalassaemia) Show forest plot | 2 | 240 | Risk Ratio (IV, Random, 95% CI) | 0.96 [0.06, 15.06] |
| Analysis 2.3  Comparison 2 DFX versus DFO, Outcome 3 All‐cause mortality (thalassaemia). | ||||
| 4 Proportion of participants with iron overload (thalassaemia) Show forest plot | 2 | Risk Ratio (M‐H, Random, 95% CI) | Subtotals only | |
| Analysis 2.4  Comparison 2 DFX versus DFO, Outcome 4 Proportion of participants with iron overload (thalassaemia). | ||||
| 4.1 Iron overload defined by ferritin 1500 (µg/l) or higher (Thalassaemia) | 1 | 60 | Risk Ratio (M‐H, Random, 95% CI) | 1.18 [0.63, 2.20] |
| 4.2 Proportion with severe iron overload (LIC at least 15 mg/Fe/g dw) | 1 | 172 | Risk Ratio (M‐H, Random, 95% CI) | 1.00 [0.83, 1.20] |
| 4.3 Myocardial T2* < 10ms | 1 | 172 | Risk Ratio (M‐H, Random, 95% CI) | 1.10 [0.72, 1.70] |
| 5 Other AEs related to iron chelation ‐ (thalassaemia) Show forest plot | 2 | Risk Ratio (IV, Random, 95% CI) | Subtotals only | |
| Analysis 2.5  Comparison 2 DFX versus DFO, Outcome 5 Other AEs related to iron chelation ‐ (thalassaemia). | ||||
| 5.1 Total chelation‐related AE | 1 | 187 | Risk Ratio (IV, Random, 95% CI) | 1.15 [0.76, 1.73] |
| 5.2 Gastrointestinal upset | 1 | 60 | Risk Ratio (IV, Random, 95% CI) | 3.0 [0.66, 13.69] |
| 5.3 Rash | 2 | 247 | Risk Ratio (IV, Random, 95% CI) | 3.05 [0.98, 9.47] |
| 5.4 Risk of increased blood creatinine | 1 | 187 | Risk Ratio (IV, Random, 95% CI) | 3.79 [0.83, 17.38] |
| 5.5 Risk of proteinuria | 1 | 187 | Risk Ratio (IV, Random, 95% CI) | 2.21 [0.59, 8.29] |
| 5.6 Risk of increased ALT | 1 | 187 | Risk Ratio (IV, Random, 95% CI) | 5.69 [0.70, 46.33] |
| 5.7 Risk of increased AST | 1 | 187 | Risk Ratio (IV, Random, 95% CI) | 5.69 [0.70, 46.33] |
| 5.8 Risk of diarrhoea | 1 | 187 | Risk Ratio (IV, Random, 95% CI) | 5.69 [0.70, 46.33] |
| 5.9 Risk of vomiting | 1 | 187 | Risk Ratio (IV, Random, 95% CI) | 6.64 [0.35, 126.78] |
| 6 Total AEs (thalassaemia) Show forest plot | 1 | Risk Ratio (IV, Random, 95% CI) | Totals not selected | |
| Analysis 2.6 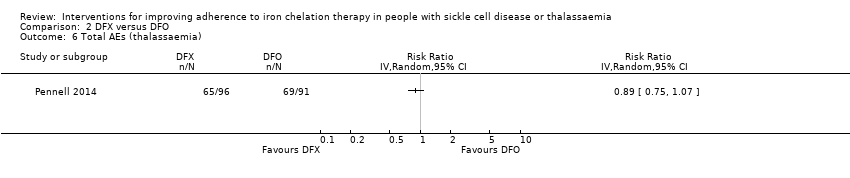 Comparison 2 DFX versus DFO, Outcome 6 Total AEs (thalassaemia). | ||||
| 7 Other AEs related to iron chelation (SCD) Show forest plot | 1 | Risk Ratio (M‐H, Random, 99% CI) | Subtotals only | |
| Analysis 2.7  Comparison 2 DFX versus DFO, Outcome 7 Other AEs related to iron chelation (SCD). | ||||
| 7.1 Risk of increased ALT | 1 | 195 | Risk Ratio (M‐H, Random, 99% CI) | 5.29 [0.12, 232.98] |
| 7.2 incidence of abdominal pain | 1 | 195 | Risk Ratio (M‐H, Random, 99% CI) | 1.91 [0.80, 4.58] |
| 7.3 Risk of pain or swelling in joints | 1 | 195 | Risk Ratio (M‐H, Random, 99% CI) | 1.06 [0.41, 2.76] |
| 7.4 Risk of diarrhoea | 1 | 195 | Risk Ratio (M‐H, Random, 99% CI) | 4.14 [0.90, 18.92] |
| 7.5 Nausea/vomiting | 1 | 195 | Risk Ratio (M‐H, Random, 99% CI) | 1.63 [0.90, 2.94] |
| Outcome or subgroup title | No. of studies | No. of participants | Statistical method | Effect size |
| 1 Adherence to iron chelation therapy Show forest plot | 1 | 173 | Risk Ratio (M‐H, Random, 95% CI) | 1.10 [0.99, 1.22] |
| Analysis 3.1  Comparison 3 DFX film‐coated tablet versus DFX dispersible tablet, Outcome 1 Adherence to iron chelation therapy. | ||||
| 2 Incidence of SAEs Show forest plot | 1 | 173 | Risk Ratio (IV, Random, 95% CI) | 1.22 [0.62, 2.37] |
| Analysis 3.2  Comparison 3 DFX film‐coated tablet versus DFX dispersible tablet, Outcome 2 Incidence of SAEs. | ||||
| 3 All‐cause mortality Show forest plot | 1 | 173 | Risk Ratio (M‐H, Random, 95% CI) | 2.97 [0.12, 71.81] |
| Analysis 3.3  Comparison 3 DFX film‐coated tablet versus DFX dispersible tablet, Outcome 3 All‐cause mortality. | ||||
| 4 Incidence of organ damage (renal event) Show forest plot | 1 | 173 | Risk Ratio (IV, Random, 95% CI) | 1.25 [0.83, 1.91] |
| Analysis 3.4 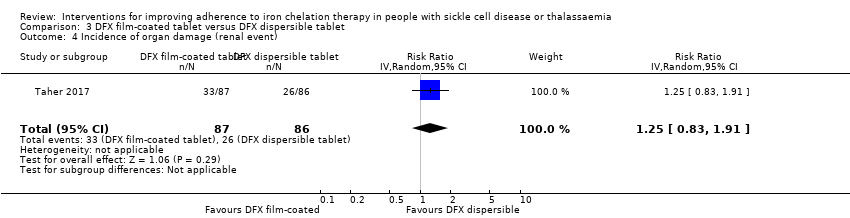 Comparison 3 DFX film‐coated tablet versus DFX dispersible tablet, Outcome 4 Incidence of organ damage (renal event). | ||||
| 5 Other AEs related to iron chelation Show forest plot | 1 | Risk Ratio (IV, Random, 99% CI) | Subtotals only | |
| Analysis 3.5 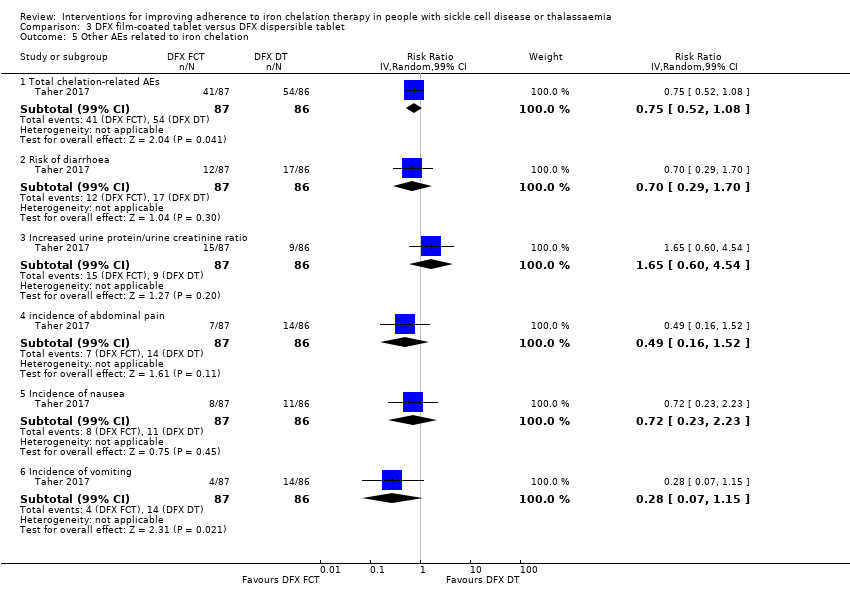 Comparison 3 DFX film‐coated tablet versus DFX dispersible tablet, Outcome 5 Other AEs related to iron chelation. | ||||
| 5.1 Total chelation‐related AEs | 1 | 173 | Risk Ratio (IV, Random, 99% CI) | 0.75 [0.52, 1.08] |
| 5.2 Risk of diarrhoea | 1 | 173 | Risk Ratio (IV, Random, 99% CI) | 0.70 [0.29, 1.70] |
| 5.3 Increased urine protein/urine creatinine ratio | 1 | 173 | Risk Ratio (IV, Random, 99% CI) | 1.65 [0.60, 4.54] |
| 5.4 incidence of abdominal pain | 1 | 173 | Risk Ratio (IV, Random, 99% CI) | 0.49 [0.16, 1.52] |
| 5.5 Incidence of nausea | 1 | 173 | Risk Ratio (IV, Random, 99% CI) | 0.72 [0.23, 2.23] |
| 5.6 Incidence of vomiting | 1 | 173 | Risk Ratio (IV, Random, 99% CI) | 0.28 [0.07, 1.15] |
| Outcome or subgroup title | No. of studies | No. of participants | Statistical method | Effect size |
| 1 Incidence of SAEs Show forest plot | 1 | 213 | Risk Ratio (M‐H, Random, 95% CI) | 0.15 [0.01, 2.81] |
| Analysis 4.1  Comparison 4 DFP and DFO versus DFP, Outcome 1 Incidence of SAEs. | ||||
| 2 All‐cause mortality Show forest plot | 2 | 237 | Risk Ratio (IV, Random, 95% CI) | 0.77 [0.18, 3.35] |
| Analysis 4.2 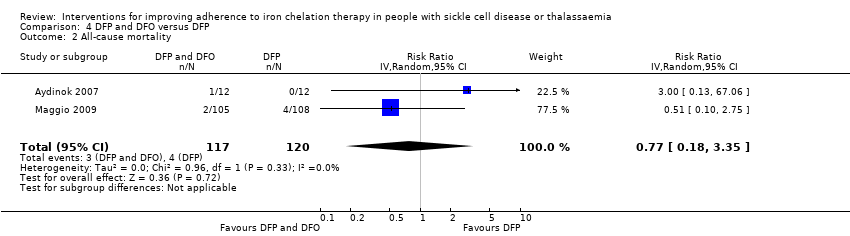 Comparison 4 DFP and DFO versus DFP, Outcome 2 All‐cause mortality. | ||||
| 3 Incidence of chelation therapy‐related AEs Show forest plot | 3 | Risk Ratio (IV, Random, 99% CI) | Subtotals only | |
| Analysis 4.3  Comparison 4 DFP and DFO versus DFP, Outcome 3 Incidence of chelation therapy‐related AEs. | ||||
| 3.1 Risk of leukopenia, neutropenia and/or agranulocytosis | 3 | 280 | Risk Ratio (IV, Random, 99% CI) | 1.15 [0.50, 2.62] |
| 3.2 Risk of pain or swelling in joints | 2 | 256 | Risk Ratio (IV, Random, 99% CI) | 0.76 [0.31, 1.91] |
| 3.3 Risk of gastrointestinal disturbances | 1 | 213 | Risk Ratio (IV, Random, 99% CI) | 0.45 [0.15, 1.37] |
| 3.4 Risk of increased liver transaminase | 2 | 256 | Risk Ratio (IV, Random, 99% CI) | 1.02 [0.52, 1.98] |
| 3.5 Nausea/vomiting | 1 | 43 | Risk Ratio (IV, Random, 99% CI) | 0.55 [0.13, 2.23] |
| Outcome or subgroup title | No. of studies | No. of participants | Statistical method | Effect size |
| 1 Other AEs related to iron chelation Show forest plot | 4 | Risk Ratio (IV, Random, 99% CI) | Subtotals only | |
| Analysis 5.1  Comparison 5 DFP and DFO versus DFO, Outcome 1 Other AEs related to iron chelation. | ||||
| 1.1 Risk of leukopenia, neutropenia and/or agranulocytosis | 3 | 169 | Risk Ratio (IV, Random, 99% CI) | 1.18 [0.09, 15.37] |
| 1.2 Risk of pain or swelling in joints | 3 | 135 | Risk Ratio (IV, Random, 99% CI) | 2.39 [0.18, 32.31] |
| 1.3 Risk of increased liver transaminase | 2 | 104 | Risk Ratio (IV, Random, 99% CI) | 3.46 [0.45, 26.62] |
| 1.4 Nausea/vomiting | 4 | 194 | Risk Ratio (IV, Random, 99% CI) | 3.81 [0.84, 17.36] |
| 1.5 Local reactions at infusion site | 2 | 90 | Risk Ratio (IV, Random, 99% CI) | 0.18 [0.01, 3.56] |
| Outcome or subgroup title | No. of studies | No. of participants | Statistical method | Effect size |
| 1 Adherence to iron chelation therapy rates Show forest plot | 1 | 96 | Risk Ratio (IV, Random, 95% CI) | 0.84 [0.72, 0.99] |
| Analysis 6.1  Comparison 6 DFP/DFX versus DFP/DFO, Outcome 1 Adherence to iron chelation therapy rates. | ||||
| 2 Incidence of SAE Show forest plot | 1 | 96 | Risk Ratio (M‐H, Random, 95% CI) | 1.0 [0.06, 15.53] |
| Analysis 6.2  Comparison 6 DFP/DFX versus DFP/DFO, Outcome 2 Incidence of SAE. | ||||
| 3 All‐cause mortality Show forest plot | 1 | Risk Ratio (IV, Random, 95% CI) | Totals not selected | |
| Analysis 6.3  Comparison 6 DFP/DFX versus DFP/DFO, Outcome 3 All‐cause mortality. | ||||
| 4 Organ damage (serum creatinine (≥33%) above baseline in 2 consecutive occasions) Show forest plot | 1 | 96 | Risk Ratio (M‐H, Random, 99% CI) | 3.0 [0.16, 56.04] |
| Analysis 6.4  Comparison 6 DFP/DFX versus DFP/DFO, Outcome 4 Organ damage (serum creatinine (≥33%) above baseline in 2 consecutive occasions). | ||||
| 5 Other AEs related to iron chelation Show forest plot | 1 | Risk Ratio (IV, Random, 99% CI) | Subtotals only | |
| Analysis 6.5 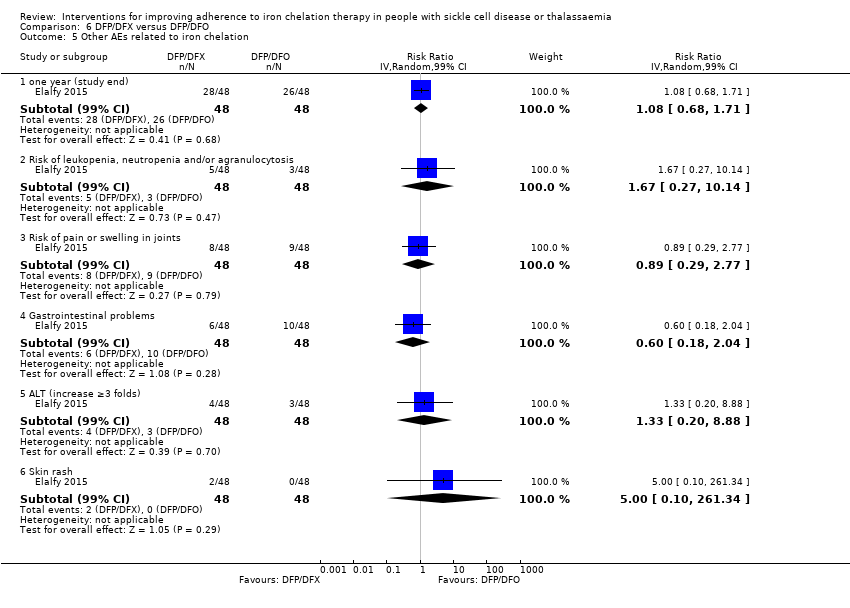 Comparison 6 DFP/DFX versus DFP/DFO, Outcome 5 Other AEs related to iron chelation. | ||||
| 5.1 one year (study end) | 1 | 96 | Risk Ratio (IV, Random, 99% CI) | 1.08 [0.68, 1.71] |
| 5.2 Risk of leukopenia, neutropenia and/or agranulocytosis | 1 | 96 | Risk Ratio (IV, Random, 99% CI) | 1.67 [0.27, 10.14] |
| 5.3 Risk of pain or swelling in joints | 1 | 96 | Risk Ratio (IV, Random, 99% CI) | 0.89 [0.29, 2.77] |
| 5.4 Gastrointestinal problems | 1 | 96 | Risk Ratio (IV, Random, 99% CI) | 0.6 [0.18, 2.04] |
| 5.5 ALT (increase ≥3 folds) | 1 | 96 | Risk Ratio (IV, Random, 99% CI) | 1.33 [0.20, 8.88] |
| 5.6 Skin rash | 1 | 96 | Risk Ratio (IV, Random, 99% CI) | 5.0 [0.10, 261.34] |

Study flow diagram.
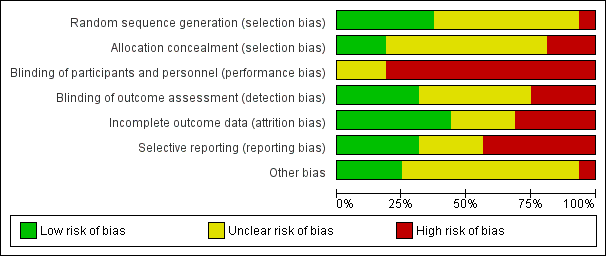
Risk of bias graph: review authors' judgements about each risk of bias item presented as percentages across all included studies.

Risk of bias summary: review authors' judgements about each risk of bias item for each included study.
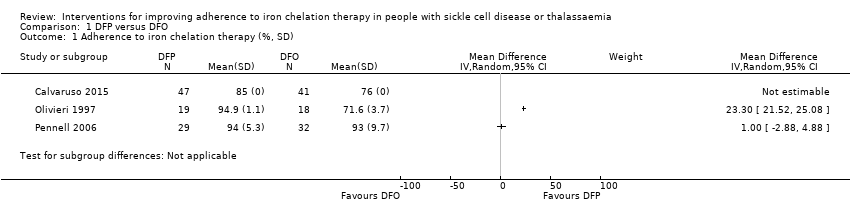
Comparison 1 DFP versus DFO, Outcome 1 Adherence to iron chelation therapy (%, SD).

Comparison 1 DFP versus DFO, Outcome 2 SAEs (from therapy, disease, non‐adherence).
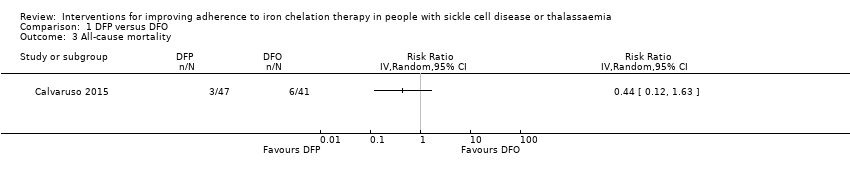
Comparison 1 DFP versus DFO, Outcome 3 All‐cause mortality.

Comparison 1 DFP versus DFO, Outcome 4 Iron overload: defined as proportion of participants with serum ferritin ≥ 800 (µg/L).

Comparison 1 DFP versus DFO, Outcome 5 Organ damage.
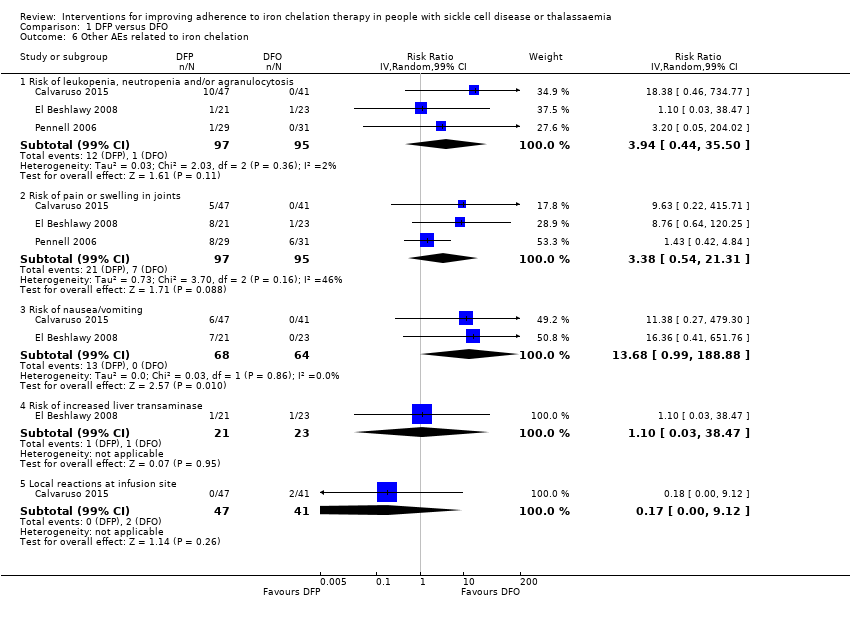
Comparison 1 DFP versus DFO, Outcome 6 Other AEs related to iron chelation.

Comparison 2 DFX versus DFO, Outcome 1 Adherence to iron chelation therapy (%, SD).

Comparison 2 DFX versus DFO, Outcome 2 SAEs.
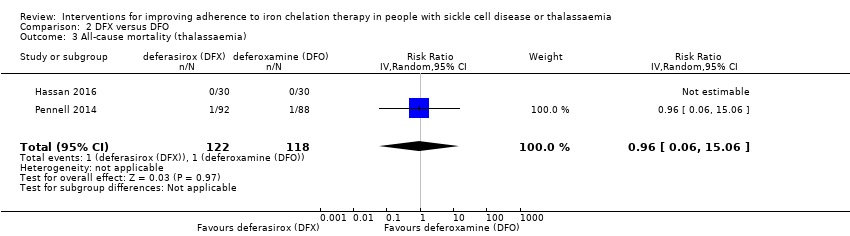
Comparison 2 DFX versus DFO, Outcome 3 All‐cause mortality (thalassaemia).
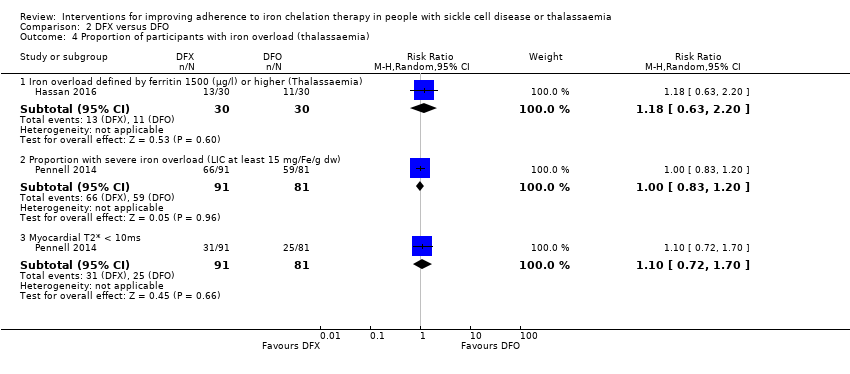
Comparison 2 DFX versus DFO, Outcome 4 Proportion of participants with iron overload (thalassaemia).
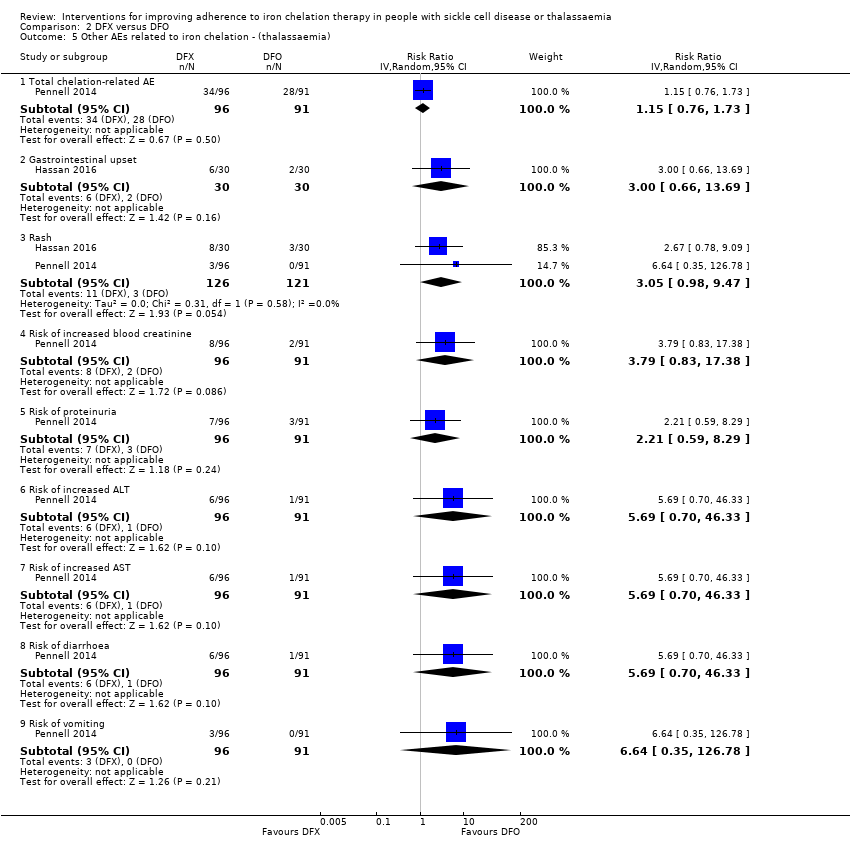
Comparison 2 DFX versus DFO, Outcome 5 Other AEs related to iron chelation ‐ (thalassaemia).

Comparison 2 DFX versus DFO, Outcome 6 Total AEs (thalassaemia).

Comparison 2 DFX versus DFO, Outcome 7 Other AEs related to iron chelation (SCD).

Comparison 3 DFX film‐coated tablet versus DFX dispersible tablet, Outcome 1 Adherence to iron chelation therapy.

Comparison 3 DFX film‐coated tablet versus DFX dispersible tablet, Outcome 2 Incidence of SAEs.
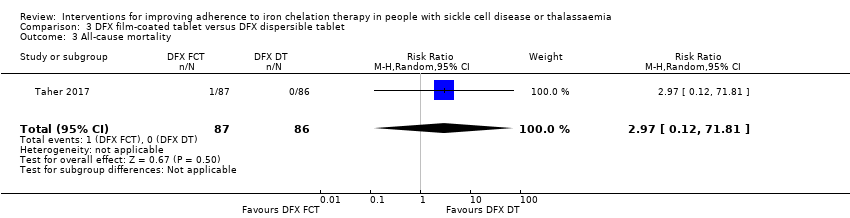
Comparison 3 DFX film‐coated tablet versus DFX dispersible tablet, Outcome 3 All‐cause mortality.

Comparison 3 DFX film‐coated tablet versus DFX dispersible tablet, Outcome 4 Incidence of organ damage (renal event).

Comparison 3 DFX film‐coated tablet versus DFX dispersible tablet, Outcome 5 Other AEs related to iron chelation.

Comparison 4 DFP and DFO versus DFP, Outcome 1 Incidence of SAEs.

Comparison 4 DFP and DFO versus DFP, Outcome 2 All‐cause mortality.

Comparison 4 DFP and DFO versus DFP, Outcome 3 Incidence of chelation therapy‐related AEs.
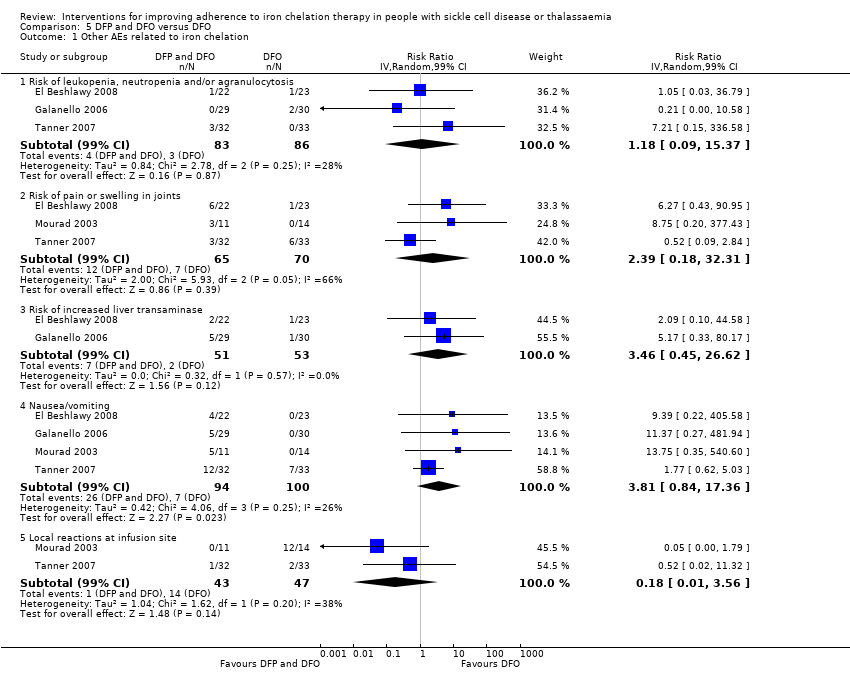
Comparison 5 DFP and DFO versus DFO, Outcome 1 Other AEs related to iron chelation.
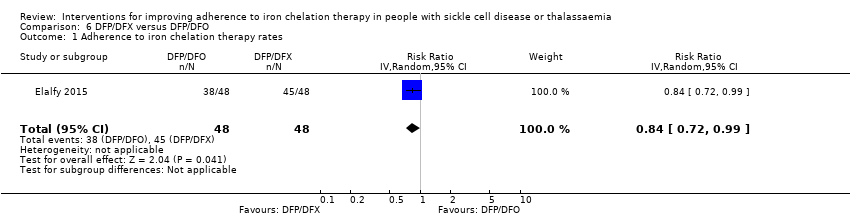
Comparison 6 DFP/DFX versus DFP/DFO, Outcome 1 Adherence to iron chelation therapy rates.

Comparison 6 DFP/DFX versus DFP/DFO, Outcome 2 Incidence of SAE.

Comparison 6 DFP/DFX versus DFP/DFO, Outcome 3 All‐cause mortality.

Comparison 6 DFP/DFX versus DFP/DFO, Outcome 4 Organ damage (serum creatinine (≥33%) above baseline in 2 consecutive occasions).

Comparison 6 DFP/DFX versus DFP/DFO, Outcome 5 Other AEs related to iron chelation.
| DFP compared to DFO for improving adherence to iron chelation therapy in people with sickle cell disease or thalassaemia | ||||||
| Patient or population: improving adherence to iron chelation therapy in people with sickle cell disease or thalassaemia | ||||||
| Outcomes | Anticipated absolute effects* (95% CI) | Relative effect | № of participants | Certainty of the evidence | Comments | |
| Risk with DFO | Risk with DFP | |||||
| Adherence to iron chelation therapy (per cent, SD) | ‐ | 242 (4 RCTs) | ⊕⊝⊝⊝ | We found considerable heterogeneity and identified age as possible cause: 1 trial in children 10 years or older and 1 conducted in participants 18 or older | ||
| SAEs (from therapy, disease, non‐adherence) Agranulocytosis** | Study population | RR 7.88 | 88 | ⊕⊝⊝⊝ | No SAEs were reported in the second trial reporting this outcome | |
| 15 per 1000 | 118 per 1,000 (7 to 1000) | |||||
| All‐cause mortality | Study population | RR 0.44 | 88 | ⊕⊝⊝⊝ | No deaths occurred in the second trial reporting this outcome | |
| 146 per 1000 | 64 per 1000 | |||||
| Sustained adherence ‐ not measured | ‐ | ‐ | ‐ | ‐ | ‐ | Sustained adherence is reported as adherence as all trials were longer than 6 months and only end of trial adherence numbers were provided |
| Quality of life ‐ not reported | ‐ | ‐ | ‐ | ‐ | ‐ | |
| *The risk in the intervention group (and its 95% confidence interval) is based on the assumed risk in the comparison group and the relative effect of the intervention (and its 95% CI). | ||||||
| GRADE Working Group grades of evidence | ||||||
| 1 We downgraded the quality of evidence by 1 for risk of bias due to high or uncertain risk of bias due to lack of blinding of participants and personnel in all four RCTs, as well as selection bias (Olivieri 1997), attrition bias (El Beshlawy 2008; Olivieri 1997), reporting bias (El Beshlawy 2008; Pennell 2006), and other bias (Pennell 2006). ** Risk estimate based on: Tricta F, Uetrecht J, Galanello R, et al. Deferiprone‐induced agranulocytosis: 20 years of clinical observations. American Journal of Hematology. 2016;91(10):1026‐1031. doi:10.1002/ajh.24479. | ||||||
| DFX compared to DFO for improving adherence to iron chelation therapy in people with sickle cell disease or thalassaemia | ||||||
| Patient or population: improving adherence to iron chelation therapy in people with sickle cell disease or thalassaemia | ||||||
| Outcomes | Anticipated absolute effects* (95% CI) | Relative effect | № of participants | Certainty of the evidence | Comments | |
| Risk with DFO | Risk with DFX | |||||
| Adherence to iron chelation therapy (per cent, SD) | The mean adherence to iron chelation therapy (per cent, SD) was 0 | MD 1.4 lower | ‐ | 197 | ⊕⊝⊝⊝ | Narrative report of adherence for 2 trials as either no or incompatible data to enable comparisons |
| SAEs ‐ thalassaemia‐related SAEs | Study population | ‐ | 247 | ⊕⊝⊝⊝ | There were no SAEs to report in one trial so no estimate of effect | |
| see comment | see comment | |||||
| SAEs ‐ SCD‐related SAEs | Study population | RR 1.08 | 195 | ⊕⊝⊝⊝ | ||
| 429 per 1000 | 463 per 1000 | |||||
| Incidence of SCD‐related SAEs ‐pain crisis | Study population | RR 1.05 | 195 | ⊕⊝⊝⊝ | ||
| 317 per 1000 | 333 per 1000 | |||||
| All‐cause mortality (thalassaemia) | Study population | RR 0.96 | 240 | ⊕⊝⊝⊝ | ||
| 8 per 1000 | 8 per 1000 | |||||
| Sustained adherence ‐ not measured | ‐ | ‐ | ‐ | ‐ | ‐ | Sustained adherence is reported as adherence as all trials were longer than 6 months and only end of trial adherence reported |
| Quality of life ‐ not reported | ‐ | ‐ | ‐ | ‐ | ‐ | |
| *The risk in the intervention group (and its 95% CI) is based on the assumed risk in the comparison group and the relative effect of the intervention (and its 95% CI). | ||||||
| GRADE Working Group grades of evidence | ||||||
| 1 We downgraded the quality of evidence by 2 due to high or uncertain risk of bias in several domains | ||||||
| DFX film‐coated tablet compared to DFX dispersible tablet for improving adherence to iron chelation therapy in people with sickle cell disease or thalassaemia | ||||||
| Patient or population: improving adherence to iron chelation therapy in people with sickle cell disease or thalassaemia | ||||||
| Outcomes | Anticipated absolute effects* (95% CI) | Relative effect | № of participants | Certainty of the evidence | Comments | |
| Risk with DFX dispersible tablet | Risk with DFX film‐coated tablet | |||||
| Adherence to iron chelation therapy (n, N) | Study population | RR 1.10 | 173 | ⊕⊕⊝⊝ | ||
| 849 per 1000 | 934 per 1000 | |||||
| Incidence of SAEs | Study population | RR 1.22 | 173 | ⊕⊝⊝⊝ | ||
| 151 per 1,000 | 184 per 1000 | |||||
| All‐cause mortality | Study population | RR 2.97 | 173 | ⊕⊝⊝⊝ | ||
| 0 per 1000 | 0 per 1000 | |||||
| Sustained adherence ‐ not measured | ‐ | ‐ | ‐ | ‐ | ‐ | Reported as adherence as trial was 6 months in duration and end of trial adherence reported |
| Quality of life ‐ not reported | ‐ | ‐ | ‐ | ‐ | ‐ | |
| *The risk in the intervention group (and its 95% confidence interval) is based on the assumed risk in the comparison group and the relative effect of the intervention (and its 95% CI). | ||||||
| GRADE Working Group grades of evidence | ||||||
| 1 We downgraded the quality of evidence by 2 for risk of bias due to high or unclear risk of bias in all domains | ||||||
| DFP and DFO compared to DFP for improving adherence to iron chelation therapy in people with sickle cell disease or thalassaemia | ||||||
| Patient or population: improving adherence to iron chelation therapy in people with sickle cell disease or thalassaemia | ||||||
| Outcomes | Anticipated absolute effects* (95% CI) | Relative effect | № of participants | Certainty of the evidence | Comments | |
| Risk with DFP | Risk with DFP and DFO | |||||
| Adherence to iron chelation therapy (per cent, SD) | see comment | see comment | ‐ | 289 (3 RCTs) | ⊕⊝⊝⊝ | Reported as narrative as no comparisons possible |
| Incidence of SAEs | Study population | RR 0.15 | 213 | ⊕⊕⊝⊝ | ||
| 28 per 1,000 | 4 per 1,000 | |||||
| All‐cause mortality | Study population | RR 0.77 | 237 | ⊕⊝⊝⊝ | ||
| 33 per 1,000 | 26 per 1,000 | |||||
| Sustained adherence ‐ not measured | ‐ | ‐ | ‐ | ‐ | ‐ | Sustained adherence is reported as adherence as trial duration longer than 6 months and reports adherence for length of trial |
| Quality of life ‐ not reported | ‐ | ‐ | ‐ | ‐ | ‐ | Quality of life was either not reported or no validated instruments were used |
| *The risk in the intervention group (and its 95% confidence interval) is based on the assumed risk in the comparison group and the relative effect of the intervention (and its 95% CI). | ||||||
| GRADE Working Group grades of evidence | ||||||
| 1 We downgraded the quality of evidence by 2 for risk of bias as there was high or uncertain risk of bias in most domains in 3 out of 4 trials | ||||||
| DFP and DFO compared to DFO for improving adherence to iron chelation therapy in people with sickle cell disease or thalassaemia | ||||||
| Patient or population: improving adherence to iron chelation therapy in people with sickle cell disease or thalassaemia | ||||||
| Outcomes | Anticipated absolute effects* (95% CI) | Relative effect | № of participants | Certainty of the evidence | Comments | |
| Risk with DFO | Risk with DFP and DFO | |||||
| Adherence to iron chelation therapy (per cent, SD) | see comment | see comment | ‐ | 205 (4 RCTs) | ⊕⊕⊝⊝ | Reported as narrative only as adherence in combined group not reported for combination therapy |
| Incidence of SAEs | Study population | ‐ | 205 (4 RCTs) | ⊕⊕⊝⊝ | 3 trials report no SAEs; SAES are not reported in one trial | |
| see comment | see comment | |||||
| All‐cause mortality | Study population | ‐ | 205 (4 RCTs) | ⊕⊕⊝⊝ | no deaths reported | |
| see comment | see comment | |||||
| Sustained adherence ‐ not measured | ‐ | ‐ | ‐ | ‐ | ‐ | Sustained adherence reported as adherence as trial duration was longer than 6 months and adherence reported at end of trial |
| Quality of life ‐ not reported | ‐ | ‐ | ‐ | ‐ | ‐ | |
| *The risk in the intervention group (and its 95% CI) is based on the assumed risk in the comparison group and the relative effect of the intervention (and its 95% CI). | ||||||
| GRADE Working Group grades of evidence | ||||||
| 1 We downgraded the quality of evidence by 2 for risk of bias as high or unclear risk of bias in all domains | ||||||
| DFP/DFO compared to DFP/DFX for improving adherence to iron chelation therapy in people with sickle cell disease or thalassaemia | ||||||
| Patient or population: improving adherence to iron chelation therapy in people with sickle cell disease or thalassaemia | ||||||
| Outcomes | Anticipated absolute effects* (95% CI) | Relative effect | № of participants | Certainty of the evidence | Comments | |
| Risk with DFP/DFX | Risk with DFP/DFO | |||||
| Adherence to iron chelation therapy rates (n,N) ‐ 1 year | Study population | RR 0.84 | 96 | ⊕⊕⊝⊝ | ||
| 938 per 1000 | 788 per 1000 | |||||
| Incidence of SAE | Study population | RR 1.00 | 96 | ⊕⊝⊝⊝ | ||
| 21 per 1,000 | 21 per 1000 | |||||
| All‐cause mortality ‐ at 1 year ‐ trial end | Study population | Not estimable | 96 | ⊕⊕⊝⊝ | No deaths were reported | |
| 0 per 1000 | 0 per 1000 | |||||
| Sustained adherence ‐ not measured | ‐ | ‐ | ‐ | ‐ | ‐ | Sustained adherence is reported as adherence as trial was 1 year in duration and end of trial adherence reported |
| Quality of life see comment | ‐ | ‐ | ‐ | ‐ | ‐ | The study uses SF36 to measure quality of life, the results are presented as a graph. Quality of life increased in both trial arms with no significant difference between trial arms P = 0.860 |
| *The risk in the intervention group (and its 95% confidence interval) is based on the assumed risk in the comparison group and the relative effect of the intervention (and its 95% CI). | ||||||
| GRADE Working Group grades of evidence | ||||||
| 1 We downgraded the quality of evidence by 1 for risk of bias as there was high or unclear risk of bias in 3 domains | ||||||
| Medication management compared to standard care for improving adherence to iron chelation therapy in people with sickle cell disease or thalassaemia | ||||||
| Patient or population: improving adherence to iron chelation therapy in people with sickle cell disease or thalassaemia | ||||||
| Outcomes | Anticipated absolute effects* (95% CI) | Relative effect | № of participants | Certainty of the evidence | Comments | |
| Risk with standard care | Risk with medication management | |||||
| Adherence to iron chelation therapy ‐ not reported | ‐ | ‐ | ‐ | Adherence was only reported in the intervention group and therefore no comparative data | ||
| SAEs ‐ not reported | ‐ | ‐ | ‐ | ‐ | ‐ | |
| Mortality ‐ not reported | ‐ | ‐ | ‐ | ‐ | ‐ | |
| Sustained adherence | ‐ | ‐ | ‐ | ‐ | ‐ | Adherence was only reported in the intervention group and therefore no comparative data |
| Quality of life | ‐ | 48 | ⊕⊝⊝⊝ | Medication management: 63.51 (51.75 – 84.54); standard care: 49.84 (41.9 – 60.81) | ||
| *The risk in the intervention group (and its 95% confidence interval) is based on the assumed risk in the comparison group and the relative effect of the intervention (and its 95% CI). | ||||||
| GRADE Working Group grades of evidence | ||||||
| 1 We downgraded the quality of evidence for indirectness by 2 because most outcomes were only reported in the medication management group | ||||||
| STUDY | HOW ADHERENCE MEASURED | RESULTS |
| Aydinok 2007 |
|
|
| Badawy 2010 |
|
|
| Bahnasawy 2017 |
|
|
| Calvaruso 2015 |
|
|
| El Beshlawy 2008 |
|
|
| Elalfy 2015 |
|
|
| Galanello 2006 |
|
|
| Hassan 2016 |
|
|
| Maggio 2009 |
|
|
| Mourad 2003 |
|
|
| Olivieri 1997 |
|
|
| Pennell 2006 |
|
|
| Pennell 2014 |
|
|
| Taher 2017 |
|
|
| Tanner 2007 |
|
|
| Vichinsky 2007 |
|
|
| DFO: deferoxamine | ||
| Outcome or subgroup title | No. of studies | No. of participants | Statistical method | Effect size |
| 1 Adherence to iron chelation therapy (%, SD) Show forest plot | 3 | Mean Difference (IV, Random, 95% CI) | Subtotals only | |
| 2 SAEs (from therapy, disease, non‐adherence) Show forest plot | 1 | Risk Ratio (M‐H, Random, 99% CI) | Totals not selected | |
| 2.1 Agranulocytosis | 1 | Risk Ratio (M‐H, Random, 99% CI) | 0.0 [0.0, 0.0] | |
| 3 All‐cause mortality Show forest plot | 1 | Risk Ratio (IV, Random, 95% CI) | Totals not selected | |
| 4 Iron overload: defined as proportion of participants with serum ferritin ≥ 800 (µg/L) Show forest plot | 1 | Risk Ratio (M‐H, Fixed, 95% CI) | Totals not selected | |
| 5 Organ damage Show forest plot | 1 | Risk Ratio (M‐H, Random, 95% CI) | Totals not selected | |
| 5.1 Liver damage | 1 | Risk Ratio (M‐H, Random, 95% CI) | 0.0 [0.0, 0.0] | |
| 6 Other AEs related to iron chelation Show forest plot | 3 | Risk Ratio (IV, Random, 99% CI) | Subtotals only | |
| 6.1 Risk of leukopenia, neutropenia and/or agranulocytosis | 3 | 192 | Risk Ratio (IV, Random, 99% CI) | 3.94 [0.44, 35.50] |
| 6.2 Risk of pain or swelling in joints | 3 | 192 | Risk Ratio (IV, Random, 99% CI) | 3.38 [0.54, 21.31] |
| 6.3 Risk of nausea/vomiting | 2 | 132 | Risk Ratio (IV, Random, 99% CI) | 13.68 [0.99, 188.88] |
| 6.4 Risk of increased liver transaminase | 1 | 44 | Risk Ratio (IV, Random, 99% CI) | 1.10 [0.03, 38.47] |
| 6.5 Local reactions at infusion site | 1 | 88 | Risk Ratio (IV, Random, 99% CI) | 0.17 [0.00, 9.12] |
| Outcome or subgroup title | No. of studies | No. of participants | Statistical method | Effect size |
| 1 Adherence to iron chelation therapy (%, SD) Show forest plot | 1 | Mean Difference (IV, Random, 95% CI) | Totals not selected | |
| 2 SAEs Show forest plot | 3 | Risk Ratio (M‐H, Random, 95% CI) | Totals not selected | |
| 2.1 Thalassaemia‐related SAEs | 2 | Risk Ratio (M‐H, Random, 95% CI) | 0.0 [0.0, 0.0] | |
| 2.2 SCD‐related SAE ‐ painful crisis | 1 | Risk Ratio (M‐H, Random, 95% CI) | 0.0 [0.0, 0.0] | |
| 2.3 SCD‐related SAEs ‐ other SCD‐related SAEs | 1 | Risk Ratio (M‐H, Random, 95% CI) | 0.0 [0.0, 0.0] | |
| 3 All‐cause mortality (thalassaemia) Show forest plot | 2 | 240 | Risk Ratio (IV, Random, 95% CI) | 0.96 [0.06, 15.06] |
| 4 Proportion of participants with iron overload (thalassaemia) Show forest plot | 2 | Risk Ratio (M‐H, Random, 95% CI) | Subtotals only | |
| 4.1 Iron overload defined by ferritin 1500 (µg/l) or higher (Thalassaemia) | 1 | 60 | Risk Ratio (M‐H, Random, 95% CI) | 1.18 [0.63, 2.20] |
| 4.2 Proportion with severe iron overload (LIC at least 15 mg/Fe/g dw) | 1 | 172 | Risk Ratio (M‐H, Random, 95% CI) | 1.00 [0.83, 1.20] |
| 4.3 Myocardial T2* < 10ms | 1 | 172 | Risk Ratio (M‐H, Random, 95% CI) | 1.10 [0.72, 1.70] |
| 5 Other AEs related to iron chelation ‐ (thalassaemia) Show forest plot | 2 | Risk Ratio (IV, Random, 95% CI) | Subtotals only | |
| 5.1 Total chelation‐related AE | 1 | 187 | Risk Ratio (IV, Random, 95% CI) | 1.15 [0.76, 1.73] |
| 5.2 Gastrointestinal upset | 1 | 60 | Risk Ratio (IV, Random, 95% CI) | 3.0 [0.66, 13.69] |
| 5.3 Rash | 2 | 247 | Risk Ratio (IV, Random, 95% CI) | 3.05 [0.98, 9.47] |
| 5.4 Risk of increased blood creatinine | 1 | 187 | Risk Ratio (IV, Random, 95% CI) | 3.79 [0.83, 17.38] |
| 5.5 Risk of proteinuria | 1 | 187 | Risk Ratio (IV, Random, 95% CI) | 2.21 [0.59, 8.29] |
| 5.6 Risk of increased ALT | 1 | 187 | Risk Ratio (IV, Random, 95% CI) | 5.69 [0.70, 46.33] |
| 5.7 Risk of increased AST | 1 | 187 | Risk Ratio (IV, Random, 95% CI) | 5.69 [0.70, 46.33] |
| 5.8 Risk of diarrhoea | 1 | 187 | Risk Ratio (IV, Random, 95% CI) | 5.69 [0.70, 46.33] |
| 5.9 Risk of vomiting | 1 | 187 | Risk Ratio (IV, Random, 95% CI) | 6.64 [0.35, 126.78] |
| 6 Total AEs (thalassaemia) Show forest plot | 1 | Risk Ratio (IV, Random, 95% CI) | Totals not selected | |
| 7 Other AEs related to iron chelation (SCD) Show forest plot | 1 | Risk Ratio (M‐H, Random, 99% CI) | Subtotals only | |
| 7.1 Risk of increased ALT | 1 | 195 | Risk Ratio (M‐H, Random, 99% CI) | 5.29 [0.12, 232.98] |
| 7.2 incidence of abdominal pain | 1 | 195 | Risk Ratio (M‐H, Random, 99% CI) | 1.91 [0.80, 4.58] |
| 7.3 Risk of pain or swelling in joints | 1 | 195 | Risk Ratio (M‐H, Random, 99% CI) | 1.06 [0.41, 2.76] |
| 7.4 Risk of diarrhoea | 1 | 195 | Risk Ratio (M‐H, Random, 99% CI) | 4.14 [0.90, 18.92] |
| 7.5 Nausea/vomiting | 1 | 195 | Risk Ratio (M‐H, Random, 99% CI) | 1.63 [0.90, 2.94] |
| Outcome or subgroup title | No. of studies | No. of participants | Statistical method | Effect size |
| 1 Adherence to iron chelation therapy Show forest plot | 1 | 173 | Risk Ratio (M‐H, Random, 95% CI) | 1.10 [0.99, 1.22] |
| 2 Incidence of SAEs Show forest plot | 1 | 173 | Risk Ratio (IV, Random, 95% CI) | 1.22 [0.62, 2.37] |
| 3 All‐cause mortality Show forest plot | 1 | 173 | Risk Ratio (M‐H, Random, 95% CI) | 2.97 [0.12, 71.81] |
| 4 Incidence of organ damage (renal event) Show forest plot | 1 | 173 | Risk Ratio (IV, Random, 95% CI) | 1.25 [0.83, 1.91] |
| 5 Other AEs related to iron chelation Show forest plot | 1 | Risk Ratio (IV, Random, 99% CI) | Subtotals only | |
| 5.1 Total chelation‐related AEs | 1 | 173 | Risk Ratio (IV, Random, 99% CI) | 0.75 [0.52, 1.08] |
| 5.2 Risk of diarrhoea | 1 | 173 | Risk Ratio (IV, Random, 99% CI) | 0.70 [0.29, 1.70] |
| 5.3 Increased urine protein/urine creatinine ratio | 1 | 173 | Risk Ratio (IV, Random, 99% CI) | 1.65 [0.60, 4.54] |
| 5.4 incidence of abdominal pain | 1 | 173 | Risk Ratio (IV, Random, 99% CI) | 0.49 [0.16, 1.52] |
| 5.5 Incidence of nausea | 1 | 173 | Risk Ratio (IV, Random, 99% CI) | 0.72 [0.23, 2.23] |
| 5.6 Incidence of vomiting | 1 | 173 | Risk Ratio (IV, Random, 99% CI) | 0.28 [0.07, 1.15] |
| Outcome or subgroup title | No. of studies | No. of participants | Statistical method | Effect size |
| 1 Incidence of SAEs Show forest plot | 1 | 213 | Risk Ratio (M‐H, Random, 95% CI) | 0.15 [0.01, 2.81] |
| 2 All‐cause mortality Show forest plot | 2 | 237 | Risk Ratio (IV, Random, 95% CI) | 0.77 [0.18, 3.35] |
| 3 Incidence of chelation therapy‐related AEs Show forest plot | 3 | Risk Ratio (IV, Random, 99% CI) | Subtotals only | |
| 3.1 Risk of leukopenia, neutropenia and/or agranulocytosis | 3 | 280 | Risk Ratio (IV, Random, 99% CI) | 1.15 [0.50, 2.62] |
| 3.2 Risk of pain or swelling in joints | 2 | 256 | Risk Ratio (IV, Random, 99% CI) | 0.76 [0.31, 1.91] |
| 3.3 Risk of gastrointestinal disturbances | 1 | 213 | Risk Ratio (IV, Random, 99% CI) | 0.45 [0.15, 1.37] |
| 3.4 Risk of increased liver transaminase | 2 | 256 | Risk Ratio (IV, Random, 99% CI) | 1.02 [0.52, 1.98] |
| 3.5 Nausea/vomiting | 1 | 43 | Risk Ratio (IV, Random, 99% CI) | 0.55 [0.13, 2.23] |
| Outcome or subgroup title | No. of studies | No. of participants | Statistical method | Effect size |
| 1 Other AEs related to iron chelation Show forest plot | 4 | Risk Ratio (IV, Random, 99% CI) | Subtotals only | |
| 1.1 Risk of leukopenia, neutropenia and/or agranulocytosis | 3 | 169 | Risk Ratio (IV, Random, 99% CI) | 1.18 [0.09, 15.37] |
| 1.2 Risk of pain or swelling in joints | 3 | 135 | Risk Ratio (IV, Random, 99% CI) | 2.39 [0.18, 32.31] |
| 1.3 Risk of increased liver transaminase | 2 | 104 | Risk Ratio (IV, Random, 99% CI) | 3.46 [0.45, 26.62] |
| 1.4 Nausea/vomiting | 4 | 194 | Risk Ratio (IV, Random, 99% CI) | 3.81 [0.84, 17.36] |
| 1.5 Local reactions at infusion site | 2 | 90 | Risk Ratio (IV, Random, 99% CI) | 0.18 [0.01, 3.56] |
| Outcome or subgroup title | No. of studies | No. of participants | Statistical method | Effect size |
| 1 Adherence to iron chelation therapy rates Show forest plot | 1 | 96 | Risk Ratio (IV, Random, 95% CI) | 0.84 [0.72, 0.99] |
| 2 Incidence of SAE Show forest plot | 1 | 96 | Risk Ratio (M‐H, Random, 95% CI) | 1.0 [0.06, 15.53] |
| 3 All‐cause mortality Show forest plot | 1 | Risk Ratio (IV, Random, 95% CI) | Totals not selected | |
| 4 Organ damage (serum creatinine (≥33%) above baseline in 2 consecutive occasions) Show forest plot | 1 | 96 | Risk Ratio (M‐H, Random, 99% CI) | 3.0 [0.16, 56.04] |
| 5 Other AEs related to iron chelation Show forest plot | 1 | Risk Ratio (IV, Random, 99% CI) | Subtotals only | |
| 5.1 one year (study end) | 1 | 96 | Risk Ratio (IV, Random, 99% CI) | 1.08 [0.68, 1.71] |
| 5.2 Risk of leukopenia, neutropenia and/or agranulocytosis | 1 | 96 | Risk Ratio (IV, Random, 99% CI) | 1.67 [0.27, 10.14] |
| 5.3 Risk of pain or swelling in joints | 1 | 96 | Risk Ratio (IV, Random, 99% CI) | 0.89 [0.29, 2.77] |
| 5.4 Gastrointestinal problems | 1 | 96 | Risk Ratio (IV, Random, 99% CI) | 0.6 [0.18, 2.04] |
| 5.5 ALT (increase ≥3 folds) | 1 | 96 | Risk Ratio (IV, Random, 99% CI) | 1.33 [0.20, 8.88] |
| 5.6 Skin rash | 1 | 96 | Risk Ratio (IV, Random, 99% CI) | 5.0 [0.10, 261.34] |