Intervenciones para mejorar la adherencia al tratamiento de quelación del hierro en pacientes con anemia de células falciformes o talasemia
Información
- DOI:
- https://doi.org/10.1002/14651858.CD012349.pub2Copiar DOI

- Base de datos:
-
- Cochrane Database of Systematic Reviews
- Versión publicada:
-
- 08 mayo 2018see what's new
- Tipo:
-
- Intervention
- Etapa:
-
- Review
- Grupo Editorial Cochrane:
-
Grupo Cochrane de Fibrosis quística y enfermedades genéticas
- Copyright:
-
- Copyright © 2018 The Cochrane Collaboration. Published by John Wiley & Sons, Ltd.
Cifras del artículo
Altmetric:
Citado por:
Autores
Contributions of authors
-
Lise Estcourt: searching; selection of trials; eligibility assessment; content expert, and review content development
-
Patricia Fortin: searching; selection of trials; eligibility assessment; data extraction, risk of bias assessment, and review content development.
-
Karen Madgwick: selection of trials; eligibility assessment; data extraction, risk of bias assessment, content expert.
-
Sally Hopewell: methodological expert and review development.
-
Marialena Trivella: statistical and methodological expert and review development
-
Sheila Fisher: data extraction, risk of bias assessment, review content development.
Sources of support
Internal sources
-
NHS Blood and Transplant, Research and Development, UK.
To fund the work of the Systematic Review Initiative (SRI)
External sources
-
National Institute for Health Research (NIHR) Cochrane Programme Grant, UK.
To provide funding for systematic reviewers and methodological support from the Centre for Statistics in Medicine, Oxford
Declarations of interest
Lise Estcourt: partly funded by the NIHR Cochrane Programme Grant ‐ Safe and Appropriate Use of Blood Components.
Patricia Fortin: funded by the NIHR Cochrane Programme Grant ‐ Safe and Appropriate Use of Blood Components.
Karen Madgwick: none to declare.
Sally Hopewell: partly funded by the NIHR Cochrane Programme Grant ‐ Safe and Appropriate Use of Blood Components.
Marialena Trivella: partly funded by the NIHR Cochrane Programme Grant ‐ Safe and Appropriate Use of Blood Components.
Sheila Fisher: partly funded by the NIHR Cochrane Programme Grant ‐ Safe and Appropriate Use of Blood Components.
Acknowledgements
We thank the National Institute for Health Research for supporting this project, via Cochrane Infrastructure funding to the Cochrane Cystic Fibrosis and Genetic Disorders Group. The views and opinions expressed therein are those of the authors and do not necessarily reflect those of the Systematic Reviews Programme, NIHR, NHS or the Department of Health.
This review is part of a series of reviews that have been partly funded by the NIHR Cochrane Programme Grant ‐ Safe and Appropriate Use of Blood Components.
Version history
| Published | Title | Stage | Authors | Version |
| 2023 Mar 06 | Interventions for improving adherence to iron chelation therapy in people with sickle cell disease or thalassaemia | Review | Louise J Geneen, Carolyn Dorée, Lise J Estcourt | |
| 2018 May 08 | Interventions for improving adherence to iron chelation therapy in people with sickle cell disease or thalassaemia | Review | Patricia M Fortin, Sheila A Fisher, Karen V Madgwick, Marialena Trivella, Sally Hopewell, Carolyn Doree, Lise J Estcourt | |
| 2016 Sep 11 | Interventions for improving adherence to iron chelation therapy in people with sickle cell disease or thalassaemia | Protocol | Patricia M Fortin, Karen V Madgwick, Marialena Trivella, Sally Hopewell, Carolyn Doree, Lise J Estcourt | |
Differences between protocol and review
See Fortin 2016.
Confidence intervals
In most studies we were unable to report total adverse events due to participants having one or more of the listed adverse events. We therefore use the 99% CI to report estimates of effects in subgroups of adverse events.
Assessment of reporting biases
We could not assess reporting bias as there were fewer than 10 trials for each comparison
Subgroup analysis
Due to insufficient data we could not undertake subgroup analyses as planned in the protocol (see below). From the outset, we also reported separately on the SCD trial.
-
Age of participant (child (one to 12 years), adolescent (13 to 17 years) adult (18+ years))
-
Type of disease (SCD or thalassaemia)
-
Route of administration of iron chelating agents (oral, intravenous or subcutaneous)
Sensitivity analysis
We could not undertake sensitivity analyses due to a lack of data.
Keywords
MeSH
Medical Subject Headings (MeSH) Keywords
Medical Subject Headings Check Words
Child; Humans;
PICO

Study flow diagram.
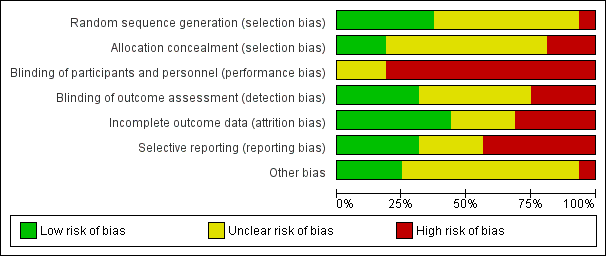
Risk of bias graph: review authors' judgements about each risk of bias item presented as percentages across all included studies.

Risk of bias summary: review authors' judgements about each risk of bias item for each included study.
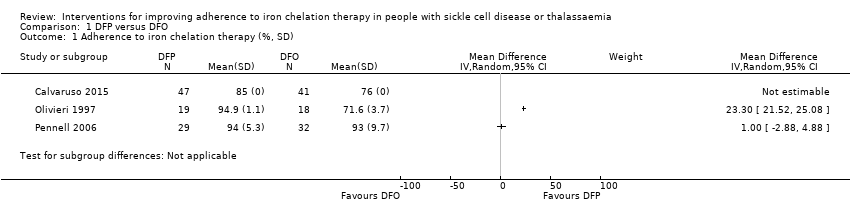
Comparison 1 DFP versus DFO, Outcome 1 Adherence to iron chelation therapy (%, SD).

Comparison 1 DFP versus DFO, Outcome 2 SAEs (from therapy, disease, non‐adherence).
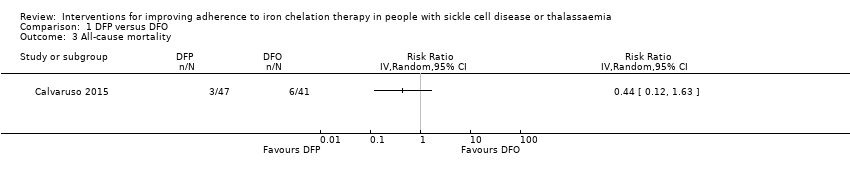
Comparison 1 DFP versus DFO, Outcome 3 All‐cause mortality.
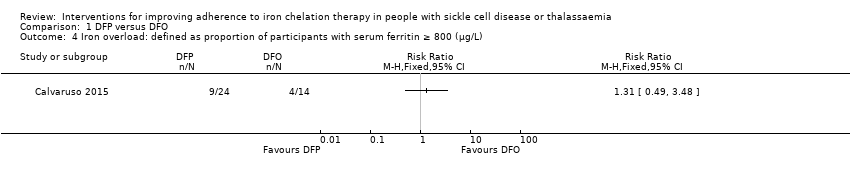
Comparison 1 DFP versus DFO, Outcome 4 Iron overload: defined as proportion of participants with serum ferritin ≥ 800 (µg/L).

Comparison 1 DFP versus DFO, Outcome 5 Organ damage.
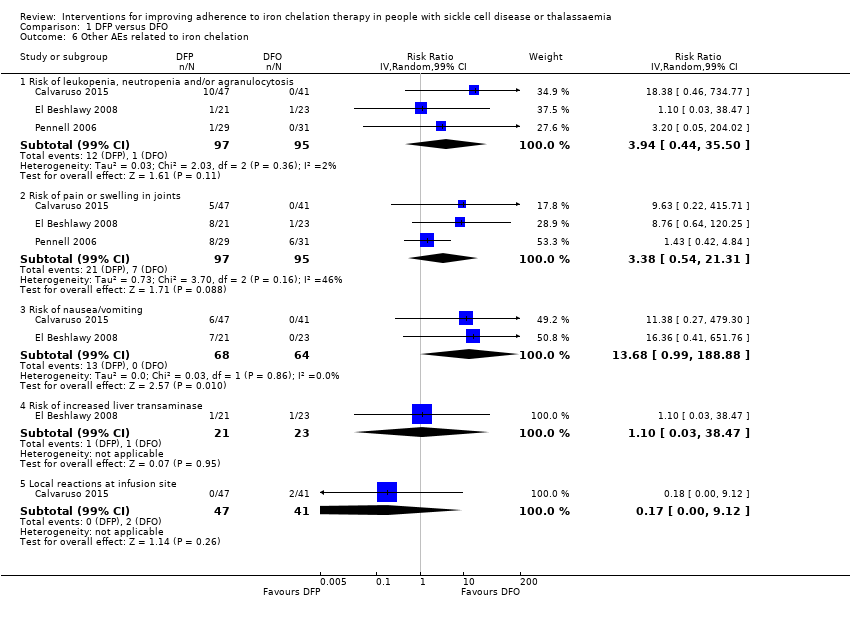
Comparison 1 DFP versus DFO, Outcome 6 Other AEs related to iron chelation.

Comparison 2 DFX versus DFO, Outcome 1 Adherence to iron chelation therapy (%, SD).

Comparison 2 DFX versus DFO, Outcome 2 SAEs.
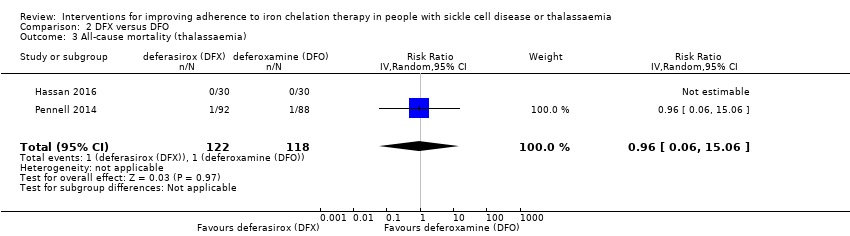
Comparison 2 DFX versus DFO, Outcome 3 All‐cause mortality (thalassaemia).
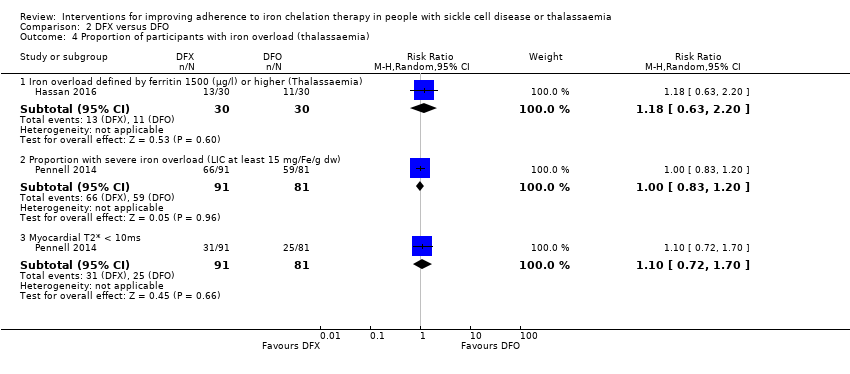
Comparison 2 DFX versus DFO, Outcome 4 Proportion of participants with iron overload (thalassaemia).
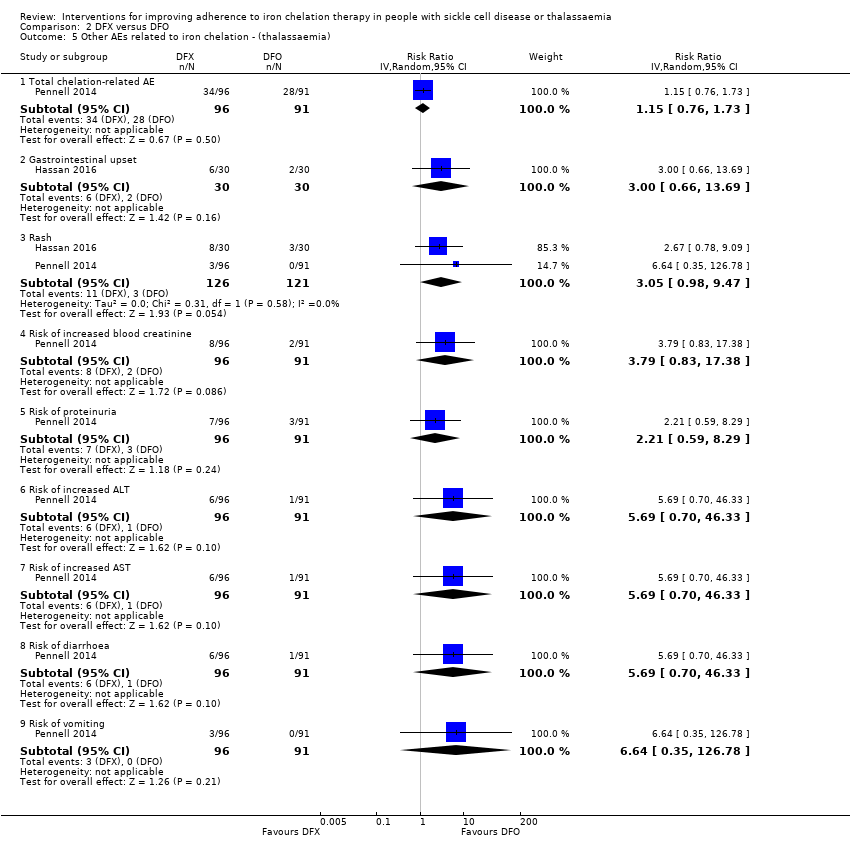
Comparison 2 DFX versus DFO, Outcome 5 Other AEs related to iron chelation ‐ (thalassaemia).

Comparison 2 DFX versus DFO, Outcome 6 Total AEs (thalassaemia).

Comparison 2 DFX versus DFO, Outcome 7 Other AEs related to iron chelation (SCD).

Comparison 3 DFX film‐coated tablet versus DFX dispersible tablet, Outcome 1 Adherence to iron chelation therapy.

Comparison 3 DFX film‐coated tablet versus DFX dispersible tablet, Outcome 2 Incidence of SAEs.
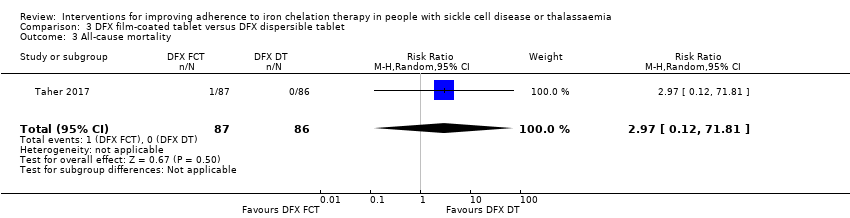
Comparison 3 DFX film‐coated tablet versus DFX dispersible tablet, Outcome 3 All‐cause mortality.
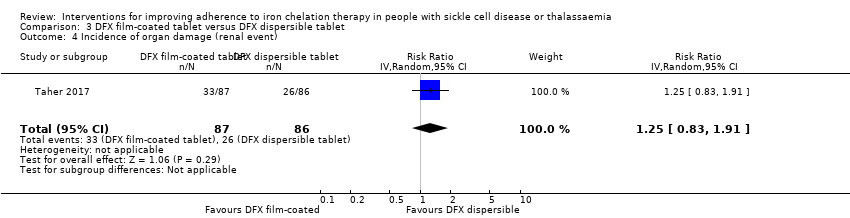
Comparison 3 DFX film‐coated tablet versus DFX dispersible tablet, Outcome 4 Incidence of organ damage (renal event).

Comparison 3 DFX film‐coated tablet versus DFX dispersible tablet, Outcome 5 Other AEs related to iron chelation.

Comparison 4 DFP and DFO versus DFP, Outcome 1 Incidence of SAEs.

Comparison 4 DFP and DFO versus DFP, Outcome 2 All‐cause mortality.

Comparison 4 DFP and DFO versus DFP, Outcome 3 Incidence of chelation therapy‐related AEs.
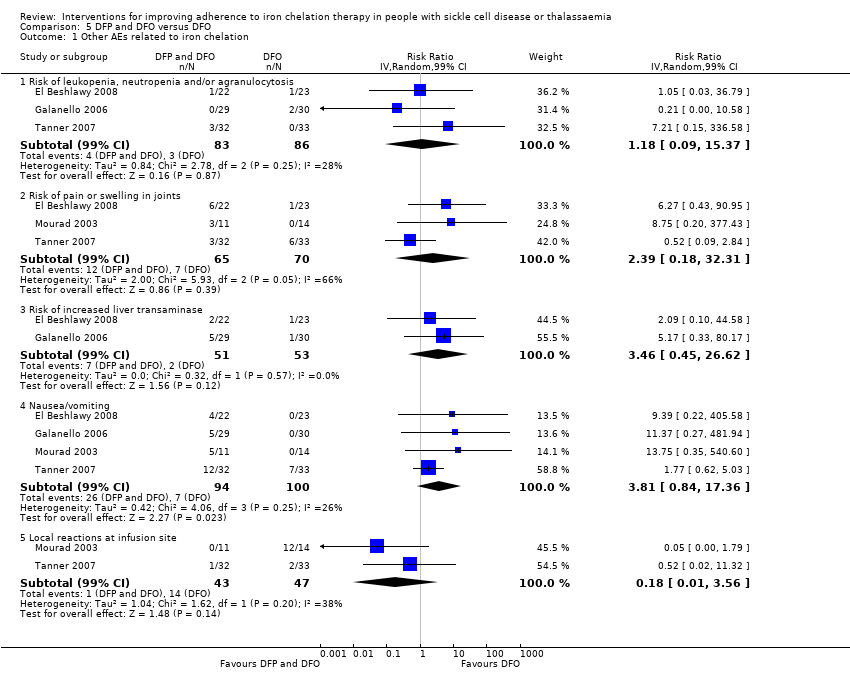
Comparison 5 DFP and DFO versus DFO, Outcome 1 Other AEs related to iron chelation.
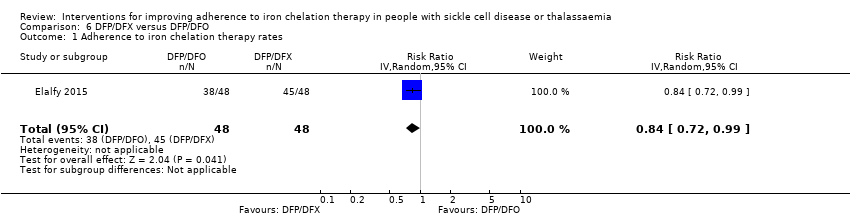
Comparison 6 DFP/DFX versus DFP/DFO, Outcome 1 Adherence to iron chelation therapy rates.

Comparison 6 DFP/DFX versus DFP/DFO, Outcome 2 Incidence of SAE.

Comparison 6 DFP/DFX versus DFP/DFO, Outcome 3 All‐cause mortality.

Comparison 6 DFP/DFX versus DFP/DFO, Outcome 4 Organ damage (serum creatinine (≥33%) above baseline in 2 consecutive occasions).

Comparison 6 DFP/DFX versus DFP/DFO, Outcome 5 Other AEs related to iron chelation.
| DFP compared to DFO for improving adherence to iron chelation therapy in people with sickle cell disease or thalassaemia | ||||||
| Patient or population: improving adherence to iron chelation therapy in people with sickle cell disease or thalassaemia | ||||||
| Outcomes | Anticipated absolute effects* (95% CI) | Relative effect | № of participants | Certainty of the evidence | Comments | |
| Risk with DFO | Risk with DFP | |||||
| Adherence to iron chelation therapy (per cent, SD) | ‐ | 242 (4 RCTs) | ⊕⊝⊝⊝ | We found considerable heterogeneity and identified age as possible cause: 1 trial in children 10 years or older and 1 conducted in participants 18 or older | ||
| SAEs (from therapy, disease, non‐adherence) Agranulocytosis** | Study population | RR 7.88 | 88 | ⊕⊝⊝⊝ | No SAEs were reported in the second trial reporting this outcome | |
| 15 per 1000 | 118 per 1,000 (7 to 1000) | |||||
| All‐cause mortality | Study population | RR 0.44 | 88 | ⊕⊝⊝⊝ | No deaths occurred in the second trial reporting this outcome | |
| 146 per 1000 | 64 per 1000 | |||||
| Sustained adherence ‐ not measured | ‐ | ‐ | ‐ | ‐ | ‐ | Sustained adherence is reported as adherence as all trials were longer than 6 months and only end of trial adherence numbers were provided |
| Quality of life ‐ not reported | ‐ | ‐ | ‐ | ‐ | ‐ | |
| *The risk in the intervention group (and its 95% confidence interval) is based on the assumed risk in the comparison group and the relative effect of the intervention (and its 95% CI). | ||||||
| GRADE Working Group grades of evidence | ||||||
| 1 We downgraded the quality of evidence by 1 for risk of bias due to high or uncertain risk of bias due to lack of blinding of participants and personnel in all four RCTs, as well as selection bias (Olivieri 1997), attrition bias (El Beshlawy 2008; Olivieri 1997), reporting bias (El Beshlawy 2008; Pennell 2006), and other bias (Pennell 2006). ** Risk estimate based on: Tricta F, Uetrecht J, Galanello R, et al. Deferiprone‐induced agranulocytosis: 20 years of clinical observations. American Journal of Hematology. 2016;91(10):1026‐1031. doi:10.1002/ajh.24479. | ||||||
| DFX compared to DFO for improving adherence to iron chelation therapy in people with sickle cell disease or thalassaemia | ||||||
| Patient or population: improving adherence to iron chelation therapy in people with sickle cell disease or thalassaemia | ||||||
| Outcomes | Anticipated absolute effects* (95% CI) | Relative effect | № of participants | Certainty of the evidence | Comments | |
| Risk with DFO | Risk with DFX | |||||
| Adherence to iron chelation therapy (per cent, SD) | The mean adherence to iron chelation therapy (per cent, SD) was 0 | MD 1.4 lower | ‐ | 197 | ⊕⊝⊝⊝ | Narrative report of adherence for 2 trials as either no or incompatible data to enable comparisons |
| SAEs ‐ thalassaemia‐related SAEs | Study population | ‐ | 247 | ⊕⊝⊝⊝ | There were no SAEs to report in one trial so no estimate of effect | |
| see comment | see comment | |||||
| SAEs ‐ SCD‐related SAEs | Study population | RR 1.08 | 195 | ⊕⊝⊝⊝ | ||
| 429 per 1000 | 463 per 1000 | |||||
| Incidence of SCD‐related SAEs ‐pain crisis | Study population | RR 1.05 | 195 | ⊕⊝⊝⊝ | ||
| 317 per 1000 | 333 per 1000 | |||||
| All‐cause mortality (thalassaemia) | Study population | RR 0.96 | 240 | ⊕⊝⊝⊝ | ||
| 8 per 1000 | 8 per 1000 | |||||
| Sustained adherence ‐ not measured | ‐ | ‐ | ‐ | ‐ | ‐ | Sustained adherence is reported as adherence as all trials were longer than 6 months and only end of trial adherence reported |
| Quality of life ‐ not reported | ‐ | ‐ | ‐ | ‐ | ‐ | |
| *The risk in the intervention group (and its 95% CI) is based on the assumed risk in the comparison group and the relative effect of the intervention (and its 95% CI). | ||||||
| GRADE Working Group grades of evidence | ||||||
| 1 We downgraded the quality of evidence by 2 due to high or uncertain risk of bias in several domains | ||||||
| DFX film‐coated tablet compared to DFX dispersible tablet for improving adherence to iron chelation therapy in people with sickle cell disease or thalassaemia | ||||||
| Patient or population: improving adherence to iron chelation therapy in people with sickle cell disease or thalassaemia | ||||||
| Outcomes | Anticipated absolute effects* (95% CI) | Relative effect | № of participants | Certainty of the evidence | Comments | |
| Risk with DFX dispersible tablet | Risk with DFX film‐coated tablet | |||||
| Adherence to iron chelation therapy (n, N) | Study population | RR 1.10 | 173 | ⊕⊕⊝⊝ | ||
| 849 per 1000 | 934 per 1000 | |||||
| Incidence of SAEs | Study population | RR 1.22 | 173 | ⊕⊝⊝⊝ | ||
| 151 per 1,000 | 184 per 1000 | |||||
| All‐cause mortality | Study population | RR 2.97 | 173 | ⊕⊝⊝⊝ | ||
| 0 per 1000 | 0 per 1000 | |||||
| Sustained adherence ‐ not measured | ‐ | ‐ | ‐ | ‐ | ‐ | Reported as adherence as trial was 6 months in duration and end of trial adherence reported |
| Quality of life ‐ not reported | ‐ | ‐ | ‐ | ‐ | ‐ | |
| *The risk in the intervention group (and its 95% confidence interval) is based on the assumed risk in the comparison group and the relative effect of the intervention (and its 95% CI). | ||||||
| GRADE Working Group grades of evidence | ||||||
| 1 We downgraded the quality of evidence by 2 for risk of bias due to high or unclear risk of bias in all domains | ||||||
| DFP and DFO compared to DFP for improving adherence to iron chelation therapy in people with sickle cell disease or thalassaemia | ||||||
| Patient or population: improving adherence to iron chelation therapy in people with sickle cell disease or thalassaemia | ||||||
| Outcomes | Anticipated absolute effects* (95% CI) | Relative effect | № of participants | Certainty of the evidence | Comments | |
| Risk with DFP | Risk with DFP and DFO | |||||
| Adherence to iron chelation therapy (per cent, SD) | see comment | see comment | ‐ | 289 (3 RCTs) | ⊕⊝⊝⊝ | Reported as narrative as no comparisons possible |
| Incidence of SAEs | Study population | RR 0.15 | 213 | ⊕⊕⊝⊝ | ||
| 28 per 1,000 | 4 per 1,000 | |||||
| All‐cause mortality | Study population | RR 0.77 | 237 | ⊕⊝⊝⊝ | ||
| 33 per 1,000 | 26 per 1,000 | |||||
| Sustained adherence ‐ not measured | ‐ | ‐ | ‐ | ‐ | ‐ | Sustained adherence is reported as adherence as trial duration longer than 6 months and reports adherence for length of trial |
| Quality of life ‐ not reported | ‐ | ‐ | ‐ | ‐ | ‐ | Quality of life was either not reported or no validated instruments were used |
| *The risk in the intervention group (and its 95% confidence interval) is based on the assumed risk in the comparison group and the relative effect of the intervention (and its 95% CI). | ||||||
| GRADE Working Group grades of evidence | ||||||
| 1 We downgraded the quality of evidence by 2 for risk of bias as there was high or uncertain risk of bias in most domains in 3 out of 4 trials | ||||||
| DFP and DFO compared to DFO for improving adherence to iron chelation therapy in people with sickle cell disease or thalassaemia | ||||||
| Patient or population: improving adherence to iron chelation therapy in people with sickle cell disease or thalassaemia | ||||||
| Outcomes | Anticipated absolute effects* (95% CI) | Relative effect | № of participants | Certainty of the evidence | Comments | |
| Risk with DFO | Risk with DFP and DFO | |||||
| Adherence to iron chelation therapy (per cent, SD) | see comment | see comment | ‐ | 205 (4 RCTs) | ⊕⊕⊝⊝ | Reported as narrative only as adherence in combined group not reported for combination therapy |
| Incidence of SAEs | Study population | ‐ | 205 (4 RCTs) | ⊕⊕⊝⊝ | 3 trials report no SAEs; SAES are not reported in one trial | |
| see comment | see comment | |||||
| All‐cause mortality | Study population | ‐ | 205 (4 RCTs) | ⊕⊕⊝⊝ | no deaths reported | |
| see comment | see comment | |||||
| Sustained adherence ‐ not measured | ‐ | ‐ | ‐ | ‐ | ‐ | Sustained adherence reported as adherence as trial duration was longer than 6 months and adherence reported at end of trial |
| Quality of life ‐ not reported | ‐ | ‐ | ‐ | ‐ | ‐ | |
| *The risk in the intervention group (and its 95% CI) is based on the assumed risk in the comparison group and the relative effect of the intervention (and its 95% CI). | ||||||
| GRADE Working Group grades of evidence | ||||||
| 1 We downgraded the quality of evidence by 2 for risk of bias as high or unclear risk of bias in all domains | ||||||
| DFP/DFO compared to DFP/DFX for improving adherence to iron chelation therapy in people with sickle cell disease or thalassaemia | ||||||
| Patient or population: improving adherence to iron chelation therapy in people with sickle cell disease or thalassaemia | ||||||
| Outcomes | Anticipated absolute effects* (95% CI) | Relative effect | № of participants | Certainty of the evidence | Comments | |
| Risk with DFP/DFX | Risk with DFP/DFO | |||||
| Adherence to iron chelation therapy rates (n,N) ‐ 1 year | Study population | RR 0.84 | 96 | ⊕⊕⊝⊝ | ||
| 938 per 1000 | 788 per 1000 | |||||
| Incidence of SAE | Study population | RR 1.00 | 96 | ⊕⊝⊝⊝ | ||
| 21 per 1,000 | 21 per 1000 | |||||
| All‐cause mortality ‐ at 1 year ‐ trial end | Study population | Not estimable | 96 | ⊕⊕⊝⊝ | No deaths were reported | |
| 0 per 1000 | 0 per 1000 | |||||
| Sustained adherence ‐ not measured | ‐ | ‐ | ‐ | ‐ | ‐ | Sustained adherence is reported as adherence as trial was 1 year in duration and end of trial adherence reported |
| Quality of life see comment | ‐ | ‐ | ‐ | ‐ | ‐ | The study uses SF36 to measure quality of life, the results are presented as a graph. Quality of life increased in both trial arms with no significant difference between trial arms P = 0.860 |
| *The risk in the intervention group (and its 95% confidence interval) is based on the assumed risk in the comparison group and the relative effect of the intervention (and its 95% CI). | ||||||
| GRADE Working Group grades of evidence | ||||||
| 1 We downgraded the quality of evidence by 1 for risk of bias as there was high or unclear risk of bias in 3 domains | ||||||
| Medication management compared to standard care for improving adherence to iron chelation therapy in people with sickle cell disease or thalassaemia | ||||||
| Patient or population: improving adherence to iron chelation therapy in people with sickle cell disease or thalassaemia | ||||||
| Outcomes | Anticipated absolute effects* (95% CI) | Relative effect | № of participants | Certainty of the evidence | Comments | |
| Risk with standard care | Risk with medication management | |||||
| Adherence to iron chelation therapy ‐ not reported | ‐ | ‐ | ‐ | Adherence was only reported in the intervention group and therefore no comparative data | ||
| SAEs ‐ not reported | ‐ | ‐ | ‐ | ‐ | ‐ | |
| Mortality ‐ not reported | ‐ | ‐ | ‐ | ‐ | ‐ | |
| Sustained adherence | ‐ | ‐ | ‐ | ‐ | ‐ | Adherence was only reported in the intervention group and therefore no comparative data |
| Quality of life | ‐ | 48 | ⊕⊝⊝⊝ | Medication management: 63.51 (51.75 – 84.54); standard care: 49.84 (41.9 – 60.81) | ||
| *The risk in the intervention group (and its 95% confidence interval) is based on the assumed risk in the comparison group and the relative effect of the intervention (and its 95% CI). | ||||||
| GRADE Working Group grades of evidence | ||||||
| 1 We downgraded the quality of evidence for indirectness by 2 because most outcomes were only reported in the medication management group | ||||||
| STUDY | HOW ADHERENCE MEASURED | RESULTS |
| Aydinok 2007 |
|
|
| Badawy 2010 |
|
|
| Bahnasawy 2017 |
|
|
| Calvaruso 2015 |
|
|
| El Beshlawy 2008 |
|
|
| Elalfy 2015 |
|
|
| Galanello 2006 |
|
|
| Hassan 2016 |
|
|
| Maggio 2009 |
|
|
| Mourad 2003 |
|
|
| Olivieri 1997 |
|
|
| Pennell 2006 |
|
|
| Pennell 2014 |
|
|
| Taher 2017 |
|
|
| Tanner 2007 |
|
|
| Vichinsky 2007 |
|
|
| DFO: deferoxamine | ||
| Outcome or subgroup title | No. of studies | No. of participants | Statistical method | Effect size |
| 1 Adherence to iron chelation therapy (%, SD) Show forest plot | 3 | Mean Difference (IV, Random, 95% CI) | Subtotals only | |
| 2 SAEs (from therapy, disease, non‐adherence) Show forest plot | 1 | Risk Ratio (M‐H, Random, 99% CI) | Totals not selected | |
| 2.1 Agranulocytosis | 1 | Risk Ratio (M‐H, Random, 99% CI) | 0.0 [0.0, 0.0] | |
| 3 All‐cause mortality Show forest plot | 1 | Risk Ratio (IV, Random, 95% CI) | Totals not selected | |
| 4 Iron overload: defined as proportion of participants with serum ferritin ≥ 800 (µg/L) Show forest plot | 1 | Risk Ratio (M‐H, Fixed, 95% CI) | Totals not selected | |
| 5 Organ damage Show forest plot | 1 | Risk Ratio (M‐H, Random, 95% CI) | Totals not selected | |
| 5.1 Liver damage | 1 | Risk Ratio (M‐H, Random, 95% CI) | 0.0 [0.0, 0.0] | |
| 6 Other AEs related to iron chelation Show forest plot | 3 | Risk Ratio (IV, Random, 99% CI) | Subtotals only | |
| 6.1 Risk of leukopenia, neutropenia and/or agranulocytosis | 3 | 192 | Risk Ratio (IV, Random, 99% CI) | 3.94 [0.44, 35.50] |
| 6.2 Risk of pain or swelling in joints | 3 | 192 | Risk Ratio (IV, Random, 99% CI) | 3.38 [0.54, 21.31] |
| 6.3 Risk of nausea/vomiting | 2 | 132 | Risk Ratio (IV, Random, 99% CI) | 13.68 [0.99, 188.88] |
| 6.4 Risk of increased liver transaminase | 1 | 44 | Risk Ratio (IV, Random, 99% CI) | 1.10 [0.03, 38.47] |
| 6.5 Local reactions at infusion site | 1 | 88 | Risk Ratio (IV, Random, 99% CI) | 0.17 [0.00, 9.12] |
| Outcome or subgroup title | No. of studies | No. of participants | Statistical method | Effect size |
| 1 Adherence to iron chelation therapy (%, SD) Show forest plot | 1 | Mean Difference (IV, Random, 95% CI) | Totals not selected | |
| 2 SAEs Show forest plot | 3 | Risk Ratio (M‐H, Random, 95% CI) | Totals not selected | |
| 2.1 Thalassaemia‐related SAEs | 2 | Risk Ratio (M‐H, Random, 95% CI) | 0.0 [0.0, 0.0] | |
| 2.2 SCD‐related SAE ‐ painful crisis | 1 | Risk Ratio (M‐H, Random, 95% CI) | 0.0 [0.0, 0.0] | |
| 2.3 SCD‐related SAEs ‐ other SCD‐related SAEs | 1 | Risk Ratio (M‐H, Random, 95% CI) | 0.0 [0.0, 0.0] | |
| 3 All‐cause mortality (thalassaemia) Show forest plot | 2 | 240 | Risk Ratio (IV, Random, 95% CI) | 0.96 [0.06, 15.06] |
| 4 Proportion of participants with iron overload (thalassaemia) Show forest plot | 2 | Risk Ratio (M‐H, Random, 95% CI) | Subtotals only | |
| 4.1 Iron overload defined by ferritin 1500 (µg/l) or higher (Thalassaemia) | 1 | 60 | Risk Ratio (M‐H, Random, 95% CI) | 1.18 [0.63, 2.20] |
| 4.2 Proportion with severe iron overload (LIC at least 15 mg/Fe/g dw) | 1 | 172 | Risk Ratio (M‐H, Random, 95% CI) | 1.00 [0.83, 1.20] |
| 4.3 Myocardial T2* < 10ms | 1 | 172 | Risk Ratio (M‐H, Random, 95% CI) | 1.10 [0.72, 1.70] |
| 5 Other AEs related to iron chelation ‐ (thalassaemia) Show forest plot | 2 | Risk Ratio (IV, Random, 95% CI) | Subtotals only | |
| 5.1 Total chelation‐related AE | 1 | 187 | Risk Ratio (IV, Random, 95% CI) | 1.15 [0.76, 1.73] |
| 5.2 Gastrointestinal upset | 1 | 60 | Risk Ratio (IV, Random, 95% CI) | 3.0 [0.66, 13.69] |
| 5.3 Rash | 2 | 247 | Risk Ratio (IV, Random, 95% CI) | 3.05 [0.98, 9.47] |
| 5.4 Risk of increased blood creatinine | 1 | 187 | Risk Ratio (IV, Random, 95% CI) | 3.79 [0.83, 17.38] |
| 5.5 Risk of proteinuria | 1 | 187 | Risk Ratio (IV, Random, 95% CI) | 2.21 [0.59, 8.29] |
| 5.6 Risk of increased ALT | 1 | 187 | Risk Ratio (IV, Random, 95% CI) | 5.69 [0.70, 46.33] |
| 5.7 Risk of increased AST | 1 | 187 | Risk Ratio (IV, Random, 95% CI) | 5.69 [0.70, 46.33] |
| 5.8 Risk of diarrhoea | 1 | 187 | Risk Ratio (IV, Random, 95% CI) | 5.69 [0.70, 46.33] |
| 5.9 Risk of vomiting | 1 | 187 | Risk Ratio (IV, Random, 95% CI) | 6.64 [0.35, 126.78] |
| 6 Total AEs (thalassaemia) Show forest plot | 1 | Risk Ratio (IV, Random, 95% CI) | Totals not selected | |
| 7 Other AEs related to iron chelation (SCD) Show forest plot | 1 | Risk Ratio (M‐H, Random, 99% CI) | Subtotals only | |
| 7.1 Risk of increased ALT | 1 | 195 | Risk Ratio (M‐H, Random, 99% CI) | 5.29 [0.12, 232.98] |
| 7.2 incidence of abdominal pain | 1 | 195 | Risk Ratio (M‐H, Random, 99% CI) | 1.91 [0.80, 4.58] |
| 7.3 Risk of pain or swelling in joints | 1 | 195 | Risk Ratio (M‐H, Random, 99% CI) | 1.06 [0.41, 2.76] |
| 7.4 Risk of diarrhoea | 1 | 195 | Risk Ratio (M‐H, Random, 99% CI) | 4.14 [0.90, 18.92] |
| 7.5 Nausea/vomiting | 1 | 195 | Risk Ratio (M‐H, Random, 99% CI) | 1.63 [0.90, 2.94] |
| Outcome or subgroup title | No. of studies | No. of participants | Statistical method | Effect size |
| 1 Adherence to iron chelation therapy Show forest plot | 1 | 173 | Risk Ratio (M‐H, Random, 95% CI) | 1.10 [0.99, 1.22] |
| 2 Incidence of SAEs Show forest plot | 1 | 173 | Risk Ratio (IV, Random, 95% CI) | 1.22 [0.62, 2.37] |
| 3 All‐cause mortality Show forest plot | 1 | 173 | Risk Ratio (M‐H, Random, 95% CI) | 2.97 [0.12, 71.81] |
| 4 Incidence of organ damage (renal event) Show forest plot | 1 | 173 | Risk Ratio (IV, Random, 95% CI) | 1.25 [0.83, 1.91] |
| 5 Other AEs related to iron chelation Show forest plot | 1 | Risk Ratio (IV, Random, 99% CI) | Subtotals only | |
| 5.1 Total chelation‐related AEs | 1 | 173 | Risk Ratio (IV, Random, 99% CI) | 0.75 [0.52, 1.08] |
| 5.2 Risk of diarrhoea | 1 | 173 | Risk Ratio (IV, Random, 99% CI) | 0.70 [0.29, 1.70] |
| 5.3 Increased urine protein/urine creatinine ratio | 1 | 173 | Risk Ratio (IV, Random, 99% CI) | 1.65 [0.60, 4.54] |
| 5.4 incidence of abdominal pain | 1 | 173 | Risk Ratio (IV, Random, 99% CI) | 0.49 [0.16, 1.52] |
| 5.5 Incidence of nausea | 1 | 173 | Risk Ratio (IV, Random, 99% CI) | 0.72 [0.23, 2.23] |
| 5.6 Incidence of vomiting | 1 | 173 | Risk Ratio (IV, Random, 99% CI) | 0.28 [0.07, 1.15] |
| Outcome or subgroup title | No. of studies | No. of participants | Statistical method | Effect size |
| 1 Incidence of SAEs Show forest plot | 1 | 213 | Risk Ratio (M‐H, Random, 95% CI) | 0.15 [0.01, 2.81] |
| 2 All‐cause mortality Show forest plot | 2 | 237 | Risk Ratio (IV, Random, 95% CI) | 0.77 [0.18, 3.35] |
| 3 Incidence of chelation therapy‐related AEs Show forest plot | 3 | Risk Ratio (IV, Random, 99% CI) | Subtotals only | |
| 3.1 Risk of leukopenia, neutropenia and/or agranulocytosis | 3 | 280 | Risk Ratio (IV, Random, 99% CI) | 1.15 [0.50, 2.62] |
| 3.2 Risk of pain or swelling in joints | 2 | 256 | Risk Ratio (IV, Random, 99% CI) | 0.76 [0.31, 1.91] |
| 3.3 Risk of gastrointestinal disturbances | 1 | 213 | Risk Ratio (IV, Random, 99% CI) | 0.45 [0.15, 1.37] |
| 3.4 Risk of increased liver transaminase | 2 | 256 | Risk Ratio (IV, Random, 99% CI) | 1.02 [0.52, 1.98] |
| 3.5 Nausea/vomiting | 1 | 43 | Risk Ratio (IV, Random, 99% CI) | 0.55 [0.13, 2.23] |
| Outcome or subgroup title | No. of studies | No. of participants | Statistical method | Effect size |
| 1 Other AEs related to iron chelation Show forest plot | 4 | Risk Ratio (IV, Random, 99% CI) | Subtotals only | |
| 1.1 Risk of leukopenia, neutropenia and/or agranulocytosis | 3 | 169 | Risk Ratio (IV, Random, 99% CI) | 1.18 [0.09, 15.37] |
| 1.2 Risk of pain or swelling in joints | 3 | 135 | Risk Ratio (IV, Random, 99% CI) | 2.39 [0.18, 32.31] |
| 1.3 Risk of increased liver transaminase | 2 | 104 | Risk Ratio (IV, Random, 99% CI) | 3.46 [0.45, 26.62] |
| 1.4 Nausea/vomiting | 4 | 194 | Risk Ratio (IV, Random, 99% CI) | 3.81 [0.84, 17.36] |
| 1.5 Local reactions at infusion site | 2 | 90 | Risk Ratio (IV, Random, 99% CI) | 0.18 [0.01, 3.56] |
| Outcome or subgroup title | No. of studies | No. of participants | Statistical method | Effect size |
| 1 Adherence to iron chelation therapy rates Show forest plot | 1 | 96 | Risk Ratio (IV, Random, 95% CI) | 0.84 [0.72, 0.99] |
| 2 Incidence of SAE Show forest plot | 1 | 96 | Risk Ratio (M‐H, Random, 95% CI) | 1.0 [0.06, 15.53] |
| 3 All‐cause mortality Show forest plot | 1 | Risk Ratio (IV, Random, 95% CI) | Totals not selected | |
| 4 Organ damage (serum creatinine (≥33%) above baseline in 2 consecutive occasions) Show forest plot | 1 | 96 | Risk Ratio (M‐H, Random, 99% CI) | 3.0 [0.16, 56.04] |
| 5 Other AEs related to iron chelation Show forest plot | 1 | Risk Ratio (IV, Random, 99% CI) | Subtotals only | |
| 5.1 one year (study end) | 1 | 96 | Risk Ratio (IV, Random, 99% CI) | 1.08 [0.68, 1.71] |
| 5.2 Risk of leukopenia, neutropenia and/or agranulocytosis | 1 | 96 | Risk Ratio (IV, Random, 99% CI) | 1.67 [0.27, 10.14] |
| 5.3 Risk of pain or swelling in joints | 1 | 96 | Risk Ratio (IV, Random, 99% CI) | 0.89 [0.29, 2.77] |
| 5.4 Gastrointestinal problems | 1 | 96 | Risk Ratio (IV, Random, 99% CI) | 0.6 [0.18, 2.04] |
| 5.5 ALT (increase ≥3 folds) | 1 | 96 | Risk Ratio (IV, Random, 99% CI) | 1.33 [0.20, 8.88] |
| 5.6 Skin rash | 1 | 96 | Risk Ratio (IV, Random, 99% CI) | 5.0 [0.10, 261.34] |