Działania mające na celu poprawę przestrzegania terapii chelatującej żelazo u osób z anemią sierpowatokrwinkową lub talasemią
Abstract
Background
Regularly transfused people with sickle cell disease (SCD) and people with thalassaemia (who are transfusion‐dependent or non‐transfusion‐dependent) are at risk of iron overload. Iron overload can lead to iron toxicity in vulnerable organs such as the heart, liver and endocrine glands; which can be prevented and treated with iron chelating agents. The intensive demands and uncomfortable side effects of therapy can have a negative impact on daily activities and well‐being, which may affect adherence.
Objectives
To identify and assess the effectiveness of interventions (psychological and psychosocial, educational, medication interventions, or multi‐component interventions) to improve adherence to iron chelation therapy in people with SCD or thalassaemia.
Search methods
We searched CENTRAL (the Cochrane Library), MEDLINE, Embase, CINAHL, PsycINFO, Psychology and Behavioral Sciences Collection, Web of Science Science & Social Sciences Conference Proceedings Indexes and ongoing trial databases (01 February 2017). We searched the Cochrane Cystic Fibrosis and Genetic Disorders Group's Haemoglobinopathies Trials Register (12 December 2017).
Selection criteria
For trials comparing medications or medication changes, only randomised controlled trials (RCTs) were eligible for inclusion.
For studies including psychological and psychosocial interventions, educational Interventions, or multi‐component interventions, non‐RCTs, controlled before‐after studies, and interrupted time series studies with adherence as a primary outcome were also eligible for inclusion.
Data collection and analysis
Three authors independently assessed trial eligibility, risk of bias and extracted data. The quality of the evidence was assessed using GRADE.
Main results
We included 16 RCTs (1525 participants) published between 1997 and 2017. Most participants had β‐thalassaemia major; 195 had SCD and 88 had β‐thalassaemia intermedia. Mean age ranged from 11 to 41 years. One trial was of medication management and 15 RCTs were of medication interventions. Medications assessed were subcutaneous deferoxamine, and two oral‐chelating agents, deferiprone and deferasirox.
We rated the quality of evidence as low to very low across all outcomes identified in this review.
Three trials measured quality of life (QoL) with validated instruments, but provided no analysable data and reported no difference in QoL.
Deferiprone versus deferoxamine
We are uncertain whether deferiprone increases adherence to iron chelation therapy (four trials, very low‐quality evidence). Results could not be combined due to considerable heterogeneity (participants' age and different medication regimens). Medication adherence was high (deferiprone (85% to 94.9%); deferoxamine (71.6% to 93%)).
We are uncertain whether deferiprone increases the risk of agranulocytosis, risk ratio (RR) 7.88 (99% confidence interval (CI) 0.18 to 352.39); or has any effect on all‐cause mortality, RR 0.44 (95% CI 0.12 to 1.63) (one trial; 88 participants; very low‐quality evidence).
Deferasirox versus deferoxamine
We are uncertain whether deferasirox increases adherence to iron chelation therapy, mean difference (MD) ‐1.40 (95% CI ‐3.66 to 0.86) (one trial; 197 participants; very‐low quality evidence). Medication adherence was high (deferasirox (99%); deferoxamine (100%)). We are uncertain whether deferasirox decreases the risk of thalassaemia‐related serious adverse events (SAEs), RR 0.95 (95% CI 0.41 to 2.17); or all‐cause mortality, RR 0.96 (95% CI 0.06 to 15.06) (two trials; 240 participants; very low‐quality evidence).
We are uncertain whether deferasirox decreases the risk of SCD‐related pain crises, RR 1.05 (95% CI 0.68 to 1.62); or other SCD‐related SAEs, RR 1.08 (95% CI 0.77 to 1.51) (one trial; 195 participants; very low‐quality evidence).
Deferasirox film‐coated tablet (FCT) versus deferasirox dispersible tablet (DT)
Deferasirox FCT may make little or no difference to adherence, RR 1.10 (95% CI 0.99 to 1.22) (one trial; 173 participants; low‐quality evidence). Medication adherence was high (FCT (92.9%); DT (85.3%)).
We are uncertain if deferasirox FCT increases the incidence of SAEs, RR 1.22 (95% CI 0.62 to 2.37); or all‐cause mortality, RR 2.97 (95% CI 0.12 to 71.81) (one trial; 173 participants; very low‐quality evidence).
Deferiprone and deferoxamine combined versus deferiprone alone
We are uncertain if deferiprone and deferoxamine combined increases adherence to iron chelation therapy (very low‐quality evidence). Medication adherence was high (deferiprone 92.7% (range 37% to 100%) to 93.6% (range 56% to 100%); deferoxamine 70.6% (range 25% to 100%).
Combination therapy may make little or no difference to the risk of SAEs, RR 0.15 (95% CI 0.01 to 2.81) (one trial; 213 participants; low‐quality evidence).
We are uncertain if combination therapy decreases all‐cause mortality, RR 0.77 (95% CI 0.18 to 3.35) (two trials; 237 participants; very low‐quality evidence).
Deferiprone and deferoxamine combined versus deferoxamine alone
Deferiprone and deferoxamine combined may have little or no effect on adherence to iron chelation therapy (four trials; 216 participants; low‐quality evidence). Medication adherence was high (deferoxamine 91.4% to 96.1%; deferiprone: 82.4%)
Deferiprone and deferoxamine combined, may have little or no difference in SAEs or mortality (low‐quality evidence). No SAEs occurred in three trials and were not reported in one trial. No deaths occurred in two trials and were not reported in two trials.
Deferiprone and deferoxamine combined versus deferiprone and deferasirox combined
Deferiprone and deferasirox combined may improve adherence to iron chelation therapy, RR 0.84 (95% CI 0.72 to 0.99) (one trial; 96 participants; low‐quality evidence). Medication adherence was high (deferiprone and deferoxamine: 80%; deferiprone and deferasirox: 95%).
We are uncertain if deferiprone and deferasirox decreases the incidence of SAEs, RR 1.00 (95% CI 0.06 to 15.53) (one trial; 96 participants; very low‐quality evidence).
There were no deaths in the trial (low‐quality evidence).
Medication management versus standard care
We are uncertain if medication management improves health‐related QoL (one trial; 48 participants; very low‐quality evidence). Adherence was only measured in one arm of the trial.
Authors' conclusions
The medication comparisons included in this review had higher than average adherence rates not accounted for by differences in medication administration or side effects.
Participants may have been selected based on higher adherence to trial medications at baseline. Also, within the clinical trial context, there is increased attention and involvement of clinicians, thus high adherence rates may be an artefact of trial participation.
Real‐world, pragmatic trials in community and clinic settings are needed that examine both confirmed or unconfirmed adherence strategies that may increase adherence to iron chelation therapy.
Due to lack of evidence this review cannot comment on intervention strategies for different age groups.
PICO
Streszczenie prostym językiem
Strategie mające na celu poprawę przestrzegania terapii chelatującej żelazo u osób z niedokrwistością sierpowatą lub talasemią
Pytanie badawcze
Chcieliśmy ustalić, czy istnieją jakiekolwiek interwencje (medyczne, psychologiczne lub edukacyjne), które pomogłyby pacjentom w przestrzeganiu leczenia chelatującego żelazo.
Wprowadzenie
Osoby z anemią sierpowatokrwinkową lub talasemią otrzymujące regularne transfuzje (przetoczenie krwi; przyp. tłum.) są narażone na przeciążenia żelazem, co może doprowadzić do uszkodzenia narządów wewnętrznych i śmierci. Terapia chelatująca żelazo jest stosowana w celu zapobiegania lub leczenia przeładowania organizmu żelazem ale sam schemat może być trudny dla pacjenta i wiązać się z niepożądanymi skutkami ubocznymi. Istnieją trzy rodzaje substancji chelatujących żelazo stosowanych w terapii przeładowania żelazem: deferoksamina podawana podskórnie (przez wstrzyknięcie leku do warstwy tkanki między skórą a mięśniem) i dwa leki, które są przyjmowane doustnie: deferipron i deferazyroks.
Data wyszukiwania
Dane są aktualne do 12 grudnia 2017 roku.
Charakterystyka badań
Przeszukaliśmy literaturę w poszukiwaniu zarówno badań randomizowanych, jak i nie‐randomizowanych i znaleźliśmy 16 badań z randomizacją opublikowanych w latach 1997‐2017, w których udział wzięło 1525 osób. Większość pacjentów miała β‐talasemię dużą, jedno badanie obejmowało osoby z anemią sierpowatokrwinkową, a jedno pacjentów z łagodniejszą postacią talasemii (talasemia pośrednia). Średni wiek wahał się od 11 do 41 lat. Do przeglądu włączyliśmy jedno badanie dotyczące schematu lekowego i 15 badań porównujących różne leki.
Kluczowe wyniki
Badania obejmowały porównania pojedynczych środków ze sobą lub kombinację leków w porównaniu z innym pojedynczym lekiem lub kombinacjami leków.
Nie byliśmy pewni, czy pojedyncze leki lub leczenie skojarzone wpływały na odsetek osób przestrzegających zalecony schemat leczenia oraz na występowanie działań niepożądanych lub śmierci. Jakość życia, mierzona za pomocą sprawdzonych kwestionariuszy, była analizowana tylko w dwóch badaniach, ale nie podano wystarczającej ilości danych, aby określić jakiekolwiek różnice między dwoma schematami leczenia.
Nie było danych dotyczących interwencji stosowanych w różnych grupach wiekowych.
We wszystkich badaniach stwierdzono niezwykle wysoki stopień przestrzegania przyjmowania wszystkich leków i kombinacji lekowych. Może być to spowodowane faktem, że uczestnicy zostali wybierani na podstawie ich zdolności do przestrzegania zaleceń odnośnie schematów leczenia. Ponadto pilnowanie zaleconej terapii może wzrosnąć u uczestników badania, gdy istnieje wyższy poziom zaangażowania lekarza w opiekę.
Oceniamy, że konieczne jest przeprowadzenie dalszych badań z/bez randomizacji zarówno w lokalnej społeczności, jak i klinikach, aby ocenić różne sprawdzone, ale też niesprawdzone strategie, które mogą być przydatne w poprawie przestrzegania zaleceń odnośnie leczenia chelatującego żelazo.
Jakość danych naukowych
Oceniliśmy jakość danych od niskiej do bardzo niskiej w odniesieniu do wszystkich wyników tego przeglądu. Wynikało to z dużego lub bardzo dużego ryzyka błędu systematycznego, braku precyzji oszacowań wyników (szerokie przedziały ufności) oraz braku możliwości uogólnienia wyników (niektóre badania przeprowadzono wyłącznie u dzieci w określonym wieku i spełniających określone kryteria).
Authors' conclusions
Summary of findings
| DFP compared to DFO for improving adherence to iron chelation therapy in people with sickle cell disease or thalassaemia | ||||||
| Patient or population: improving adherence to iron chelation therapy in people with sickle cell disease or thalassaemia | ||||||
| Outcomes | Anticipated absolute effects* (95% CI) | Relative effect | № of participants | Certainty of the evidence | Comments | |
| Risk with DFO | Risk with DFP | |||||
| Adherence to iron chelation therapy (per cent, SD) | ‐ | 242 (4 RCTs) | ⊕⊝⊝⊝ | We found considerable heterogeneity and identified age as possible cause: 1 trial in children 10 years or older and 1 conducted in participants 18 or older | ||
| SAEs (from therapy, disease, non‐adherence) Agranulocytosis** | Study population | RR 7.88 | 88 | ⊕⊝⊝⊝ | No SAEs were reported in the second trial reporting this outcome | |
| 15 per 1000 | 118 per 1,000 (7 to 1000) | |||||
| All‐cause mortality | Study population | RR 0.44 | 88 | ⊕⊝⊝⊝ | No deaths occurred in the second trial reporting this outcome | |
| 146 per 1000 | 64 per 1000 | |||||
| Sustained adherence ‐ not measured | ‐ | ‐ | ‐ | ‐ | ‐ | Sustained adherence is reported as adherence as all trials were longer than 6 months and only end of trial adherence numbers were provided |
| Quality of life ‐ not reported | ‐ | ‐ | ‐ | ‐ | ‐ | |
| *The risk in the intervention group (and its 95% confidence interval) is based on the assumed risk in the comparison group and the relative effect of the intervention (and its 95% CI). | ||||||
| GRADE Working Group grades of evidence | ||||||
| 1 We downgraded the quality of evidence by 1 for risk of bias due to high or uncertain risk of bias due to lack of blinding of participants and personnel in all four RCTs, as well as selection bias (Olivieri 1997), attrition bias (El Beshlawy 2008; Olivieri 1997), reporting bias (El Beshlawy 2008; Pennell 2006), and other bias (Pennell 2006). ** Risk estimate based on: Tricta F, Uetrecht J, Galanello R, et al. Deferiprone‐induced agranulocytosis: 20 years of clinical observations. American Journal of Hematology. 2016;91(10):1026‐1031. doi:10.1002/ajh.24479. | ||||||
| DFX compared to DFO for improving adherence to iron chelation therapy in people with sickle cell disease or thalassaemia | ||||||
| Patient or population: improving adherence to iron chelation therapy in people with sickle cell disease or thalassaemia | ||||||
| Outcomes | Anticipated absolute effects* (95% CI) | Relative effect | № of participants | Certainty of the evidence | Comments | |
| Risk with DFO | Risk with DFX | |||||
| Adherence to iron chelation therapy (per cent, SD) | The mean adherence to iron chelation therapy (per cent, SD) was 0 | MD 1.4 lower | ‐ | 197 | ⊕⊝⊝⊝ | Narrative report of adherence for 2 trials as either no or incompatible data to enable comparisons |
| SAEs ‐ thalassaemia‐related SAEs | Study population | ‐ | 247 | ⊕⊝⊝⊝ | There were no SAEs to report in one trial so no estimate of effect | |
| see comment | see comment | |||||
| SAEs ‐ SCD‐related SAEs | Study population | RR 1.08 | 195 | ⊕⊝⊝⊝ | ||
| 429 per 1000 | 463 per 1000 | |||||
| Incidence of SCD‐related SAEs ‐pain crisis | Study population | RR 1.05 | 195 | ⊕⊝⊝⊝ | ||
| 317 per 1000 | 333 per 1000 | |||||
| All‐cause mortality (thalassaemia) | Study population | RR 0.96 | 240 | ⊕⊝⊝⊝ | ||
| 8 per 1000 | 8 per 1000 | |||||
| Sustained adherence ‐ not measured | ‐ | ‐ | ‐ | ‐ | ‐ | Sustained adherence is reported as adherence as all trials were longer than 6 months and only end of trial adherence reported |
| Quality of life ‐ not reported | ‐ | ‐ | ‐ | ‐ | ‐ | |
| *The risk in the intervention group (and its 95% CI) is based on the assumed risk in the comparison group and the relative effect of the intervention (and its 95% CI). | ||||||
| GRADE Working Group grades of evidence | ||||||
| 1 We downgraded the quality of evidence by 2 due to high or uncertain risk of bias in several domains | ||||||
| DFX film‐coated tablet compared to DFX dispersible tablet for improving adherence to iron chelation therapy in people with sickle cell disease or thalassaemia | ||||||
| Patient or population: improving adherence to iron chelation therapy in people with sickle cell disease or thalassaemia | ||||||
| Outcomes | Anticipated absolute effects* (95% CI) | Relative effect | № of participants | Certainty of the evidence | Comments | |
| Risk with DFX dispersible tablet | Risk with DFX film‐coated tablet | |||||
| Adherence to iron chelation therapy (n, N) | Study population | RR 1.10 | 173 | ⊕⊕⊝⊝ | ||
| 849 per 1000 | 934 per 1000 | |||||
| Incidence of SAEs | Study population | RR 1.22 | 173 | ⊕⊝⊝⊝ | ||
| 151 per 1,000 | 184 per 1000 | |||||
| All‐cause mortality | Study population | RR 2.97 | 173 | ⊕⊝⊝⊝ | ||
| 0 per 1000 | 0 per 1000 | |||||
| Sustained adherence ‐ not measured | ‐ | ‐ | ‐ | ‐ | ‐ | Reported as adherence as trial was 6 months in duration and end of trial adherence reported |
| Quality of life ‐ not reported | ‐ | ‐ | ‐ | ‐ | ‐ | |
| *The risk in the intervention group (and its 95% confidence interval) is based on the assumed risk in the comparison group and the relative effect of the intervention (and its 95% CI). | ||||||
| GRADE Working Group grades of evidence | ||||||
| 1 We downgraded the quality of evidence by 2 for risk of bias due to high or unclear risk of bias in all domains | ||||||
| DFP and DFO compared to DFP for improving adherence to iron chelation therapy in people with sickle cell disease or thalassaemia | ||||||
| Patient or population: improving adherence to iron chelation therapy in people with sickle cell disease or thalassaemia | ||||||
| Outcomes | Anticipated absolute effects* (95% CI) | Relative effect | № of participants | Certainty of the evidence | Comments | |
| Risk with DFP | Risk with DFP and DFO | |||||
| Adherence to iron chelation therapy (per cent, SD) | see comment | see comment | ‐ | 289 (3 RCTs) | ⊕⊝⊝⊝ | Reported as narrative as no comparisons possible |
| Incidence of SAEs | Study population | RR 0.15 | 213 | ⊕⊕⊝⊝ | ||
| 28 per 1,000 | 4 per 1,000 | |||||
| All‐cause mortality | Study population | RR 0.77 | 237 | ⊕⊝⊝⊝ | ||
| 33 per 1,000 | 26 per 1,000 | |||||
| Sustained adherence ‐ not measured | ‐ | ‐ | ‐ | ‐ | ‐ | Sustained adherence is reported as adherence as trial duration longer than 6 months and reports adherence for length of trial |
| Quality of life ‐ not reported | ‐ | ‐ | ‐ | ‐ | ‐ | Quality of life was either not reported or no validated instruments were used |
| *The risk in the intervention group (and its 95% confidence interval) is based on the assumed risk in the comparison group and the relative effect of the intervention (and its 95% CI). | ||||||
| GRADE Working Group grades of evidence | ||||||
| 1 We downgraded the quality of evidence by 2 for risk of bias as there was high or uncertain risk of bias in most domains in 3 out of 4 trials | ||||||
| DFP and DFO compared to DFO for improving adherence to iron chelation therapy in people with sickle cell disease or thalassaemia | ||||||
| Patient or population: improving adherence to iron chelation therapy in people with sickle cell disease or thalassaemia | ||||||
| Outcomes | Anticipated absolute effects* (95% CI) | Relative effect | № of participants | Certainty of the evidence | Comments | |
| Risk with DFO | Risk with DFP and DFO | |||||
| Adherence to iron chelation therapy (per cent, SD) | see comment | see comment | ‐ | 205 (4 RCTs) | ⊕⊕⊝⊝ | Reported as narrative only as adherence in combined group not reported for combination therapy |
| Incidence of SAEs | Study population | ‐ | 205 (4 RCTs) | ⊕⊕⊝⊝ | 3 trials report no SAEs; SAES are not reported in one trial | |
| see comment | see comment | |||||
| All‐cause mortality | Study population | ‐ | 205 (4 RCTs) | ⊕⊕⊝⊝ | no deaths reported | |
| see comment | see comment | |||||
| Sustained adherence ‐ not measured | ‐ | ‐ | ‐ | ‐ | ‐ | Sustained adherence reported as adherence as trial duration was longer than 6 months and adherence reported at end of trial |
| Quality of life ‐ not reported | ‐ | ‐ | ‐ | ‐ | ‐ | |
| *The risk in the intervention group (and its 95% CI) is based on the assumed risk in the comparison group and the relative effect of the intervention (and its 95% CI). | ||||||
| GRADE Working Group grades of evidence | ||||||
| 1 We downgraded the quality of evidence by 2 for risk of bias as high or unclear risk of bias in all domains | ||||||
| DFP/DFO compared to DFP/DFX for improving adherence to iron chelation therapy in people with sickle cell disease or thalassaemia | ||||||
| Patient or population: improving adherence to iron chelation therapy in people with sickle cell disease or thalassaemia | ||||||
| Outcomes | Anticipated absolute effects* (95% CI) | Relative effect | № of participants | Certainty of the evidence | Comments | |
| Risk with DFP/DFX | Risk with DFP/DFO | |||||
| Adherence to iron chelation therapy rates (n,N) ‐ 1 year | Study population | RR 0.84 | 96 | ⊕⊕⊝⊝ | ||
| 938 per 1000 | 788 per 1000 | |||||
| Incidence of SAE | Study population | RR 1.00 | 96 | ⊕⊝⊝⊝ | ||
| 21 per 1,000 | 21 per 1000 | |||||
| All‐cause mortality ‐ at 1 year ‐ trial end | Study population | Not estimable | 96 | ⊕⊕⊝⊝ | No deaths were reported | |
| 0 per 1000 | 0 per 1000 | |||||
| Sustained adherence ‐ not measured | ‐ | ‐ | ‐ | ‐ | ‐ | Sustained adherence is reported as adherence as trial was 1 year in duration and end of trial adherence reported |
| Quality of life see comment | ‐ | ‐ | ‐ | ‐ | ‐ | The study uses SF36 to measure quality of life, the results are presented as a graph. Quality of life increased in both trial arms with no significant difference between trial arms P = 0.860 |
| *The risk in the intervention group (and its 95% confidence interval) is based on the assumed risk in the comparison group and the relative effect of the intervention (and its 95% CI). | ||||||
| GRADE Working Group grades of evidence | ||||||
| 1 We downgraded the quality of evidence by 1 for risk of bias as there was high or unclear risk of bias in 3 domains | ||||||
| Medication management compared to standard care for improving adherence to iron chelation therapy in people with sickle cell disease or thalassaemia | ||||||
| Patient or population: improving adherence to iron chelation therapy in people with sickle cell disease or thalassaemia | ||||||
| Outcomes | Anticipated absolute effects* (95% CI) | Relative effect | № of participants | Certainty of the evidence | Comments | |
| Risk with standard care | Risk with medication management | |||||
| Adherence to iron chelation therapy ‐ not reported | ‐ | ‐ | ‐ | Adherence was only reported in the intervention group and therefore no comparative data | ||
| SAEs ‐ not reported | ‐ | ‐ | ‐ | ‐ | ‐ | |
| Mortality ‐ not reported | ‐ | ‐ | ‐ | ‐ | ‐ | |
| Sustained adherence | ‐ | ‐ | ‐ | ‐ | ‐ | Adherence was only reported in the intervention group and therefore no comparative data |
| Quality of life | ‐ | 48 | ⊕⊝⊝⊝ | Medication management: 63.51 (51.75 – 84.54); standard care: 49.84 (41.9 – 60.81) | ||
| *The risk in the intervention group (and its 95% confidence interval) is based on the assumed risk in the comparison group and the relative effect of the intervention (and its 95% CI). | ||||||
| GRADE Working Group grades of evidence | ||||||
| 1 We downgraded the quality of evidence for indirectness by 2 because most outcomes were only reported in the medication management group | ||||||
Background
Description of the condition
Haemoglobinopathies are a range of inherited disorders resulting from mutations of the globin genes (the protein component of haemoglobin). Two of the most common of these disorders are sickle cell disease (SCD) and thalassaemia.
Sickle cell disease
SCD is an inheritable blood disorder, which can lead to life‐threatening complications. People with SCD experience episodes of severe pain, and other complications including anaemia, end‐organ damage, pulmonary complications, kidney disease, and increased susceptibility to infections and stroke (Pleasants 2014). It is one of the most common severe monogenic disorders in the world, due to the inheritance of two abnormal haemoglobin (beta globin) genes (Rees 2010). Populations originating from sub‐Saharan Africa, Spanish‐speaking regions in the western hemisphere (South America, the Caribbean, and Central America), the Middle East, India and parts of the Mediterranean are predominantly affected. Reductions in infant and child mortality and increasing migration from highly affected countries have made this a worldwide problem (Piel 2012). Over 12,500 people in the UK and 100,000 in the USA suffer from the disease (NICE 2010; Pleasants 2014).
The term SCD refers to all mutations that cause the disease, of which there are three main types. Sickle cell anaemia is the most common form of the disease (up to 70% of cases of SCD in people of African origin) and is due to the inheritance of two beta globin S (βS) alleles (haemoglobin (Hb)SS). The second most common genotype (up to 30% of cases in people of African origin) is haemoglobin SC disease (HbSC disease) and is due to the co‐inheritance of the βS and βC alleles; this tends to be a more moderate form of the disease. The third major type of SCD occurs when βS is inherited with a β‐thalassaemia allele, causing HbS/β‐thalassaemia (Rees 2010). People who have inherited a thalassaemia null mutation (HbSβº) have a disease that is clinically indistinguishable from sickle cell anaemia, whereas people with HbSβ+ thalassaemia have a milder disorder. In high‐income nations, people with SCD are expected to live into their 40s, 50s and beyond; whereas in low‐income countries, including some African nations, it is estimated that between 50% to 90% of children born with HbSS die before their fifth birthday (Gravitz 2014; Grosse 2011).
Red blood cell transfusions can be given to treat complications of SCD (e.g. acute chest syndrome), this often involves a single transfusion episode, or they can be part of a regular long‐term transfusion programme to prevent complications of SCD such as stroke in children (Yawn 2014).
Thalassaemia
The term thalassaemia describes a group of inheritable disorders caused by the absence or reduction in globin chain production. This results in ineffective red blood cell production, anaemia and poor oxygen delivery. The genetic defect can be in the α or β globin chain (α‐thalassaemia, β‐thalassaemia or H disease). In β‐thalassaemia, reduced or absent β globulin production leads to an excess of free α‐globin chains resulting in severe anaemia and bone marrow hyperplasia (abnormal cell growth) preventing normal development. In H disease and α‐thalassaemia, the α‐globin chains are affected and disease can vary from mild (where reduced, but adequate, amounts of the functional globin chains are produced) to severe (where no effective haemoglobin is produced) (UK Thalassaemia Society 2008). Complications that may occur include infections, bone diseases, enlarged spleen, slowed growth rates, cardiomyopathy, venous thrombosis, pulmonary hypertension, and hypothyroidism (Rund 2005).
Thalassaemia is common in people from the Mediterranean, the Middle East, Southeast Asia, the Indian subcontinent, and Africa (Piel 2014; UK Thalassaemia Society 2008). It is estimated that there are over 1000 people with thalassaemia in the UK (APPG 2009). In high‐income countries most affected children survive with a chronic disorder; however, most children born with thalassaemia are in low‐income countries die before the age of five years (Modell 2008). Nevertheless, the thalassaemias are a global health burden due to population migration and growth and improved survival leading to an increase in the incidence of the disorder (Piel 2014).
Regular red blood cell transfusion is the standard treatment to correct anaemia and to enable growth and development, normal activities and to inhibit bone marrow expansion. People with severe forms, β‐thalassaemia major, require life‐long transfusions from the first year of life.
Iron chelation therapy and adherence
Regularly transfused people with SCD, as well as transfusion‐dependent, and non‐transfusion‐dependent people with thalassaemia, are exposed to transfusion‐related iron overload. Transfusion‐related iron overload can lead to iron toxicity, with organs such as the heart, liver and endocrine glands being particularly vulnerable. Iron overload is the major cause of morbidity and mortality in thalassaemia (Aydinok 2014; Rund 2005; Trachtenberg 2012).
Iron chelating agents are used for preventing and treating iron overload. Deferoxamine (DFO) has been the standard treatment for the last 40 years; it is administered subcutaneously or intravenously usually over eight to 12 hours, up to seven days a week. More recently two oral chelating agents, deferiprone (DFP) and then deferasirox (DFX), have been licensed. These were initially introduced as second‐line agents in children six years and older with β‐thalassaemia major, or in people when DFO is contraindicated or found to be inadequate (Fisher 2013). These oral agents are becoming more commonly used, particularly DFX, because of the ease of administration compared to subcutaneous or intravenous DFO (Aydinok 2014).
Licensed iron chelating agents are effective at iron removal; however, the treatment is not without side effects (Telfer 2006). Side effects with DFO include pain or skin reactions at the injection site, retinal toxicity and hearing loss. Side effects with DFX include skin rashes, gastroenteritis, an increase in liver enzymes, and reduced kidney function. Adverse events reported in people taking DFP include gastrointestinal disturbances, arthropathy (joint disease), raised liver enzymes, neutropenia (a decrease in neutrophils, a type of white blood cell, in the blood stream) and agranulocytosis (lowered white blood cell count). Regular blood sampling is recommended to monitor neutropenia, renal function and liver enzymes in people taking oral chelating agents (Fisher 2013).
Adherence to medications is defined as the extent to which a person's use of the medicine matches the agreed prescription from the healthcare provider (NICE 2009;Walsh 2014). Moderate adherence is defined as taking 60% to 80% of a prescribed dose, while high adherence can include the continued use of the medicine or taking at least 80% of the recommended dose. There are several ways to measure adherence including the self‐reporting of medication use or more objective factors such as pill counts, prescription refills, urinary assays or in the case of iron chelation, signs of iron overload (Ryan 2014;Walsh 2014). Adherence rates can vary widely, a recent review reported that adherence rates to the iron chelator deferasirox ranged between 22% and 89% (Loiselle 2016).
Research suggests that iron chelation therapies impact on a person's quality of life (QoL) and result in low levels of personal satisfaction. The intensive demands and uncomfortable side effects of iron chelation therapy can have a negative impact on daily activities and well‐being, which may affect adherence to therapy (Abetz 2006; Payne 2008; Rofail 2010). Other factors affecting adherence to medications include inappropriate use, the quality of information provided to the individual, complex treatment regimens, as well as intolerance to the harms caused by the medications (Ryan 2014). Non‐adherence can be both intentional and unintentional, with intentional non‐adherence being influenced by such factors as poor communication, adverse effects, personal preferences or beliefs and disagreement with the need for treatment; whereas unintentional non‐adherence is influenced by factors generally beyond the person's control such as forgetfulness or difficulties in understanding instructions (NICE 2009; Ryan 2014; Trachtenberg 2012). Sub‐optimal adherence can increase adverse events associated with iron overload and result in increased cost of care, hospitalisations, and severe morbidity and mortality (Payne 2008; Vekeman 2016; WHO 2003).
Description of the intervention
The research on adherence and appropriate use of medicines is vast and complex and comprises a number of studies targeting people taking the medication, clinicians, indications and specific classes of medications. This research has also been reviewed in many systematic reviews as well as overviews of systematic reviews and in guidelines (Costello 2004; NCCPC 2009; NICE 2009; Ryan 2014; WHO 2003).
For this review we focus on the individual with SCD or thalassaemia, with interventions to increase adherence to iron chelation therapy being divided into three main categories. These are psychological and psychosocial interventions, educational interventions and medication interventions. These interventions may be delivered alone or in combination (as a complex intervention). For instance, combining psychological with psychosocial interventions such as symptom self‐management with peer support; or medication changes implemented with reconciliation strategies or complemented with medication information and education.
Psychological and psychosocial interventions
Psychological and psychosocial therapies that may promote medication adherence include interventions to promote behavioural change such as cognitive behavioural therapy (CBT), as well as peer support, counselling and skills development (communication, social, emotional). In addition there is an increasing emphasis on health‐system interventions that may influence adherence such as patient‐centred care and shared decision‐making (NCCPC 2009; Ryan 2014; WHO 2003).
In an outpatient clinic survey of 328 people with SCD using the Patient Health Questionnaire 9, up to 60% of people with SCD experienced mild to severe depressive symptoms. Interventions to address depression and other co‐morbidities may promote medication adherence, and depending on the degree of depression or other co‐morbidities can include medications, guided self‐help, individual or group CBT or peer support (NCCMH 2010; NICE 2009; Thomas 2013).
Education interventions
Educational interventions may include disease and medication information, and assistance with communication skills to facilitate communication with healthcare providers (Haywood 2009;Ryan 2014). Interventions in the form of personal communication, structured presentations, and formal educational activities delivered by clinicians or non‐medical personnel are included in this category.
Medication interventions
The identification and correction of medication issues such as under‐utilisation, dosing and scheduling, allergies and contraindications, financial issues and inadequate monitoring may impact on adherence and health outcomes. Additional strategies such as positive medication changes to reduce burden or increase effectiveness, route of administration, risk minimisation and medication reconciliation may be used to promote improved medication adherence (NCCPC 2009; Ryan 2014).
How the intervention might work
Psychological and psychosocial interventions
People with chronic illness face a variety of psychological and psychosocial problems including depression, anxiety disorders, disease burden and restrictions on social and occupational functioning. Research suggests that skill development to help people with chronic illnesses cope with adverse effects of medication and any co‐morbidities will decrease disease burden, and improve their health‐related QoL (NCCMH 2010; NCCPC 2009). The use of cognitive aids, clear instructions and realistic expectations can improve adherence (Wertheimer 2003). Person‐centred psychological and psychosocial interventions encourage self‐management skills, shared decision‐making and self‐efficacy (NCCPC 2009; NICE 2009).
Educational interventions
Tailored educational interventions can be delivered to individuals or groups and can be delivered face‐to‐face or remotely. Educational interventions may include both a simple approach, such as evidence‐based plain language information, by written or verbal communication, or a multi‐faceted approach that considers the wider environment, management, decision making, lifestyle and communication roles taken on by the person taking the medication (Ryan 2014). Each approach should be tailored to the individual (NCCPC 2009;WHO 2003).
Medication interventions
Iron levels are monitored in people receiving regular transfusions. An increasing iron burden may necessitate medication changes or more aggressive iron chelation therapy such as increasing doses or combination therapy. People may also change medications multiple times due to worsening iron overload, side effects, or personal preferences (Trachtenberg 2014). Medication changes that reflect personal preferences or minimise harms and improve outcomes, combined with medication reconciliation strategies including audit and feedback, prescription and medication help lines, counselling and age‐appropriate discharge instructions, may help to address and improve adherence (NCCPC 2009; Ryan 2014). Medication interventions also include medication management which is a person‐centred intervention by a clinician (often a pharmacist) to optimise drug therapy in order to improve outcomes for the person (American Pharmacists Association 2008).
Why it is important to do this review
Adherence to iron chelation therapy is necessary to decrease the risk of morbidity and mortality associated with iron overload. Poor adherence can also result in increased healthcare costs. It is therefore important to understand the effectiveness and limitations of interventions which can be used to influence adherence in people receiving iron chelation therapy for SCD or thalassaemia.
Objectives
To identify and assess the effectiveness of interventions to improve adherence to iron chelation therapy compared to standard care in people with SCD or thalassaemia including:
-
identifying and assessing the effectiveness of different types of interventions (psychological and psychosocial, educational, medication interventions (which include comparisons of adherence between different iron chelators), or multi‐component interventions);
-
identifying and assessing the effectiveness of interventions specific to different age groups (children, adolescents, adults).
Methods
Criteria for considering studies for this review
Types of studies
We included randomised controlled trials (RCTs) comparing one or more adherence interventions, to standard care.
For studies comparing medications or medication changes, we only included RCTs.
If no RCTs were available, we planned to include non‐randomised studies of interventions (NRSIs), controlled before‐after (CBA) studies, and interrupted time series (ITS) studies including repeated measures designs for those studies including psychological and psychosocial interventions, educational Interventions, or multi‐component interventions. We used the Cochrane Effective Practice and Organisation of Care (EPOC) Group's definition of study designs to consider studies for inclusion (EPOC 2015).
We planned to include cluster‐randomised trials, non‐randomised cluster trials, and CBA studies if they had at least two intervention sites and two control sites. We excluded cluster‐randomised trials, non‐randomised cluster trials, and CBA studies that had only one intervention or control site because the intervention (or comparison) may be confounded by study site making it difficult to attribute any observed differences to the intervention rather than to other site‐specific variables (EPOC 2015).
We planned to include ITS and repeated measures studies which had a clearly defined point in time when the intervention occurred and at least three data points before and after the intervention. We excluded ITS studies that did not have a clearly defined point in time when the intervention occurred, or fewer than three data points before and after the intervention, or the ITS study ignored secular (trend) changes, performed a simple t‐test of the pre‐ versus post‐intervention periods and re‐analysis of the data was not possible (in accordance with EPOC 2015 recommendations).
Types of participants
Children, adolescents, or their caregivers, and adults with SCD or transfusion‐dependent or non‐transfusion‐dependent thalassaemia.
Types of interventions
-
Psychological and psychosocial Interventions
-
Educational interventions
-
Medication interventions
-
Multi‐component interventions (combining aspects of the above interventions)
versus
-
Standard care (as defined in the trial)
Types of outcome measures
Primary outcomes
-
Adherence to iron chelation therapy rates (defined as per cent of doses administered (number of doses of the iron chelator taken, out of number prescribed), measured for a minimum of three months
-
Serious adverse events (SAEs) (including complications from the therapy, the disease itself, and non‐adherence to chelation therapy)
-
All‐cause mortality
We categorised all‐cause mortality and SAEs according to short‐, medium‐, and long‐term outcomes. We reported the exact definition of these time frames over time periods that are common to as many trials as possible (e.g. zero to one year, one to five years, over five years).
Secondary outcomes
-
Sustained adherence to therapy (measured for a minimum of six months)
-
Health‐related QoL (as measured by validated instruments)
-
Iron overload (defined by ferritin over 1000 µg/L, or clinical symptoms, or signs of iron overload, e.g. magnetic resonance imaging (MRI) T2* cardiac iron content, MRI R2* liver iron content, liver biopsy, or the need for medically indicated additional or change in chelation therapy)
-
Organ damage (including cardiac failure, endocrine disease, surrogate markers of organ damage (creatinine), histologic evidence of hepatic fibrosis)
-
Other adverse events related to iron chelation
We categorised health‐related QoL, iron overload and organ damage according to short‐, medium‐, and long‐term outcomes. We reported the exact definition of these time frames over time periods that are common to as many studies as possible (e.g. up to six months, six to 12 months, over 12 months).
Search methods for identification of studies
We searched for all relevant published and unpublished trials without restrictions on language, year or publication status.
Electronic searches
We identified studies from the Cochrane Cystic Fibrosis and Genetic Disorders Group's Haemoglobinopathies Trials Register using the terms: (sickle cell OR thalassaemia) AND iron chelation.
The Haemoglobinopathies Trials Register is compiled from electronic searches of the Cochrane Central Register of Controlled Trials (CENTRAL) (updated each new issue of the Cochrane Library) and weekly searches of MEDLINE. Unpublished work is identified by searching the abstract books of five major conferences: the European Haematology Association conference; the American Society of Hematology conference; the British Society for Haematology Annual Scientific Meeting; the Caribbean Public Health Agency Annual Scientific Meeting (formerly the Caribbean Health Research Council Meeting); and the National Sickle Cell Disease Program Annual Meeting. For full details of all searching activities for the register, please see the relevant section of the Cochrane Cystic Fibrosis and Genetic Disorders Group's website.
Date of the most recent search of the Cochrane Cystic Fibrosis and Genetic Disorders Group's Haemoglobinopathies Trials Register: 12 December 2017.
In addition to the above, we conducted a search of the following databases to include RCTs, NRSIs, CBA and ITS studies:
-
Cochrane Central Register of Controlled Trials (CENTRAL; 2017, Issue 1) and Other Reviews (DARE; 2015, Issue 2) (www.cochranelibrary.com/) searched 01 February 2017;
-
PubMed (Epub Ahead of Print, In‐Process and Other Non‐Indexed Citations, for recent records not yet added to MEDLINE) (www.ncbi.nlm.nih.gov/sites/entrez) searched 01 February 2017;
-
MEDLINE (OvidSP, Epub Ahead of Print, In‐Process and Other Non‐Indexed Citations, Ovid MEDLINE Daily and Ovid MEDLINE, 1946 to 01 February 2017);
-
Embase (OvidSP, 1974 to 01 February 2017);
-
CINAHL (EBSCOHost, 1937 to 01 February 2017);
-
PsycINFO (EBSCOHost, 1900 to 01 February 2017);
-
ProQuest Dissertations & Theses Global (ProQuest, 1861 to 01 February 2017);
-
Psychology and Behavioral Sciences Collection (EBSCOHost, 1930 to 01 February 2017);
-
Web of Science Science & Social Sciences Conference Proceedings Indexes (CPSI‐S & CPSSI, 1990 to 01 February 2017).
We also searched the following trial registries for ongoing trials:
-
ClinicalTrials.gov (clinicaltrials.gov/) searched on 01 February 2017;
-
WHO International Clinical Trials Registry Platform (ICTRP) (apps.who.int/trialsearch/) searched on 01 February 2017;
-
ISRCTN registry (www.isrctn.com/) searched on 01 February 2017.
Search strategies can be found in an appendix (Appendix 1).
Searching other resources
We handsearched reference lists of included trials in order to identify further relevant trials.
Data collection and analysis
Selection of studies
We selected trials according to chapter 7 of the Cochrane Handbook for Systematic Reviews of Interventions (Higgins 2011b). Three review authors (PF, KM, LE) independently screened all electronically‐derived citations and abstracts of papers identified by the search strategy for relevance. We excluded studies that were clearly irrelevant at this stage based on the abstract. Three review authors (PF, KM, LE) independently assessed the full texts of all potentially‐relevant studies for eligibility against the criteria outlined above. We resolved disagreements by discussion, if we did not reach a consensus or if we were unsure of trial eligibility, we consulted a third review author (LE or SH). We sought further information from trial investigators if the trial report or abstract contained insufficient data to make a decision about eligibility. We used Covidence software to assess trial eligibility, which included ascertaining whether the participants had SCD or thalassaemia, if the trial addressed interventions to improve adherence to iron chelation therapy, and whether the trial was randomised or a NRSI or a CBA or an ITS study (Covidence). We recorded the reasons why potentially‐relevant studies failed to meet the eligibility criteria.
Data extraction and management
Three review authors (PF, SF, KM) extracted the data according to Cochrane guidelines (Higgins 2011a). We resolved disagreements by consensus or we consulted a fourth review author (LE). We extracted data independently for all of the trials using Covidence modified to reflect the outcomes in this review (Covidence). In addition, we used the available tables in Review Manager 5 to extract data on trial characteristics as below (RevMan 2014).
General information
Review author's name, date of data extraction, study ID, first author of study, author's contact address (if available), citation of paper, objectives of the study.
Study details
Design, location, setting, sample size, power calculation, treatment allocation, inclusion and exclusion criteria, reasons for exclusion, comparability of groups, length of follow‐up, stratification, stopping rules described, statistical analysis, results, conclusion, and funding.
Characteristics of participants
Age, gender, total number recruited, total number randomised, total number analysed, types of underlying disease, loss to follow‐up numbers, dropouts (percentage in each arm) with reasons, protocol violations, iron chelating agent, previous treatments, current treatment, prognostic factors, co‐morbidities, ferritin levels.
Interventions
Details of the interventions including type of intervention whether psychological and psychosocial or educational or medication or multi‐component interventions, how the intervention is being delivered (i.e. group, face‐to‐face, written information, electronically) and by whom (i.e. clinicians, peers) and where the intervention is being delivered (i.e. hospital, clinic, home).
Outcomes measured
Adherence rates, SAEs, all‐cause mortality, sustained adherence to therapy, health‐related QoL, iron overload defined by ferritin over 1000 µg/L or clinical symptoms or signs of iron overload or need for medically indicated additional or change in chelation therapy (or any combination of these), evidence of organ damage, other adverse events.
We used both full‐text versions and abstracts as data sources and used one data extraction form for each unique study. Where sources did not provide sufficient information, we contacted authors for additional details.
Three review authors (PF, SF, KM) entered data and we resolved disagreements by consensus.
If NRSIs had been identified we planned to extract data according to the criteria developed for NRSIs as recommended in Chapter 13 of the Cochrane Handbook of Systematic Reviews of Interventions (Reeves 2011). In addition to the items above, for NRSIs, CBA and ITS studies we also planned to collect data on: confounding factors; the comparability of groups on confounding factors; methods used to control for confounding and on multiple effect estimates (both unadjusted and adjusted estimates) as recommended in chapter 13 of the Cochrane Handbook of Systematic Reviews of Interventions (Reeves 2011).
Assessment of risk of bias in included studies
Three review authors (PF, KM, SF) assessed all included trials for possible risks of bias as described in the Cochrane Handbook of Systematic Reviews of Interventions (Higgins 2011c).
The assessment included information about the design, the conduct and the analysis of the trial. We assessed each criterion using Cochrane's tool for assessing the risk of bias for RCTs (classed as 'low', 'high' or 'unclear' risk) in the following areas.
-
Selection bias (random sequence generation and allocation concealment)
-
Performance bias (blinding of participants and personnel)
-
Detection bias (blinding of outcome assessment)
-
Attrition bias (incomplete outcome data)
-
Reporting bias (selective reporting)
-
Other bias
We resolved disagreements on the assessment of quality of an included trial by discussion until we reached consensus or failing that by consulting a fourth review author (LE).
The only included trials were RCTs. In future updates of this review, we plan to use the ROBINS‐I tool (Risk Of Bias In Non‐randomized Studies of Interventions) to rate the quality of NRSIs and CBA studies (Sterne 2016). The tool, uses signalling questions and covers seven domains (listed below) where the quality of evidence is rated as 'low', 'moderate', 'serious', 'critical' or 'no information'. Please refer to an appendix for a copy of the tool (Appendix 2).
-
Bias due to confounding
-
Bias in the selection of participants
-
Bias in measurement of interventions
-
Bias due to departure from intended interventions
-
Bias due to missing data
-
Bias in measurement of outcomes
-
Bias in the selection of the reported result
In future updates of this review, for ITS studies we plan to use the risk of bias criteria below as suggested for EPOC reviews (EPOC 2015).
-
Was the intervention independent of other changes?
-
Was the shape of the intervention effect pre‐specified?
-
Was the intervention unlikely to affect data collection?
-
Was knowledge of the allocated interventions adequately prevented during the study?
-
Were incomplete outcome data adequately addressed?
-
Was the study free from selective outcome reporting?
-
Was the study free from other risks of bias?
Measures of treatment effect
RCTs
For RCTs of continuous outcomes we recorded the mean, standard deviation (SD) and total number of participants in both the treatment and control groups. For those using the same scale, we performed analyses using the mean difference (MD) with 95% confidence intervals (CIs); for those reported using different scales, we would have used standardised mean difference (SMD).
For RCTs of dichotomous outcomes we recorded the number of events and the total number of participants in both the treatment and control groups and reported the pooled risk ratio (RR) with a 95% CI (Deeks 2011). Where the number of observed events is small (less than 5% of sample per group), and where trials have balanced treatment groups, we would have reported the Peto odds ratio (OR) with 95% CI (Deeks 2011).
There were no eligible cluster randomised trials, if such trials are included in future updates of this review, we plan to extract and report direct estimates of the effect measure (e.g. RR with a 95% CI) from an analysis that accounts for the clustered design. We will obtain statistical advice (MT) to ensure the analysis is appropriate. If appropriate analyses are not available, we will make every effort to approximate the analysis following the recommendations in chapter 16 of the Cochrane Handbook for Systematic Reviews of Interventions (Higgins 2011d).
Non‐randomised studies
There were no eligible NRSIs, if such studies are included in future updates of this review, we plan to extract and report the RR with a 95% CI for dichotomous outcomes, adjusting for baseline differences (such as Poisson regressions or logistic regressions) or the ratio of RRs (i.e. the RR post intervention / RR pre intervention).
For continuous variables we will extract and report the absolute change from a statistical analysis adjusting for baseline differences (e.g. regression models, mixed models or hierarchical models) or the relative change adjusted for baseline differences in the outcome measures (i.e. the absolute post‐intervention difference between the intervention and control groups, as well as the absolute pre‐intervention difference between the intervention and control groups / the post‐intervention level in the control group) (EPOC 2015).
ITS studies
There were no eligible ITS studies, if such studies are included in future updates, we plan to standardise data by dividing the level (or time slope) and standard error (SE) by the SD of the pre‐intervention slope, in order to obtain the effect sizes.
Where appropriate, we plan to report the number‐needed‐to‐treat‐to‐benefit (NNTB) and the number‐needed‐to‐treat‐to‐harm (NNTH) with CIs.
If we are unable to report the available data in any of the formats described above, we will perform a narrative report, and if appropriate, present the data in tables.
Unit of analysis issues
For trials with multiple treatment groups or interventions, we included subgroups that were considered relevant to the analysis. If appropriate, we combined groups to create a single pair‐wise comparison. If this was not possible, we selected the most appropriate pair of interventions and excluded the others (Higgins 2011d). No trials randomised participants more than once.
There were no included cluster randomised studies or NRSIs. If these are included in future updates of this review, we plan to treat any unit of analysis issues that arise in accordance with the advice given in chapter 16 of the Cochrane Handbook for Systematic Reviews of Interventions (Higgins 2011d). .
There were no included ITS studies. If these are included in future updates of this review, we plan to deal with any unit of analysis issues arising from their inclusion according to the EPOC recommendations (EPOC 2015).
Dealing with missing data
Where we identified data as being missing or unclear in the published literature, we contacted trial authors directly. We contacted three authors for additional trial information (Antmen 2013; Badawy 2010; Elalfy 2015) and have received one response stating that the trial data were not available at this time (Badawy 2010).
We recorded the number of participants lost to follow‐up for each trial. Where possible, we analysed data on an intention‐to‐treat (ITT) basis, but if insufficient data were available, we also presented a per protocol analyses (Higgins 2011c).
Assessment of heterogeneity
If the clinical and methodological characteristics of individual trials were sufficiently homogeneous, we combined the data to perform a meta‐analysis. We planned to analyse the data from RCTs, NRSIs, CBA and ITS studies separately, but we only included RCTs.
We assessed statistical heterogeneity of treatment effects between trials using a Chi² test with a significance level at P < 0.1. We used the I² statistic to quantify the degree of potential heterogeneity and classified it as moderate if I² is greater than 50%, or considerable if I² is greater than 75%. We used the random‐effects model as we anticipated that we would identify at least moderate clinical and methodological heterogeneity within the trials selected for inclusion. If statistical heterogeneity was considerable, we did not report the overall summary statistic. We assessed potential causes of heterogeneity by sensitivity and subgroup analyses (Deeks 2011).
Assessment of reporting biases
No meta‐analysis in this review included at least 10 trials, we therefore could not perform a formal assessment of publication bias (Sterne 2011).
Data synthesis
If trials were sufficiently homogenous in their design, we conducted a meta‐analysis according to the recommendations of Cochrane (Deeks 2011). We used the random‐effects model for all analyses as we anticipated that true effects would be related but not the same for included trials. If we could not perform a meta‐analysis we commented on the results as a narrative.
For RCTs where meta‐analysis was feasible, we used the Mantel‐Haenszel method for dichotomous outcomes and the inverse variance method for continuous outcomes. We did not have outcomes that included data from cluster‐RCTs. Where heterogeneity was above 75%, and we identified a cause for the heterogeneity, we explored this with subgroup analyses. If we did not find a cause for the heterogeneity then we did not perform a meta‐analysis.
If identified, we planned to analyse NRSIs or CBA studies separately. We planned to analyse outcomes with adjusted effect estimates if these were adjusted for the same factors using the inverse variance method as recommended in chapter 13 of the Cochrane Handbook of Systematic Reviews of Interventions (Reeves 2011). For ITS studies, we would have used the effect sizes (if reported in the included studies or obtained (as described earlier)) and pooled them using the generic inverse variance method in Review Manager 5 (RevMan 2014).
Subgroup analysis and investigation of heterogeneity
We reported results for the different types of disease separately (SCD or thalassaemia). Only one trial included participants with SCD (Vichinsky 2007).
There were insufficient data to perform some of the planned subgroup analyses. We planned to perform subgroup analyses according to Cochrane's recommendations (Deeks 2011) for each of the following criteria, and separately for the different study design types included in the review in order to assess the effect on heterogeneity.
-
Age of participant (child (one to 12 years), adolescent (13 to 17 years) adult (18+ years))
-
Route of administration of iron chelating agents (oral, intravenous or subcutaneous)
Sensitivity analysis
There were insufficient data to perform the planned sensitivity analyses. If adequate data were available, we planned to assess the robustness of our findings by performing the following sensitivity analyses according to Cochrane recommendations where appropriate (Deeks 2011).
-
Including only those trials with a 'low' risk of bias (e.g. RCTs with methods assessed as low risk for random sequence generation and concealment of treatment allocation)
-
Including only those studies with less than a 20% dropout rate
-
Duration of follow‐up (up to and including six months compared to over six months)
Summary of findings table
We used the GRADE approach to generate a 'Summary of Findings' table as suggested in the Cochrane Handbook for Systematic Reviews of Interventions (Schünemann 2011a). We used the GRADE approach to rate the quality of the evidence as 'high', 'moderate', 'low', or 'very low' using the five GRADE considerations.
-
Risk of bias (serious or very serious)
-
Inconsistency (serious or very serious)
-
Indirectness (serious or very serious)
-
Imprecision (serious or very serious)
-
Publication bias (likely or very likely)
For NRSIs or CBA or ITS studies, we planned to consider the following factors.
-
Dose response (yes or no)
-
Size of effect (large or very large)
-
Confounding either reduces the demonstrated effect or increases the effect if no effect was observed (yes or no)
In GRADE NRSIs or CBA or ITS studies are rated initially as low quality and upgraded according to GRADE guidelines if appropriate. We planned to present outcomes for these studies in separate tables from outcomes for the results of RCTs.
We reported the following outcomes in each 'Summary of findings' table.
-
Adherence rates (minimum of three months)
-
Serious adverse events (most common time frame used in most studies)
-
All‐cause mortality (most common time frame used in most studies)
-
Sustained adherence (six months or more)
-
QoL (most common time frame used in most studies)
Results
Description of studies
See also Characteristics of included studies; Characteristics of excluded studies; Characteristics of studies awaiting classification; Characteristics of ongoing studies.
Results of the search
See PRISMA flow diagram (Figure 1).
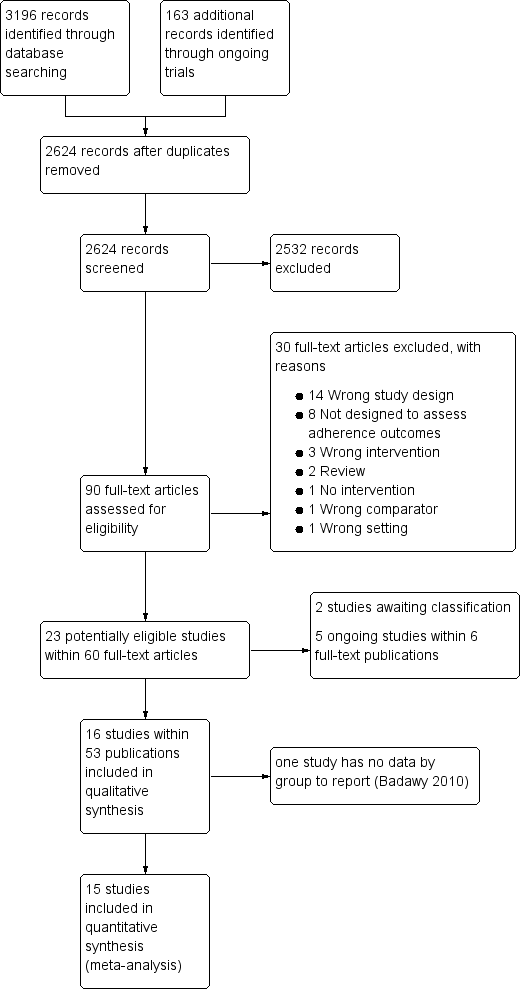
Study flow diagram.
In the searches for this review we identified a total of 3359 potentially relevant references. There were 2624 references after we removed duplicates and three review authors (PF, KM and LE) excluded 2533 references on the basis of abstract and three authors (PF, KM, LE) reviewed 90 full‐text articles for relevance.
We excluded 30 studies that were not relevant and identified 16 studies within 53 publications ‐ all were RCTs (Aydinok 2007; Badawy 2010; Bahnasawy 2017; Calvaruso 2015; El Beshlawy 2008; Galanello 2006; Hassan 2016; Maggio 2009; Mourad 2003; Olivieri 1997; Pennell 2006; Pennell 2014; Taher 2017; Tanner 2007; Vichinsky 2007).
We also identified five ongoing RCTs ( IRCT2015101218603N2; EudraCT 2012‐000353‐31; Madderom 2016; NCT02173951; NCT02435212), and two studies awaiting classification (Antmen 2013; NCT00004982). We did not identify any cluster‐randomised trials, NRSIs, CBA or ITS studies that met the inclusion criteria.
Included studies
Sixteen RCTs including 1525 participants met the pre‐defined inclusion criteria (Aydinok 2007; Badawy 2010; Bahnasawy 2017; Calvaruso 2015; Elalfy 2015; El Beshlawy 2008; Galanello 2006; Hassan 2016; Maggio 2009; Mourad 2003; Olivieri 1997; Pennell 2006; Pennell 2014; Taher 2017; Tanner 2007; Vichinsky 2007).
Two of the included trials were abstract reports only (Badawy 2010; Olivieri 1997). One abstract did not report outcomes by intervention and therefore is not included in the quantitative reporting of the effects of interventions (Badawy 2010).
Trial design
There were 15 RCTs of medication interventions (Aydinok 2007; Badawy 2010; Calvaruso 2015; Elalfy 2015; El Beshlawy 2008; Galanello 2006; Hassan 2016; Maggio 2009; Mourad 2003; Olivieri 1997; Pennell 2006; Pennell 2014; Taher 2017; Tanner 2007; Vichinsky 2007); while one was an RCT on medication management (Bahnasawy 2017).
Ten were multicentre trials (Calvaruso 2015; Elalfy 2015; Galanello 2006; Maggio 2009; Olivieri 1997; Pennell 2006; Pennell 2014; Taher 2017; Tanner 2007; Vichinsky 2007) and ranged from two centres in one country (Calvaruso 2015; Elalfy 2015; Olivieri 1997) to 44 centres in multiple countries (Vichinsky 2007). Six were single‐centre trials (Aydinok 2007; Bahnasawy 2017; Badawy 2010; El Beshlawy 2008; Hassan 2016, Mourad 2003).
Follow‐up ranged from six months in two trials (Bahnasawy 2017; Taher 2017) to five years in two trials (Calvaruso 2015; Maggio 2009). The remainder of the trials were of 12 months duration, except in the Badawy trial, which did not report follow‐up time (Badawy 2010); and the Olivieri trial, which had 24 months follow‐up (Olivieri 1997).
Trial size
The number of participants enrolled in the trials ranged from 24 (Aydinok 2007) to 213 (Maggio 2009). Sample‐size calculations were reported in eight trials (Calvaruso 2015; Elalfy 2015; El Beshlawy 2008; Maggio 2009; Pennell 2006; Pennell 2014; Tanner 2007; Vichinsky 2007).
Setting
Trials were published between 1997 and 2017. Five were conducted in Egypt (Badawy 2010; Bahnasawy 2017; Elalfy 2015; El Beshlawy 2008, Hassan 2016); five in Italy (Calvaruso 2015; Galanello 2006; Maggio 2009; Pennell 2006; Tanner 2007); and three were international multicentre trials conducted in several countries (Pennell 2014; Taher 2017; Vichinsky 2007). One trial was conducted in each of the following countries: Turkey (Aydinok 2007); Lebanon (Mourad 2003); and Canada (Olivieri 1997).
Participants
Fourteen trials included only participants with β‐thalassaemia major (Aydinok 2007; Badawy 2010; Bahnasawy 2017; Elalfy 2015; El Beshlawy 2008; Galanello 2006; Hassan 2016; Maggio 2009; Mourad 2003; Olivieri 1997; Pennell 2006; Pennell 2014; Taher 2017; Tanner 2007). One trial included only participants with SCD (Vichinsky 2007); and one trial included only participants with thalassaemia intermedia (Calvaruso 2015).
The mean age ranged from 11 years (El Beshlawy 2008) to 41 years (Calvaruso 2015). Two trials only provided the minimum age of enrolment into the RCT, at least eight years old in the Badawy trial (Badawy 2010); and at least 10 years old in the Olivieri trial (Olivieri 1997).
Participants tended to be equally divided between males and females with the lowest percentage of males at 38% (Bahnasawy 2017) to a high of 66% (Elalfy 2015).
Intervention
In this review we report the Effects of interventions by the various comparisons in the different trials. All trials included medication interventions except for one, which was a medication management intervention by a clinical pharmacist (Bahnasawy 2017).
The comparisons and studies included:
-
DFP versus DFO: five trials (Badawy 2010; Calvaruso 2015; El Beshlawy 2008; Olivieri 1997; Pennell 2006);
-
DFX versus DFO: three trials (Hassan 2016; Pennell 2014; Vichinsky 2007);
-
DFX (film‐coated tablet (FCT) versus DFX (dispersible tablet (DT)): one trial (Taher 2017);
-
DFP and DFO combined versus DFP alone: four trials (Aydinok 2007; Badawy 2010; El Beshlawy 2008; Maggio 2009);
-
DFP and DFO combined versus DFO alone: five trials (Badawy 2010; El Beshlawy 2008; Galanello 2006; Mourad 2003; Tanner 2007);
-
DFP and DFO combined versus DFP and DFX combined: one trial (Elalfy 2015);
-
Medication management versus standard care: one trial (Bahnasawy 2017).
Outcomes
Outcomes varied across trials depending on the objectives. All trials measured adherence, although this was usually as a secondary, rather than a primary outcome. Reduction in serum ferritin or LIC were the primary outcomes in most trials; however, in three trials the primary outcome was myocardial T2* MRI results (Pennell 2006; Pennell 2014; Tanner 2007) and in one trial was overall safety (Taher 2017). Safety (including both SAEs and AEs) was included as a secondary outcome in all trials. QoL was reported in three trials (Aydinok 2007; Bahnasawy 2017; Elalfy 2015).
Source
Four trials identified non‐profit organisations as their source of support, including universities, foundations and societies (Badawy 2010; Calvaruso 2015; Elalfy 2015; Maggio 2009).
Five trials identified industry sponsorships (Galanello 2006; Pennell 2006; Pennell 2014; Taher 2017; Vichinsky 2007). Six trials did not state their source of funding (Aydinok 2007; Bahnasawy 2017; El Beshlawy 2008; Hassan 2016; Mourad 2003; Olivieri 1997); but of these, three may have had industry funding. In one trial, drugs were supplied by the manufacturer (Aydinok 2007); one trial was halted by the manufacturer (Olivieri 1997); and one trial included industry employees as authors (El Beshlawy 2008).
One trial had a mix of non‐profit and industry funding (Tanner 2007).
Excluded studies
We excluded 30 trials:
-
in 14 trials the trial design did not meet the inclusion criteria (Abu 2015; Al Kloub 2014; Al Kloub 2014a; Al Refaie 1995; Alvarez 2009; Kidson Gerber 2008; Kolnagou 2008; Leonard 2014; NCT02133560; NCT02466555; Pakbaz 2004; Pakbaz 2005; Porter 2009; Porter 2012);
-
eight trials were not designed to assess adherence (Berkovitch 1995; Chakrabarti 2013; NCT01709032; NCT01825512; Vichinsky 2005; Vichinsky 2008; Waheed 2014; Yarali 2006);
-
three trials assessed the wrong intervention (Armstrong 2011, Belgrave 1989; Gomber 2004);
-
one trial had no interventions (Bala 2014);
-
one trial had a wrong comparator (Mazzone 2009);
-
one trial was in the wrong setting (Daar 2010);
-
two were reviews (Loiselle 2016; Walsh 2014).
Risk of bias in included studies
Refer to the figures section of the review for visual representations of the assessments of risk of bias across all trials and for each item in the included trials (Figure 2; Figure 3). See the risk of bias section in the Characteristics of included studies section for further information about the bias identified within individual trials.

Risk of bias graph: review authors' judgements about each risk of bias item presented as percentages across all included studies.
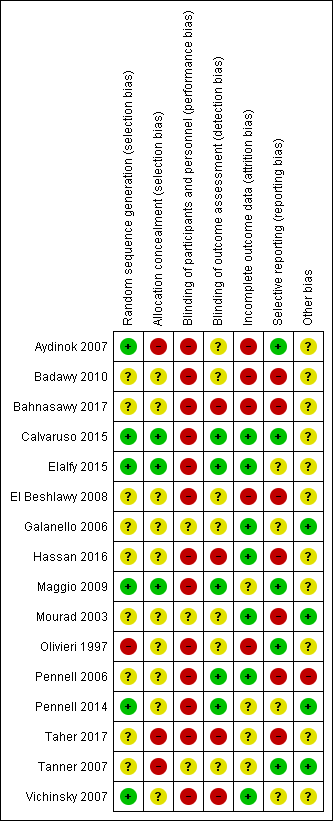
Risk of bias summary: review authors' judgements about each risk of bias item for each included study.
Allocation
Random sequence generation
We considered six trials to be at a low risk of bias for random sequence generation as randomisation was clearly described and done centrally, in permuted blocks, or computer‐generated (Aydinok 2007; Calvaruso 2015; Elalfy 2015; Maggio 2009; Pennell 2014; Vichinsky 2007).
We considered nine trials to be at an unclear risk of bias. Although one trial used permuted blocks there were several imbalances in baseline characteristics between groups (Hassan 2016). We judged the remaining eight trials to have an unclear risk of bias as there was no description of randomisation and the report only stated that participants were randomised (Badawy 2010; Bahnasawy 2017; El Beshlawy 2008; Galanello 2006; Mourad 2003; Pennell 2006; Taher 2017; Tanner 2007).
We considered one trial to be at a high risk of bias as participants were "assigned" to treatment groups by a research pharmacist and there was no description of how it was done (Olivieri 1997).
Allocation concealment (selection bias)
We considered three trials to be at low risk for selection bias as participants were allocated by telephone contact from a co‐ordinating centre (Calvaruso 2015; Elalfy 2015; Maggio 2009).
We considered 10 trials to be at an unclear risk as there was no description of how allocation was concealed (Badawy 2010; Bahnasawy 2017; El Beshlawy 2008; Galanello 2006; Hassan 2016; Mourad 2003; Olivieri 1997; Pennell 2006: Pennell 2014; Vichinsky 2007).
We considered three trials to be at a high risk for selection bias as there was no allocation concealment (Aydinok 2007; Taher 2017; Tanner 2007).
Blinding
Blinding of participants and personnel (performance bias)
We considered three trials to be at an unclear risk for performance bias as there was no description of blinding (Galanello 2006; Mourad 2003; Tanner 2007).
We considered 13 trials to be at a high risk for performance bias. Trials were either open label, did not mention blinding, or blinding was difficult due to type of treatment: a subcutaneous injection compared to an oral intervention or combination of both (Aydinok 2007; Badawy 2010; Bahnasawy 2017; El Beshlawy 2008; Calvaruso 2015; Elalfy 2015; Hassan 2016; Maggio 2009; Olivieri 1997; Pennell 2006; Pennell 2014; Taher 2017; Vichinsky 2007).
Blinding of outcome assessment (detection bias)
We considered five trials to be at a low risk of detection bias for all outcomes as data management and analysis were carried out by assessors who were blinded to interventions (Calvaruso 2015; Elalfy 2015; Maggio 2009; Pennell 2006; Pennell 2014).
We considered seven trials to be at an unclear risk of detection bias for all outcomes except mortality as there was no mention of blinding (Aydinok 2007; Badawy 2010; El Beshlawy 2008; Galanello 2006; Mourad 2003; Olivieri 1997; Tanner 2007).
We considered four trials to be at a high risk of detection bias as there was no description of blinding of outcome assessment and it appears that investigators who were not blinded were also involved in outcome assessment (Bahnasawy 2017; Hassan 2016; Taher 2017; Vichinsky 2007).
Incomplete outcome data
We considered seven trials to be at a low risk for attrition bias as all outcomes were reported and either no participants or few participants were lost to follow‐up and flow of participants was reported (Calvaruso 2015; Elalfy 2015; Galanello 2006; Hassan 2016; Mourad 2003; Pennell 2006; Vichinsky 2007).
We considered four trials to be at an unclear risk of attrition bias as there was no indication of the number of participants included in the different outcome analyses; there was substantial attrition towards the end of the trial, a per protocol analysis was conducted for some outcomes; or there was high attrition or vague reporting with no specific results (Maggio 2009; Pennell 2014; Taher 2017; Tanner 2007).
We considered the rest of the trials to be at a high risk for attrition bias as there was no data on the flow and number of participants completing the trial; no participant numbers on adverse events or compliance; no comparative data reported; per protocol analysis only; or large attrition bias in outcome analysis (Aydinok 2007; Badawy 2010; Bahnasawy 2017; El Beshlawy 2008; Olivieri 1997).
Selective reporting
We considered five trials to be at a low risk of reporting bias as all identified outcomes were reported (Aydinok 2007; Calvaruso 2015; Maggio 2009; Olivieri 1997; Tanner 2007).
We considered four trials to be at an unclear risk of reporting bias because of either: minimal reporting of participant satisfaction and compliance; or no report of compliance with DFP; or unclear and selective reporting of adverse events (Elalfy 2015; Galanello 2006; Pennell 2014; Vichinsky 2007).
We considered seven trials to be at a high risk of reporting bias due to: the incomplete reporting of adverse events or a lack of reporting of adverse events by treatment groups; or a lack of detailed or incomplete reporting of compliance and serum ferritin and LIC; or non‐reporting of some pre‐specified outcomes (Badawy 2010, Bahnasawy 2017; El Beshlawy 2008; Hassan 2016, Mourad 2003; Pennell 2006; Taher 2017).
Other potential sources of bias
We considered four trials to be at a low risk as no other potential sources of bias were identified (Galanello 2006; Mourad 2003; Pennell 2014; Tanner 2007).
We considered 11 trials to be at an unclear risk of other bias for various reasons including: baseline imbalances; abstract reports with insufficient details; no comparative numbers in control group; incomplete reporting of AEs; dose amendments after the start of the trial (Aydinok 2007; Badawy 2010; Bahnasawy 2017; Calvaruso 2015; Elalfy 2015; El Beshlawy 2008; Hassan 2016; Maggio 2009; Olivieri 1997; Taher 2017; Vichinsky 2007).
We considered one trial to be at a high risk of other sources of bias due to a serious imbalance in baseline characteristics of participants, particularly serum ferritin levels (Pennell 2006).
Effects of interventions
See: Summary of findings for the main comparison DFP compared to DFO for improving adherence to iron chelation therapy in people with sickle cell disease or thalassaemia; Summary of findings 2 DFX compared to DFO for improving adherence to iron chelation therapy in people with sickle cell disease or thalassaemia; Summary of findings 3 DFX film‐coated tablet compared to DFX dispersible tablet for improving adherence to iron chelation therapy in people with sickle cell disease or thalassaemia; Summary of findings 4 DFP and DFO compared to DFP for improving adherence to iron chelation therapy in people with sickle cell disease or thalassaemia; Summary of findings 5 DFP and DFO compared to DFO for improving adherence to iron chelation therapy in people with sickle cell disease or thalassaemia; Summary of findings 6 DFP and DFO compared to DFP and DFX for improving adherence to iron chelation therapy in people with sickle cell disease or thalassaemia; Summary of findings 7 Medication management compared to standard care for improving adherence to iron chelation therapy in people with sickle cell disease or thalassaemia
Results are presented for each of the main comparisons.
The main focus of our review is on compliance and effects of compliance (or non‐compliance) on participant outcomes. For more detailed estimates of effectiveness of different iron chelators please refer to another Cochrane Review (Fisher 2013).
One abstract of a trial that included three review comparisons (DFP versus DFO; combination DFP and DFO versus DFP; combination DFP and DFO versus DFO) did not report any outcomes by intervention group and did not include counts of events (i.e. adverse events); therefore we did not include this trial in the quantitative analysis (Badawy 2010). Thus we have included 15 trials within the quantitative analysis.
See Table 1 and also the outcomes section in the Characteristics of included studies section for summary information on results and how adherence was measured in the individual trials. Adherence rates were mostly measured by pill or vial count (either automated or manual).
| STUDY | HOW ADHERENCE MEASURED | RESULTS |
| Aydinok 2007 |
|
|
| Badawy 2010 |
|
|
| Bahnasawy 2017 |
|
|
| Calvaruso 2015 |
|
|
| El Beshlawy 2008 |
|
|
| Elalfy 2015 |
|
|
| Galanello 2006 |
|
|
| Hassan 2016 |
|
|
| Maggio 2009 |
|
|
| Mourad 2003 |
|
|
| Olivieri 1997 |
|
|
| Pennell 2006 |
|
|
| Pennell 2014 |
|
|
| Taher 2017 |
|
|
| Tanner 2007 |
|
|
| Vichinsky 2007 |
|
|
DFO: deferoxamine
DFP: deferiprone
DFX: deferasirox
DT: dispersible tablet
FCT: film‐coated tablet
SD: standard deviation
SF: serum ferritin
The quality of the evidence has been graded for those outcomes included in the summary of findings table. For the definitions of these gradings, please refer to the summary of findings tables (summary of findings Table for the main comparison; summary of findings Table 2; summary of findings Table 3; summary of findings Table 4; summary of findings Table 5; summary of findings Table 6; summary of findings Table 7).
DFP (deferiprone) alone versus DFO (deferoxamine) alone
Four trials of thalassaemia met the inclusion criteria for this comparison (Calvaruso 2015; El Beshlawy 2008; Olivieri 1997; Pennell 2006). See summary of findings Table for the main comparison.
Primary outcomes
1. Adherence to iron chelation therapy rates
We are uncertain whether oral DFP increases adherence to iron chelation therapy more than subcutaneous DFO (very low‐quality evidence). Results could not be combined due to both a lack of data to report as well as considerable heterogeneity between comparisons (I² = 99%) (Analysis 1.1). We identified the age of participants and differences in the medication regimens as possible explanations for heterogeneity. We provide a narrative review of the data on compliance below.
-
Calvaruso 2015: compliance with DFP: 85% (47 participants) versus compliance with DFO: 76% (41 participants).
-
El Beshlawy 2008: "four patients, all treated with DFO‐based regimen, were excluded from the study due to lack of compliance. Compliance was otherwise excellent during the entire study period".
-
Olivieri 1997: compliance with DFP: 94.9% ± 1.1% (19 participants) versus compliance with DFO: 71.6% ± 3.9% (18 participants).
-
Pennell 2006: compliance with DFP: 94% ± 5.3% (29 participants) versus compliance with DFO: 93% ± 9.7% (32 participants).
2. Serious adverse events (SAEs)
Two trials reported this outcome (Calvaruso 2015; Pennell 2006). One trial reported on the risk of developing agranulocytosis: we are uncertain if switching to oral DFP increases the risk of agranulocytosis compared to subcutaneous DFO, RR 7.88 (95% CI 0.18 to 352.39) (one trial; 88 participants; very low‐quality evidence) (Calvaruso 2015) (Analysis 1.2). No SAEs occurred in the second trial (Pennell 2006).
3. All‐cause mortality
Two trials reported this outcome (Calvaruso 2015; Pennell 2006). Oral DFP may have little or no difference on mortality compared to subcutaneous DFO, RR 0.44 (95% CI 0.12 to 1.63) (88 participants; one trial; low‐quality evidence) (Calvaruso 2015) (Analysis 1.3). No deaths occurred in the second trial (Pennell 2006).
Secondary outcomes
1. Sustained adherence to therapy (measured for a minimum of six months)
All trials reported more than six months follow‐up, sustained adherence is reported in the primary outcome (adherence to iron chelation therapy rates), as only end‐of‐trial adherence numbers were provided.
2. Health‐related quality of life (QoL)
No trials measured QoL.
3. Iron overload
One trial reported the proportion of participants with iron overload (Calvaruso 2015). We are uncertain if DFP reduces iron overload compared to DFO: iron levels greater or equal to 800 (µg/L), RR 1.31 (95% CI 0.49 to 3.48) (one trial; 38 participants; very low quality evidence) (Analysis 1.4).
4. Organ damage
One trial reported the proportion of participants with organ damage (Calvaruso 2015). We are uncertain if DFP increases the risk of liver damage compared to DFO, RR 4.36 (95% CI 0.53 to 35.82) (one trial; 88 participants; very low‐quality evidence) (Analysis 1.5).
5. Other adverse events (AEs) related to iron chelation
Three trials reported this outcome (Calvaruso 2015; El Beshlawy 2008; Pennell 2006). In people with thalassaemia taking DFP, we are uncertain if there is a difference in the risk of AEs compared to people taking DFO (Analysis 1.6).
-
Risk of leukopenia: RR 3.94 (99% CI 0.44 to 35.50) (three trials; 192 participants; very low‐quality evidence) (Calvaruso 2015; El Beshlawy 2008; Pennell 2006).
-
Risk of pain or swelling in joints: RR 3.38 (99% CI 0.54 to 21.31) (three trials; 192 participants; very low‐quality evidence) (Calvaruso 2015; El Beshlawy 2008; Pennell 2006).
-
Risk of nausea or vomiting: RR 13.68 (99% CI 0.99 to 188.88) (two trials; 132 participants; very low‐quality evidence) (Calvaruso 2015; El Beshlawy 2008).
-
Risk of increased liver transaminase: RR 1.10 (99% CI 0.03 to 38.47) (one trial; 44 participants; very low‐quality evidence) (El Beshlawy 2008).
-
Local reactions at infusions site: RR 0.17 (99% CI 0.00 to 9.12) (one trial; 88 participants; very low‐quality evidence) (Calvaruso 2015).
In all trials we downgraded the quality of evidence by one for risk of bias (due to high or unclear risk of bias in several domains) and in one trial we downgraded by two due to imprecision, the effect estimates have wide CIs (Calvaruso 2015).
DFX (deferasirox) alone versus DFO (deferoxamine) alone
Three trials met the inclusion criteria for this comparison; two in thalassaemia (Hassan 2016; Pennell 2014); and one in SCD (Vichinsky 2007). See summary of findings Table 2.
Primary outcomes
1. Adherence to iron chelation therapy rates
All three trials reported on this outcome. Only one trial reported data in a format that could be incorporated into the analysis (Pennell 2014). We are uncertain if DFX increases the rate of adherence compared to people taking DFO, MD ‐1.40 (95% CI ‐3.66 to 0.86) (one trial; 197 participants; very‐low quality evidence) (Analysis 2.1).
Regarding the remaining two trials:
-
Hassan 2016 stated that "throughout the study, all patients were compliant with the prescribed doses, and no discontinuation of drugs or drop‐out of follow‐up occurred."
-
Vichinsky 2007 reported that "the ratios of the administered to intended doses of therapy were high (1.16 for deferasirox and 0.97 for deferoxamine), indicating high adherence to the prescribed treatment regimens."
2. Serious adverse events (SAEs)
All three trials reported the effect on disease‐related SAEs (Hassan 2016; Pennell 2014; Vichinsky 2007); two in thalassaemia (Hassan 2016; Pennell 2014), and one in SCD (Vichinsky 2007).
We are uncertain whether DFX decreases risk of disease‐related SAEs in thalassaemia compared to DFO, RR 0.95 (95% CI 0.41 to 2.17) (two trials; 247 participants; very low‐quality evidence) (Analysis 2.2).
We are uncertain whether DFX decreases the risk of SCD‐related pain crisis, RR 1.05 (95% CI 0.68 to 1.62) (one trial; 195 participants; very low‐quality evidence); or other SCD‐related SAEs compared to DFO, RR 1.08 (95% CI 0.77 to 1.51) (one trial; 195 participants; very low‐quality evidence) (Analysis 2.2).
3. All‐cause mortality
Two trials report mortality (Hassan 2016; Pennell 2014). We are uncertain whether DFX decreases the risk of mortality in people with thalassaemia compared to DFO, RR 0.96 (95% CI 0.06 to 15.06) (two trials; 240 participants; very low‐quality evidence) (Analysis 2.3).
Secondary outcomes
1. Sustained adherence to therapy (measured for a minimum of six months)
All trials reported more than six months follow‐up, sustained adherence is reported in the primary outcome (adherence to iron chelation therapy rates), as only end‐of‐trial adherence numbers were provided.
2. Health‐related quality of life (QoL)
No trials measured quality of life.
3. Iron overload
In people with thalassaemia, we are uncertain whether DFX reduces the proportion of participants with serum ferritin of 1500 (µg/l) or higher, RR 1.18 (95% CI 0.63 to 2.20) (one trial; 60 participants; very low‐quality evidence) (Hassan 2016) (Analysis 2.4). Furthermore, we are uncertain whether DFX reduces the proportion of participants with severe LIC (15 mg Fe/g dw or higher), RR 1.00 (95% CI 0.83 to 1.20); or myocardial T2* < 10 ms, RR 1.10 (95% CI 0.72 to 1.70) (one trial; 172 participants; very low‐quality evidence)* (Pennell 2014) (Analysis 2.4).
*LIC and myocardial T2*analyses from Pennell 2014 were based on the per protocol population.
In people with SCD, Vichinsky reported LIC mean changes from baseline and no data on proportion of participants with end‐of‐trial iron overload (Vichinsky 2007).
4. Organ damage
No trial reported any other organ damage.
5. Other adverse events (AEs) related to iron chelation
In people with thalassaemia taking DFX, we are uncertain if there is a difference in the risk of iron chelation therapy‐related AEs compared to people taking DFO (Analysis 2.5).
-
Risk of total iron chelation therapy‐related AE: RR 1.15 (95% CI 0.76 to 1.73); (one trial; 187 participants; very low‐quality evidence) (Pennell 2014).
-
Risk of gastrointestinal upset: RR 3.00 (95% CI 0.66 to 13.69); (one trial; 60 participants; very low‐quality evidence) (Hassan 2016).
-
Risk of rash: RR 3.05 (95% CI 0.98 to 9.47); (two trials; 247 participants; very low‐quality evidence) (Hassan 2016; Pennell 2014).
-
Risk of increased blood creatinine: RR 3.79 (95% CI 0.83 to 17.38); (one trial;187 participants; very low‐quality evidence) (Pennell 2014).
-
Risk of proteinuria: RR 2.21 (95% CI 0.59 to 8.29); (one trial; 187 participants; very low‐quality evidence) (Pennell 2014).
-
Risk of increased ALT: RR 5.69 (95% CI 0.70 to 46.33); (one trial; 187 participants; very low‐quality evidence); (Pennell 2014).
-
Risk of increased AST: RR 5.69 (95% CI 0.70 to 46.33); (one trial; 187 participants; very low‐quality evidence); (Pennell 2014).
-
Risk of diarrhoea: RR 5.69 (95% CI 0.70 to 46.33); (one trial; 187 participant; very low‐quality evidence); (Pennell 2014).
-
Risk of vomiting: RR 6.64 (95% CI 0.35 to 126.78); (one trial; 187 participants; very low‐quality evidence); (Pennell 2014).
In people with thalassaemia, we are uncertain whether DFX reduces the incidence of total AEs as compared to DFO, RR 0.89 (95% CI 0.75 to 1.07) (one trial; 187 participants; very low‐quality evidence) (Pennell 2014) (Analysis 2.6). We downgraded the quality of evidence either by two due to high or uncertain risk of bias in several domains, or by one due to imprecision as CIs are wide and only one trial with data in comparison, or both.
In people with SCD, DFX compared to DFO, may increase slightly the risk of abdominal pain, RR 1.91(99% CI 0.80 to 4.58); the risk of diarrhoea, RR 4.14 (99% CI 0.90 to 18.92); and the risk of nausea or vomiting, RR 1.63 (99% CI 0.90 to 2.94) (one trial; 195 participants; low‐quality evidence) (Vichinsky 2007) (Analysis 2.7). We are uncertain if DFX compared to DFO increases the risk of an increase in ALT, RR 5.29 (99% CI 0.12 to 232.98) or the risk of pain or swelling in joints, RR 1.06 (99% CI 0.41 to 2.76) (one trial; 195 participants; very low‐quality evidence) (Vichinsky 2007) (Analysis 2.7). We downgraded the quality of evidence either by two due to high or uncertain risk of bias in several domains, or by one due to imprecision as CIs are wide and only one trial with data in comparison, or both.
DFX film‐coated Tablet (FCT) versus DFX (deferasirox) dispersible tablet (DT)
One trial in thalassaemia met the inclusion criteria for this comparison (Taher 2017). See summary of findings Table 3.
Primary outcomes
Adherence to iron chelation therapy rates
DFX FCT may have little or no difference on adherence as compared to DFX DT, RR 1.10 (95% CI 0.99 to 1.22) (one trial; 173 participants; low‐quality evidence) (Analysis 3.1).
Serious adverse events (SAEs)
We are uncertain if DFX FCT increases SAEs as compared to DFX DT, RR 1.22 (95% CI 0.62 to 2.37) (one trial; 173 participants; very low‐quality evidence) (Analysis 3.2).
All‐cause mortality
We are uncertain if DFX FCT increases all‐cause mortality as compared to DFX DT, RR 2.97 (95% CI 0.12 to 71.81) (one trial; 173 participants; very low‐quality evidence) (Analysis 3.3).
Secondary outcomes
1. Sustained adherence to therapy
This trial reported more than six months follow‐up, sustained adherence is reported in the primary outcome (adherence to iron chelation therapy rates), as only end of trial adherence numbers were provided.
2. Health‐related quality of life (QoL)
This outcome was not measured with a validated instrument.
3. Iron overload
The trial did not report the proportion of participants with iron overload at the end of the trial.
4. Organ damage
We are uncertain if DFX FCT increases the incidence of renal events as compared to DFX DT, RR 1.25 ( 95% CI 0.83 to 1.91) (one trial; 173 participants; very low‐quality evidence) (Analysis 3.4).
5. Other adverse events (AEs) related to iron chelation
DFX FCT, compared to DFX DT, may improve slightly the incidence of all chelation‐related AEs, RR 0.75 (99% CI 0.52 to 1.08); and the incidence of vomiting, RR 0.28 (99% CI 0.07 to 1.15) (one trial; 173 participants; low‐quality evidence) (Analysis 3.5).
We are uncertain if DFX FCT, compared to DFX DT, improves: the risk of diarrhoea, RR 0.70 (99% CI 0.29 to 1.70); the incidence of abdominal pain, RR 0.49 (99% CI 0.16 to 1.52); the incidence of nausea, RR 0.72 (99% CI 0.23 to 2.23) or increases urine protein/urine creatinine ratio, RR 1.65 (99% CI 0.60 to 4.54) (one trial; 173 participants; very low‐quality evidence) (Analysis 3.5).
We downgraded the quality of evidence by either two for risk of bias due to high or unclear risk of bias in all domains or by one for imprecision due to wide confidence intervals, or both.
DFP (deferiprone) and DFO (deferoxamine) combination therapy versus DFP (deferiprone) alone
Three trials in thalassaemia met the inclusion criteria for this comparison (Aydinok 2007; El Beshlawy 2008; Maggio 2009). See summary of findings Table 4.
Primary outcomes
1. Adherence to iron chelation therapy rates
All trials reported on this outcome. We are uncertain if DFP and DFO increases adherence compared to DFP alone (very low‐quality evidence).
-
Aydinok 2007: "Compliance was generally excellent during the entire study period. There was only one patient in the DFP treatment arm who missed more than one chelation dose per week because of problems with swallowing."
-
El Beshlawy 2008: "four patients, all treated with DFO‐based regimen, were excluded from the study due to lack of compliance. Compliance was otherwise excellent during the entire study period."
-
Maggio 2009: "In the sequential DFP–DFO group, compliance was 92.7% (SD ± 15.2%; range 37–100%) with DFP treatment and 70.6% (SD ± 24.1%; range 25–100%) with DFO treatment (105 participants). Compliance with DFP was 93.6% (SD ± 9.7%; range 56–100%) in the DFP‐alone patients (108 participants)."
2. Serious adverse events (SAEs)
Only one trial reported this outcome (Maggio 2009). In people with thalassaemia, combination therapy with DFP and DFO may have little or no difference on the incidence of SAEs as compared to DFP alone, RR 0.15 ( 95% CI 0.01 to 2.81) (one trial; 213 participants; low‐quality evidence) (Maggio 2009) (Analysis 4.1).
3. All‐cause mortality
Two trials reported on this outcome (Aydinok 2007; Maggio 2009). We are uncertain if combination therapy with DFP and DFO decreases mortality as compared to DFP alone, RR 0.77 (95% CI 0.18 to 3.35) (two trials; 237 participants; very low‐quality evidence) (Analysis 4.2).
Secondary outcomes
1. Sustained adherence to therapy
Sustained adherence is reported under the primary outcome (adherence to iron chelation rates), as all trials are longer than six months and end‐of‐trial adherence is reported.
2. Health‐related quality of life (QoL)
One trial assessed QoL, but did not use a validated questionnaire (Aydinok 2007).
3. Iron overload
No trial reported the proportion of participants with iron overload.
4. Organ damage
No trial reported the proportion of participants with organ damage.
5. Other adverse events (AEs) related to iron chelation
All three trials reported AEs. We are uncertain if combination DFP and DFO reduces the incidence of adverse events compared to DFP alone in people with thalassaemia (Analysis 4.3).
-
Risk of leukopenia, neutropenia or agranulocytosis (or a combination of): RR 1.15 (99% CI 0.50 to 2.62) (three trials; 280 participants; very low‐quality evidence) (Aydinok 2007; El Beshlawy 2008; Maggio 2009).
-
Risk of pain or swelling in joints: RR 0.76 (99% CI 0.31 to 1.91) (two trials; 256 participants; very low‐quality evidence) (El Beshlawy 2008; Maggio 2009).
-
Risk of increased liver transaminase: RR 1.02 (99% CI 0.52 to 1.98) (two trials; 256 participants; very low‐quality evidence) (El Beshlawy 2008; Maggio 2009).
-
Risk of nausea or vomiting: RR 0.55 (99% CI 0.13 to 2.23) (one trial; 43 participants; very low‐quality evidence) (El Beshlawy 2008).
One trial reported on this outcome (Maggio 2009). Combination therapy with DFP and DFO may have little or no difference on the risk of gastrointestinal disorders as compare to DFP alone: RR 0.45 (95% CI 0.15 to 1.37) (one trial; 213 participants; low‐quality evidence) (Analysis 4.3).
We downgraded the quality of evidence by either two for risk of bias due to high or unclear risk of bias in several domains in all trials, or by one due to imprecision, the effect estimates have wide confidence intervals, or both.
DFP (deferiprone) and DFO (deferoxamine) combination therapy versus DFO (deferoxamine) alone
Four trials in thalassaemia met the inclusion criteria for this comparison (El Beshlawy 2008; Galanello 2006; Mourad 2003; Tanner 2007). See summary of findings Table 5.
Primary outcomes
1. Adherence to iron chelation therapy rates
In people with thalassaemia, combined therapy with DFP and DFO versus DFO alone, may have little or no difference in adherence rates (low‐quality evidence). We could not combine any data for an effect estimate.
-
El Beshlawy 2008: "four patients, all treated with DFO‐based regimen, were excluded from the study due to lack of compliance. Compliance was otherwise excellent during the entire study period".
-
Galanello 2006: DFP/DFO: DFO: 96.1 ±5.0 (29 participants); DFP compliance was not reported; DFO: 95.7 ± 5.7 (30 participants).
-
Mourad 2003: "In patients receiving the combined therapy, compliance was excellent (arbitrarily defined as taking > 90% of the recommended doses) in 10 patients and good (75% to 90% of recommended doses) in one patient, as assessed by the patient’s history, parental evidence and usage of tablets provided in just sufficient quantities between check‐up visits. In patients receiving DFX alone, compliance was considered to be excellent in 11 patients and good in three patients, as assessed mainly by counting the vials given to, and returned by, the patients".
-
Tanner 2007: "Compliance with deferoxamine was similar in both groups (combined 91.4 ± 2.7% versus deferoxamine 92.6 ± 2.7%; P = 0.7). Compliance with deferiprone was less than compliance with placebo (82.4 ± 18.1% versus 89.8 ± 7.2%; P = 0.04)".
2. Serious adverse events (SAEs)
Three trials reported SAEs (Galanello 2006; Mourad 2003; Tanner 2007). In people with thalassaemia, combined therapy with DFP and DFO versus DFO alone, may have little or no difference in SAEs (low‐quality evidence). No SAEs occurred in the three trials.
3. All‐cause mortality
Only one trial reported on this outcome and no deaths occurred (Tanner 2007). Combined therapy with DFP and DFO versus DFO alone, may have little or no difference in morality (one trial; 65 participants; low‐quality evidence).
Secondary outcome
1. Sustained adherence to therapy
All trials reported more than six months follow‐up, sustained adherence is reported in the primary outcome (adherence to iron chelation therapy rates), as only end‐of‐trial adherence numbers were provided.
2. Health‐related quality of life (QoL)
No trials measured QoL.
3. Iron overload
No trials reported the proportion of participants with iron overload.
4. Organ damage
No trials reported the proportion of participants with organ damage.
5. Other adverse events (AEs) related to iron chelation
All four trials reported some AEs. We are uncertain if DFP combined with DFO reduces other chelation‐related AEs compared to DFO alone in people with thalassaemia (Analysis 5.1).
-
Risk of leukopenia, neutropenia or agranulocytosis (or a combination of): RR 1.18 (99% CI 0.09 to 15.37) (three trials; 169 participants; very low‐quality evidence) (El Beshlawy 2008; Galanello 2006; Tanner 2007).
-
Risk of pain or swelling in joints: RR 2.39 (99% CI 0.18 to 32.31) (three trials; 135 participants; very low‐quality evidence I² = 66%) (El Beshlawy 2008; Mourad 2003; Tanner 2007).
-
Risk of increased liver transaminase: RR 3.46 (99% CI 0.45 to 26.62) (two trials; 104 participants; very low‐quality evidence) (El Beshlawy 2008; Galanello 2006).
-
Risk of nausea or vomiting: RR 3.81 (99% CI 0.84 to 17.36) (four trials; 194 participants; very low‐quality evidence) (El Beshlawy 2008; Galanello 2006; Mourad 2003; Tanner 2007).
-
Risk of local reactions at infusion site: RR 0.18 (99% CI 0.01 to 3.56) (two trials; 90 participants; very low‐quality evidence) (Mourad 2003; Tanner 2007).
We downgraded the quality of evidence by two for risk of bias due to high or unclear risk of bias in several domains in all trials and by one due to imprecision, the effect estimates have wide CIs.
Combination DFP (deferiprone) and DFO (deferoxamine) versus combination DFP (deferiprone) and DFX (deferasirox)
One trial in thalassaemia met the inclusion criteria for this comparison (Elalfy 2015). See summary of findings Table 6.
Primary outcomes
1. Adherence to iron chelation therapy rates
In children with thalassaemia, combination therapy with DFP and DFX may improve adherence to iron chelation therapy compared to combination therapy with DFP and DFO, RR 0.84 (95% CI 0.72 to 0.99) (one trial; 96 participants; low‐quality evidence) (Analysis 6.1).
2. Serious adverse events (SAEs)
In children with thalassaemia, we are uncertain if combination therapy with DFP and DFX decreases the incidence of SAEs compared to combination therapy with DFP and DFO, RR 1.00 (95% CI 0.06 to 15.53) (one trial; 96 participants; very low‐quality evidence) (Analysis 6.2).
3. All‐cause mortality
In children with thalassaemia, combination therapy with DFP and DFX may make little or no difference in mortality compared to combination therapy with DFP and DFO. There were no deaths in the trial (one trial; 96 participants; low‐quality evidence).
Secondary outcomes
1. Sustained adherence to therapy
The trial reported more than six months follow‐up, sustained adherence is reported in the primary outcome (adherence to iron chelation therapy rates), as only end‐of‐trial adherence numbers were provided.
2. Health‐related quality of life (QoL)
In children with thalassaemia we are unclear if combination therapy with DFP and DFX improves QoL compared to combination therapy with DFP and DFO (very low‐quality evidence). Authors state that "significant improvement in quality of life was observed in both groups at study end compared to baseline"; no comparative data were provided.
3. Iron overload
Proportion of participants with iron overload was not reported.
4. Organ damage
In children with thalassaemia, combination therapy with DFP and DFX as compared to DFP and DFO may have little or no difference in the incidence of increased creatinine, RR 3.00 (99% CI 0.16 to 56.04) (one trial; 96 participants; low‐quality evidence) (Analysis 6.4).
5. Other adverse events (AEs) related to iron chelation
In children with thalassaemia, we are unclear if combination therapy with DFP and DFX as compared to DFP and DFO reduces the incidence of AEs (one trial; 96 participants; very low‐quality evidence) (Analysis 6.5).
-
Total drug‐related AEs: RR 1.08 (99% CI 0.68 to 1.71).
-
Risk of leukopenia, neutropenia, or agranulocytosis: RR 1.67 (99% CI 0.27 to 10.14).
-
Risk of pain or swelling in joints: RR 0.89 (99% CI 0.29 to 2.77).
-
Gastrointestinal problems: RR 0.60 (99% CI 0.18 to 2.04).
-
Liver transaminase increased: RR 1.33 (99% CI 0.20 to 8.88).
-
Skin rash: RR 5.00 (99% CI 0.10 to 261.34).
We downgraded the quality of evidence by one for risk of bias as there was a high or unclear risk of bias in three domains; by one for indirectness, as the trial was conducted in children aged 10 to 18 with years with severe iron overload; and by one due to imprecision, the effect estimates have wide CIs.
Medication management versus standard care
One trial in thalassaemia met the inclusion criteria for this comparison (Bahnasawy 2017). See summary of findings Table 7.
Primary outcomes
1. Adherence to iron chelation therapy rates
Adherence was only reported in the intervention group and not in the control group.
2. Serious adverse events (SAEs)
SAEs were not reported.
3. All‐cause mortality
All‐cause mortality was not reported.
Secondary outcomes
1. Sustained adherence to therapy
Adherence was only reported in the intervention group and not in the control group.
2. Health‐related quality of life (QoL)
We are uncertain if medication management improves health‐related QoL: PedsQLTM HRQoL total score median (IQR): test group: 63.51 (51.75 to 84.54); control group: 49.84 (41.9 to 60.81) (one trial; 48 participants; very low‐quality evidence).
3. Iron overload
Proportion of participants with iron overload was not reported.
4. Organ damage
Proportion of participants with organ damage was not reported.
5. Other adverse events (AEs) related to iron chelation
AEs were not reported.
Discussion
Regularly transfused people with SCD, as well as transfusion‐dependent, and non‐transfusion‐dependent people with thalassaemia, are at risk of iron overload. Iron overload can lead to iron toxicity, with organs such as the heart, liver and endocrine glands being particularly vulnerable.
In this review we reviewed the evidence for improving adherence to iron chelation therapy in people with SCD or thalassaemia.
Sixteen RCTs with a total of 1525 participants met our inclusion criteria. Fourteen trials included people with β‐thalassaemia major, one trial was conducted in people with SCD and another in people with β‐thalassaemia intermedia, a milder form of β‐thalassaemia. Trials were conducted between 1997 and 2017 and all included trials were medication interventions, except for one, which was a medication management intervention.
We also identified an additional five ongoing RCTs, and two studies awaiting classification (one RCT and one prospective cohort study).
We did not identify any cluster randomised trials, NRSIs, CBA or ITS studies that met the inclusion criteria.
Summary of main results
The findings of the review led to the following main conclusions regarding medication interventions to improve adherence to iron chelation.
DFP versus DFO
Based on results from four trials in thalassaemia, we are uncertain whether oral DFP increases adherence to iron chelation therapy more than subcutaneous DFO (Calvaruso 2015; El Beshlawy 2008; Olivieri 1997; Pennell 2006). Results could not be combined due to a lack of data to report as well as the considerable heterogeneity between comparisons (I² = 99%). There was high adherence in all trials. We are uncertain if switching to oral DFP increases the risk of agranulocytosis compared to subcutaneous DFO. Oral DFP may have little or no effect on mortality compared to subcutaneous DFO. Quality of life was not measured in any trial in this comparison.
DFX versus DFO
Based on results from three trials, two in thalassaemia (Hassan 2016; Pennell 2014) and one in SCD (Vichinsky 2007), we are uncertain if DFX increases the rate of adherence compared to people taking DFO; participants had high adherence in all trials. We are uncertain whether DFX decreases risk of thalassaemia‐related SAEs or decreases the risk of mortality in people with thalassaemia compared to DFO. We are uncertain whether DFX decreases the risk of SCD‐related pain crisis or other SCD‐related SAEs compared to DFO. QoL was not reported in any trial in this comparison.
DFX (film‐coated tablet (FCT)) versus DFX (dispersible tablet (DT))
Based on results from a single trial in thalassaemia, DFX FCT may make little or no difference to adherence as compared to DFX DT (Taher 2017). There was high adherence in both arms of the trial. We are uncertain if DFX FCT increases SAEs or all‐cause mortality as compared to DFX DT. QoL was not measured using a validated instrument.
DFP and DFO combined versus DFP alone
Based on results from three trials in thalassaemia, we are uncertain if DFP and DFO combined increases adherence compared to DFP alone (Aydinok 2007; El Beshlawy 2008; Maggio 2009). There was high adherence in all trials. Combination therapy with DFP and DFO may make little or no difference to the incidence of SAEs as compared to DFP alone. We are uncertain if combination therapy with DFP and DFO decreases mortality as compared to DFP alone. QoL was not measured using a validated instrument.
DFP and DFO combined versus DFO alone
Based on results from four trials in people with thalassaemia, combined therapy with DFP and DFO versus DFO alone, may make little or no difference to adherence rates, SAEs, or mortality (El Beshlawy 2008; Galanello 2006; Mourad 2003; Tanner 2007). There was high adherence in all trials. QoL was not measured in any trial in this comparison.
DFP and DFO combined versus DFP and DFX combined
Based on the results of a single trial in children with thalassaemia, combination therapy with DFP and DFX may improve adherence to iron chelation therapy compared to combination therapy with DFP and DFO (Elalfy 2015). There was high adherence in both arms. We are uncertain if DFP and DFX reduces the incidence of SAEs, and may make little or no difference in mortality or QoL, compared to combination therapy with DFP and DFO.
Medication management versus standard care
A single trial on thalassaemia reported on this comparison (Bahnasawy 2017). Adherence rates were only reported in the intervention arm and therefore there are no comparative data to report. We are uncertain if medication management improves health‐related QoL.
Overall completeness and applicability of evidence
This review provides the most up‐to‐date assessment of interventions to improve adherence to iron chelation therapy in people with SCD and thalassaemia. We have also identified five ongoing trials and two trials that are awaiting classification.
Of the five ongoing trials, two compare medication interventions in thalassaemia and two in SCD and thalassaemia (EudraCT 2012‐000353‐31; IRCT2015101218603N2; NCT02173951; NCT02435212), and one assesses the effectiveness of group medical appointments on self‐efficacy and adherence in SCD (Madderom 2016). Of the two studies awaiting classification, one is an educational study (Antmen 2013), and one is a medication intervention (NCT00004982).
The results of this review can only be interpreted in consideration of the following factors.
-
Adherence is not the primary outcome in any of the included trials.
-
All trials, except for one medication management trial, are medication interventions and participants were often selected based on their anticipated compliance. Lack of adherence was a reason for exclusion from some trials or analyses of results.
-
Within the context of a clinical trial, there is increased attention by, and involvement of, clinicians and specialist nurses with participants which may impact and increase rates of adherence not seen in a community setting.
-
Research has shown that up to 50% of people do not take medications as prescribed and over 85% of people are occasionally non‐adherent to prescribed medications (Ryan 2014). The reported adherence rates in the trials included in this review are substantially higher than average, despite the substantial side effects and demanding administration regimen of iron chelators. This may be indicative of high adherence rates being an artefact created by participant involvement in a clinical trial.
-
We did not identify any cluster randomised trials, NRSIs, CBA or ITS studies with adherence as a primary outcome, that met the inclusion criteria.
-
Due to a lack of evidence this review cannot comment on intervention strategies for different age groups.
Quality of the evidence
Overall the quality of the evidence according to GRADE methodology across all comparisons for the outcomes of adherence, SAEs, and mortality was rated as low to very low (summary of findings Table for the main comparison; summary of findings Table 2; summary of findings Table 3; summary of findings Table 4; summary of findings Table 5; summary of findings Table 6; summary of findings Table 7). This was due to trials being at serious or very serious risk of bias; outcome estimates being imprecise (wide CIs); and indirectness with some trials conducted only in children of a specific age and meeting specific criteria. QoL was mostly not reported or reported using non‐validated measurements or sparsely reported with no data.
Potential biases in the review process
To our knowledge, our review process was free from bias. We conducted a comprehensive search: searching data sources (including multiple databases, and clinical trial registries) to ensure that all relevant studies would be captured. There were no restrictions for the language in which the paper was originally published. The relevance of each paper was carefully assessed and all screening and data extractions were performed in duplicate. We pre‐specified all outcomes and subgroups prior to analysis. There were insufficient numbers of included trials within the meta‐analyses for us to use a funnel plot to examine the risk of publication bias.
Agreements and disagreements with other studies or reviews
Adherence rates can vary widely, a recent review reported that adherence rates to the oral iron chelator DFX ranged between 22% and 89% (Loiselle 2016). Another review of medication adherence in SCD reports adherence rates ranging from 16% to 89%; but most included studies reported moderate adherences (Walsh 2014). In this Cochrane Review, we found adherence rates across trials and for all comparisons of different chelators to be quite high in individual trial reports (predominantly at least 80%). Indeed the results of this review are in disagreement with most literature that identifies major issues with compliance across indications, people and setting (NICE 2009; Ryan 2014; WHO 2003). We suggest that selection bias for compliance into the chelation trials as a possible reason for high adherence; as well, the additional time and attention received by participants make high adherence an artefact of trial participation.
Ryan identifies several strategies that may help to promote adherence including self‐management; self‐monitoring; simplified dosing regimens; or interventions involving pharmacists in medication management (Ryan 2014). Other identified interventions that need further research include pragmatic interventions (such as reminders); educational interventions, and financial incentives. One RCT on pharmacist‐led medication management was included in this review, but the trial had few participants, was of short duration and poorly reported (Bahnasawy 2017). The remaining trials in this review measured compliance primarily as a secondary outcome and did not identify any specific strategies that may have led to increased compliance, thus supporting the contention that high compliance is an artefact of participation in these trials and not the result of change or improvement in medication regimens.

Study flow diagram.
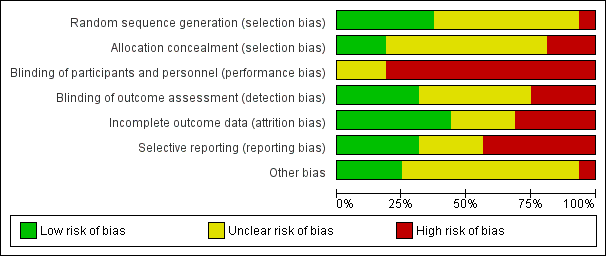
Risk of bias graph: review authors' judgements about each risk of bias item presented as percentages across all included studies.

Risk of bias summary: review authors' judgements about each risk of bias item for each included study.
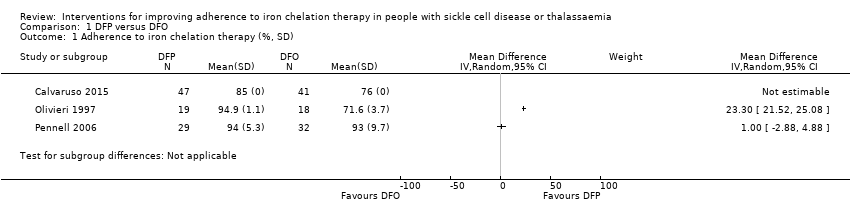
Comparison 1 DFP versus DFO, Outcome 1 Adherence to iron chelation therapy (%, SD).

Comparison 1 DFP versus DFO, Outcome 2 SAEs (from therapy, disease, non‐adherence).
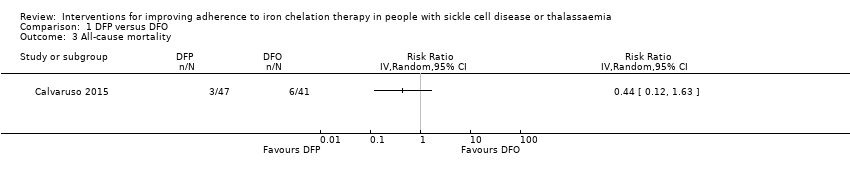
Comparison 1 DFP versus DFO, Outcome 3 All‐cause mortality.
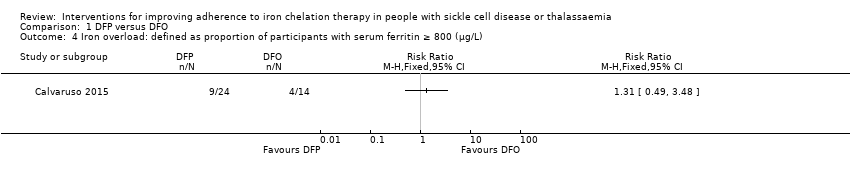
Comparison 1 DFP versus DFO, Outcome 4 Iron overload: defined as proportion of participants with serum ferritin ≥ 800 (µg/L).

Comparison 1 DFP versus DFO, Outcome 5 Organ damage.
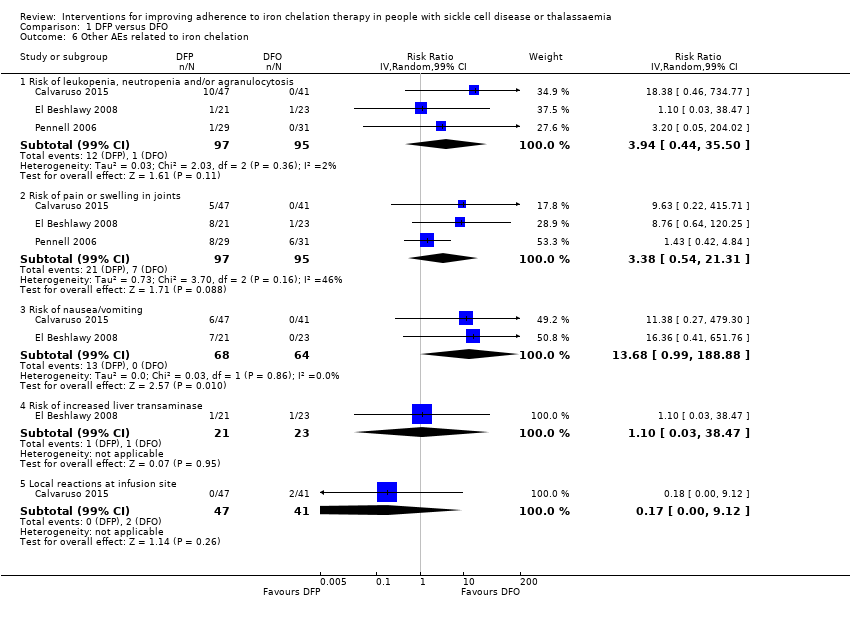
Comparison 1 DFP versus DFO, Outcome 6 Other AEs related to iron chelation.

Comparison 2 DFX versus DFO, Outcome 1 Adherence to iron chelation therapy (%, SD).

Comparison 2 DFX versus DFO, Outcome 2 SAEs.
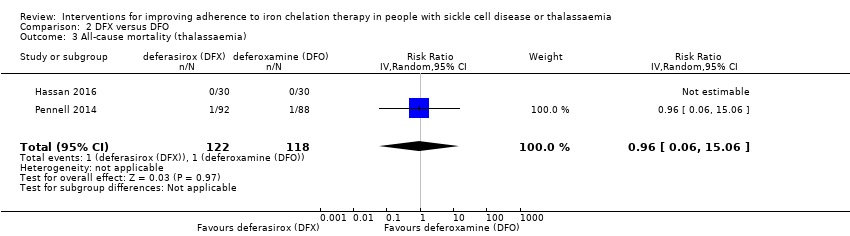
Comparison 2 DFX versus DFO, Outcome 3 All‐cause mortality (thalassaemia).
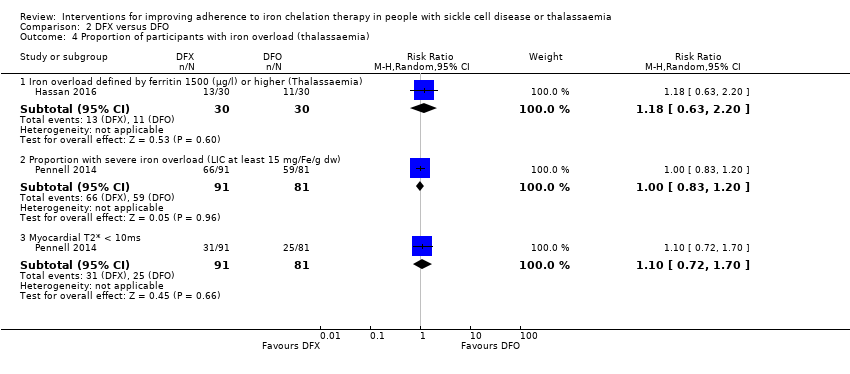
Comparison 2 DFX versus DFO, Outcome 4 Proportion of participants with iron overload (thalassaemia).
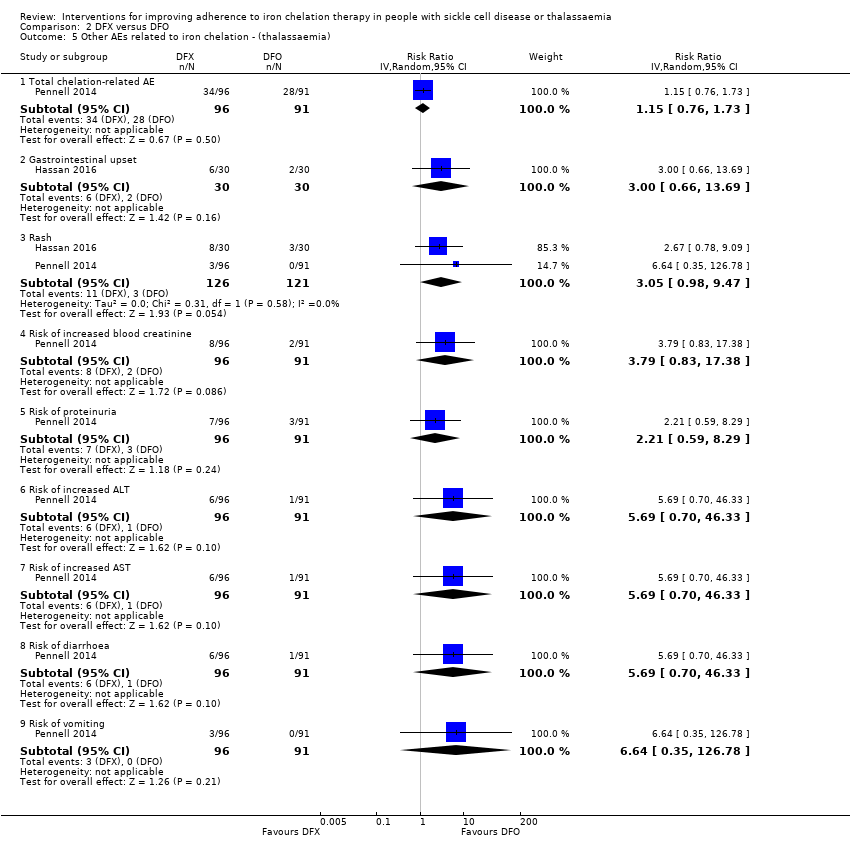
Comparison 2 DFX versus DFO, Outcome 5 Other AEs related to iron chelation ‐ (thalassaemia).

Comparison 2 DFX versus DFO, Outcome 6 Total AEs (thalassaemia).

Comparison 2 DFX versus DFO, Outcome 7 Other AEs related to iron chelation (SCD).

Comparison 3 DFX film‐coated tablet versus DFX dispersible tablet, Outcome 1 Adherence to iron chelation therapy.

Comparison 3 DFX film‐coated tablet versus DFX dispersible tablet, Outcome 2 Incidence of SAEs.
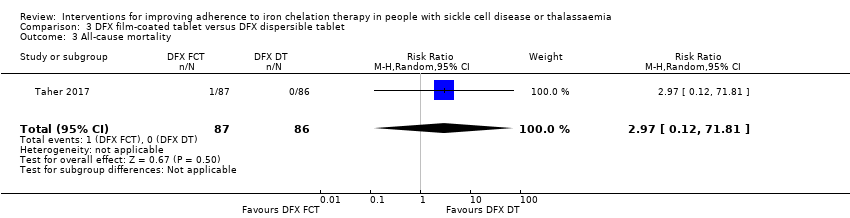
Comparison 3 DFX film‐coated tablet versus DFX dispersible tablet, Outcome 3 All‐cause mortality.
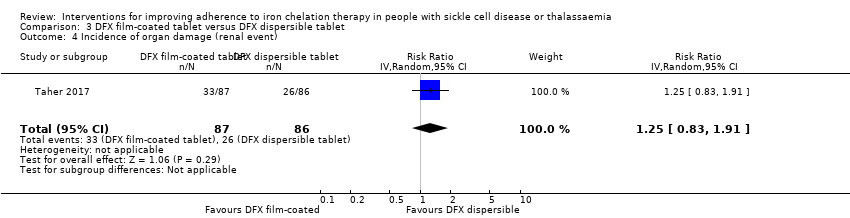
Comparison 3 DFX film‐coated tablet versus DFX dispersible tablet, Outcome 4 Incidence of organ damage (renal event).

Comparison 3 DFX film‐coated tablet versus DFX dispersible tablet, Outcome 5 Other AEs related to iron chelation.

Comparison 4 DFP and DFO versus DFP, Outcome 1 Incidence of SAEs.

Comparison 4 DFP and DFO versus DFP, Outcome 2 All‐cause mortality.

Comparison 4 DFP and DFO versus DFP, Outcome 3 Incidence of chelation therapy‐related AEs.
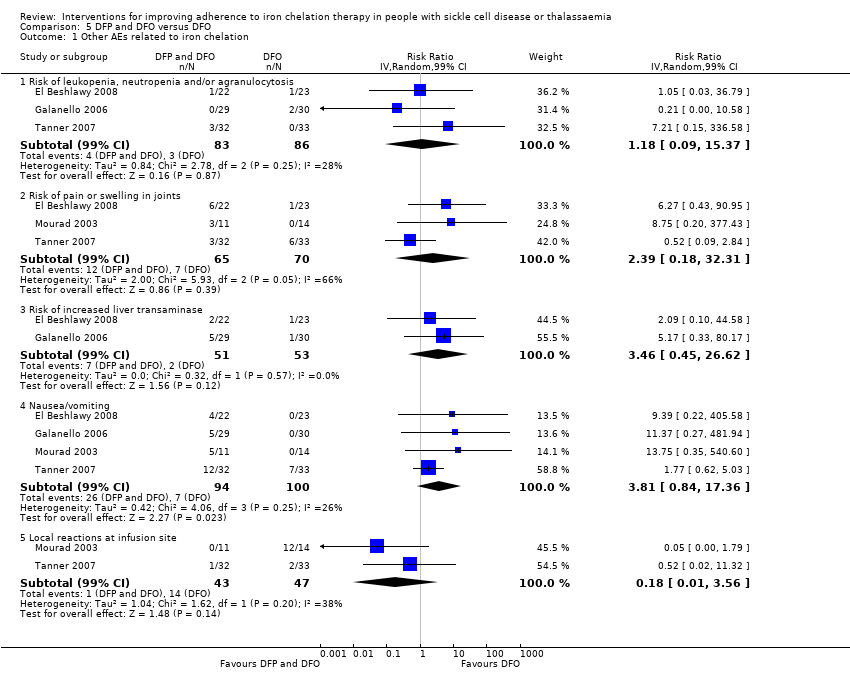
Comparison 5 DFP and DFO versus DFO, Outcome 1 Other AEs related to iron chelation.
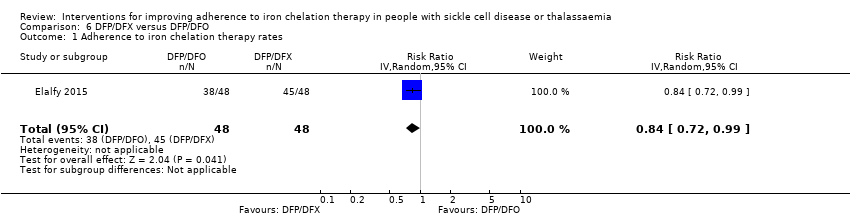
Comparison 6 DFP/DFX versus DFP/DFO, Outcome 1 Adherence to iron chelation therapy rates.

Comparison 6 DFP/DFX versus DFP/DFO, Outcome 2 Incidence of SAE.

Comparison 6 DFP/DFX versus DFP/DFO, Outcome 3 All‐cause mortality.

Comparison 6 DFP/DFX versus DFP/DFO, Outcome 4 Organ damage (serum creatinine (≥33%) above baseline in 2 consecutive occasions).

Comparison 6 DFP/DFX versus DFP/DFO, Outcome 5 Other AEs related to iron chelation.
| DFP compared to DFO for improving adherence to iron chelation therapy in people with sickle cell disease or thalassaemia | ||||||
| Patient or population: improving adherence to iron chelation therapy in people with sickle cell disease or thalassaemia | ||||||
| Outcomes | Anticipated absolute effects* (95% CI) | Relative effect | № of participants | Certainty of the evidence | Comments | |
| Risk with DFO | Risk with DFP | |||||
| Adherence to iron chelation therapy (per cent, SD) | ‐ | 242 (4 RCTs) | ⊕⊝⊝⊝ | We found considerable heterogeneity and identified age as possible cause: 1 trial in children 10 years or older and 1 conducted in participants 18 or older | ||
| SAEs (from therapy, disease, non‐adherence) Agranulocytosis** | Study population | RR 7.88 | 88 | ⊕⊝⊝⊝ | No SAEs were reported in the second trial reporting this outcome | |
| 15 per 1000 | 118 per 1,000 (7 to 1000) | |||||
| All‐cause mortality | Study population | RR 0.44 | 88 | ⊕⊝⊝⊝ | No deaths occurred in the second trial reporting this outcome | |
| 146 per 1000 | 64 per 1000 | |||||
| Sustained adherence ‐ not measured | ‐ | ‐ | ‐ | ‐ | ‐ | Sustained adherence is reported as adherence as all trials were longer than 6 months and only end of trial adherence numbers were provided |
| Quality of life ‐ not reported | ‐ | ‐ | ‐ | ‐ | ‐ | |
| *The risk in the intervention group (and its 95% confidence interval) is based on the assumed risk in the comparison group and the relative effect of the intervention (and its 95% CI). | ||||||
| GRADE Working Group grades of evidence | ||||||
| 1 We downgraded the quality of evidence by 1 for risk of bias due to high or uncertain risk of bias due to lack of blinding of participants and personnel in all four RCTs, as well as selection bias (Olivieri 1997), attrition bias (El Beshlawy 2008; Olivieri 1997), reporting bias (El Beshlawy 2008; Pennell 2006), and other bias (Pennell 2006). ** Risk estimate based on: Tricta F, Uetrecht J, Galanello R, et al. Deferiprone‐induced agranulocytosis: 20 years of clinical observations. American Journal of Hematology. 2016;91(10):1026‐1031. doi:10.1002/ajh.24479. | ||||||
| DFX compared to DFO for improving adherence to iron chelation therapy in people with sickle cell disease or thalassaemia | ||||||
| Patient or population: improving adherence to iron chelation therapy in people with sickle cell disease or thalassaemia | ||||||
| Outcomes | Anticipated absolute effects* (95% CI) | Relative effect | № of participants | Certainty of the evidence | Comments | |
| Risk with DFO | Risk with DFX | |||||
| Adherence to iron chelation therapy (per cent, SD) | The mean adherence to iron chelation therapy (per cent, SD) was 0 | MD 1.4 lower | ‐ | 197 | ⊕⊝⊝⊝ | Narrative report of adherence for 2 trials as either no or incompatible data to enable comparisons |
| SAEs ‐ thalassaemia‐related SAEs | Study population | ‐ | 247 | ⊕⊝⊝⊝ | There were no SAEs to report in one trial so no estimate of effect | |
| see comment | see comment | |||||
| SAEs ‐ SCD‐related SAEs | Study population | RR 1.08 | 195 | ⊕⊝⊝⊝ | ||
| 429 per 1000 | 463 per 1000 | |||||
| Incidence of SCD‐related SAEs ‐pain crisis | Study population | RR 1.05 | 195 | ⊕⊝⊝⊝ | ||
| 317 per 1000 | 333 per 1000 | |||||
| All‐cause mortality (thalassaemia) | Study population | RR 0.96 | 240 | ⊕⊝⊝⊝ | ||
| 8 per 1000 | 8 per 1000 | |||||
| Sustained adherence ‐ not measured | ‐ | ‐ | ‐ | ‐ | ‐ | Sustained adherence is reported as adherence as all trials were longer than 6 months and only end of trial adherence reported |
| Quality of life ‐ not reported | ‐ | ‐ | ‐ | ‐ | ‐ | |
| *The risk in the intervention group (and its 95% CI) is based on the assumed risk in the comparison group and the relative effect of the intervention (and its 95% CI). | ||||||
| GRADE Working Group grades of evidence | ||||||
| 1 We downgraded the quality of evidence by 2 due to high or uncertain risk of bias in several domains | ||||||
| DFX film‐coated tablet compared to DFX dispersible tablet for improving adherence to iron chelation therapy in people with sickle cell disease or thalassaemia | ||||||
| Patient or population: improving adherence to iron chelation therapy in people with sickle cell disease or thalassaemia | ||||||
| Outcomes | Anticipated absolute effects* (95% CI) | Relative effect | № of participants | Certainty of the evidence | Comments | |
| Risk with DFX dispersible tablet | Risk with DFX film‐coated tablet | |||||
| Adherence to iron chelation therapy (n, N) | Study population | RR 1.10 | 173 | ⊕⊕⊝⊝ | ||
| 849 per 1000 | 934 per 1000 | |||||
| Incidence of SAEs | Study population | RR 1.22 | 173 | ⊕⊝⊝⊝ | ||
| 151 per 1,000 | 184 per 1000 | |||||
| All‐cause mortality | Study population | RR 2.97 | 173 | ⊕⊝⊝⊝ | ||
| 0 per 1000 | 0 per 1000 | |||||
| Sustained adherence ‐ not measured | ‐ | ‐ | ‐ | ‐ | ‐ | Reported as adherence as trial was 6 months in duration and end of trial adherence reported |
| Quality of life ‐ not reported | ‐ | ‐ | ‐ | ‐ | ‐ | |
| *The risk in the intervention group (and its 95% confidence interval) is based on the assumed risk in the comparison group and the relative effect of the intervention (and its 95% CI). | ||||||
| GRADE Working Group grades of evidence | ||||||
| 1 We downgraded the quality of evidence by 2 for risk of bias due to high or unclear risk of bias in all domains | ||||||
| DFP and DFO compared to DFP for improving adherence to iron chelation therapy in people with sickle cell disease or thalassaemia | ||||||
| Patient or population: improving adherence to iron chelation therapy in people with sickle cell disease or thalassaemia | ||||||
| Outcomes | Anticipated absolute effects* (95% CI) | Relative effect | № of participants | Certainty of the evidence | Comments | |
| Risk with DFP | Risk with DFP and DFO | |||||
| Adherence to iron chelation therapy (per cent, SD) | see comment | see comment | ‐ | 289 (3 RCTs) | ⊕⊝⊝⊝ | Reported as narrative as no comparisons possible |
| Incidence of SAEs | Study population | RR 0.15 | 213 | ⊕⊕⊝⊝ | ||
| 28 per 1,000 | 4 per 1,000 | |||||
| All‐cause mortality | Study population | RR 0.77 | 237 | ⊕⊝⊝⊝ | ||
| 33 per 1,000 | 26 per 1,000 | |||||
| Sustained adherence ‐ not measured | ‐ | ‐ | ‐ | ‐ | ‐ | Sustained adherence is reported as adherence as trial duration longer than 6 months and reports adherence for length of trial |
| Quality of life ‐ not reported | ‐ | ‐ | ‐ | ‐ | ‐ | Quality of life was either not reported or no validated instruments were used |
| *The risk in the intervention group (and its 95% confidence interval) is based on the assumed risk in the comparison group and the relative effect of the intervention (and its 95% CI). | ||||||
| GRADE Working Group grades of evidence | ||||||
| 1 We downgraded the quality of evidence by 2 for risk of bias as there was high or uncertain risk of bias in most domains in 3 out of 4 trials | ||||||
| DFP and DFO compared to DFO for improving adherence to iron chelation therapy in people with sickle cell disease or thalassaemia | ||||||
| Patient or population: improving adherence to iron chelation therapy in people with sickle cell disease or thalassaemia | ||||||
| Outcomes | Anticipated absolute effects* (95% CI) | Relative effect | № of participants | Certainty of the evidence | Comments | |
| Risk with DFO | Risk with DFP and DFO | |||||
| Adherence to iron chelation therapy (per cent, SD) | see comment | see comment | ‐ | 205 (4 RCTs) | ⊕⊕⊝⊝ | Reported as narrative only as adherence in combined group not reported for combination therapy |
| Incidence of SAEs | Study population | ‐ | 205 (4 RCTs) | ⊕⊕⊝⊝ | 3 trials report no SAEs; SAES are not reported in one trial | |
| see comment | see comment | |||||
| All‐cause mortality | Study population | ‐ | 205 (4 RCTs) | ⊕⊕⊝⊝ | no deaths reported | |
| see comment | see comment | |||||
| Sustained adherence ‐ not measured | ‐ | ‐ | ‐ | ‐ | ‐ | Sustained adherence reported as adherence as trial duration was longer than 6 months and adherence reported at end of trial |
| Quality of life ‐ not reported | ‐ | ‐ | ‐ | ‐ | ‐ | |
| *The risk in the intervention group (and its 95% CI) is based on the assumed risk in the comparison group and the relative effect of the intervention (and its 95% CI). | ||||||
| GRADE Working Group grades of evidence | ||||||
| 1 We downgraded the quality of evidence by 2 for risk of bias as high or unclear risk of bias in all domains | ||||||
| DFP/DFO compared to DFP/DFX for improving adherence to iron chelation therapy in people with sickle cell disease or thalassaemia | ||||||
| Patient or population: improving adherence to iron chelation therapy in people with sickle cell disease or thalassaemia | ||||||
| Outcomes | Anticipated absolute effects* (95% CI) | Relative effect | № of participants | Certainty of the evidence | Comments | |
| Risk with DFP/DFX | Risk with DFP/DFO | |||||
| Adherence to iron chelation therapy rates (n,N) ‐ 1 year | Study population | RR 0.84 | 96 | ⊕⊕⊝⊝ | ||
| 938 per 1000 | 788 per 1000 | |||||
| Incidence of SAE | Study population | RR 1.00 | 96 | ⊕⊝⊝⊝ | ||
| 21 per 1,000 | 21 per 1000 | |||||
| All‐cause mortality ‐ at 1 year ‐ trial end | Study population | Not estimable | 96 | ⊕⊕⊝⊝ | No deaths were reported | |
| 0 per 1000 | 0 per 1000 | |||||
| Sustained adherence ‐ not measured | ‐ | ‐ | ‐ | ‐ | ‐ | Sustained adherence is reported as adherence as trial was 1 year in duration and end of trial adherence reported |
| Quality of life see comment | ‐ | ‐ | ‐ | ‐ | ‐ | The study uses SF36 to measure quality of life, the results are presented as a graph. Quality of life increased in both trial arms with no significant difference between trial arms P = 0.860 |
| *The risk in the intervention group (and its 95% confidence interval) is based on the assumed risk in the comparison group and the relative effect of the intervention (and its 95% CI). | ||||||
| GRADE Working Group grades of evidence | ||||||
| 1 We downgraded the quality of evidence by 1 for risk of bias as there was high or unclear risk of bias in 3 domains | ||||||
| Medication management compared to standard care for improving adherence to iron chelation therapy in people with sickle cell disease or thalassaemia | ||||||
| Patient or population: improving adherence to iron chelation therapy in people with sickle cell disease or thalassaemia | ||||||
| Outcomes | Anticipated absolute effects* (95% CI) | Relative effect | № of participants | Certainty of the evidence | Comments | |
| Risk with standard care | Risk with medication management | |||||
| Adherence to iron chelation therapy ‐ not reported | ‐ | ‐ | ‐ | Adherence was only reported in the intervention group and therefore no comparative data | ||
| SAEs ‐ not reported | ‐ | ‐ | ‐ | ‐ | ‐ | |
| Mortality ‐ not reported | ‐ | ‐ | ‐ | ‐ | ‐ | |
| Sustained adherence | ‐ | ‐ | ‐ | ‐ | ‐ | Adherence was only reported in the intervention group and therefore no comparative data |
| Quality of life | ‐ | 48 | ⊕⊝⊝⊝ | Medication management: 63.51 (51.75 – 84.54); standard care: 49.84 (41.9 – 60.81) | ||
| *The risk in the intervention group (and its 95% confidence interval) is based on the assumed risk in the comparison group and the relative effect of the intervention (and its 95% CI). | ||||||
| GRADE Working Group grades of evidence | ||||||
| 1 We downgraded the quality of evidence for indirectness by 2 because most outcomes were only reported in the medication management group | ||||||
| STUDY | HOW ADHERENCE MEASURED | RESULTS |
| Aydinok 2007 |
|
|
| Badawy 2010 |
|
|
| Bahnasawy 2017 |
|
|
| Calvaruso 2015 |
|
|
| El Beshlawy 2008 |
|
|
| Elalfy 2015 |
|
|
| Galanello 2006 |
|
|
| Hassan 2016 |
|
|
| Maggio 2009 |
|
|
| Mourad 2003 |
|
|
| Olivieri 1997 |
|
|
| Pennell 2006 |
|
|
| Pennell 2014 |
|
|
| Taher 2017 |
|
|
| Tanner 2007 |
|
|
| Vichinsky 2007 |
|
|
| DFO: deferoxamine | ||
| Outcome or subgroup title | No. of studies | No. of participants | Statistical method | Effect size |
| 1 Adherence to iron chelation therapy (%, SD) Show forest plot | 3 | Mean Difference (IV, Random, 95% CI) | Subtotals only | |
| 2 SAEs (from therapy, disease, non‐adherence) Show forest plot | 1 | Risk Ratio (M‐H, Random, 99% CI) | Totals not selected | |
| 2.1 Agranulocytosis | 1 | Risk Ratio (M‐H, Random, 99% CI) | 0.0 [0.0, 0.0] | |
| 3 All‐cause mortality Show forest plot | 1 | Risk Ratio (IV, Random, 95% CI) | Totals not selected | |
| 4 Iron overload: defined as proportion of participants with serum ferritin ≥ 800 (µg/L) Show forest plot | 1 | Risk Ratio (M‐H, Fixed, 95% CI) | Totals not selected | |
| 5 Organ damage Show forest plot | 1 | Risk Ratio (M‐H, Random, 95% CI) | Totals not selected | |
| 5.1 Liver damage | 1 | Risk Ratio (M‐H, Random, 95% CI) | 0.0 [0.0, 0.0] | |
| 6 Other AEs related to iron chelation Show forest plot | 3 | Risk Ratio (IV, Random, 99% CI) | Subtotals only | |
| 6.1 Risk of leukopenia, neutropenia and/or agranulocytosis | 3 | 192 | Risk Ratio (IV, Random, 99% CI) | 3.94 [0.44, 35.50] |
| 6.2 Risk of pain or swelling in joints | 3 | 192 | Risk Ratio (IV, Random, 99% CI) | 3.38 [0.54, 21.31] |
| 6.3 Risk of nausea/vomiting | 2 | 132 | Risk Ratio (IV, Random, 99% CI) | 13.68 [0.99, 188.88] |
| 6.4 Risk of increased liver transaminase | 1 | 44 | Risk Ratio (IV, Random, 99% CI) | 1.10 [0.03, 38.47] |
| 6.5 Local reactions at infusion site | 1 | 88 | Risk Ratio (IV, Random, 99% CI) | 0.17 [0.00, 9.12] |
| Outcome or subgroup title | No. of studies | No. of participants | Statistical method | Effect size |
| 1 Adherence to iron chelation therapy (%, SD) Show forest plot | 1 | Mean Difference (IV, Random, 95% CI) | Totals not selected | |
| 2 SAEs Show forest plot | 3 | Risk Ratio (M‐H, Random, 95% CI) | Totals not selected | |
| 2.1 Thalassaemia‐related SAEs | 2 | Risk Ratio (M‐H, Random, 95% CI) | 0.0 [0.0, 0.0] | |
| 2.2 SCD‐related SAE ‐ painful crisis | 1 | Risk Ratio (M‐H, Random, 95% CI) | 0.0 [0.0, 0.0] | |
| 2.3 SCD‐related SAEs ‐ other SCD‐related SAEs | 1 | Risk Ratio (M‐H, Random, 95% CI) | 0.0 [0.0, 0.0] | |
| 3 All‐cause mortality (thalassaemia) Show forest plot | 2 | 240 | Risk Ratio (IV, Random, 95% CI) | 0.96 [0.06, 15.06] |
| 4 Proportion of participants with iron overload (thalassaemia) Show forest plot | 2 | Risk Ratio (M‐H, Random, 95% CI) | Subtotals only | |
| 4.1 Iron overload defined by ferritin 1500 (µg/l) or higher (Thalassaemia) | 1 | 60 | Risk Ratio (M‐H, Random, 95% CI) | 1.18 [0.63, 2.20] |
| 4.2 Proportion with severe iron overload (LIC at least 15 mg/Fe/g dw) | 1 | 172 | Risk Ratio (M‐H, Random, 95% CI) | 1.00 [0.83, 1.20] |
| 4.3 Myocardial T2* < 10ms | 1 | 172 | Risk Ratio (M‐H, Random, 95% CI) | 1.10 [0.72, 1.70] |
| 5 Other AEs related to iron chelation ‐ (thalassaemia) Show forest plot | 2 | Risk Ratio (IV, Random, 95% CI) | Subtotals only | |
| 5.1 Total chelation‐related AE | 1 | 187 | Risk Ratio (IV, Random, 95% CI) | 1.15 [0.76, 1.73] |
| 5.2 Gastrointestinal upset | 1 | 60 | Risk Ratio (IV, Random, 95% CI) | 3.0 [0.66, 13.69] |
| 5.3 Rash | 2 | 247 | Risk Ratio (IV, Random, 95% CI) | 3.05 [0.98, 9.47] |
| 5.4 Risk of increased blood creatinine | 1 | 187 | Risk Ratio (IV, Random, 95% CI) | 3.79 [0.83, 17.38] |
| 5.5 Risk of proteinuria | 1 | 187 | Risk Ratio (IV, Random, 95% CI) | 2.21 [0.59, 8.29] |
| 5.6 Risk of increased ALT | 1 | 187 | Risk Ratio (IV, Random, 95% CI) | 5.69 [0.70, 46.33] |
| 5.7 Risk of increased AST | 1 | 187 | Risk Ratio (IV, Random, 95% CI) | 5.69 [0.70, 46.33] |
| 5.8 Risk of diarrhoea | 1 | 187 | Risk Ratio (IV, Random, 95% CI) | 5.69 [0.70, 46.33] |
| 5.9 Risk of vomiting | 1 | 187 | Risk Ratio (IV, Random, 95% CI) | 6.64 [0.35, 126.78] |
| 6 Total AEs (thalassaemia) Show forest plot | 1 | Risk Ratio (IV, Random, 95% CI) | Totals not selected | |
| 7 Other AEs related to iron chelation (SCD) Show forest plot | 1 | Risk Ratio (M‐H, Random, 99% CI) | Subtotals only | |
| 7.1 Risk of increased ALT | 1 | 195 | Risk Ratio (M‐H, Random, 99% CI) | 5.29 [0.12, 232.98] |
| 7.2 incidence of abdominal pain | 1 | 195 | Risk Ratio (M‐H, Random, 99% CI) | 1.91 [0.80, 4.58] |
| 7.3 Risk of pain or swelling in joints | 1 | 195 | Risk Ratio (M‐H, Random, 99% CI) | 1.06 [0.41, 2.76] |
| 7.4 Risk of diarrhoea | 1 | 195 | Risk Ratio (M‐H, Random, 99% CI) | 4.14 [0.90, 18.92] |
| 7.5 Nausea/vomiting | 1 | 195 | Risk Ratio (M‐H, Random, 99% CI) | 1.63 [0.90, 2.94] |
| Outcome or subgroup title | No. of studies | No. of participants | Statistical method | Effect size |
| 1 Adherence to iron chelation therapy Show forest plot | 1 | 173 | Risk Ratio (M‐H, Random, 95% CI) | 1.10 [0.99, 1.22] |
| 2 Incidence of SAEs Show forest plot | 1 | 173 | Risk Ratio (IV, Random, 95% CI) | 1.22 [0.62, 2.37] |
| 3 All‐cause mortality Show forest plot | 1 | 173 | Risk Ratio (M‐H, Random, 95% CI) | 2.97 [0.12, 71.81] |
| 4 Incidence of organ damage (renal event) Show forest plot | 1 | 173 | Risk Ratio (IV, Random, 95% CI) | 1.25 [0.83, 1.91] |
| 5 Other AEs related to iron chelation Show forest plot | 1 | Risk Ratio (IV, Random, 99% CI) | Subtotals only | |
| 5.1 Total chelation‐related AEs | 1 | 173 | Risk Ratio (IV, Random, 99% CI) | 0.75 [0.52, 1.08] |
| 5.2 Risk of diarrhoea | 1 | 173 | Risk Ratio (IV, Random, 99% CI) | 0.70 [0.29, 1.70] |
| 5.3 Increased urine protein/urine creatinine ratio | 1 | 173 | Risk Ratio (IV, Random, 99% CI) | 1.65 [0.60, 4.54] |
| 5.4 incidence of abdominal pain | 1 | 173 | Risk Ratio (IV, Random, 99% CI) | 0.49 [0.16, 1.52] |
| 5.5 Incidence of nausea | 1 | 173 | Risk Ratio (IV, Random, 99% CI) | 0.72 [0.23, 2.23] |
| 5.6 Incidence of vomiting | 1 | 173 | Risk Ratio (IV, Random, 99% CI) | 0.28 [0.07, 1.15] |
| Outcome or subgroup title | No. of studies | No. of participants | Statistical method | Effect size |
| 1 Incidence of SAEs Show forest plot | 1 | 213 | Risk Ratio (M‐H, Random, 95% CI) | 0.15 [0.01, 2.81] |
| 2 All‐cause mortality Show forest plot | 2 | 237 | Risk Ratio (IV, Random, 95% CI) | 0.77 [0.18, 3.35] |
| 3 Incidence of chelation therapy‐related AEs Show forest plot | 3 | Risk Ratio (IV, Random, 99% CI) | Subtotals only | |
| 3.1 Risk of leukopenia, neutropenia and/or agranulocytosis | 3 | 280 | Risk Ratio (IV, Random, 99% CI) | 1.15 [0.50, 2.62] |
| 3.2 Risk of pain or swelling in joints | 2 | 256 | Risk Ratio (IV, Random, 99% CI) | 0.76 [0.31, 1.91] |
| 3.3 Risk of gastrointestinal disturbances | 1 | 213 | Risk Ratio (IV, Random, 99% CI) | 0.45 [0.15, 1.37] |
| 3.4 Risk of increased liver transaminase | 2 | 256 | Risk Ratio (IV, Random, 99% CI) | 1.02 [0.52, 1.98] |
| 3.5 Nausea/vomiting | 1 | 43 | Risk Ratio (IV, Random, 99% CI) | 0.55 [0.13, 2.23] |
| Outcome or subgroup title | No. of studies | No. of participants | Statistical method | Effect size |
| 1 Other AEs related to iron chelation Show forest plot | 4 | Risk Ratio (IV, Random, 99% CI) | Subtotals only | |
| 1.1 Risk of leukopenia, neutropenia and/or agranulocytosis | 3 | 169 | Risk Ratio (IV, Random, 99% CI) | 1.18 [0.09, 15.37] |
| 1.2 Risk of pain or swelling in joints | 3 | 135 | Risk Ratio (IV, Random, 99% CI) | 2.39 [0.18, 32.31] |
| 1.3 Risk of increased liver transaminase | 2 | 104 | Risk Ratio (IV, Random, 99% CI) | 3.46 [0.45, 26.62] |
| 1.4 Nausea/vomiting | 4 | 194 | Risk Ratio (IV, Random, 99% CI) | 3.81 [0.84, 17.36] |
| 1.5 Local reactions at infusion site | 2 | 90 | Risk Ratio (IV, Random, 99% CI) | 0.18 [0.01, 3.56] |
| Outcome or subgroup title | No. of studies | No. of participants | Statistical method | Effect size |
| 1 Adherence to iron chelation therapy rates Show forest plot | 1 | 96 | Risk Ratio (IV, Random, 95% CI) | 0.84 [0.72, 0.99] |
| 2 Incidence of SAE Show forest plot | 1 | 96 | Risk Ratio (M‐H, Random, 95% CI) | 1.0 [0.06, 15.53] |
| 3 All‐cause mortality Show forest plot | 1 | Risk Ratio (IV, Random, 95% CI) | Totals not selected | |
| 4 Organ damage (serum creatinine (≥33%) above baseline in 2 consecutive occasions) Show forest plot | 1 | 96 | Risk Ratio (M‐H, Random, 99% CI) | 3.0 [0.16, 56.04] |
| 5 Other AEs related to iron chelation Show forest plot | 1 | Risk Ratio (IV, Random, 99% CI) | Subtotals only | |
| 5.1 one year (study end) | 1 | 96 | Risk Ratio (IV, Random, 99% CI) | 1.08 [0.68, 1.71] |
| 5.2 Risk of leukopenia, neutropenia and/or agranulocytosis | 1 | 96 | Risk Ratio (IV, Random, 99% CI) | 1.67 [0.27, 10.14] |
| 5.3 Risk of pain or swelling in joints | 1 | 96 | Risk Ratio (IV, Random, 99% CI) | 0.89 [0.29, 2.77] |
| 5.4 Gastrointestinal problems | 1 | 96 | Risk Ratio (IV, Random, 99% CI) | 0.6 [0.18, 2.04] |
| 5.5 ALT (increase ≥3 folds) | 1 | 96 | Risk Ratio (IV, Random, 99% CI) | 1.33 [0.20, 8.88] |
| 5.6 Skin rash | 1 | 96 | Risk Ratio (IV, Random, 99% CI) | 5.0 [0.10, 261.34] |