Scolaris Content Display Scolaris Content Display

Study flow diagram.
Figuras y tablas -
Figure 1

Study flow diagram.

Risk of bias summary: review authors' judgements about each risk of bias item for each included study.
Figuras y tablas -
Figure 2

Risk of bias summary: review authors' judgements about each risk of bias item for each included study.

Comparison 1 Peer‐led vs control, Outcome 1 Change in asthma‐related quality of life (PAQLQ).
Figuras y tablas -
Analysis 1.1

Comparison 1 Peer‐led vs control, Outcome 1 Change in asthma‐related quality of life (PAQLQ).

Comparison 1 Peer‐led vs control, Outcome 2 Asthma‐related quality of life (MCID).
Figuras y tablas -
Analysis 1.2

Comparison 1 Peer‐led vs control, Outcome 2 Asthma‐related quality of life (MCID).

Comparison 1 Peer‐led vs control, Outcome 3 Asthma control.
Figuras y tablas -
Analysis 1.3

Comparison 1 Peer‐led vs control, Outcome 3 Asthma control.

Comparison 1 Peer‐led vs control, Outcome 4 Smoking.
Figuras y tablas -
Analysis 1.4

Comparison 1 Peer‐led vs control, Outcome 4 Smoking.

Lay‐led and peer support interventions compared with usual care for adolescents with asthma

Patient or population: adolescents with asthma

Settings: school, day camp or primary care

Intervention: lay‐led and peer support interventions

Comparison: usual care/no intervention

Outcomes

Illustrative comparative risks* (95% CI)

Number of participants
(studies)

Quality of the evidence
(GRADE)

Comments

Assumed risk

Corresponding risk

Usual care/no intervention

Lay‐led or peer support intervention

Asthma‐related quality of life (PAQLQ)

1 to 7 scale; higher = better

3 to 9 months

Mean change in control groups was 0.05

Mean change in intervention groups was
0.40 better (0.02 worse to 0.81 better)

578
(3 RCTs)

⊕⊕⊝⊝
LOWa,b

Asthma‐related quality of life (MCID)

8 months

123 per 1000

248 per 1000
(145 to 390)

251
(1 RCT)

⊕⊕⊝⊝
LOWa,c,d

Asthma control

Scale (range, score) ACT (5‐23) and ACQ (4‐16)

4 to 9 months

Not pooled. Two studies reported 2 different measures. Both effects favoured peer support, but neither result was statistically significant

166
(2 RCTs)

⊕⊕⊝⊝
LOWa,e

Unscheduled visits

9 months

Somewhat fewer mean visits per person in the intervention group than in the control group, but the data are skewed and are difficult to interpret

84
(1 RCT)

Not graded

Medication adherence

2.5 months

Skewed data reported non‐parametrically. Low baseline adherence (˜ 26%), which dropped further in both groups after the intervention, although it was less in the intervention group

68

(1 RCT)

Not graded

Adherence to ICS was measured objectively with a dose counter
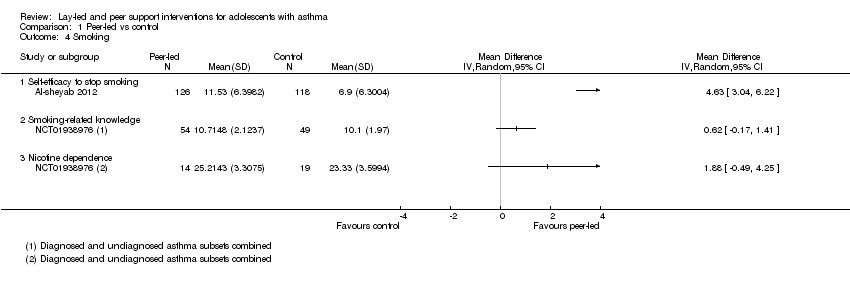
Smoking

3 to 4 months

Mean self‐efficacy to stop smoking score in control group was 6.9

Mean score in intervention groups was 4.63 better (3.04 to 6.22 better)

244
(1 RCT)

⊕⊕⊝⊝
LOWa,e

SANDS subscale

Range 0 to 16

Mean smoking‐related knowledge score in control group was 10.1

Mean score in intervention groups was 0.62 better (‐0.17 worse to 1.41 better)

103
(1 RCT)

Modified Tar‐Wars scale

Range 0 to 13

Mean nicotine dependence score in control group was 23.3

Mean score in intervention groups was 1.88 better (‐0.49 worse to 4.25 better)

33
(1 RCT)

SANDS total

Range 0 to 32

Adverse events

No reports of adverse events, although only specifically mentioned in 1 study

Not graded

*The basis for the assumed risk (e.g. median control group risk across studies) is provided in footnotes. The corresponding risk (and its 95% confidence interval) is based on assumed risk in the comparison group and the relative effect of the intervention (and its 95% CI).
ACQ: asthma control questionnaire; ACT: asthma control test; CI: confidence interval; ICS: inhaled corticosteroid; MCID: minimal clinically important difference; PAQLQ: Paediatric Asthma Quality of Life Questionnaire; RCT: randomised controlled trial; RR: risk ratio; SANDS: Self‐Administered Nicotine Dependence Scale.

GRADE Working Group grades of evidence.

High quality: We are very confident that the true effect lies close to the estimate of effect.
Moderate quality: We are moderately confident in the effect estimate: The true effect is likely to be close to the estimate of effect but may be substantially different.
Low quality: Our confidence in the effect estimate is limited: The true effect may be substantially different from the estimate of effect.
Very low quality: We have very little confidence in the effect estimate: The true effect is likely to be substantially different from the estimate of effect.

aDowngraded for risk of bias. Outcome measured on a self‐rated scale. Likely to be affected by both performance and detection biases.

bDowngraded for inconsistency (I2 = 71%). Random‐effects analysis used as planned, resulting in wide confidence intervals that just cross the line of no effect. Sensitivy analysis with a fixed‐effect model showed much tighter CIs around a mean difference of 0.16 (0.06 to 0.26). Not downgraded for imprecision.

cConfidence intervals favour the intervention, but the effect is based on one study of 251 people (downgraded for imprecision).

dTwo other studies reported the measure but did not plan a responder analysis (not downgraded for publication bias).

eDowngraded for imprecision. Point estimates favoured the intervention, but lower confidence limits do not rule out possible harm.

Figuras y tablas -
Table 1. Summary of included studies

Study ID

Design

Observation

Age range, years

N

Intervention

Comparison

Country

Al‐sheyab 2012

Cluster OL

3 months

14 to 16

261 (4 clusters)

Triple A programme

No intervention

Jordan

NCT01938976

Cluster OL

4 months

12 to 13

433 (4 clusters)

Triple A programme + smoking pledge

Triple A programme alone

Jordan

NCT01169883

Individual OL

2.5 months

11 to 16

68

Peer support + mp3 messaging

Attention control

USA

NCT01161225

Individual SB

9 months

13 to 17

112

Peer‐led asthma camp

Adult‐led asthma camp

USA

Shah 2001

Cluster OL

8 months

12 to 16

272 (6 clusters)

Triple A programme

No intervention

Australia

OL = open‐label; SB: single‐blind.

Other details such as mean age, healthcare setting, measures of asthma severity, frequency and duration of sessions and baseline social support are described in the text (Included studies).

Figuras y tablas -
Table 1. Summary of included studies
Comparison 1. Peer‐led vs control

Outcome or subgroup title

No. of studies

No. of participants

Statistical method

Effect size

1 Change in asthma‐related quality of life (PAQLQ) Show forest plot

3

Mean Difference (Random, 95% CI)

0.40 [‐0.02, 0.81]

2 Asthma‐related quality of life (MCID) Show forest plot

1

Odds Ratio (M‐H, Random, 95% CI)

Totals not selected

3 Asthma control Show forest plot

2

Mean Difference (IV, Random, 95% CI)

Totals not selected

4 Smoking Show forest plot

2

Mean Difference (IV, Random, 95% CI)

Totals not selected

4.1 Self‐efficacy to stop smoking

1

Mean Difference (IV, Random, 95% CI)

0.0 [0.0, 0.0]

4.2 Smoking‐related knowledge

1

Mean Difference (IV, Random, 95% CI)

0.0 [0.0, 0.0]

4.3 Nicotine dependence

1

Mean Difference (IV, Random, 95% CI)

0.0 [0.0, 0.0]

Figuras y tablas -
Comparison 1. Peer‐led vs control