Nutrición enteral versus nutrición parenteral y enteral versus una combinación de nutrición enteral y parenteral para adultos en la unidad de cuidados intensivos
Referencias
Referencias de los estudios incluidos en esta revisión
Referencias de los estudios excluidos de esta revisión
Referencias de los estudios en espera de evaluación
Referencias de los estudios en curso
Referencias adicionales
Referencias de otras versiones publicadas de esta revisión
Characteristics of studies
Characteristics of included studies [ordered by study ID]
| Methods | RCT, 2‐arm, parallel design | |
| Participants | Total number of randomized participants: 80 Inclusion criteria
Exclusion criteria
Baseline characteristics No details reported in abstract Country: not reported (published in Croatian journal) Setting: ICU | |
| Interventions | EN group n = 40 Details: nutritional requirements based on Harris‐Benedict equation. Formula consisted of fat, carbohydrate, and protein. Identical to PN group PN group n = 40 Details: nutritional requirements based on Harris‐Benedict equation. Formula consisted of fat, carbohydrate, and protein. Identical to EN group | |
| Outcomes |
| |
| Notes | Funding/declarations of interest: not reported Study dates: not reported We were unable to source the full‐text of this study, and did not have the study authors' contact details to attempt contact. | |
| Risk of bias | ||
| Bias | Authors' judgement | Support for judgement |
| Random sequence generation (selection bias) | Unclear risk | No details. Abstract only |
| Allocation concealment (selection bias) | Unclear risk | No details. Abstract only |
| Blinding of participants and personnel (performance bias) | High risk | No details. Abstract only. We assumed investigators made no attempts to blind personnel |
| Blinding of outcome assessment (detection bias) | Unclear risk | No details. Abstract only |
| Blinding of outcome assessment (detection bias) | Low risk | No details. Abstract only. Lack of blinding unlikely to influence outcome data for mortality |
| Incomplete outcome data (attrition bias) | Low risk | No details. Abstract only. Outcome data were well reported and we assumed there were no losses |
| Selective reporting (reporting bias) | Unclear risk | No details. Abstract only |
| Baseline characteristics | Unclear risk | Study authors described participants as matched on SAPS II, age, and primary diagnoses. No baseline characteristics tables or additional detail available |
| Other bias | Unclear risk | Study authors described nutritional formula of both groups as identical. Insufficient detail in abstract to make judgement on other sources of bias |
| Methods | RCT, single‐centre, 2‐arm, parallel design | |
| Participants | Total number of randomized participants: 20 Inclusion criteria
Exclusion criteria
Primary diagnoses
Baseline characteristics EN group
EN + PN group
Country: Iran Setting: ICU | |
| Interventions | EN group n = 10; 0 losses Details: nasogastric tube feeding for 7 days. Feeding formula was Fresubin Original (Fresenius Kabi, Germany) given in solution as 1 kcal/mL. Average 70 kg participant initially received 50 mL every 3 hours, increased with 50 mL increments to maximum 300 mL every 3 hours at rate of 100 mL/h. GRV threshold at 300 mL with delay of feeding for 3 hours if threshold was reached. Glycaemic management not reported. EN + PN group n = 10; loss of 1 participant on day 3 (move to different hospital); number analysed assumed to be 9. Details: EN as above. PN consisted of 500 mL of 10% AA solutions (B Braun, Germany), 500 mL of 50% dextrose, infused over 24 hours. Equivalent management of GRV. Duration of feeding for 7 days | |
| Outcomes |
| |
| Notes | Funding/declarations of interest: partly supported by grant from Tehran University of Medical Sciences Study dates: November 2007 to May 2009 | |
| Risk of bias | ||
| Bias | Authors' judgement | Support for judgement |
| Random sequence generation (selection bias) | Unclear risk | Described as randomized but no additional details |
| Allocation concealment (selection bias) | Unclear risk | No details |
| Blinding of participants and personnel (performance bias) | High risk | No details and we assumed investigators made no attempts to blind personnel |
| Blinding of outcome assessment (detection bias) | Low risk | No details. Lack of blinding unlikely to influence outcome data for mortality |
| Incomplete outcome data (attrition bias) | Low risk | |
| Incomplete outcome data (attrition bias) | Low risk | 1 participant moved to another hospital after 3 days, not clear whether data for this participant were sourced but small loss unlikely to influence outcome data |
| Selective reporting (reporting bias) | Unclear risk | No protocol or clinical trials registration reported. Therefore, not feasible to make judgement on selective outcome reporting bias |
| Baseline characteristics | Low risk | Appeared to be equivalent between groups |
| Other bias | Low risk | Glycaemic management equivalent for each group. No other sources of bias identified |
| Methods | RCT, single‐centre, 2‐arm, parallel design | |
| Participants | Total number of randomized participants: 46 Inclusion criteria
Exclusion criteria
Primary diagnoses
Baseline characteristics EN group
PN group
Country: USA Setting: medical centre | |
| Interventions | EN group n = 23; 0 losses; 4 participants required conversion to PN; assume ITT analysis Details: jejunostomy tube placement. Feeding started on first postoperative day. Feeding assumed to be for duration of study period (14 days). Target rate changed during study as participants in both groups appeared to have insufficient nitrogen balance; Phase 1: target rate calculated as Harris‐Benedict BEE x 1.68, Phase 2: target rate calculated as Harris‐Benedict BEE x 2.0 plus an additional 20%. Formula consisted of polymeric feeding solution (5 participants received Isocal HCN: 15% protein calories, 45% carbohydrate calories, 49% lipid calories. 18 participants received Traumacal: 22% protein calories, 40% carbohydrate calories, 48% lipid calories) (Mead Johnson Nutritional Division, Evansville, IN, USA). Participants given insulin to manage blood glucose levels. Metabolic or gastrointestinal intolerances were treated by physician as required. Caloric intake received, mean: Phase 1: 2088 calories; Phase 2: 2678 calories PN group n = 23; 0 losses Details: subclavian line placement. Feeding started on first postoperative day, assumed duration of study period (14 days). Phase 1: target rate calculated as Harris‐Benedict BEE x 1.68, Phase 2: target rate calculated as Harris‐Benedict BEE x 2.0. Formula consisted of 25% dextrose, 4.25% crystalline AAs (Travasol: Baxter Healthcare Corporation, Deerfield, IL, USA). Additional caloric prescriptions of 500 mL of 10% lipid, twice weekly, were optional. 50 mL per hour for first 24 hours, then advanced as tolerated at physician's discretion. Caloric intake received, mean: Phase I: 2572 calories; Phase 2: 2876 | |
| Outcomes |
| |
| Notes | Funding/declarations of interest: supported, in part, by a grant from Mead Johnson Nutritional Division, Evansville, IN, USA Study dates: January 1982 to June 1984 | |
| Risk of bias | ||
| Bias | Authors' judgement | Support for judgement |
| Random sequence generation (selection bias) | Unclear risk | Randomized by surgical team in operating theatre. No additional information provided |
| Allocation concealment (selection bias) | Unclear risk | No details |
| Blinding of participants and personnel (performance bias) | High risk | No details and we assumed that investigators made no attempts to blind personnel |
| Blinding of outcome assessment (detection bias) | Unclear risk | No details |
| Blinding of outcome assessment (detection bias) | Low risk | No evidence of blinding. Lack of blinding unlikely to influence outcome data for mortality |
| Incomplete outcome data (attrition bias) | Low risk | No apparent losses |
| Selective reporting (reporting bias) | Unclear risk | Clinical trial registration or prospectively written protocol not reported. Not feasible to judge selective outcome reporting bias |
| Baseline characteristics | Low risk | Appeared comparable |
| Other bias | Unclear risk | Changes to feeding protocol during study, but target rates were comparable between groups. No other sources of bias identified |
| Methods | RCT, single‐centre, 2‐arm, parallel design | |
| Participants | Total number of randomized participants: 71 Inclusion criteria
Exclusion criteria
Primary diagnoses
Baseline characteristics EN group
PN group
Country: Turkey Setting: university hospital, medical ICU | |
| Interventions | EN group n = 30; 0 losses; ITT analysis Details: preference for postpyloric tube placement, otherwise gastric feeding, feeding initiated within 48 hours, at target rate of 25 to 30 kcal/kg/day using ideal bodyweight, formula with proteins, carbohydrates, and lipids. 20 mL/hour of standard solution, increased every 4 to 6 hours by 20 mL/hour if GRV < 150 mL. Continuous infusion of insulin as needed with target level of 100‐140 mg/kL. Caloric intake received, reported as mean (SD) percentage of target calories given: 46.48 (± 19.34) PN group n = 41; 0 losses; deviations from protocol for 3 participants who were changed to EN feeding due to clinical needs; ITT analysis Details: preference for central or venous route, according to participant condition and contraindications to central venous line insertion, otherwise peripheral route. Target rate of delivery and glycaemic management same as EN group. Feeding started at full dose, unless participant at risk of refeeding syndrome, or severely malnourished and already had electrolyte disturbance. Caloric intake received, reported as mean (SD) percentage of target calories given: percentage of target calories given 66.78 (SD ± 18.85) | |
| Outcomes |
| |
| Notes | Funding/declarations of interest: no details Study dates: February 2004 to January 2006 | |
| Risk of bias | ||
| Bias | Authors' judgement | Support for judgement |
| Random sequence generation (selection bias) | High risk | Quasi‐randomized method of sequence generation. Quote: "Patients were randomized to receive either EN or PN according to the last digit of their assigned hospital record number: odd numbers received PN, and even numbers received EN" |
| Allocation concealment (selection bias) | Low risk | Adequate concealment despite inadequate sequence generation. Hospital record numbers were assigned by staff independent of the ICU team |
| Blinding of participants and personnel (performance bias) | High risk | No details and we assumed investigators made no attempts to blind personnel |
| Blinding of outcome assessment (detection bias) | Unclear risk | No details |
| Blinding of outcome assessment (detection bias) | Low risk | No details. Lack of blinding unlikely to influence assessment of outcomes for mortality |
| Incomplete outcome data (attrition bias) | Low risk | No apparent losses but deviations from protocol in 3 participants in PN group. ITT analysis used |
| Selective reporting (reporting bias) | Unclear risk | Clinical trials registration not reported. Not possible to make assessment of selective outcome reporting bias |
| Baseline characteristics | Unclear risk | More sepsis and acute pathology in PN group; not reported as statistically significant. Unclear if these differences could influence outcome data. Also, we noted that number of participants in each group was not equivalent (41 in PN group; 30 in EN group) and this was not explained |
| Other bias | Low risk | Glycaemic controls equivalent between groups. Nutritional goals appeared to be equivalent. No other sources of bias identified |
| Methods | RCT, single‐centre, 2‐arm, parallel design | |
| Participants | Total number of randomized participants: 120 Inclusion criteria
Exclusion criteria
Primary diagnoses
Baseline characteristics EN group
EN + PN group
Country: France Setting: 2 ICUs (medical and surgical) at same hospital | |
| Interventions | EN group n = 60; 7 losses; ITT analysis Details: feeding for 4 to 7 days with target rate of delivery 25 kcal/kg bodyweight/day = 100 kcal carbohydrates‐fat per gram of nitrogen. Typical 70 kg person received 100 mL initially, with an increased amount in 50 mL steps to a maximum of 350 mL every 4 hours. Feeding solution consisted of protein (20%), polyunsaturated fats (30%), carbohydrates (50%), non‐soluble fibres, sodium chloride, potassium chloride, hydrosoluble and liposoluble vitamins. All participants in the EN group also received placebo PN formula, consisting of: sodium chloride, Intravit, Soluvit (Pharmacia and Upjohn, St Quentin‐Yvelines, France). GRV measured before each feed; delayed feeding if > 300 mL and cisapride added. Glucose level checked every 4 hours and maintained around 1.6 to 2 g/L with insulin using a sliding scale Caloric intake received, mean (SD): EN: 9.9 (± 3.9) kcal/kg/day; PN: 1.4 (± 0.3) kcal/kg/day EN + PN group n = 60; 6 losses; ITT analysis Details: EN composition as above. PN feeding through central line access. Feeding solution consisted of EN: protein (20%), polyunsaturated fats (30%), carbohydrates (50%), non‐soluble fibres, sodium chloride, potassium chloride, hydrosoluble and liposoluble vitamins. PN: 3‐in‐1 solution of carbohydrates, lipids, and protein; Vitrimix (Fresenius Kabi); hydrosoluble vitamins; Soluvit (Pharmacia and Upjohn, St Quentin‐Yvelines, France). Caloric intake received, mean (SD): EN: 11 (± 3.3) kcal/kg/day; PN: 13.9 (± 2.5) kcal/kg/day Note: study authors reported that increases in EN were the same. PN increases were the same in theory, but not in actuality due to the lack of fat content in the EN group placebo feed | |
| Outcomes |
| |
| Notes | Funding/declarations of interest: no reported details Study dates: August 1996 to May 1997 | |
| Risk of bias | ||
| Bias | Authors' judgement | Support for judgement |
| Random sequence generation (selection bias) | Unclear risk | Randomization carried out at central pharmacy but methods were not adequately described |
| Allocation concealment (selection bias) | Unclear risk | Use of sealed envelopes; no additional details |
| Blinding of participants and personnel (performance bias) | Low risk | Both participants and personnel were blind to the intervention. Quote: "The bags were prepared under the label A or B. Neither the health care providers nor the patients were aware of their content. Both types of bags were opalescent by the adjunction of small amount of fat and vitamins." |
| Blinding of outcome assessment (detection bias) | Unclear risk | No details. Statistician was blinded |
| Blinding of outcome assessment (detection bias) | Low risk | No details; lack of blinding unlikely to influence outcome data for mortality |
| Incomplete outcome data (attrition bias) | Low risk | Some participants received sufficient nutrition by day 4, and some died by day 4 but no difference in these losses between groups and participants included in analysis as ITT |
| Selective reporting (reporting bias) | Unclear risk | Clinical trials registration not reported. Not possible to make assessment on selective outcome reporting bias |
| Baseline characteristics | Low risk | Baseline characteristics were very similar between groups |
| Other bias | Low risk | Protocol for glycaemic management was the same for both groups. Other differences in nutritional protocol are due to study design (EN vs EN + PN). No other sources of bias identified |
| Methods | RCT, multi‐centre, 2‐arm, parallel design | |
| Participants | Total number of randomized participants: 36 Inclusion criteria
Exclusion criteria
Primary diagnoses
Baseline characteristics EN group
PN group
Country: Italy Setting: 33 ICUs | |
| Interventions | EN group n = 17; note 1 participant wrongly randomized to non‐septic group (see Radrizzani 2006) and then analysed in this report; ITT analysis. 18 participants analysed. Details: feeding initiated within 48 hours of ICU admission. Feeding started at 10 kcal/kg/day, rising to 25 to 28 kcal/kg/day by 4th day. Nutritional formula consisted of 55% carbohydrates, 25% fat, 21% protein, 1.3 kcal/mL, containing per 100 mL: L‐arginine 0.8 g, omega‐3 fatty acids 0.15 g, omega‐6 fatty acids 0.7 g, vitamin E 2.9 mg, β‐carotene 0.75 mg, zinc 2.2 mg, and selenium 7 μg (Perative Abbott). Caloric intake received, mean (SD): 19.1 (± 7.6) kcal/kg/day over the first 6 days PN group n = 19; note 2 participants wrongly randomized to non‐septic group (see Radrizzani 2006) and then analysed in this report; ITT analysis. 21 participants analysed Details: feeding protocol as for EN group. Nutritional formula consists of equivalent carbohydrates, fats, and proteins (59% carbohydrates, 23% fat, 18% protein) but does not appear to include additional vitamins/minerals Caloric intake received, mean (SD): 25.9 (± 6.4) kcal/kg/day over the first 6 days | |
| Outcomes |
| |
| Notes | Funding/declarations of interest: Abbott Italia Study dates: November 1999 to April 2001 Note: study was described as an interim analysis. It is the same study as Radrizzani 2006 but data included were for a subgroup of participants with sepsis only. Also, study authors considered the difference in caloric intake and differences in some baseline characteristics to be significant, and conducted an adjusted analysis after which they concluded that these factors were potentially confounding and subsequently ceased randomization into this study. | |
| Risk of bias | ||
| Bias | Authors' judgement | Support for judgement |
| Random sequence generation (selection bias) | Low risk | Adequate sequence generation. Use of computer‐generated randomization code |
| Allocation concealment (selection bias) | Low risk | Adequate concealment. Quote: "The randomisation code was generated by a computer programme at the co‐ordinating centre and was revealed to investigators by telephone at the moment of randomisation, once baseline data collection was completed." |
| Blinding of participants and personnel (performance bias) | High risk | No details and we assumed investigators made no attempts to blind personnel |
| Blinding of outcome assessment (detection bias) | Unclear risk | Study authors reported that outcome data analysts were not blinded; study authors did not report whether outcome assessors were blinded |
| Blinding of outcome assessment (detection bias) | Low risk | Lack of blinding unlikely to influence outcome data for mortality |
| Incomplete outcome data (attrition bias) | Low risk | No apparent losses |
| Selective reporting (reporting bias) | Unclear risk | Clinical trials registration or prospectively published protocol not reported. Not possible to make assessment on reporting bias |
| Baseline characteristics | Unclear risk | Study authors noted an imbalance in baseline characteristics (PN group had more women, more participants aged > 60 years, more participants with cardiovascular and respiratory failure) and completed adjusted analysis for these variables. We were unclear whether these differences may affect results for our outcomes |
| Other bias | Unclear risk | Participants in PN group were given more calories in first 3 days because of study design and study authors completed adjusted analysis for this variable. Participants in EN group given additional supplements of minerals/vitamins which are not included in PN formula. We were unclear whether these differences may affect results for our outcomes |
| Methods | RCT, single‐centre, 2‐arm, parallel design | |
| Participants | Total number of randomized participants: 59 Inclusion criteria
Exclusion criteria
Primary diagnosis
Baseline characteristics EN group
PN group
Country: USA Setting: level 1 trauma centre | |
| Interventions | EN group n = 36; 8 losses; 28 analysed. Per‐protocol analysis (except for mortality) Details: jejunal tube placement, and gastrotomy tubes placed to drain stomach. Feeding started within 24 hours of randomization. Target rates calculated with Harris Benedict formula BEE + 50%. Initiated at 20% of target rate for 12 hours; 40% for 12 hours; 60% for 12 hours; 80% for 12 hours; then target rate. Formula was a Vivonex solution TEN (Norwich Eaton Pharmaceuticals, Inc, Norwich, NY, USA) consisting of 4.9 g/L glutamine, carbohydrates, fat, AAs, other minerals, and Travasol solution (Baxter Healthcare Corp, Deerfield, IL, USA) consisting of 3.21 g/L glutamine, carbohydrates, fat, AAs, other minerals. If extra protein was required then Travasol 10% was given to EN solution. At day 9 to 11, EN group converted from Vivonex TEN to Isotein HN via jejunal tube ("thus keeping both groups identical except for route") PN group n = 23; 2 losses; 21 analysed. Per‐protocol analysis (except for mortality) Details: central venous catheter placement. Feeding continued for 5 days and then attempts to convert to gastric feeding by any routes at the discretion of the clinician. Target rates calculated with Harris Benedict formula BEE + 50%. Feeding initiated 40% target rate of 24 hours; 60% for 12 hours, 80% for 12 hours, then target rate. Formula was an Isotein HN solution (Sandoz Nutrition Corp: Minneapolis, MN, USA) consisting of carbohydrates, fat, AAs, and other minerals. If extra protein was required then Travasol 10% was given to PN solution | |
| Outcomes |
| |
| Notes | Funding/declarations of interest: financial support from Norwich Eaton Pharmaceuticals, NY, USA. Study dates: July 1990 to December 1991 | |
| Risk of bias | ||
| Bias | Authors' judgement | Support for judgement |
| Random sequence generation (selection bias) | Low risk | Adequate sequence generation. Computer‐generated random number tables |
| Allocation concealment (selection bias) | Low risk | Computer‐generated numbers and we assumed that allocation was concealed from investigators |
| Blinding of participants and personnel (performance bias) | High risk | No details and we assumed investigators made no attempts to blind personnel |
| Blinding of outcome assessment (detection bias) | Unclear risk | No details |
| Blinding of outcome assessment (detection bias) | Low risk | No details. Lack of blinding unlikely to influence outcome data for mortality |
| Incomplete outcome data (attrition bias) | Unclear risk | Some loss of participant data: 2 participants in EN group, 8 participants in PN group. Reasons for losses were explained and mortality data included these (death was one of reasons for loss) |
| Selective reporting (reporting bias) | Unclear risk | Clinical trials registration or prospectively published protocol was not reported. Therefore, not feasible to make judgement on selective outcome reporting bias |
| Baseline characteristics | Low risk | Appeared comparable, although we noted a large difference in sample size between groups which was unexplained |
| Other bias | Unclear risk | Some possible differences in nutritional formula. Unclear if this was likely to influence data |
| Methods | RCT, multi‐centre, 2‐arm, parallel design | |
| Participants | Total number of randomized participants: 4640 Inclusion criteria
Exclusion criteria
Primary diagnoses
Baseline characteristics EN group
EN + PN group
Country: Belgium Setting: 7 ICUs | |
| Interventions | EN group (study authors referred to this group as "late‐initiation group") n = 2328; 15 discontinued intervention owing to protocol violation (inadvertent administration of ≥ 1 L/day PN for ≥ 2 days during intervention period); 2328 analysed as ITT Details: IV 20% glucose solution (target for total energy intake was 400 kcal/day on 1st ICU day, and 800 kcal/day on 2nd ICU day), and EN via duodenal feeding tube. If EN was insufficient after 7 days, PN was initiated on day 8 to reach caloric goal. Continuous insulin infusion adjusted to obtain blood glucose level 80 to 100 mg/dL EN + PN group (study authors referred to this group as "early‐initiation group") n = 2312; 0 losses; 2312 analysed Details: IV 20% glucose solution (target for total energy intake was 400 kcal/day on first ICU day, and 800 kcal/day on second ICU day). On day 3, PN initiated with dose targeted to 100% of caloric goal through combined EN + PN (except when clinicians predicted that participant would tolerate sufficient EN or oral feeding on day 3). Amount of PN was calculated as amount that was not effectively delivered by EN. Calculations of caloric goal included protein energy and based on ideal bodyweight, age, and gender. PN was reduced and eventually stopped if participant was able to meet > 80% caloric goal with EN or able to resume normal oral feeding. Continuous insulin infusion adjusted to obtain blood glucose level 80 to 100 mg/dL | |
| Outcomes |
| |
| Notes | Funding/declarations of interest: supported by Methusalem programme of the Flemish government, Research Fund of the Catholic University of Leuven, Belgium; the Research Foundation Flanders, Belgium; and the Clinical Research Fund of the University Hospitals Leuven, Belgium. In addition, the Catholic University of Leuven received unrestricted research grant from Baxter Healthcare for less than one‐third of study costs. Baxter Healthcare were not involved in the design of study, collection, analysis, or interpretation of data, in preparation of manuscript for publication. Study dates: August 2007 to November 2010 | |
| Risk of bias | ||
| Bias | Authors' judgement | Support for judgement |
| Random sequence generation (selection bias) | Low risk | Use of a digital system to prepare order of envelopes |
| Allocation concealment (selection bias) | Low risk | Use of sequentially numbered, sealed, opaque envelopes, and block size was concealed from treating physicians and nurses |
| Blinding of participants and personnel (performance bias) | High risk | No details and we assumed that investigators made no attempts to blind personnel |
| Blinding of outcome assessment (detection bias) | Low risk | All outcome assessors were blinded to group allocation |
| Blinding of outcome assessment (detection bias) | Low risk | All outcome assessors were blinded to group allocation |
| Incomplete outcome data (attrition bias) | Low risk | Small number of losses in 1 group, unlikely to influence outcome data |
| Selective reporting (reporting bias) | Low risk | Prospective clinical trials registration (NCT00512122). Outcomes reported same as clinical trials registration documents. We noted that duration of ICU was reported but not listed in the registration documents, but primary outcomes were generally all reported |
| Baseline characteristics | Low risk | Appeared comparable |
| Other bias | Low risk | Protocol for glycaemic management was the same for both groups. No other sources of bias identified |
| Methods | RCT, single‐centre, 2‐arm, parallel design | |
| Participants | Total number of randomized participants: 70 Inclusion criteria
Exclusion criteria
Primary diagnosis
Baseline characteristics EN group
PN group
Country: USA Setting: surgical ICU | |
| Interventions | EN group n = 33; 2 losses; ITT analysis = 31 analysed Details: nasoduodenal feeding, started 4 to 6 days after sepsis and surgery, target rate of 1.5 g protein/kg/day. 30 NPC/kg/day, carbohydrates, protein, fats, salts, minerals etc. Duration of feeding assumed to be for 8 to10 days Note: 10 participants given PN during period prior to randomization Caloric intake received, mean (SD): protein: 80 (± 26) g/day. Non‐protein: 1684 (± 573) kcal/day PN group n = 37; 2 losses: ITT analysis = 35 analysed Details: feeding formula described as "identical composition" to EN group, with same target rate of delivery Note: 10 participants given PN during period prior to randomization Caloric intake received, mean (SD): protein: 88 (± 20) g/day. Non‐protein: 2000 (± 20) kcal/day | |
| Outcomes |
| |
| Notes | Funding/declarations of interest: no details reported Study dates: not reported Note: participants in study were a subgroup of a larger epidemiological study | |
| Risk of bias | ||
| Bias | Authors' judgement | Support for judgement |
| Random sequence generation (selection bias) | Unclear risk | Described as randomized but no additional details |
| Allocation concealment (selection bias) | Unclear risk | No details |
| Blinding of participants and personnel (performance bias) | High risk | No details and we assumed investigators made no attempts to blind personnel |
| Blinding of outcome assessment (detection bias) | Unclear risk | No details |
| Blinding of outcome assessment (detection bias) | Low risk | No details. Lack of blinding unlikely to influence outcome data for mortality |
| Incomplete outcome data (attrition bias) | Low risk | Loss of 4 participants, with reasons reported by study authors; small number of losses unlikely to influence data |
| Selective reporting (reporting bias) | Unclear risk | Clinical trials registration not reported. Not feasible to judge risk of reporting bias |
| Baseline characteristics | Low risk | Appeared comparable |
| Other bias | Low risk | No details of glycaemic controls, limited detail in paper but nutritional composition is described as identical. We noted more calories in PN group, but study authors reported "no statistical difference." |
| Methods | RCT, single‐centre, 2‐arm, parallel design | |
| Participants | Number of randomized participants: 24 Inclusion criteria
Exclusion criteria
Primary diagnosis
Baseline characteristics EN group
EN + PN group
Country: Italy Setting: ICU | |
| Interventions | EN group n = 12: no apparent losses Details: nutrition initiated 24 to 36 hours after admission. All participants fed with PN for 4 days, then 'weaned' to EN. Nasogastric tube placement, duration of feeding for 7 days, with formula consisting of high protein content with high ratio of calories/nitrogen. Caloric intake received, mean (SD): 33 (± 9) kcal/kg EN with PN group n = 12; no apparent losses Details: nutrition initiated 24 to 36 hours after admission. All participants given PN for 4 days, then given mixed feeding of 50% PN and 50% EN Caloric intake received, mean (SD): 31 (± 6) kcal/kg | |
| Outcomes |
| |
| Notes | Funding/declarations of interest: not reported Study dates: not reported Study report published in Italian | |
| Risk of bias | ||
| Bias | Authors' judgement | Support for judgement |
| Random sequence generation (selection bias) | Unclear risk | Participants randomly assigned to groups but no additional details |
| Allocation concealment (selection bias) | Unclear risk | No details |
| Blinding of participants and personnel (performance bias) | High risk | No details and we assumed investigators made no attempts to blind personnel |
| Blinding of outcome assessment (detection bias) | Unclear risk | No details |
| Blinding of outcome assessment (detection bias) | Low risk | No details. Lack of blinding unlikely to influence outcome data for mortality |
| Incomplete outcome data (attrition bias) | Low risk | No apparent losses |
| Selective reporting (reporting bias) | Unclear risk | Clinical trial registration or publication of prospective protocol not reported; not feasible to judge risk of reporting bias |
| Baseline characteristics | Low risk | Study authors reported that baseline characteristics were comparable |
| Other bias | Unclear risk | No other sources of bias identified |
| Methods | RCT, single‐centre, 3‐arm, parallel design | |
| Participants | Total number of randomized participants: 38 Inclusion criteria
Excluded criteria
Primary diagnoses
Baseline characteristics EN group
PN group
EN + PN group
Country: USA Setting: trauma centre | |
| Interventions | EN group n = 12; 0 losses Details: transpyloric tube placement, feeding started within 24 hours of randomization and continued for 7 days. Investigators used Harris Benedict formula BEE x 1.3 to calculate caloric intake. Aimed to provide 50% projected calories by 24 hours after randomization; and 100% by 48 hours. Formula was Traumacal (Mead‐Johnson), NPC given in form of lipids (30%) and carbohydrates (70%). Ratio of NPC to nitrogen was 105:1. Protein load was 1.75 g/kg/day. Mean caloric intake: 1789 calories/day for 7 days PN group n = 16; 1 participant died on 4th study day, not included in study analysis but we have included in review outcome data. Details: feeding started within 24 hours of randomization and continued for 7 days. Investigators used Harris Benedict formula BEE x 1.3 to calculate caloric intake. Aim to provide 50% projected calories by 24 hours after randomization; and 100% by 48 hours. Formula consisted of dextrose‐lipid‐AA mixture; soybean solution, multi‐vitamin mixture. Mixture was 6.7% AA and 23.1% dextrose, soybean solution provided 30% of the NPC. Mean caloric intake: 1961 calories/day for 7 days EN + PN group n = 10; 0 losses Details: feeding started within 24 hours of randomization and continued for 7 days. Investigators used Harris Benedict formula BEE x 1.3 to calculate caloric intake. Aim to provide 50% projected calories by 24 hours after randomization; and 100% by 48 hours. EN formula provided 50% of calories and PN formula provided 50% of calories. EN consisted of Traumacal (Mead‐Johnson), NPC given in form of lipids (30%) and carbohydrates (70%). PN formula consisted of dextrose‐lipid‐AA mixture; soybean solution, multi‐vitamin mixture. Mean caloric intake: 2030 calories/day for 7 days | |
| Outcomes |
| |
| Notes | Funding/declarations of interest: not reported Study dates: not reported | |
| Risk of bias | ||
| Bias | Authors' judgement | Support for judgement |
| Random sequence generation (selection bias) | Unclear risk | Described as randomized but no additional details |
| Allocation concealment (selection bias) | Unclear risk | No details |
| Blinding of participants and personnel (performance bias) | High risk | No details and we assumed investigators made no attempts to blind personnel |
| Blinding of outcome assessment (detection bias) | Low risk | Most outcome data were taken from the trauma registry. Quote: "All data from the trauma registry and the finance officers were blinded, since these sources had no knowledge of the patient's status relative to the research arm assigned." |
| Blinding of outcome assessment (detection bias) | Low risk | Outcome assessors were blinded |
| Incomplete outcome data (attrition bias) | Low risk | 1 participant was not included in data for PN group due to death during 7‐day intervention period; we have included this event in review analysis. No other loss of data |
| Selective reporting (reporting bias) | Unclear risk | Clinical trials registration or prospectively published protocol not reported; not feasible to judge risk of selective outcome reporting bias |
| Baseline characteristics | Low risk | Some usual baseline characteristics not reported (age, gender) but other characteristics all appeared comparable |
| Other bias | Unclear risk | Target rate of nutrition the same. Unclear if differences in formula were equivalent |
| Methods | RCT, single‐centre, 3‐arm, parallel design | |
| Participants | Number of randomized participants: 20 Inclusion criteria
Exclusion criteria
Primary diagnoses
Baseline characteristics EN group (standard)
EN group (supplemented)
PN group
Country: Germany Setting: ICU | |
| Interventions | EN group (standard) n = 10; 0 losses Details: nasojejunal tube with feeding pump, feeding started within 24 hours of trauma, "Oligopeptide standard diet" (Survimed OPD, Frensenius). Target energy of 25 kcal/kg/day. Initial rate of 25 mL/hour. Infusion rate increased at rate of 25 mL/hour up to the 4th day and a minimum of 75 mL/hour. Caloric intake received: not reported EN group (supplemented) n = 10; 0 losses Details: nasojejunal tube with feeding pump, feeding started within 24 hours of trauma. Formula consisted of Impact (Fa. Sandoz), supplemented with arginine, omega‐3 fatty acids, nucleotide, and selenium. Target energy of 25 kcal/kg/day. Initial rate of 25 mL/hour. Infusion rate increased at rate of 25 mL/hour up to the 4th day and a minimum of 75 mL/hour. Caloric intake received: not reported PN group n = 10; 0 losses Details: isocaloric and isonitrogenous total PN Caloric intake received: not reported | |
| Outcomes |
| |
| Notes | Funding/declarations of interest: not reported Study dates: not reported Note: for the purpose of review analysis, we combined data for the 2 EN groups. | |
| Risk of bias | ||
| Bias | Authors' judgement | Support for judgement |
| Random sequence generation (selection bias) | Unclear risk | Described as randomized but no additional details |
| Allocation concealment (selection bias) | Unclear risk | No details |
| Blinding of participants and personnel (performance bias) | High risk | No details and we assumed investigators made no attempts to blind personnel |
| Blinding of outcome assessment (detection bias) | Unclear risk | No details |
| Blinding of outcome assessment (detection bias) | Low risk | No details. Lack of blinding unlikely to influence outcome data for mortality |
| Incomplete outcome data (attrition bias) | Low risk | No apparent losses |
| Selective reporting (reporting bias) | Unclear risk | Clinical trials registration of prospectively published protocol not reported; not feasible to assess risk of reporting bias |
| Baseline characteristics | Low risk | Appear comparable |
| Other bias | Low risk | No other sources of bias identified |
| Methods | RCT, single‐centre, 3‐arm, parallel design | |
| Participants | Total number of randomized participants: 120 Inclusion criteria
Exclusion criteria
Primary diagnosis
Baseline characteristics EN group
PN group
EN + PN group
Country: China Setting: NICU | |
| Interventions | EN group n = 40; 0 losses Details: all participants had nasogastric tube intubation and central venous catheterization within 48 hours of admission. EN given via nasogastric tube accompanied by suctioning gastric tube, within 48 hours of admission. Increasing dose to a maximum of 1500 mL/day in 7 days, with a pumping speed < 75 mL/hour. Normal sodium, glucose, and saline given IV. Energy as 105 to 126 kJ/kg/day. Supplements of vitamins, micro‐elements, natrium, and kalium given if required PN group n = 40; 0 losses Details: all participants had nasogastric tube intubation and central venous catheterization within 48 hours of admission. Participants given PN through central venous catheter within 48 hours. Ratio of 2:1 for carbohydrates to lipids, and ratio of 100:1 for calorie nitrogen ratio. Energy as 105 to 126 kJ/kg/day. Supplements of vitamins, micro‐elements, natrium, and kalium given if required EN + PN group n = 40; 0 losses Details: all participants had nasogastric tube intubation and central venous catheterization within 48 hours of admission. EN given via nasogastric tube accompanied by suctioning gastric tube, within 48 hours of admission. Increasing dose to a maximum of 1000 mL/day in 7 days, with a pumping speed < 50 mL/hour. Insufficient energy was given by PN. Energy as 105 to 126 kJ/kg/day. Supplements of vitamins, micro‐elements, natrium, and kalium given if required | |
| Outcomes |
| |
| Notes | Funding/declarations of interest: supported by the Natural Science Foundation of Shandong province, and Technology Supporting Program of Qingdao Study dates: January 2009 to May 2012 | |
| Risk of bias | ||
| Bias | Authors' judgement | Support for judgement |
| Random sequence generation (selection bias) | High risk | Quasi‐randomized method of sequence generation. Participants were randomly allocated according to hospital record numbers |
| Allocation concealment (selection bias) | Unclear risk | No details |
| Blinding of participants and personnel (performance bias) | High risk | No details and we assumed investigators made no attempts to blind personnel |
| Blinding of outcome assessment (detection bias) | Unclear risk | No details |
| Blinding of outcome assessment (detection bias) | Low risk | No details. Lack of blinding unlikely to influence outcome data for mortality |
| Incomplete outcome data (attrition bias) | Low risk | No apparent losses |
| Selective reporting (reporting bias) | Unclear risk | Clinical trials registration of prospectively published protocol not reported; not feasible to assess risk of reporting bias |
| Baseline characteristics | Low risk | Appeared comparable |
| Other bias | Low risk | No other sources of bias identified |
| Methods | RCT, single‐centre, 2‐arm, parallel design | |
| Participants | Number of randomized participants: 60 Inclusion criteria
Exclusion criteria
Primary diagnoses
Baseline characteristics EN group
PN group
Country: Turkey Setting: ICU | |
| Interventions | EN group n = 30; no apparent losses Details: nasogastric or jejunum feeding, initiated within 12 hours of surgery with target rate of delivery at 35 kcal/kg/day PN group n = 30; no apparent losses Details: standard formula of TPN (75% carbohydrate, 25% fat), with target rate of delivery at 35 kcal/kg/day | |
| Outcomes |
| |
| Notes | Funding/declarations of interest: funding not reported. Study authors declared no conflicts of interest. Study dates: not reported | |
| Risk of bias | ||
| Bias | Authors' judgement | Support for judgement |
| Random sequence generation (selection bias) | Unclear risk | Participants were randomly assigned to groups; no additional details |
| Allocation concealment (selection bias) | Unclear risk | No details |
| Blinding of participants and personnel (performance bias) | High risk | We assumed investigators made no attempts to blind personnel |
| Blinding of outcome assessment (detection bias) | Unclear risk | No details |
| Blinding of outcome assessment (detection bias) | Low risk | Lack of blinding unlikely to influence outcome data for mortality |
| Incomplete outcome data (attrition bias) | Low risk | No apparent losses |
| Selective reporting (reporting bias) | Unclear risk | Clinical trials registration not reported; not feasible to assess risk of reporting bias |
| Baseline characteristics | Low risk | Appeared comparable |
| Other bias | Unclear risk | No other sources of bias identified |
| Methods | RCT, single‐centre, 2‐arm, parallel design | |
| Participants | Total number of randomized participants: 24 Inclusion criteria
Exclusion criteria
Primary diagnoses
Baseline characteristics Overall gender, M/F: 17/7 EN group
PN group
Country: UK Setting: adult ICU | |
| Interventions | EN group n = 13; 0 losses Details: nasogastric tube placement, formula used was Alitraq (Abbott Laboratories), supplemented with glutamine, delivered at 30 mL/hour (rate increased to meet nutritional requirements during 24 to 36 hours). Sucralfate (for stress ulcers) also given when required. PN group n = 11; 0 losses Details: formula described as standard regimen (Kabi 1 or Kabi 2 ‐ Kabi Pharmacia, Ltd, Milton Keynes, UK). Did not include glutamine supplement. Sucralfate (for stress ulcers) also given when required. | |
| Outcomes |
| |
| Notes | Funding/declarations of interest: Abbott Laboratories Ltd Study dates: not reported | |
| Risk of bias | ||
| Bias | Authors' judgement | Support for judgement |
| Random sequence generation (selection bias) | Unclear risk | Described as randomized but no additional details |
| Allocation concealment (selection bias) | Unclear risk | No details |
| Blinding of participants and personnel (performance bias) | High risk | No details and we assumed investigators made no attempts to blind personnel |
| Blinding of outcome assessment (detection bias) | Low risk | Lack of blinding unlikely to influence outcome data for mortality |
| Incomplete outcome data (attrition bias) | Low risk | No apparent losses |
| Selective reporting (reporting bias) | Unclear risk | Clinical trials registration not reported. Not possible to make judgement on risk of bias for selective outcome reporting |
| Baseline characteristics | Low risk | Appeared comparable |
| Other bias | Unclear risk | Glutamine supplement given to EN group but not PN group |
| Methods | RCT, multi‐centre, 2‐arm, parallel design | |
| Participants | Total number of participants: 2400 Inclusion criteria
Exclusion criteria
Primary diagnoses
Baseline characteristics EN group
PN group
Country: UK Setting: 33 ICUs | |
| Interventions | EN group n = 1200; 1195 analysed; participants lost to follow‐up were not included in analysis, but protocol deviations were. See note Details: nasogastric or nasojejunal tube feeding for 5 days. Time of initiation of feeding: median 22 (IQR 16 to 28) hours. Target rate of 25 kcal/kg bodyweight/day, with goal to reach target within 48 to 72 hours. Prokinetics given for GRV cut‐offs at 200 to 500 mL. Use of international guidelines for glycaemic management, plus target level for serum glucose of < 180 mg/dL (10 mmol/L) Caloric intake received, mean (SD): 74 (± 44) kcal/kg PN group n = 1200; 1188 analysed; participants lost to follow‐up were not included in analysis, but protocol deviations were Details: central venous catheter placement. Target rate of delivery as for EN. Equivalent nutritional formula as EN, with same glycaemic management. IV feeding for 5 days, then weaned to gastric feeding. Time of initiation of feeding of feeding: median 24 (IQR 17 to 30) hours Caloric intake received, mean (SD): 89 (SD ± 44) kcal/kg | |
| Outcomes |
| |
| Notes | Funding/declarations of interest: NIHR Study dates: June 2011 to March 2014 Protocol deviations: EN: 30 did not receive assigned nutritional support, 26 received no nutritional support, 4 received PN. PN: 36 did not receive assigned nutritional support, 24 received no nutritional support, 12 received EN. All analysed as ITT. Additionally, there was a cross‐over of 18 participants in the EN group and 81 participants in the PN group, but these occurred towards the end of feeding and did not constitute protocol deviations. | |
| Risk of bias | ||
| Bias | Authors' judgement | Support for judgement |
| Random sequence generation (selection bias) | Low risk | Adequate sequence generation. 24‐hour telephone randomization system with computer algorithm used to balance groups in ICU |
| Allocation concealment (selection bias) | Low risk | Telephone randomization system and we assumed that allocation was concealed from investigators |
| Blinding of participants and personnel (performance bias) | High risk | No details and we assumed investigators made no attempts to blind personnel |
| Blinding of outcome assessment (detection bias) | Unclear risk | No details |
| Blinding of outcome assessment (detection bias) | Low risk | Lack of blinding unlikely to influence outcome data for mortality |
| Incomplete outcome data (attrition bias) | Low risk | Small number lost to follow‐up and not included in ITT analysis. Some protocol deviations but less than 10%; ITT analysis used for these |
| Selective reporting (reporting bias) | Low risk | Prospective clinical trials registration ISRCTN17386141. Protocol outcomes were consistent with outcomes reported in published study |
| Baseline characteristics | Low risk | Appear comparable |
| Other bias | Unclear risk | Not enough information on nutritional formula to make judgement. "Standard stock supply" used. Glycaemic controls appeared the same |
| Methods | RCT, multi‐centre, 2‐arm, parallel design | |
| Participants | Total number of participants: 305 Inclusion criteria
Exclusion criteria
Primary diagnoses
Baseline characteristics EN group
EN + PN group
Country: Switzerland Setting: 2 ICUs, medical and surgical | |
| Interventions | EN group n = 152; 10 participants discontinued study due to protocol violations; ITT analysis Details: nasogastric tube feeding (preferable). All participants fed EN until day 3. Participants in EN group continued with EN feeding for 5 days as part of intervention period, then remained on EN for 28 days as required. Target rate of delivery for women 25 kcal/kg of ideal bodyweight/day, for men 30 kcal/kg of ideal bodyweight/day. Protein delivery at 1.2 g/kg of ideal bodyweight/day, formula consisted of polymeric, fibre‐enriched formulas, routinely prescribed in both hospitals, containing 1.05 to 1.62 kcal/mL of energy (18% proteins, 29% lipids (8% medium‐chain triglycerides), 53% carbohydrates). Prokinetics given if GRV ≥ 300 mL. Continuous IV insulin therapy to maintain blood glucose at lower than 8.5 mmol/L. Caloric intake received, mean (SD): 20 (± 7) kcal/kg/day for days 4 to 8 EN + PN group n = 153; 20 participants discontinued study due to protocol violations; ITT analysis Details: central or peripheral catheter placement. All participants fed with EN formula until day 3. Participants in EN + PN group supplemented with PN feeding for 5 days, then resumed with only EN for 28 days as required. Target rate of delivery as for EN. EN formula as above. Formula for PN consisted of 0.62‐1.37 kcal/mL of energy (20% proteins, 29% lipids (15% medium‐chain triglycerides), and 51% carbohydrates). Caloric intake received, mean (SD): 28 (± 5) kcal/kg/day for days 4 to 8 | |
| Outcomes |
| |
| Notes | Funding/declarations of interest: Foundation Nutrition 2000Plus, ICU Quality Funds, Baxter, and Fresenius Kabi. Study authors reported that, "sponsors of study had no role in study design, data collection, data analysis, data interpretation, or writing of the report." Study dates: December 2008 to December 2010 Note: study authors reported number of infections, rather than number of participants with an infection, and we could not report this data because we did not know if a participant had more than 1 infection | |
| Risk of bias | ||
| Bias | Authors' judgement | Support for judgement |
| Random sequence generation (selection bias) | Low risk | Adequate sequence generation. Computer‐generated randomization sequence |
| Allocation concealment (selection bias) | Low risk | Adequate allocation concealment. Sequentially numbered, sealed, opaque envelopes |
| Blinding of participants and personnel (performance bias) | High risk | Some attempts to reduce risk of bias; study investigators involved in decisions regarding caloric goal were blinded. However, other investigators, personnel, and participants were not blinded |
| Blinding of outcome assessment (detection bias) | Low risk | Quote: "The senior site investigator from each university hospital prospectively obtained information about infectious episodes in study patients from the other centre, and was unaware of the treatment groups assigned to patients." Attempts to reduce outcome assessor and statistician blinding sufficient for our review outcomes |
| Blinding of outcome assessment (detection bias) | Low risk | Assume blinding of outcome assessors for blinding; and lack of blinding unlikely to influence outcome data for mortality |
| Incomplete outcome data (attrition bias) | Unclear risk | 20 participants in EN + PN group, and 10 participants in EN group discontinued study mostly due to protocol violation. Study authors used an ITT analysis. We noted an uneven number of losses between groups, with > 10% loss in the EN + PN group, and that death before 9 days was classed as protocol violation. We assumed that participants who died were included in mortality data for this study |
| Selective reporting (reporting bias) | Unclear risk | Quote: "registered with ClinicalTrials.gov, number NCT00802503" Prospective registration. All outcomes reported in trial register documents were consistent with reported outcomes. However, we noted changes to the trial registration documents after completion of the trial to state time point for data collection of infections between day 9 to day 28. We could not be certain whether this change affected the data reported in the published study |
| Baseline characteristics | Low risk | Appeared comparable |
| Other bias | Low risk | No other sources of bias identified. No evidence of differences in glycaemic controls or nutritional protocol |
| Methods | RCT, single‐centre, 2‐arm, parallel design | |
| Participants | Total number of randomized participants: 22 Inclusion criteria
Exclusion criteria
Primary diagnoses
Baseline characteristics EN group
PN group
Country: Brazil Setting: ICU | |
| Interventions | EN group n = 12: 0 losses Details: oro‐ or naso‐feeding tube in gastric position with pump infusion. Feeding initiated as soon as participant was haemodynamically stable. Duration of feeding for 5 days, with target rate of delivery of 25 to 30 kcal/kg/day with 1.5 g/kg/day of protein. Composition of feeding solution per 100 mL: protein 3.6 g (70% soy protein), carbohydrate 14 g, lipids 3.5 g added with casein to reach 1.5 g/kg/day Caloric intake received, mean (SD): total during 5 days: 5958 (± 3619) kcal PN group n = 10; 0 losses Details: central venous access, with equivalent target rate of delivery as EN group. Composition of feeding solution per 100 mL: 3.8 g of AAs, 14 g of glucose and 3.3 g or lipids Caloric intake received, mean (SD): total during 5 days: 6586 (± 1052) kcal | |
| Outcomes |
| |
| Notes | Funding/declarations of interest: not reported Study dates: August 2008 to June 2009 | |
| Risk of bias | ||
| Bias | Authors' judgement | Support for judgement |
| Random sequence generation (selection bias) | Unclear risk | No details |
| Allocation concealment (selection bias) | Unclear risk | No details |
| Blinding of participants and personnel (performance bias) | High risk | No details and we assumed investigators made no attempts to blind personnel |
| Blinding of outcome assessment (detection bias) | Unclear risk | No details |
| Blinding of outcome assessment (detection bias) | Low risk | Lack of blinding unlikely to influence assessment of mortality |
| Incomplete outcome data (attrition bias) | Low risk | No apparent losses |
| Selective reporting (reporting bias) | Unclear risk | Details of clinical trial registration not reported. Not possible to make assessment of selective outcome reporting bias |
| Baseline characteristics | Low risk | All comparable |
| Other bias | Low risk | Glycaemic controls not reported. We noted no differences in nutritional protocol. No other sources of bias identified |
| Methods | RCT, single‐centre, 2‐arm, parallel design | |
| Participants | Total number of randomized participants: 98 Inclusion criteria
Exclusion criteria
Primary diagnoses
Baseline characteristics EN group
PN group
Country: USA Setting: trauma ICU | |
| Interventions | EN group n = 52; 1 death within 4 days, excluded from study analysis but we included in the review analysis; 2 participants were switched to PN group at 1 week, included in ITT analysis Details: feeding tube placement in jejunum. Target rate of delivery 1.5 to 2.0 g/kg/day of protein/AAs and 30 to 35 kcal/kg/day of NPC. Participants randomized within 8 hours of surgery, mean (SD) time until initiation of feeding was 24 (± 1.7) hours. Feeding formula was Vital HN (Ross Laboratories, Columbus, OH, USA), and consisted of protein (16.7%), branched‐chain AAs (18.2%), carbohydrates (73.9%), and fat (9.4%) Caloric intake received, mean (SEM): 30.2 (± 1.2) NPC/kg/day (maximum rate). Participants in the EN group received significantly less total nutrition per day than participants in the PN group. PN group n = 46; 1 death within 4 days, excluded from study analysis but we included in the review analysis; of 40 participants, people with infections were transferred to EN group, but kept in analysis as ITT Details: central venous access. Target rate of delivery as for EN group. Mean (SD) time until initiation of feeding was 22.9 (± 1.6) hours. Pharmacy provided formula with similar concentrations of protein, carbohydrate, and fat. Caloric intake received, mean (SEM): 29.9 (± 15) NPC/kg/day | |
| Outcomes |
| |
| Notes | Funding/declarations of interest: not reported Study dates: December 1989 to August 1991 Note: 8 participants (did not state from which groups) required return to surgery within 24 to 48 hours, then randomized to receive EN or PN. Assumed that analysis and baseline characteristics were from point of new randomization (i.e. participants were removed and then re‐introduced into the study. 2 participants were switched from EN to PN because of failure to tolerate ≥ 50% or nutritional goal; use of ITT analysis for these participants. Protocol broken for 6 participants who had candida infections (4 in PN group, 2 in EN group) | |
| Risk of bias | ||
| Bias | Authors' judgement | Support for judgement |
| Random sequence generation (selection bias) | Low risk | Computer‐generated randomization table |
| Allocation concealment (selection bias) | Low risk | Computer randomization and we assumed that allocation was concealed from investigators |
| Blinding of participants and personnel (performance bias) | High risk | No details and we assumed investigators made no attempts to blind personnel. |
| Blinding of outcome assessment (detection bias) | Unclear risk | Principal investigator, who we assumed was not blinded, was involved in data analysis (review of charts at hospital discharge). However, attempts were made to reduce bias by using a 2nd blinded surgeon to resolve discrepancies in infections diagnoses |
| Blinding of outcome assessment (detection bias) | Low risk | Lack of blinding unlikely to influence outcome data for mortality |
| Incomplete outcome data (attrition bias) | Low risk | 2 participants excluded from analysis due to death; included in review analysis |
| Selective reporting (reporting bias) | Unclear risk | No protocol or clinical trials registration reported, therefore, not feasible to make judgement on risk of selective reporting bias |
| Baseline characteristics | Low risk | Appeared comparable |
| Other bias | Unclear risk | Some changes to feeding protocols that were deemed clinically appropriate. Use of ITT analysis |
| Methods | RCT, single‐centre, 2‐arm, parallel design | |
| Participants | Total number of randomized participants: 59 Inclusion criteria
Exclusion criteria
Primary diagnosis
Baseline characteristics EN group
PN group
Country: USA Setting: ICU | |
| Interventions | EN group n = 29; 8 losses, participants withdrawn due to: failure to meet inclusion/exclusion criteria, presence of underlying bowel disease, mechanical failure of EN delivery, early patient transfer, death within 72 hours; 21 analysed Details: needle‐catheter jejunostomy placed at initial laparotomy. BEE calculated by Harris‐Benedict equation at 1.5 x BEE. Feeding initiated within 12 hours of surgery. Formula consisted of Vivonex TEN (Norwich Eaton Pharmaceuticals, Inc, Norwich, NY, USA); provided 2.5% fat and approximately 33% branched chain AAs with NPC to grams nitrogen ratio of 150:1 Caloric intake received, mean (SEM): day 5: 2203.7 (± 172.8) kcal/kg PN group n = 30; 5 losses, participants withdrawn due to: failure to meet inclusion/exclusion criteria, presence of underlying bowel disease, early patient transfer, death within 72 hours; 25 analysed Details: central venous catheter placed at initial laparotomy. BEE calculated by Harris‐Benedict equation at 1.5 x BEE. Feeding initiated within 12 hours of surgery, except 2 participants for which feeding was initiated within 24 to 36 hours after laparotomy. Formula consisted of a mixture of FraAmine HBC 6.9% (Kendall‐McGaw Laboratories, Irvine, CA, USA) and TrophAmine 6% (Kendall‐McGaw Laboratories, Irvine, CA, USA); provided 2.5% fat and approximately 33% branched chain AAs with NPC to grams nitrogen ratio of 150:1 Caloric intake received, mean (SEM): day 5: 2548.1 (± 85.3) kcal/kg | |
| Outcomes |
| |
| Notes | Funding/declarations: not reported Study dates: February 1985 to September 1987 | |
| Risk of bias | ||
| Bias | Authors' judgement | Support for judgement |
| Random sequence generation (selection bias) | Low risk | Quote: "randomized by computer assignment" |
| Allocation concealment (selection bias) | Low risk | Computer randomization and we assumed that allocation was concealed from investigators. |
| Blinding of participants and personnel (performance bias) | High risk | No details and we assumed investigators made no attempts to blind personnel |
| Blinding of outcome assessment (detection bias) | Unclear risk | No details |
| Blinding of outcome assessment (detection bias) | Low risk | Lack of blinding unlikely to influence outcome data for mortality |
| Incomplete outcome data (attrition bias) | Unclear risk | Large number of losses after randomization. Explanations given, but it was unclear if the number of losses was balanced between groups |
| Selective reporting (reporting bias) | Unclear risk | Details of clinical trial registration not reported. Not possible to make assessment of selective outcome reporting bias |
| Baseline characteristics | Low risk | Appeared comparable |
| Other bias | Low risk | No other sources of bias identified |
| Methods | RCT, multi‐centre, 2‐arm, parallel design | |
| Participants | Total number of randomized participants: 290 Inclusion criteria
Exclusion criteria
Primary diagnoses
Baseline characteristics EN group
PN group
Country: Italy Setting: 33 adult ICUs | |
| Interventions | EN group n = 143; 1 participant met criteria for sepsis and not analysed (baseline characteristics excluded this participant), ITT was used for remaining participants. 142 participants analysed Details: no details of feeding tube placement. Duration of feeding assumed to be 6 days, with mean (SD) time to initiation of feeding 30.1 (± 13.8) hours, started at 10 kcal/kg/day, rising to 25 to 28 kcal/kg/day by the 4th day. Nutritional formula consisted of 55% carbohydrates, 25% fat, 21% protein, 1.3 kcal/mL, containing per 100 mL: L‐arginine 0.8 g, omega‐3 fatty acids, omega‐6 fatty acids 0.7 g, vitamin E 2.9 mg, β‐carotene 0.75 mg, zinc 2.2 mg, and selenium 7 μg. Blood glucose kept < 180 mg/dL Caloric intake received, mean (SD): 20.0 (± 8.3) kcal/kg/day PN group n = 147; 2 participants met criteria for sepsis and not analysed (baseline characteristics excluded this participant), ITT was used for remaining participants. 145 participants analysed Details: mean (SD) time to initiation of feeding 32.0 (± 12.2) hours. Nutrition supplied by pump 24 hours/day, with target of 25 to 28 kcal/kg bodyweight/day. PN not supplemented with EN before day 6. Nutritional formula consisted of 59% carbohydrate, 23% fat, 18% protein, 1.2 kcal/mL Caloric intake received, mean (SD): 23.7 (± 8.6) kcal/kg Authors conducted an adjusted analysis for caloric differences and baseline differences; concluded that differences were not significant | |
| Outcomes |
| |
| Notes | Funding/declarations of interest: partially funded by Abbott Italia. Also unrestricted educational grant from AstraZeneca Italy Study dates: November 1999 to December 2001 Participants stratified to severely septic and non‐severely septic. Early stopping of recruitment, initially of severely septic participants who had increased mortality in EN group, then of non‐severely septic due to low accrual rate | |
| Risk of bias | ||
| Bias | Authors' judgement | Support for judgement |
| Random sequence generation (selection bias) | Low risk | Adequate sequence generation, computer‐generated randomization |
| Allocation concealment (selection bias) | Low risk | Adequate allocation concealment, randomization code generated externally and communicated via telephone to ICUs |
| Blinding of participants and personnel (performance bias) | High risk | No details and we assumed investigators made no attempts to blind personnel |
| Blinding of participants and personnel (performance bias) | Unclear risk | . |
| Blinding of outcome assessment (detection bias) | Low risk | Lack of blinding unlikely to influence outcome data for mortality |
| Incomplete outcome data (attrition bias) | Low risk | 3 participants excluded from analysis and included in the analysis of associated study (Bertolini 2003) due to misdiagnosis. Not included in review analysis |
| Selective reporting (reporting bias) | Unclear risk | Clinical trials registration not reported. Not feasible to assess risk of reporting bias |
| Baseline characteristics | Unclear risk | Some baseline characteristics imbalance. Quote: "The PN group had more men than the iEN group, more patients coming from wards and fewer from emergency rooms, and more with multiple organ failure. Other baseline characteristics were similar in the two arms." According to the adjusted analysis, these baseline differences did not confound the results |
| Other bias | Unclear risk | Blood glucose protocols equivalent between groups. Overall nutritional protocols were not comparable for the first 4 days of the study; an adjusted analysis was planned for this. No other sources of bias identified |
| Methods | RCT, single‐centre, 2‐arm, parallel design | |
| Participants | Total number of randomized participants: 38 Inclusion criteria
Exclusion criteria
Primary diagnosis
Baseline characteristics EN group
PN group
Country: USA Setting: neurosurgical unit | |
| Interventions | EN group n = 18; 0 losses Details: nasogastric tube placement. Feeding started as soon as possible after randomization, when bowel sounds were present and GRV <100 mL/hour. Study authors did not report target rate of delivery. Formula was Vital (Ross Laboratories, Columbus, Ohio, USA) ‐ 42 g protein, 10.8 g fat, 185 g carbohydrates per litre Caloric intake received, mean: 685 calories and 4.0 g nitrogen per day PN group n = 20; 0 losses Details: percutaneous intraclavicular subclavian vein catheter placement. Feeding started within 48 hours of admission. Study authors did not report target rate of delivery. Formula consisted of synthetic AAs 42.5 g/L, 25% dextrose, electrolytes, vitamins, trace elements. 10% soybean oil emulsion 250 to 500 mL/day. Insulin used to control hyperglycaemia as required Caloric intake received, mean: 1750 calories and 10.2 nitrogen per day | |
| Outcomes |
| |
| Notes | Funding/declarations of interest: supported, in part, by a grant from Baxter‐Travenol Laboratories Study dates: not reported | |
| Risk of bias | ||
| Bias | Authors' judgement | Support for judgement |
| Random sequence generation (selection bias) | Unclear risk | Described as randomized but no additional details |
| Allocation concealment (selection bias) | Unclear risk | No evidence of allocation concealment |
| Blinding of participants and personnel (performance bias) | High risk | No details and we assumed investigators made no attempts to blind personnel |
| Blinding of outcome assessment (detection bias) | Unclear risk | No evidence of blinding |
| Blinding of outcome assessment (detection bias) | Low risk | Lack of blinding unlikely to influence outcome data for mortality |
| Incomplete outcome data (attrition bias) | Low risk | No apparent losses |
| Selective reporting (reporting bias) | Unclear risk | Clinical trials registration not reported. Not feasible to assess risk of reporting bias |
| Baseline characteristics | Low risk | Appeared comparable |
| Other bias | Low risk | Insulin use to control hyperglycaemia was described for the PN group and we assumed that this was the same for each group. No other sources of bias identified |
| Methods | RCT, multi‐centre, 2‐arm, parallel design. Pilot study | |
| Participants | Total number of randomized participants: 125 Inclusion criteria
Exclusion criteria:
Primary diagnosis
Baseline characteristics EN group
EN + PN group
Country: Canada, USA, Belgium, France Setting: 11 ICUs | |
| Interventions | EN group n = 73; 0 losses (for clinical outcomes) Details: EN initiated at 20 mL/hour and increased by 20 mL/hour every 4 hours, until goal was reached. A standard polymeric solution with 1.2 (± 0.2) kcal/mL was used to standardize nutrition delivery. Continued for 7 days or until death EN + PN group n = 52; 0 losses (for clinical outcomes) Details: PN given via central IV access. PN solution had similar caloric density to EN solutions (1.2 kcal/mL providing 0.06 to 0.09 g protein/mL). PN initiated at 20 mL/hour and increased by 20 mL/hour every 4 hours, until goal was reached. Continued for 7 days or until death | |
| Outcomes |
| |
| Notes | Funding/declarations of interest: The National Institutes of Health; The Royal Alexandra Hospital Foundation, Edmonton, Canada; PN solutions and funding for assistance with distribution from Baxter Inc Study dates: June 2011 to January 2015 Note: study specifically recruited participants who were underweight or overweight; BMI status was balanced between groups | |
| Risk of bias | ||
| Bias | Authors' judgement | Support for judgement |
| Random sequence generation (selection bias) | Low risk | Centralized web‐based randomization system used to randomize participants to groups |
| Allocation concealment (selection bias) | Low risk | Centralized randomization system used, which would conceal allocation codes |
| Blinding of participants and personnel (performance bias) | High risk | No details and we assumed investigators made no attempts to blind personnel |
| Blinding of outcome assessment (detection bias) | Unclear risk | No evidence of blinding |
| Blinding of outcome assessment (detection bias) | Low risk | Lack of blinding unlikely to influence outcome data for mortality |
| Incomplete outcome data (attrition bias) | Low risk | No losses for clinical outcome data |
| Selective reporting (reporting bias) | Low risk | Prospective clinical trials registration (NCT01206166). Outcomes were reported according to clinical trials documents |
| Baseline characteristics | Low risk | Largely comparable |
| Other bias | Low risk | We identified no other sources of bias. |
| Methods | RCT, single‐centre, 2‐arm, parallel design | |
| Participants | Total number of randomized participants: 45 Inclusion criteria
Exclusion criteria
Primary diagnoses
Baseline characteristics EN group
PN group
Country: China Setting: ICU | |
| Interventions | EN group n = 22; 0 losses Details: oro‐ or naso‐enteral feeding tube, in gastric position with pump infusion. All participants fed PN until randomization. EN nutrition commenced when condition of participant allowed EN feeding. Duration of feeding assumed to be 7 days. Target rate of delivery at 20 to 25 kcal/kg/day with protein 1.5 g/kg/day. Glucose adjusted to 10 mmol/L. If EN could not meet participant's caloric needs, then PN was used as supplement from 4th day. PN group n = 23; 0 losses Details: central venous access. All participants fed PN until randomization and then participants in PN continued with feed. Duration of feeding unclearly reported but assumed to be 7 days. Target rate of delivery as for EN group. Study authors reported no significant difference in the administered total calories between groups (P > 0.05) | |
| Outcomes |
| |
| Notes | Funding/declarations of interest: not reported Study dates: February 2010 to February 2012 | |
| Risk of bias | ||
| Bias | Authors' judgement | Support for judgement |
| Random sequence generation (selection bias) | Unclear risk | Described as randomized but no further detail |
| Allocation concealment (selection bias) | Unclear risk | No details |
| Blinding of participants and personnel (performance bias) | High risk | No details and we assumed that investigators made no attempts to blind personnel |
| Blinding of outcome assessment (detection bias) | Unclear risk | No details |
| Blinding of outcome assessment (detection bias) | Low risk | No details; lack of blinding unlikely to influence outcome data for mortality |
| Incomplete outcome data (attrition bias) | Low risk | No apparent losses |
| Selective reporting (reporting bias) | Unclear risk | Clinical trials registration or prospectively prepared protocol not reported; not feasible to assess this domain |
| Baseline characteristics | Low risk | Appear comparable |
| Other bias | Low risk | Limited information concerning nutritional protocol or glycaemic controls. No other sources of bias identified |
| Methods | RCT, single‐centre, 2‐arm, parallel design | |
| Participants | Total number of randomized participants: 51 Inclusion criteria
Exclusion criteria
Primary diagnosis
Baseline characteristics EN group
PN group
Country: USA Setting: medical centre | |
| Interventions | EN group n = 28; some early participant loss but study authors do not report to which group these participants belonged. 11 participants did not tolerate tube feedings and were switched to PN group; used ITT analysis Details: nasogastric tube feeding, started as soon as feeding tube in place. Feeding assumed to be for duration of study (i.e. 18 days). Target rate of delivery set at 1.75 x Harris Benedict BEE and 1.5 g protein/kg bodyweight/day. Formula consisted of Traumacal (1.5 calories/mL and 22% protein, 40% fat, and 38% carbohydrate) or Ensure Plus (1.5 calories/mL and 14.7% protein, 32% fat, and 53.3% carbohydrate). Participants given metoclopramide 10 mg/6 hours to stimulate gastrointestinal motility. No participant was treated with corticosteroids Cumulative intake of protein, mean (SEM): 1.35 (± 0.12) g/kg/day PN group n = 23; some early participant loss but study authors did not report to which group these participants belonged; use of ITT analysis Details: feeding commenced within 48 hours of randomization. Feeding assumed to be for duration of study (18 days); however, participants were given EN once bowel sounds were present and GRV < 100 mL every 2 hours. Target rate of delivery set at 1.75 x Harris Benedict BEE and 1.5 g protein/kg bodyweight/day. Formula consisted of sterile AA/dextrose solutions, multi‐vitamins, trace elements, and IV lipids. 17% calories as protein, 41% as fat, 42% dextrose. No participant was treated with corticosteroids Cumulative intake of protein, mean (SEM): 0.91 (± 0.09) g/kg/day | |
| Outcomes |
| |
| Notes | Funding/declarations of interest: not reported Study dates: not reported Note: we assumed that study participants were in the ICU, although study authors did not report this in the paper. | |
| Risk of bias | ||
| Bias | Authors' judgement | Support for judgement |
| Random sequence generation (selection bias) | Unclear risk | Described as randomized but no additional details |
| Allocation concealment (selection bias) | Unclear risk | No details |
| Blinding of participants and personnel (performance bias) | High risk | No details and we assumed that there were no attempts to blind personnel |
| Blinding of outcome assessment (detection bias) | Unclear risk | No details |
| Blinding of outcome assessment (detection bias) | Low risk | Lack of blinding unlikely to influence outcome data for mortality |
| Incomplete outcome data (attrition bias) | Unclear risk | 7 participants were entered into the study but due to exclusion criteria were excluded from analysis, included 5 deaths within 4 days. Study authors did not report to which group these participants belonged |
| Selective reporting (reporting bias) | Unclear risk | Clinical trials registration or prospectively prepared protocol not reported; not feasible to assess risk of reporting bias |
| Baseline characteristics | Low risk | Appeared comparable |
| Other bias | Unclear risk | Participants in PN group received more calories until the 9th day of study, and 11 EN participants required PN |
AA: amino acid; ACCP: American College of Chest Physicians; ADL: activities of daily living; APACHE II: Acute Physiology and Chromic Health Evaluation II; ARDS: acute respiratory deficiency syndrome; ASA: American Society of Anesthesiologists; ATI: Abdominal Trauma Index; BEE: basal energy expenditure; BMI: body mass index; COPD: chronic obstructive pulmonary disease; CT: computed tomography; DNR: do not resuscitate; EN: enteral nutrition; F: female; GCS: Glasgow Coma Scale; GRV: gastric residual volume; HCN: high calorie nutrition; ICU: intensive care unit; iEN: immuno‐enteral nutrition; ISS: Injury Severity Score; ITT: intention‐to‐treat; IQR: interquartile range; IV: intravenous; LOS: length of stay; M: male; n: number of participants; NICU: neuro‐intensive care unit; NIHR: National Institute of Health Research; NPC: non‐protein calorie; NRS: nutritional risk score; PN: parenteral nutrition; RCT: randomized controlled trial; RIFLE: scoring system for acute kidney injury, risk, injury, failure, loss, end‐stage renal disease; SAPS: Simplified Acute Physiology Score; SCCM: Society of Critical Care Medicine; SD: standard deviation; SF‐36: 36‐item Short Form; SEM: standard error of the mean; SIRS: systemic inflammatory response syndrome; SOFA: Sequential Organ Failure Assessment; TBI: traumatic brain injury; TEN: total enteral nutrition; TPN: total parenteral nutrition; VAP: ventilator‐acquired pneumonia; WBC: white blood cell.
Characteristics of excluded studies [ordered by study ID]
| Study | Reason for exclusion |
| RCT. Compared EN vs PN. People with acute pancreatitis | |
| RCT. Early‐goal directed nutrition vs EN. Adults in ICU. Participants in the early‐goal directed nutrition group were given EN and PN; however, PN was only given if required and therefore, we excluded this study because some participants in early‐goal directed nutrition group may not have had PN, and this information was not reported by study authors. | |
| RCT. EN vs PN. People with trauma injuries. Study authors did not report that participants were in the ICU. | |
| RCT. EN vs PN feeding. People undergoing oesophagectomy or gastrectomy. Study did not report that participants were in the ICU. | |
| RCT. 3 study groups: EN vs enriched EN vs PN. People undergoing curative surgery for gastric or pancreatic cancer. Study did not report that participants were in the ICU. | |
| RCT. 3 study groups: EN vs enriched EN vs PN. People undergoing curative surgery for gastric or pancreatic cancer. Study did not report that participants were in the ICU. | |
| RCT. PN vs early EN feeding. People undergoing curative surgery for cancer of the upper gastrointestinal tract. Study did not report that participants were in the ICU. | |
| RCT. EN vs PN feeding. People in a burns unit not an ICU | |
| RCT. 3 study groups: EN vs enriched EN vs PN. People undergoing curative surgery for cancer of the pancreatic head. Study did not report that participants were in the ICU. | |
| RCT. People admitted to the ICU. This trial assessed early PN in people with relative contraindications to EN, not all the participants randomized to the control group received EN. | |
| RCT. 3 study groups: EN vs PN vs combined EN with Shenmai injection. People with gastric cancer after surgery. Study aimed to assess postoperative fatigue. Decision made from English abstract; study did not report that participants were in the ICU. | |
| RCT. EN vs PN. Participants were in the ICU but only for 1 day as part of standard management of participants after thoracic oesophagectomy. Feeding by EN or PN continued on the ward for 6 postoperative days. | |
| RCT. Compared EN vs PN. People with acute myeloid leukaemia. Decision made from abstract as we were unable to source the full text; study did not report that participants were in the ICU | |
| RCT. EN vs PN. People after gastrectomy with gastric cancer. Study authors did not report that participants were in the ICU. | |
| RCT. 4 study groups: EN vs immuno‐modulating EN vs PN vs immuno‐modulating PN. Well‐nourished people undergoing resection for gastrointestinal cancer. Study did not report that participants were in the ICU. | |
| RCT. 4 study groups: EN vs immuno‐modulating EN vs PN vs immuno‐modulating PN. Malnourished people undergoing resection for gastrointestinal cancer. Study did not report that participants were in the ICU. | |
| RCT. Compared enteral nutrition with PN. People undergoing surgical intervention for peritonitis. Study setting was reported as a surgical unit, not an ICU. | |
| RCT. Compared EN vs PN. People treated in a surgical clinic. Study did not report that participants were in the ICU. | |
| RCT. Compared EN vs PN. People with abdominal trauma. Study did not report that participants were in the ICU. | |
| RCT. > 50% of participants had pancreatitis | |
| RCT. Compared EN vs PN. People undergoing upper gastrointestinal surgery. Study did not report that participants were in the ICU. | |
| RCT. Compared EN vs PN. People undergoing surgery for laryngeal or pharyngeal cancer. Study did not report that participants were in the ICU. | |
| RCT. Compared EN vs PN. People undergoing gastrectomy for gastric cancer. Study did not report that participants were in the ICU. | |
| RCT. Compared EN vs PN. People with head trauma or need for craniotomy. Study did not report that participants were in the ICU. | |
| RCT. Compared EN vs PN. People undergoing surgery for rectal carcinoma. Study did not report that participants were in the ICU. | |
| RCT. Compared EN vs PN. People requiring adjuvant nutritional support but study authors reported that only 37.4% were in the ICU and we excluded the study as this was too few and the data for participants in the ICU were not separate. | |
| RCT. Compared EN vs PN. People undergoing oesophagectomy for oesophageal cancer. Study did not report that participants were in the ICU. | |
| RCT. Compared EN vs PN. People undergoing surgery for colorectal cancer. Decision made from English abstract only; study did not report that participants were in the ICU. | |
| RCT. Compared EN vs PN. People in the ICU with severe trauma or severe postoperative complications. Published only as an abstract; insufficient information on outcomes and not possible to use data. Abstract was from 1992, and unlikely to be published as a full report. | |
| RCT. Compared EN vs PN. People in the ICU after pericardial devascularization. We noted that participants in the EN group were all given PN as a supplement for the first 3 days and, therefore, we excluded this study. | |
| RCT. Compared EN vs PN. People with burn‐induced fungal infection. Study did not report that participants were in the ICU. | |
| RCT. Compared EN vs PN. People with acute stroke. Study did not report that participants were in the ICU. |
EN: enteral nutrition; ICU: intensive care unit; PN: parenteral nutrition; RCT: randomized controlled trial.
Characteristics of studies awaiting assessment [ordered by study ID]
| Methods | RCT |
| Participants | 77 people in a surgical ICU undergoing curative surgery for gastric or pancreatic cancer. Participants randomized into 3 groups: standard EN formula (n = 24), enriched EN formula with arginine, RNA, and omega‐3 fatty acids (n = 26), isocoloric TPN formula (n = 27) |
| Interventions | EN formula vs enriched EN formula vs isonitrogen‐isocaloric parenteral formula. EN started 12 hours following surgery. Infusion rate was gradually increased until full amount was achieved on postoperative day 4. |
| Outcomes |
Measurements were taken on postoperative days 1 and 8 |
| Notes | We were unable to source the full text for this study and the abstract contained insufficient information to decide eligibility. |
| Methods | RCT |
| Participants | 61 people in the NICU |
| Interventions | EN vs early PN and vs supplemental PN |
| Outcomes |
|
| Notes | Abstract only with insufficient information to justify inclusion |
| Methods | RCT |
| Participants | 147 elderly people in a RICU |
| Interventions | EN + PN vs EN vs PN |
| Outcomes |
|
| Notes | We were unable to source the full text for this study and the abstract contained insufficient information to decide eligibility. |
| Methods | RCT |
| Participants | 15 participants in each group |
| Interventions | Nutrition delivered continuously for 5 days to provide daily energy supply corresponding to current resting energy expenditure as determined by indirect calorimetry. Formula consisted of 35% of total energy requirements as lipids, 15% as proteins (maximum 1.2 g/kg ideal bodyweight/day), and 50% as dextrose. There was a tight glucose control strategy to avoid hyperglycaemia. |
| Outcomes |
|
| Notes | Trial was listed as completed in clinical trials register. Awaiting full publication of report to assess inclusion |
| Methods | RCT |
| Participants | Adults, ≥ 18 years of age, requiring mechanical ventilation for > 48 hours, treated with a vasoactive drug via a CVC, eligible for nutritional support started within 24 hours after endotracheal intubation (or within 24 hours after ICU admission if intubation occurred before ICU admission) |
| Interventions | Early EN formula vs PN formula. EN group given EN for 8 days, then supplemental PN if required. PN group given PN for at least 72 hours, then weaned to EN if haemodynamically stable |
| Outcomes |
|
| Notes | Clinical trials registration ID: NCT0180299 Study terminated early due to Data Safety and Monitoring Board recommendation. Report of results prior to termination not yet published |
| Methods | Enrolled participants allocated to supplemental PN (via CVC) for 7 days post randomization or usual care with EN |
| Participants | Participants admitted to the ICU within 48‐72 hours, mechanically ventilated, ≥ 16 years of age, central venous access suitable for PN solution, ≥ 1 organ system failure related to their acute illness, renal dysfunction, intracranial pressure monitor or ventricular drain in situ, currently receiving extracorporeal membrane, currently has a ventricular assist device |
| Interventions | EN and supplemental PN formula vs standard EN formula |
| Outcomes |
|
| Notes | Clinical trials registration ID: NCT01847534 |
| Methods | RCT |
| Participants | 171 people undergoing major abdominal and urological surgery for neoplastic pathology. Aim was to assess the effectiveness and clinical outcomes of total PN. |
| Interventions | Total PN vs early EN vs early immuno‐EN |
| Outcomes |
|
| Notes | We were unable to source the full text of this study, and its abstract contained insufficient information to decide whether participants were in the ICU. |
| Methods | RCT |
| Participants | 148 participants in the ICU |
| Interventions | EN vs PN |
| Outcomes |
|
| Notes | Reported as an abstract only. Study authors did not report denominator figures for each group, and, therefore, there were no useable data. |
| Methods | RCT |
| Participants | 42 critically ill people |
| Interventions | EN vs PN vs control |
| Outcomes |
|
| Notes | English abstract did not report review outcomes. Requires translation to assess full eligibility |
| Methods | RCT |
| Participants | 335 people who were expected to survive for > 7 days and were admitted to multiple Chinese ICUs |
| Interventions | Supplemented EN vs supplemented PN |
| Outcomes |
|
| Notes | This study was published only as an abstract that contained insufficient information to decide eligibility. |
| Methods | RCT |
| Participants | 63 liver transplant recipients |
| Interventions | Early EN formula vs PN formula. EN started within 48 hours of transplant surgery |
| Outcomes |
|
| Notes | This study was published only as an abstract that contained insufficient information to decide eligibility |
CVC: central venous catheter; EN: enteral nutrition; HDL: high‐density lipoprotein; ICU: intensive care unit; n: number of participants; NICU: neuro‐intensive care unit; PN: parenteral nutrition; RCT: randomized controlled trial; RICU: respiratory intensive care unit; RNA: ribonucleic acid; SOFA: sequential organ failure assessment; TPN: total parenteral nutrition; VAP: ventilator‐associated pneumonia.
Characteristics of ongoing studies [ordered by study ID]
| Trial name or title | Impact of early parenteral nutrition completing enteral nutrition in adult critically ill patients |
| Methods | Participants randomly divided into EN or EN and early PN group. Multi‐centre study |
| Participants | Inclusion criteria
Exclusion criteria
|
| Interventions | EN group: withholding PN during the first week of ICU stay. Participants will receive exclusively EN. If EN is insufficient after 7th day of ICU stay, PN will be started. EN and early PN: PN will be started the morning of 3rd day of ICU stay. Amount of PN will be calculated to cover the caloric needs of the participant, based on EN energy intake during the previous 24 hours. |
| Outcomes |
|
| Starting date | August 2007 |
| Contact information | Greet Van den Berghe, Katholieke Universiteit Leuven |
| Notes | Clinical trials registration ID: NCT00512122 |
| Trial name or title | Impact of supplemental parenteral nutrition in ICU patients on metabolic, inflammatory and immune responses (SPN2) |
| Methods | RCT. Trial aims to investigate the underlying carbohydrate and protein metabolism changes, as well as the immune and inflammatory modulations associated with these interventions. |
| Participants | Inclusion criteria
Exclusion criteria
|
| Interventions | EN group: EN to be progressed as soon as possible to energy target measured on day 3, and verified on day 4, using the usual facilitators (prokinetics) Supplemental PN group: addition of supplemental PN to complete the gap between energy delivered by EN feeding and energy target measured on day 4 |
| Outcomes |
|
| Starting date | April 2014 |
| Contact information | Mette M Berger, Prof, Centre Hospitalier Universitaire Vaudois |
| Notes | Clinical trials registration ID: NCT02022813 |
BMI: body mass index; DNR: do not resuscitate; EN: enteral nutrition; EPaNIC: early parenteral nutrition completing enteral nutrition in adult critically ill patients; ICU: intensive care unit; NRS: nutritional risk screening; PN: parenteral nutrition; SOFA: sequential organ failure assessment; SPN2: supplemental parenteral nutrition 2.
Data and analyses
| Outcome or subgroup title | No. of studies | No. of participants | Statistical method | Effect size |
| 1 In‐hospital mortality Show forest plot | 6 | 361 | Risk Ratio (M‐H, Fixed, 95% CI) | 1.19 [0.80, 1.77] |
| Analysis 1.1 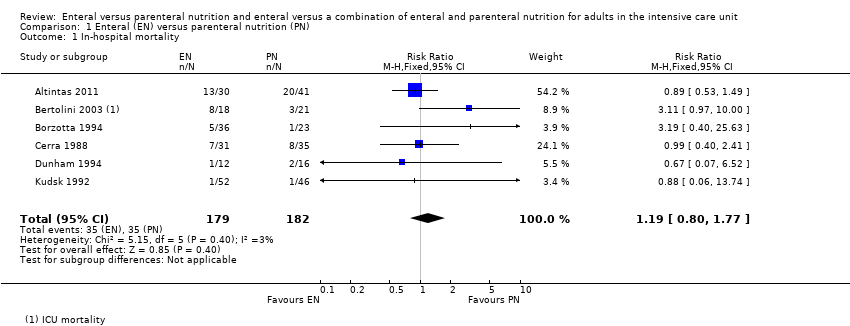 Comparison 1 Enteral (EN) versus parenteral nutrition (PN), Outcome 1 In‐hospital mortality. | ||||
| 2 Mortality at 30 days Show forest plot | 11 | 3148 | Risk Ratio (M‐H, Fixed, 95% CI) | 1.02 [0.92, 1.13] |
| Analysis 1.2  Comparison 1 Enteral (EN) versus parenteral nutrition (PN), Outcome 2 Mortality at 30 days. | ||||
| 3 Mortality at 90 days Show forest plot | 3 | 2461 | Risk Ratio (M‐H, Fixed, 95% CI) | 1.06 [0.95, 1.17] |
| Analysis 1.3  Comparison 1 Enteral (EN) versus parenteral nutrition (PN), Outcome 3 Mortality at 90 days. | ||||
| 4 Aspiration Show forest plot | 2 | 2437 | Risk Ratio (M‐H, Fixed, 95% CI) | 1.53 [0.46, 5.03] |
| Analysis 1.4  Comparison 1 Enteral (EN) versus parenteral nutrition (PN), Outcome 4 Aspiration. | ||||
| 5 Pneumothorax Show forest plot | 2 | 2437 | Risk Ratio (M‐H, Fixed, 95% CI) | 1.46 [0.19, 11.22] |
| Analysis 1.5  Comparison 1 Enteral (EN) versus parenteral nutrition (PN), Outcome 5 Pneumothorax. | ||||
| 6 Hyperglycaemia Show forest plot | 2 | 2437 | Risk Ratio (M‐H, Fixed, 95% CI) | 0.57 [0.35, 0.93] |
| Analysis 1.6  Comparison 1 Enteral (EN) versus parenteral nutrition (PN), Outcome 6 Hyperglycaemia. | ||||
| 7 Vomiting Show forest plot | 3 | 2525 | Risk Ratio (M‐H, Fixed, 95% CI) | 3.42 [1.15, 10.16] |
| Analysis 1.7 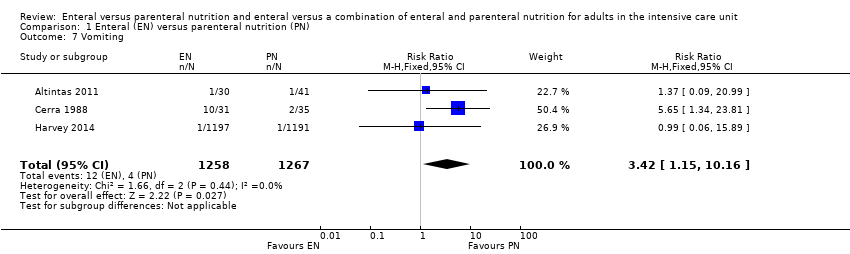 Comparison 1 Enteral (EN) versus parenteral nutrition (PN), Outcome 7 Vomiting. | ||||
| 8 Diarrhoea Show forest plot | 6 | 363 | Risk Ratio (M‐H, Fixed, 95% CI) | 2.17 [1.72, 2.75] |
| Analysis 1.8 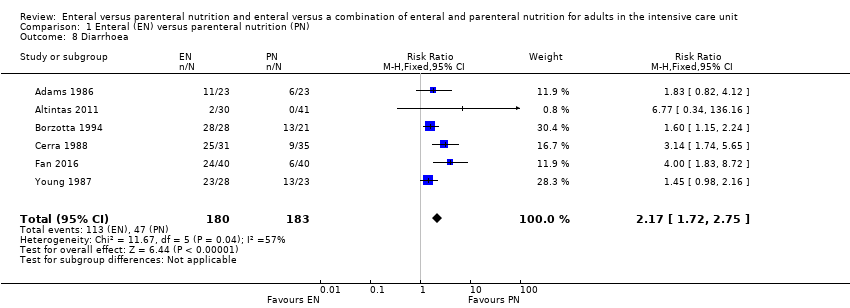 Comparison 1 Enteral (EN) versus parenteral nutrition (PN), Outcome 8 Diarrhoea. | ||||
| 9 Abdominal distension Show forest plot | 3 | 2505 | Risk Ratio (M‐H, Fixed, 95% CI) | 1.53 [0.34, 6.96] |
| Analysis 1.9  Comparison 1 Enteral (EN) versus parenteral nutrition (PN), Outcome 9 Abdominal distension. | ||||
| 10 Sepsis Show forest plot | 7 | 361 | Risk Ratio (M‐H, Fixed, 95% CI) | 0.59 [0.37, 0.95] |
| Analysis 1.10  Comparison 1 Enteral (EN) versus parenteral nutrition (PN), Outcome 10 Sepsis. | ||||
| 11 Pneumonia Show forest plot | 7 | 415 | Risk Ratio (M‐H, Fixed, 95% CI) | 1.10 [0.82, 1.48] |
| Analysis 1.11  Comparison 1 Enteral (EN) versus parenteral nutrition (PN), Outcome 11 Pneumonia. | ||||
| 12 Intra‐abdominal infection Show forest plot | 3 | 202 | Risk Ratio (M‐H, Fixed, 95% CI) | 0.26 [0.07, 0.89] |
| Analysis 1.12  Comparison 1 Enteral (EN) versus parenteral nutrition (PN), Outcome 12 Intra‐abdominal infection. | ||||
| 13 Wound infection Show forest plot | 3 | 155 | Risk Ratio (M‐H, Fixed, 95% CI) | 1.45 [0.55, 3.82] |
| Analysis 1.13  Comparison 1 Enteral (EN) versus parenteral nutrition (PN), Outcome 13 Wound infection. | ||||
| 14 Urinary tract infection Show forest plot | 3 | 160 | Risk Ratio (M‐H, Fixed, 95% CI) | 1.48 [0.65, 3.40] |
| Analysis 1.14  Comparison 1 Enteral (EN) versus parenteral nutrition (PN), Outcome 14 Urinary tract infection. | ||||
| 15 In‐hospital mortality: gastrointestinal (GI) medical/surgical vs non‐GI medical/surgical Show forest plot | 6 | 361 | Risk Ratio (M‐H, Fixed, 95% CI) | 1.19 [0.80, 1.77] |
| Analysis 1.15 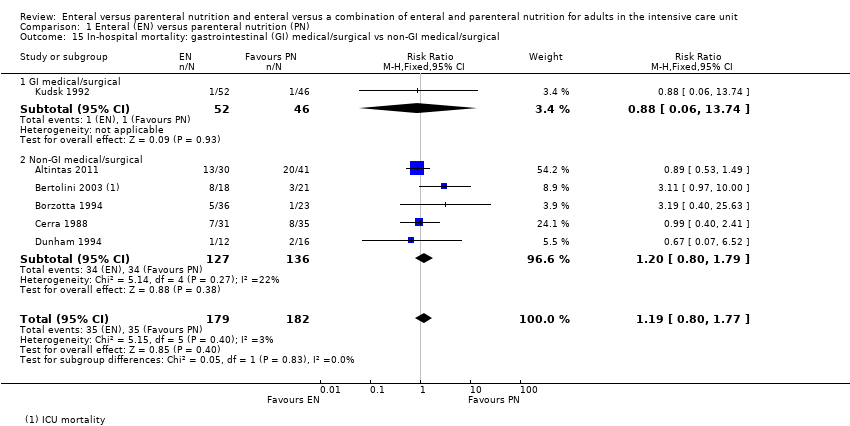 Comparison 1 Enteral (EN) versus parenteral nutrition (PN), Outcome 15 In‐hospital mortality: gastrointestinal (GI) medical/surgical vs non‐GI medical/surgical. | ||||
| 15.1 GI medical/surgical | 1 | 98 | Risk Ratio (M‐H, Fixed, 95% CI) | 0.88 [0.06, 13.74] |
| 15.2 Non‐GI medical/surgical | 5 | 263 | Risk Ratio (M‐H, Fixed, 95% CI) | 1.20 [0.80, 1.79] |
| 16 Mortality at 30 days: GI medical/surgical vs non‐GI medical/surgical Show forest plot | 10 | 3068 | Risk Ratio (M‐H, Fixed, 95% CI) | 1.03 [0.93, 1.14] |
| Analysis 1.16  Comparison 1 Enteral (EN) versus parenteral nutrition (PN), Outcome 16 Mortality at 30 days: GI medical/surgical vs non‐GI medical/surgical. | ||||
| 16.1 GI medical/surgical | 1 | 60 | Risk Ratio (M‐H, Fixed, 95% CI) | 0.67 [0.12, 3.71] |
| 16.2 Non‐GI medical/surgical | 9 | 3008 | Risk Ratio (M‐H, Fixed, 95% CI) | 1.03 [0.93, 1.15] |
| Outcome or subgroup title | No. of studies | No. of participants | Statistical method | Effect size |
| 1 In‐hospital mortality Show forest plot | 5 | 5111 | Risk Ratio (M‐H, Fixed, 95% CI) | 0.99 [0.84, 1.16] |
| Analysis 2.1 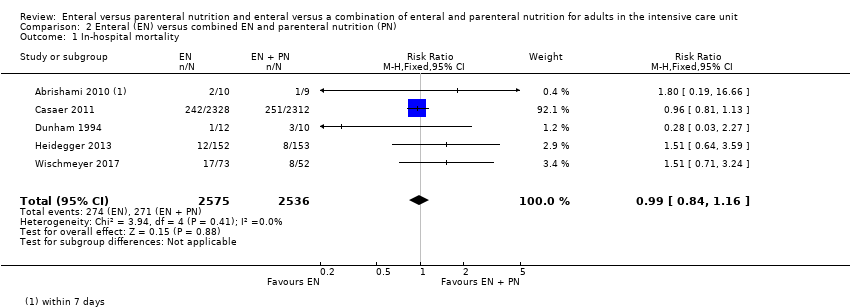 Comparison 2 Enteral (EN) versus combined EN and parenteral nutrition (PN), Outcome 1 In‐hospital mortality. | ||||
| 2 Mortality at 30 days Show forest plot | 3 | 409 | Risk Ratio (M‐H, Fixed, 95% CI) | 1.64 [1.06, 2.54] |
| Analysis 2.2  Comparison 2 Enteral (EN) versus combined EN and parenteral nutrition (PN), Outcome 2 Mortality at 30 days. | ||||
| 3 Mortality at 90 days Show forest plot | 2 | 4760 | Risk Ratio (M‐H, Fixed, 95% CI) | 1.00 [0.86, 1.18] |
| Analysis 2.3  Comparison 2 Enteral (EN) versus combined EN and parenteral nutrition (PN), Outcome 3 Mortality at 90 days. | ||||
| 4 Feeding tube obstruction Show forest plot | 2 | 4662 | Risk Ratio (M‐H, Fixed, 95% CI) | 0.96 [0.70, 1.32] |
| Analysis 2.4 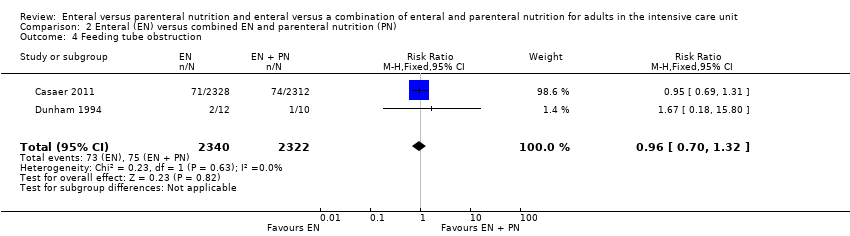 Comparison 2 Enteral (EN) versus combined EN and parenteral nutrition (PN), Outcome 4 Feeding tube obstruction. | ||||
| 5 Diarrhoea Show forest plot | 4 | Risk Ratio (M‐H, Fixed, 95% CI) | Totals not selected | |
| Analysis 2.5 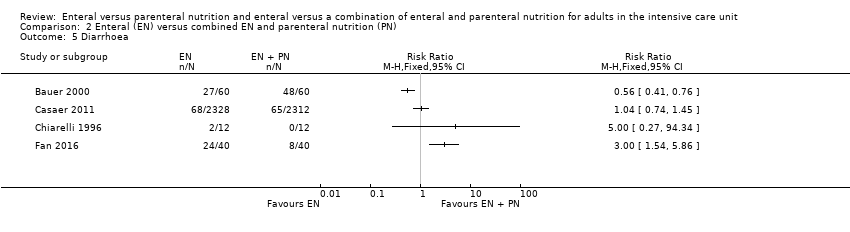 Comparison 2 Enteral (EN) versus combined EN and parenteral nutrition (PN), Outcome 5 Diarrhoea. | ||||
| 6 Pneumonia Show forest plot | 2 | 205 | Risk Ratio (M‐H, Fixed, 95% CI) | 1.40 [0.91, 2.15] |
| Analysis 2.6  Comparison 2 Enteral (EN) versus combined EN and parenteral nutrition (PN), Outcome 6 Pneumonia. | ||||
| 7 Wound infection Show forest plot | 2 | 4765 | Risk Ratio (M‐H, Fixed, 95% CI) | 0.67 [0.50, 0.92] |
| Analysis 2.7 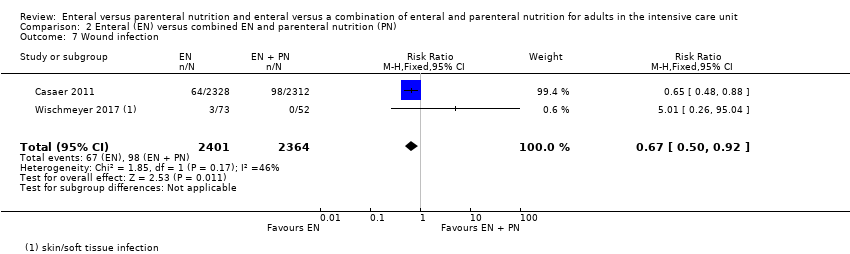 Comparison 2 Enteral (EN) versus combined EN and parenteral nutrition (PN), Outcome 7 Wound infection. | ||||
| 8 Bloodstream infection Show forest plot | 2 | 4765 | Risk Ratio (M‐H, Fixed, 95% CI) | 0.81 [0.66, 1.01] |
| Analysis 2.8  Comparison 2 Enteral (EN) versus combined EN and parenteral nutrition (PN), Outcome 8 Bloodstream infection. | ||||
| 9 Urinary tract infection Show forest plot | 3 | 4885 | Risk Ratio (M‐H, Fixed, 95% CI) | 0.87 [0.65, 1.17] |
| Analysis 2.9  Comparison 2 Enteral (EN) versus combined EN and parenteral nutrition (PN), Outcome 9 Urinary tract infection. | ||||
| 10 Airway infection Show forest plot | 3 | Risk Ratio (M‐H, Fixed, 95% CI) | Totals not selected | |
| Analysis 2.10 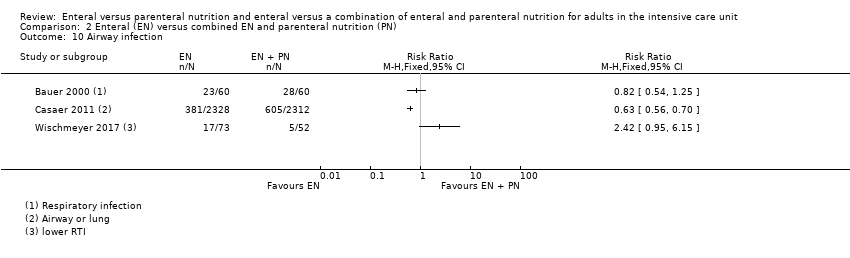 Comparison 2 Enteral (EN) versus combined EN and parenteral nutrition (PN), Outcome 10 Airway infection. | ||||

Flow diagram of search strategy.

Risk of bias graph: review authors' judgements about each risk of bias item presented as percentages across all included studies. Blank spaces in tables indicated that study authors did not report the review outcome.

Risk of bias summary: review authors' judgements about each risk of bias item for each included study. Blank spaces in tables indicate that study authors did not report the review outcome.

Comparison 1 Enteral (EN) versus parenteral nutrition (PN), Outcome 1 In‐hospital mortality.

Comparison 1 Enteral (EN) versus parenteral nutrition (PN), Outcome 2 Mortality at 30 days.

Comparison 1 Enteral (EN) versus parenteral nutrition (PN), Outcome 3 Mortality at 90 days.
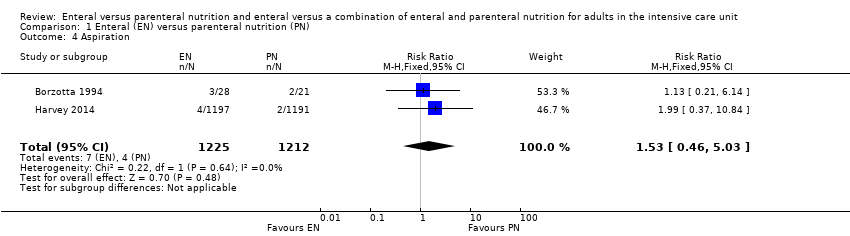
Comparison 1 Enteral (EN) versus parenteral nutrition (PN), Outcome 4 Aspiration.
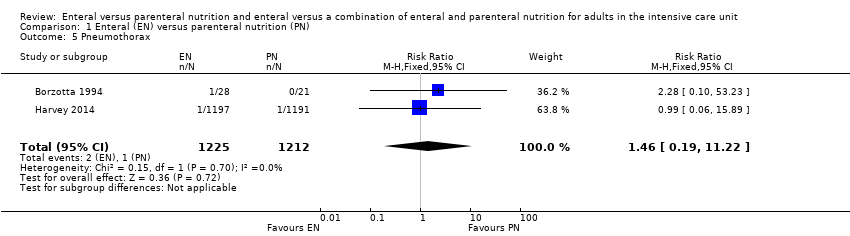
Comparison 1 Enteral (EN) versus parenteral nutrition (PN), Outcome 5 Pneumothorax.

Comparison 1 Enteral (EN) versus parenteral nutrition (PN), Outcome 6 Hyperglycaemia.

Comparison 1 Enteral (EN) versus parenteral nutrition (PN), Outcome 7 Vomiting.

Comparison 1 Enteral (EN) versus parenteral nutrition (PN), Outcome 8 Diarrhoea.

Comparison 1 Enteral (EN) versus parenteral nutrition (PN), Outcome 9 Abdominal distension.
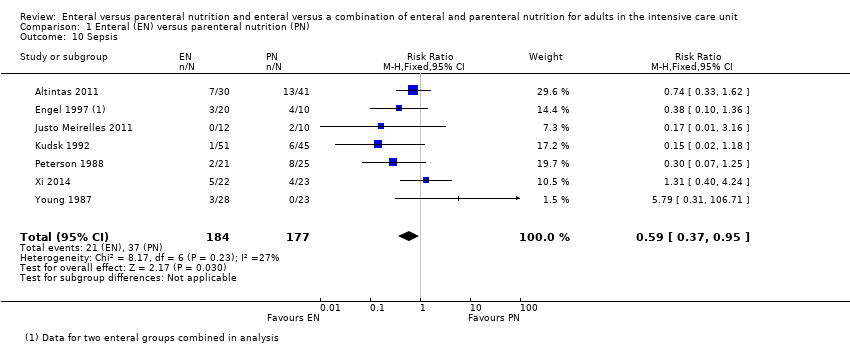
Comparison 1 Enteral (EN) versus parenteral nutrition (PN), Outcome 10 Sepsis.
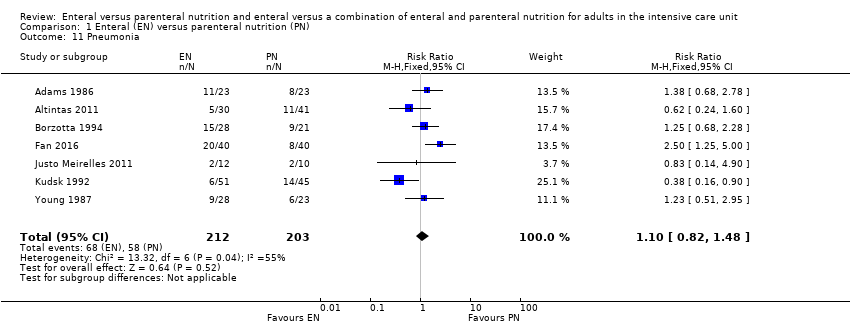
Comparison 1 Enteral (EN) versus parenteral nutrition (PN), Outcome 11 Pneumonia.

Comparison 1 Enteral (EN) versus parenteral nutrition (PN), Outcome 12 Intra‐abdominal infection.
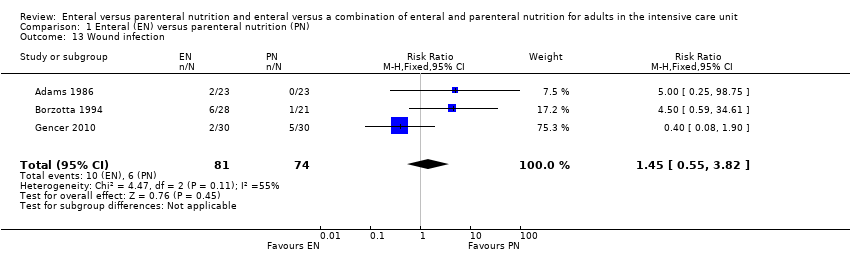
Comparison 1 Enteral (EN) versus parenteral nutrition (PN), Outcome 13 Wound infection.

Comparison 1 Enteral (EN) versus parenteral nutrition (PN), Outcome 14 Urinary tract infection.

Comparison 1 Enteral (EN) versus parenteral nutrition (PN), Outcome 15 In‐hospital mortality: gastrointestinal (GI) medical/surgical vs non‐GI medical/surgical.
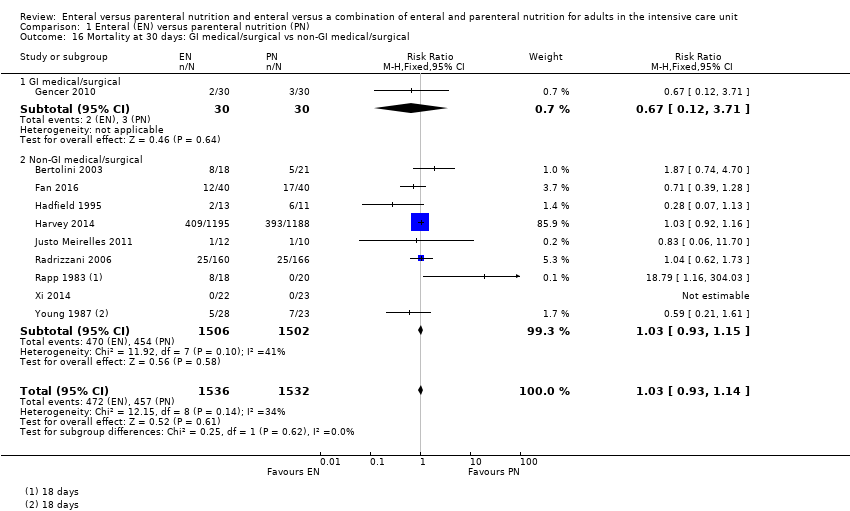
Comparison 1 Enteral (EN) versus parenteral nutrition (PN), Outcome 16 Mortality at 30 days: GI medical/surgical vs non‐GI medical/surgical.

Comparison 2 Enteral (EN) versus combined EN and parenteral nutrition (PN), Outcome 1 In‐hospital mortality.

Comparison 2 Enteral (EN) versus combined EN and parenteral nutrition (PN), Outcome 2 Mortality at 30 days.

Comparison 2 Enteral (EN) versus combined EN and parenteral nutrition (PN), Outcome 3 Mortality at 90 days.

Comparison 2 Enteral (EN) versus combined EN and parenteral nutrition (PN), Outcome 4 Feeding tube obstruction.

Comparison 2 Enteral (EN) versus combined EN and parenteral nutrition (PN), Outcome 5 Diarrhoea.

Comparison 2 Enteral (EN) versus combined EN and parenteral nutrition (PN), Outcome 6 Pneumonia.

Comparison 2 Enteral (EN) versus combined EN and parenteral nutrition (PN), Outcome 7 Wound infection.

Comparison 2 Enteral (EN) versus combined EN and parenteral nutrition (PN), Outcome 8 Bloodstream infection.

Comparison 2 Enteral (EN) versus combined EN and parenteral nutrition (PN), Outcome 9 Urinary tract infection.

Comparison 2 Enteral (EN) versus combined EN and parenteral nutrition (PN), Outcome 10 Airway infection.
| Enteral versus parenteral nutrition for adults in the intensive care unit | |||||
| Patient or population: critically ill adults admitted to the ICU for trauma, emergency, or surgical care; population excluded people with acute pancreatitis | |||||
| Outcomes | Anticipated absolute effects* (95% CI) | Relative effect | Number of participants | Certainty of the evidence | |
| Risk with EN | Risk with PN | ||||
| Mortality | In‐hospital mortality | RR 1.19 | 361 | ⊕⊕⊝⊝ | |
| Study population | |||||
| 229 per 1000 | 192 per 1000 | ||||
| Mortality within 30 days | RR 1.02 (0.92 to 1.13) | 3148 | ⊕⊕⊝⊝ | ||
| Study population | |||||
| 304 per 1000 | 298 per 1000 | ||||
| Mortality within 90 days | RR 1.06 | 2461 | ⊕⊝⊝⊝ | ||
| Study population | |||||
| 393 per 1000 | 371 per 1000 | ||||
| Mortality within 180 days | RR 0.33 (0.04 to 2.97) | 46 | ⊕⊝⊝⊝ | ||
| Study population | |||||
| 130 per 1000 | 43 per 1000 (5 in 387) | ||||
| Number of ICU‐free days up to day 28 | – | – | – | – | Not measured |
| Number of ventilator‐free days up to day 28 | Mean number of ventilator‐free days: 14.2 (SD ± 12.2) | Mean difference 0 days (0.97 fewer to 0.97 more) | N/A | 2388 | ⊕⊝⊝⊝ |
| Adverse events: aspiration (as reported by study authors at end of study follow‐up period) | Study population | RR 1.53 | 2437 | ⊕⊝⊝⊝ | |
| 5 per 1000 | 3 per 1000 | ||||
| Adverse events: sepsis (as reported by study authors at end of study follow‐up period) | Study population | RR 0.59 (0.37 to 0.95) | 361 | ⊕⊕⊝⊝ | |
| 123 per 1000 | 209 per 1000 | ||||
| Adverse events: pneumonia (as reported by study authors at end of study follow‐up period) | Study population | RR 1.10 (0.82 to 1.48) | 415 | ⊕⊕⊝⊝ | |
| 314 per 1000 | 268 per 1000 | ||||
| Adverse events: vomiting (as reported by study authors at end of study follow‐up period) | Study population | RR 3.42 | 2525 | ⊕⊝⊝⊝ | |
| 11 per 1000 | 3 per 1000 | ||||
| *The risk in the intervention group (and its 95% confidence interval) is based on the assumed risk in the comparison group and the relative effect of the intervention (and its 95% CI). CI: confidence interval; EN: enteral nutrition; ICU: intensive care unit; N/A: not applicable; PN: parenteral nutrition; RR: risk ratio; SD: standard deviation. | |||||
| GRADE Working Group grades of evidence | |||||
| aAll studies had a high risk of performance bias; downgraded one level for study limitations. Studies included a variety of primary diagnoses and evidence was less direct; downgraded one level for indirectness. bAll studies had a high risk of performance bias; downgraded one level for study limitations. Studies included a variety of primary diagnoses and study designs and evidence were less direct; downgraded one level for indirectness. cAll studies had a high risk of performance bias; downgraded one level for study limitations. Studies included a variety of primary diagnoses and study designs and evidence were less direct; downgraded one level for indirectness. Few studies and one included study had a large number of participants relative to other included studies; downgraded one level for imprecision. dData from only one study that had a high risk of performance bias; downgraded one level for study limitations and two levels for imprecision. eAll studies had a high risk of performance bias; downgraded one level for study limitations. Studies included a variety of primary diagnoses and evidence was less direct; downgraded one level for indirectness. Few studies and one included study had a large number of participants relative to other included studies; downgraded one level for imprecision. fAll studies had a high risk of performance bias; downgraded one level for study limitations. Studies included a variety of primary diagnoses and evidence was less direct; downgraded one level for indirectness. gAll studies had a high risk of performance bias; downgraded one level for study limitations. Studies included a variety of primary diagnoses and study designs and evidence were less direct; downgraded one level for indirectness. Few studies, with very few events, and one included study had a large number of participants relative to other included studies; downgraded one level for imprecision. | |||||
| Enteral versus enteral and parenteral nutrition for adults in the intensive care unit | |||||
| Patient or population: critically ill adults admitted to the ICU for trauma, emergency, or post‐surgical care; population excludes participants with acute pancreatitis | |||||
| Outcomes | Anticipated absolute effects* (95% CI) | Relative effect | Number of participants | Certainty of the evidence | |
| Risk with EN | Risk with EN + PN | ||||
| Mortality | In‐hospital mortality | RR 0.99 (0.84 to 1.16) | 5111 | ⊕⊕⊝⊝ | |
| Study population | |||||
| 106 per 1000 | 107 per 1000 | ||||
| Mortality within 30 days | RR 1.64 (1.06 to 2.54) | 409 | ⊕⊝⊝⊝ | ||
| Study population | |||||
| 216 per 1000 | 132 per 1000 | ||||
| Mortality within 90 days | RR 1.00 (0.86 to 1.18) | 4760 (2 studies) | ⊕⊕⊝⊝ | ||
| Study population | |||||
| 115 per 1000 (99 to 135) | 115 per 1000 | ||||
| Mortality within 180 days | RR 1.00 | 120 (1 RCT) | ⊕⊝⊝⊝ | ||
| Study population | |||||
| 400 per 1000 (260 to 620) | 400 per 1000 | ||||
| Number of ICU‐free days up to day 28 | – | – | – | – | Not measured |
| Number of ventilator‐free days up to day 28 | – | – | – | – | Not measured |
| Adverse events: aspiration (as reported by study authors at end of study follow‐up period) | – | – | – | – | Not measured |
| Adverse events: sepsis (as reported by study authors at end of study follow‐up period) | – | – | – | – | Not measured |
| Adverse events: pneumonia (as reported by study authors at end of study follow‐up period) | 350 per 1000 (228 to 538) | 250 per 1000 | RR 1.40 (0.91 to 2.15) | 205 (2 studies) | ⊕⊝⊝⊝ Very lowd |
| Adverse events: vomiting (as reported by study authors at end of study follow‐up period) | – | – | – | – | Not measured |
| *The risk in the intervention group (and its 95% confidence interval) is based on the assumed risk in the comparison group and the relative effect of the intervention (and its 95% CI). CI: confidence interval; EN: enteral nutrition; ICU: intensive care unit; PN: parenteral nutrition; RCT: randomized controlled trial; RR: risk ratio. | |||||
| GRADE Working Group grades of evidence | |||||
| aAll studies had high risk of performance bias; downgraded one level for study limitations. Studies included a variety of primary diagnoses and evidence was less direct; downgraded one level for indirectness. bAll studies had high risk of performance bias; downgraded one level for study limitations. Studies included a variety of primary diagnoses and evidence was less direct; downgraded one level for indirectness. Few studies with increased risk of imprecision; downgraded one level. cBoth studies had high risk of performance bias; downgraded one level for study limitations. Studies included a variety of primary diagnoses and evidence was less direct; downgraded one level for indirectness. dData from only one study that had a high risk of performance bias; downgraded one level for study limitations and two levels for imprecision. | |||||
| Study ID | Description of event | EN group (n/N) | PN group (n/N) |
| Mechanical events | |||
| Clogged jejunostomy tube | 9/23 | N/A | |
| Disconnected line | N/A | 1/23 | |
| Line eroded into right upper lobe bronchus | N/A | 1/23 | |
| Malfunctioned line | N/A | 7/23 | |
| Transpyloric tube occlusion | 2/12 | 0/15 | |
| Failure to intubate | 0/12 | 0/15 | |
| Withdrawal of tube by participant | 1/12 | N/A | |
| Metabolic events | |||
| Hepatic failure | 1/23 | 1/23 | |
| Acute renal failure | 1/23 | 1/23 | |
| Pancreatitis | 2/23 | 1/23 | |
| Hypoproteinaemia | 22/40 | 32/40 | |
| Electrolyte disturbance | 5/1197 | 8/1191 | |
| Gastrointestinal events | |||
| Nausea, cramps, bloating | 19/23 | 16/23 | |
| Gastrointestinal bleeding | 0/23 | 0/23 | |
| Gastric reflux | 0/12 | 0/15 | |
| Ileus | 1/12 | 0/15 | |
| Small bowel ileus | 0/12 | 1/15 | |
| Stress ulcer | 7/40 | 19/40 | |
| Elevated liver enzymes | 7/1197 | 3/1191 | |
| Jaundice | 1/1197 | 1/1191 | |
| Ischaemic bowel | 0/1197 | 1/1191 | |
| Anastomotic leak | 2/22 | 6/23 | |
| Infective events | |||
| Persistent fever without obvious cause | 1/23 | 5/23 | |
| Catheter infection | 2/30 | 4/41 | |
| Meningitis | 2/28 | 0/21 | |
| Sinusitis | 3/28 | 6/21 | |
| Bronchitis | 6/28 | 6/28 | |
| Clostridium difficile | 2/28 | 4/21 | |
| Peritonitis | 0/28 | 1/21 | |
| Intracranial infection | 7/40 | 13/40 | |
| Pyaemia | 3/40 | 19/40 | |
| Pulmonary infection | 2/30 | 2/30 | |
| Empyema | 1/51 | 4/45 | |
| Aspiration pneumonia | 9/28 | 3/23 | |
| Infection (type of infection not described) | 5/28 | 4/23 | |
| EN: enteral nutrition; n: number of participants with an event; N: total number randomized to group; N/A: not applicable; PN: parenteral nutrition. | |||
| Study ID | Description of event | EN group (n/N) | EN + PN group (n/N) |
| Mechanical events | |||
| CVC obstruction | 9/2328 | 15/2312 | |
| Nasal bleeding | 18/2328 | 14/2312 | |
| Pneumohaemothorax after CVC placement | 0/2328 | 2/2312 | |
| Subclavian artery puncture | 0/2328 | 2/2312 | |
| Withdrawal of tube | 1/12 | 0/10 | |
| Failure to intubate | 0/12 | 2/10 | |
| Metabolic events | |||
| Hypoproteinaemia | 22/40 | 7/40 | |
| Gastrointestinal events | |||
| Vomiting or aspiration | 284/2328 | 295/2312 | |
| Gastric reflux | 0/12 | 2/10 | |
| Stress ulcer | 7/40 | 9/40 | |
| infective events | |||
| Pyemia | 3/40 | 10/40 | |
| Intracranial infection | 7/40 | 5/40 | |
| Catheter bloodstream infection | 0/73 | 7/52 | |
| Intra‐abdominal infection | 0/73 | 4/52 | |
| Upper urinary tract infection | 0/73 | 1/52 | |
| Surgical deep infection | 0/73 | 1/52 | |
| CVC: central venous catheter; EN: enteral nutrition; EN + PN: combined enteral and parenteral nutrition; n: number of participants with an event; N: total number randomized to group. | |||
| Outcome or subgroup title | No. of studies | No. of participants | Statistical method | Effect size |
| 1 In‐hospital mortality Show forest plot | 6 | 361 | Risk Ratio (M‐H, Fixed, 95% CI) | 1.19 [0.80, 1.77] |
| 2 Mortality at 30 days Show forest plot | 11 | 3148 | Risk Ratio (M‐H, Fixed, 95% CI) | 1.02 [0.92, 1.13] |
| 3 Mortality at 90 days Show forest plot | 3 | 2461 | Risk Ratio (M‐H, Fixed, 95% CI) | 1.06 [0.95, 1.17] |
| 4 Aspiration Show forest plot | 2 | 2437 | Risk Ratio (M‐H, Fixed, 95% CI) | 1.53 [0.46, 5.03] |
| 5 Pneumothorax Show forest plot | 2 | 2437 | Risk Ratio (M‐H, Fixed, 95% CI) | 1.46 [0.19, 11.22] |
| 6 Hyperglycaemia Show forest plot | 2 | 2437 | Risk Ratio (M‐H, Fixed, 95% CI) | 0.57 [0.35, 0.93] |
| 7 Vomiting Show forest plot | 3 | 2525 | Risk Ratio (M‐H, Fixed, 95% CI) | 3.42 [1.15, 10.16] |
| 8 Diarrhoea Show forest plot | 6 | 363 | Risk Ratio (M‐H, Fixed, 95% CI) | 2.17 [1.72, 2.75] |
| 9 Abdominal distension Show forest plot | 3 | 2505 | Risk Ratio (M‐H, Fixed, 95% CI) | 1.53 [0.34, 6.96] |
| 10 Sepsis Show forest plot | 7 | 361 | Risk Ratio (M‐H, Fixed, 95% CI) | 0.59 [0.37, 0.95] |
| 11 Pneumonia Show forest plot | 7 | 415 | Risk Ratio (M‐H, Fixed, 95% CI) | 1.10 [0.82, 1.48] |
| 12 Intra‐abdominal infection Show forest plot | 3 | 202 | Risk Ratio (M‐H, Fixed, 95% CI) | 0.26 [0.07, 0.89] |
| 13 Wound infection Show forest plot | 3 | 155 | Risk Ratio (M‐H, Fixed, 95% CI) | 1.45 [0.55, 3.82] |
| 14 Urinary tract infection Show forest plot | 3 | 160 | Risk Ratio (M‐H, Fixed, 95% CI) | 1.48 [0.65, 3.40] |
| 15 In‐hospital mortality: gastrointestinal (GI) medical/surgical vs non‐GI medical/surgical Show forest plot | 6 | 361 | Risk Ratio (M‐H, Fixed, 95% CI) | 1.19 [0.80, 1.77] |
| 15.1 GI medical/surgical | 1 | 98 | Risk Ratio (M‐H, Fixed, 95% CI) | 0.88 [0.06, 13.74] |
| 15.2 Non‐GI medical/surgical | 5 | 263 | Risk Ratio (M‐H, Fixed, 95% CI) | 1.20 [0.80, 1.79] |
| 16 Mortality at 30 days: GI medical/surgical vs non‐GI medical/surgical Show forest plot | 10 | 3068 | Risk Ratio (M‐H, Fixed, 95% CI) | 1.03 [0.93, 1.14] |
| 16.1 GI medical/surgical | 1 | 60 | Risk Ratio (M‐H, Fixed, 95% CI) | 0.67 [0.12, 3.71] |
| 16.2 Non‐GI medical/surgical | 9 | 3008 | Risk Ratio (M‐H, Fixed, 95% CI) | 1.03 [0.93, 1.15] |
| Outcome or subgroup title | No. of studies | No. of participants | Statistical method | Effect size |
| 1 In‐hospital mortality Show forest plot | 5 | 5111 | Risk Ratio (M‐H, Fixed, 95% CI) | 0.99 [0.84, 1.16] |
| 2 Mortality at 30 days Show forest plot | 3 | 409 | Risk Ratio (M‐H, Fixed, 95% CI) | 1.64 [1.06, 2.54] |
| 3 Mortality at 90 days Show forest plot | 2 | 4760 | Risk Ratio (M‐H, Fixed, 95% CI) | 1.00 [0.86, 1.18] |
| 4 Feeding tube obstruction Show forest plot | 2 | 4662 | Risk Ratio (M‐H, Fixed, 95% CI) | 0.96 [0.70, 1.32] |
| 5 Diarrhoea Show forest plot | 4 | Risk Ratio (M‐H, Fixed, 95% CI) | Totals not selected | |
| 6 Pneumonia Show forest plot | 2 | 205 | Risk Ratio (M‐H, Fixed, 95% CI) | 1.40 [0.91, 2.15] |
| 7 Wound infection Show forest plot | 2 | 4765 | Risk Ratio (M‐H, Fixed, 95% CI) | 0.67 [0.50, 0.92] |
| 8 Bloodstream infection Show forest plot | 2 | 4765 | Risk Ratio (M‐H, Fixed, 95% CI) | 0.81 [0.66, 1.01] |
| 9 Urinary tract infection Show forest plot | 3 | 4885 | Risk Ratio (M‐H, Fixed, 95% CI) | 0.87 [0.65, 1.17] |
| 10 Airway infection Show forest plot | 3 | Risk Ratio (M‐H, Fixed, 95% CI) | Totals not selected | |