Parasetamol untuk sakit belakang bahagian bawah
Abstract
Background
Analgesic medication is the most frequently prescribed treatment for low back pain (LBP), of which paracetamol (acetaminophen) is recommended as the first choice medication. However, there is uncertainty about the efficacy of paracetamol for LBP.
Objectives
To investigate the efficacy and safety of paracetamol for non‐specific LBP.
Search methods
We conducted searches on the Cochrane Central Register of Controlled Trials (CENTRAL, which includes the Back and Neck Review Group trials register), MEDLINE, EMBASE, CINAHL, AMED, Web of Science, LILACS, and IPA from their inception to 7 August 2015. We also searched the reference lists of eligible papers and trial registry websites (WHO ICTRP and ClinicalTrials.gov).
Selection criteria
We only considered randomised trials comparing the efficacy of paracetamol with placebo for non‐specific LBP. The primary outcomes were pain and disability. We also investigated quality of life, function, adverse effects, global impression of recovery, sleep quality, patient adherence, and use of rescue medication as secondary outcomes.
Data collection and analysis
Two review authors independently performed the data extraction and assessed risk of bias in the included studies. We also evaluated the quality of evidence using the GRADE approach. We converted scales for pain intensity to a common 0 to 100 scale. We quantified treatment effects using mean difference for continuous outcomes and risk ratios for dichotomous outcomes. We used effect sizes and 95% confidence intervals as a measure of treatment effect for the primary outcomes. When the treatment effects were smaller than 9 points on a 0 to 100 scale, we considered the effect as small and not clinically important.
Main results
Our searches retrieved 4449 records, of which two trials were included in the review (n=1785). For acute LBP, there is high‐quality evidence for no difference between paracetamol (4 g per day) and placebo at 1 week (immediate term), 2 weeks, 4 weeks, and 12 weeks (short term) for the primary outcomes. There is high‐quality evidence that paracetamol has no effect on quality of life, function, global impression of recovery, and sleep quality for all included time periods. There were also no significant differences between paracetamol and placebo for adverse events, patient adherence, or use of rescue medication. No trials were identified evaluating patients with subacute or chronic LBP.
Authors' conclusions
We found that paracetamol does not produce better outcomes than placebo for people with acute LBP.
PICO
Ringkasan bahasa mudah
Parasetamol untuk sakit belakang bahagian bawah
Soalan ulasan
Untuk melihat berapa baik parasetamol berfungsi untuk sakit belakang yang tidak spesifik (LBP). LBP tidak spesifik adalah sakit belakang yang tidak dikenalpasti penyakit atau keadaannya.
Latar belakang
Parasetamol adalah salah satu ubat yang lazim diberi kepada orang dengan LBP, dan ia disyorkan dalam garispanduan yang diterbitkan untuk membantu para doktor mengurus pelbagai penyakit. Walau bagaimanapun, bukti terbaru telah mempersoalkan keberkesanannya.
Tarikh carian
Bukti‐bukti adalah terkini setakat Ogos 2015.
Ciri‐ciri kajian
Kami memasukkan dua kajian dengan sejumlah 1785 peserta dalam ulasan ini dengan peserta yang sakit belakang berlaku tiba‐tiba dan terbaru (akut). Kebanyakan orang dalam kajian (90%) adalah pertengahan umur dan dari satu kajian tunggal yang menyiasat sakit belakang akut. Kedua‐dua kajian menguji parasetamol berbanding plasebo (tidak mengandungi bahan yang boleh bertindak sebagai ubat). Peserta‐peserta disusul antara satu hari dan 12 minggu. Hasil utama yang kami kaji adalah sakit dan hilang upaya; kami juga melihat kualiti hidup, bagaimana peserta menjalani kehidupan harian mereka, kesan sampingan yang tidak selesa atau tidak diingini, bagaimana mereka pulih, kualiti tidur, sama ada peserta mengambil ubat yang dipreskripsi dan sama ada 'ubat penyelamat' perlu diambil kerana parasetamol tidak berkesan. Kami menggabungkan dapatan daripada satu kajian (n=1651) ke dalam satu analisis (meta‐analisis) yang membandingkan parasetamol dengan plasebo; kajian kedua tidak melaporkan keputusan bagi plasebo, maka ia tidak dapat dimasukkan.
Keputusan utama dan kualiti bukti
Kami mendapati bukti berkualiti tinggi yang parasetamol (4 g setiap hari) adalah tiada kelebihan baik daripada plasebo untuk melegakan LBP akut dalam sama ada jangka pendek atau panjang. Ia juga bekerja tidak lebih baik daripada plasebo dalam aspek lain yang dikaji, seperti kualiti hidup dan kualiti tidur. Kira‐kira satu dalam lima orang melaporkan kesan sampingan, walaupun ada yang serius, tiada perbezaan antara kumpulan intervensi dan kumpulan kawalan. Oleh kerana kebanyakan peserta yang dikaji adalah pertengahan umur, kami tidak pasti penemuan adalah sama untuk kumpulan umur lain.
Authors' conclusions
Summary of findings
| Paracetamol compared with placebo for acute low back pain | ||||||
| Patient or population: People with acute low back pain Settings: Primary care Intervention: Paracetamol Comparison: Placebo | ||||||
| Outcomes | Illustrative comparative risks* (95% CI) | Relative effect | No of participants | Quality of the evidence | Comments | |
| Assumed risk | Corresponding risk | |||||
| Placebo | Paracetamol | |||||
| Pain 1 week (immediate term) (NRS 0 to 100) | The mean pain in the control group was 36 points | The mean pain in the intervention group was (1.30 lower to 4.28 higher) | ‐ | 1520 | ⊕⊕⊕⊕ | The difference is not statistically |
| Pain 12 weeks (short term) (NRS 0 to 100) | The mean pain in the control group was 13 points | The mean pain in the intervention group was (2.92 lower to 1.92 higher) | ‐ | 1526 | ⊕⊕⊕⊕ | The difference is not statistically |
| Disability 1 week (immediate term) (RMDQ 0 to 24) | The mean disability in the control group was 8.3 points | The mean disability in the intervention group was (1.15 lower to 0.25 higher) | ‐ | 1511 | ⊕⊕⊕⊕ | The difference is not statistically |
| Disability 12 weeks (short term) (RMDQ 0 to 24) | The mean disability in the control group was 2.4 points | The mean disability in the intervention group was (0.39 lower to 0.59 higher) | ‐ | 1522 | ⊕⊕⊕⊕ | The difference is not statistically |
| Any adverse events Up to 12 weeks' follow‐up | 107 per 1000 | 115 per 1000 | RR 1.07 (0.86 to 1.33) | 1624 | ⊕⊕⊕⊕ | The difference is not statistically |
| Serious adverse events Up to 12 weeks' follow‐up | 90 per 1000 | 81 per 1000 | RR 0.90 (0.30 to 2.67) | 1643 | ⊕⊕⊕ | The difference is not statistically |
| *The corresponding risk (and its 95% confidence interval) is based on the assumed risk in the comparison group and the relative effect of the intervention (and its 95% CI). | ||||||
| GRADE Working Group grades of evidence | ||||||
| 1. Downgraded for imprecision. | ||||||
Background
Low back pain (LBP) is the leading cause of disability worldwide (Global Burden of Disease Study 2015). Patients usually experience a substantial reduction in pain intensity in the first six weeks following the onset of a new episode, however in many patients the pain does not resolve completely (Menezes 2012; Pengel 2003). About 40% of patients will develop chronic LBP, persisting for months or years (Menezes 2009). Even for those patients who recover quickly from the initial acute episode, a recurrent episode during the following 12 months is very common (Henschke 2008).
The most frequently prescribed treatment for back pain is an analgesic medication; according to clinical practice guidelines, paracetamol should be the first‐choice pain medicine for people with non‐specific LBP, especially in the acute phase (Koes 2010). However, the guideline recommendations for prescribing paracetamol are based on indirect evidence of efficacy from studies outside the LBP field, consensus among the guideline development group, and greater safety compared to alternative pain medicines (for example non‐steroidal anti‐inflammatory drugs (NSAIDs) or opioids) (van Tulder 2006). The uncertainty about the efficacy of paracetamol as an analgesic for LBP was highlighted in the first systematic review of paracetamol for LBP, which noted the absence of robust data on treatment efficacy (Davies 2008). Subsequent to the Davies 2008 review, the PACE trial has called into question the efficacy of paracetamol for people with acute LBP (Williams 2014).
The PACE trial enrolled 1652 participants and reported no significant difference in days to recovery between participants taking paracetamol in a time‐contingent fashion, taking paracetamol as required, or placebo for acute LBP (Williams 2014). There was also no effect for any of the secondary outcomes (for example pain intensity, disability, function, global rating of symptom change, sleep quality, and quality of life). The presumed efficacy of paracetamol for LBP as reflected in guideline endorsement is thus controversial, and a Cochrane review of placebo‐controlled trials could provide the credible evidence needed to inform decision‐making based on the highest standard of evidence.
This review is an update of a recent systematic review on paracetamol for spinal pain or osteoarthritis (Machado 2015). The Machado 2015 review has been split into two Cochrane reviews, one focusing on knee or hip osteoarthritis, and this one, which focuses on non‐specific LBP. Both reviews follow the same methodology according to the guidelines of The Cochrane Collaboration, Higgins 2011, and the Cochrane Back and Neck Review Group, Furlan 2015.
Description of the condition
LBP can be defined as pain or discomfort below the ribs and above the gluteal crease, with or without referred leg pain (Airaksinen 2006). The great majority of people with LBP are classified as having non‐specific LBP, which is defined as LBP without any known specific cause or pathology, such as nerve root compromise or serious spinal pathology (for example fracture, cancer, infection, or inflammatory diseases). This condition is also staged according to the duration of symptoms: acute LBP is an episode persisting for less than six weeks; subacute LBP with symptoms persisting between six and 12 weeks; and chronic LBP when symptoms persists for 12 weeks or longer (Furlan 2015).
Description of the intervention
Paracetamol (acetaminophen) is one of the most widely used non‐prescription medicines in the world. It has been commercially available for over 60 years, making it one of the oldest analgesics on the market (Jozwiak‐Bebenista 2014). The usual adult recommended dose is 325 mg to 1000 mg every four or six hours, not exceeding 1000 mg per dose or 4000 mg per day (Amar 2007). It can be prescribed alone or in combination with other medicines, such as an NSAID or opioid. Paracetamol has been promoted as the preferred medication for people with LBP due to its low risk of side effects and similar action to other analgesics (that is, NSAIDs) (Graham 2013; Koes 2010).
How the intervention might work
Although paracetamol has been widely used in medical practice, its mechanism of action remains uncertain (Graham 2013). The main proposed mechanism is the inhibition of cyclooxygenase (COX) enzymes through metabolism by the peroxidase function of these isoenzymes. This process results in inhibition of phenoxyl radical formation from a critical tyrosine residue important for the cyclooxygenase activity of COX‐1 and COX‐2 and prostaglandin synthesis (Graham 2013; Jozwiak‐Bebenista 2014). Paracetamol is a preferential inhibitor of COX‐2 due to its gastrointestinal tolerance and poor inhibition of platelet activity (Graham 2013; Hinz 2008; Hinz 2012). In addition, recent evidence suggests that the analgesic action of paracetamol is mediated by inhibition of COX‐3 (Botting 2005).
Paracetamol is widely considered to be a safe drug when administered in appropriate doses (Jozwiak‐Bebenista 2014); however, there is clear evidence that higher doses or prolonged use of paracetamol can lead to liver failure (where the paracetamol compounds are metabolised), cardiovascular events and even death (Graham 2013; Chan 2006; Forman 2005; Roberts 2015; Daly 2008; Sheen 2002).
Why it is important to do this review
This review is an update of a recent systematic review on paracetamol for spinal pain and osteoarthritis (Machado 2015), which was published in the BMJ. The Cochrane format will allow us to provide a more comprehensive overview of the results and methods than is possible with a journal article. We will also take the opportunity to update the search and focus specifically on LBP.
Objectives
To investigate the efficacy and safety of paracetamol for non‐specific LBP.
Methods
Criteria for considering studies for this review
Types of studies
We only considered placebo‐controlled randomised trials. We did not include trials with quasi‐random allocation procedures in order to avoid biased estimates of treatment effects across the included studies (Furlan 2015; Higgins 2011).
Types of participants
Inclusion criteria:
-
People with non‐specific acute, subacute, or chronic non‐specific LBP
-
People recruited from primary, secondary, or tertiary care
Exclusion criteria:
-
People with serious spinal pathology (e.g. cancer, fractures, cauda equina syndrome, and inflammatory diseases)
-
Pregnancy
Types of interventions
We included any dosing regimen of paracetamol compared to placebo. We did not include any combination of medicines with paracetamol. We also excluded the use of paracetamol for post‐operative analgesia.
Types of outcome measures
Primary outcomes
-
Pain intensity
-
Disability
Secondary outcomes
-
Quality of life
-
Function
-
Adverse effects
-
Global impression of recovery
-
Sleep quality
-
Patient adherence
-
Use of rescue medication
Search methods for identification of studies
Electronic searches
We performed a computerised electronic search to identify relevant articles in the following databases from their inception to 7 August 2015 without language restrictions:
-
Cochrane Central Register of Controlled Trials (CENTRAL, which includes the Back and Neck review Group trials register; OvidSP, 1991 to August 2015).
-
MEDLINE (OvidSP, 1946 to August Week 1 2015)
-
MEDLINE In‐Process & Other Non‐Indexed Citations (OvidSP, 7 August 2015).
-
EMBASE (Embase.com, 1947 to August 2015).
-
Cumulative Index to Nursing and Allied Health Literature (CINAHL) (EBSCO, 1982 to August 2015).
-
Allied and Complementary Medicine (AMED) (OvidSP, 1985 to August 2015).
-
Web of Science (Thomson Reuters, 1900 to August 2015).
-
Latin American and Caribbean Health Sciences Literature (LILACS).
-
International Pharmaceutical Abstracts (IPA) (OvidSP, 1970 to August 2015).
The search strategy for each database is presented in the following appendices: Appendix 1; Appendix 2; Appendix 3; Appendix 4; Appendix 5; Appendix 6; Appendix 7; Appendix 8.
Searching other resources
We also searched the reference lists of eligible papers and the following trial registry websites: World Health Organization (WHO) International Clinical Trials Registry Platform (ICTRP) and ClinicalTrials.gov. The search strategy used for searching other resources is presented in Appendix 9.
Data collection and analysis
Selection of studies
Two review authors independently screened titles, abstracts, and full‐text papers for potentially eligible studies, resolving any disagreements through discussion or arbitration of a third review author if consensus could not be reached.
Data extraction and management
Two review authors independently extracted the following data from each included trial using a standardised data extraction form. Disagreements were resolved through discussion or arbitration of a third review author when consensus could not be reached.
-
Bibliometric data (authors, year of publication, language).
-
Study characteristics (study design, sample size, description of the sample, country, funding).
-
Characteristics of the participants (gender, age, duration of symptoms).
-
Duration of follow‐up assessments.
-
Means, standard deviations, and sample sizes for continuous outcome measures. The treatment estimates were extracted in the following hierarchical order: between‐group differences, within‐group change scores, and follow‐up values.
-
Number of cases and the total sample size for dichotomous outcomes. For adverse events, we considered the number of participants reporting any adverse event, the number of participants reporting any serious adverse event (as defined by each study), the number of participants withdrawn from study due to adverse events, and the number of participants with abnormal results on liver function tests (hepatic enzyme activity ≥ 1.5 times the upper limit of the reference range).
Assessment of risk of bias in included studies
Two review authors independently assessed risk of bias of the included studies. Disagreements were resolved through discussion or arbitration of a third review author when consensus could not be reached. We assessed risk of bias using the 'Risk of bias' assessment tool recommended by The Cochrane Collaboration (Higgins 2011) (Appendix 10). We scored each item as ‘high’, ‘low’, or ‘unclear’ risk of bias.
Measures of treatment effect
When more than one scale for measuring pain intensity or disability was used, we extracted the more severe estimate reported at baseline. We converted scales for pain intensity to a common 0 (no pain) to 100 (worse pain) scale. We quantified the treatment effects with the mean difference for continuous outcomes, and calculated the risk ratios for the positive outcome for dichotomous outcomes. We used effect sizes and 95% confidence intervals as a measure of treatment effect. In the previous version of this review (Machado 2015), we considered the minimal clinically important difference (MCID) as 9 points on a 0 to 100 scale based upon the practice in the osteoarthritis field (Wandel 2010), though we understand that in the back pain field the MCID is usually considered to be larger than this value (Ostelo 2008). When the treatment effects were smaller than 9 points, we considered the effect as small and not clinically important.
Unit of analysis issues
To deal with repeated observations on participants, we followed the advocated strategy of defining the outcomes as well as the time points a priori (Higgins 2011). We have previously defined the time points as: immediate term (≤ 2 weeks), short term (> 2 weeks but ≤ 3 months), intermediate term (> 3 months but ≤ 12 months), and long term (> 12 months). However, to account for studies that reported multiple time points within each category, we included all time points reported in the included trials.
Dealing with missing data
We contacted authors to provide further information when the data reported in the paper was insufficient. When authors were unavailable, we estimated data using the recommendations of The Cochrane Collaboration (Higgins 2011).
Assessment of heterogeneity
The assessment of heterogeneity was based upon visual inspections of the forest plots looking at the overlap of the confidence intervals, and by the Chi2 test and the I2 statistic as recommended in the Cochrane Handbook for Systematic Reviews of Interventions (Higgins 2011). If substantial heterogeneity was present (I2 greater than 50%), or when we identified clear heterogeneity by visual inspection, we used a random‐effects model to combine results and downgraded for inconsistency in the quality of evidence assessment (GRADE).
Assessment of reporting biases
We did not assess publication bias with funnel plots because too few studies were included in the review. We added no language restriction to our search strategy in order to avoid potential language bias.
Data synthesis
We assessed the overall quality of the evidence for each outcome using the GRADE approach as recommended in the Cochrane Handbook for Systematic Reviews of Interventions (Higgins 2011), and adapted in the updated Cochrane Back and Neck Review Group method guidelines (Furlan 2015) (Appendix 11). We downgraded the quality of the evidence by one level according to the following criteria: limitation of study design and risk of bias (downgraded if more than a quarter of the participants were from studies with a high risk of bias, that is one or more bias domains judged as high risk), inconsistency of results (downgraded if significant heterogeneity was present by visual inspection or if the I2 value was greater than 50%), imprecision (downgraded if the upper or lower limits of the 95% confidence interval crossed the MCID of 9 points (range 0 to 100) (Guyatt 2011), and publication bias (assessed by visual inspection of funnel plots and using Egger’s test to investigate publication bias (small‐study effects)) (Egger 1997). If the Egger’s test result was significant (two‐tailed P < 0.1), we would downgrade the quality of evidence (GRADE) by one level for all meta‐analyses (Guyatt 2011b). We did not consider the indirectness criterion in this review because we included a specific population with relevant outcomes and direct comparisons (Guyatt 2011a).
We interpreted the overall quality of evidence using the following GRADE descriptors (Furlan 2015):
-
High‐quality evidence: Further research is very unlikely to change confidence in estimate of effect.
-
Moderate‐quality evidence: Further research is likely to have an important impact on confidence in estimate of effect and may change the estimate.
-
Low‐quality evidence: Further research is very likely to have an important impact on confidence in estimate of effect and is likely to change the estimate.
-
Very low‐quality evidence: Very little confidence in the effect estimate.
-
No evidence: We identified no randomised controlled trials that addressed this outcome.
Subgroup analysis and investigation of heterogeneity
We stratified the analyses based upon the duration of follow‐up reported for each outcome (that is, immediate term, short term, intermediate term, and long term).
Sensitivity analysis
We did not propose any sensitivity analyses as we expected the number of available trials to be low.
Results
Description of studies
See: Characteristics of included studies; Characteristics of excluded studies.
Results of the search
The search yielded 4449 records, of which two trials fulfilled the inclusion criteria and were included in the review (Figure 1). An additional search for ongoing or registered trials in ClinicalTrials.gov and the WHO ICTRP retrieved 44 records, of which 9 records included paracetamol as an intervention. One record was from a study already included in this review (Williams 2014); we have described the other eight under Excluded studies.
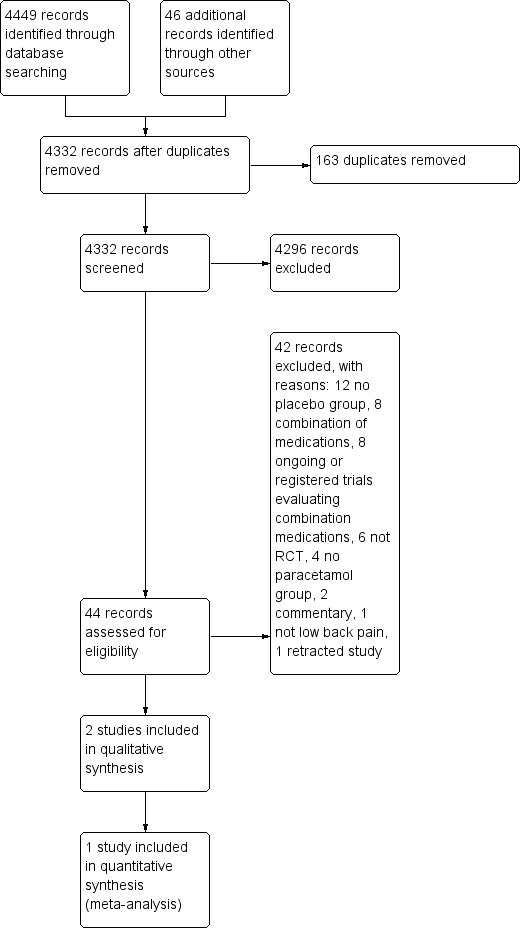
Study flow diagram.
Included studies
We have included two trials in this review (Nadler 2002; Williams 2014), with a total sample size of 1785 participants (133 and 1653 participants, respectively). We did not include one trial in the meta‐analysis as it did not report results for the placebo group, and all attempts to contact the authors and the pharmaceutical company that funded the study were unsuccessful (Nadler 2002).
The trials were conducted in Australia (Williams 2014) and the United States (Nadler 2002). Both trials included people with acute LBP (Nadler 2002; Williams 2014). The trials included 934 men and 842 women, most of whom were middle‐aged (mean: 44.2, standard deviation: 13.6), recruited from primary care. The duration of the treatments was two consecutive days (Nadler 2002) and daily until recovered, up to a maximum of four weeks (Williams 2014).
Both trials included single‐ingredient paracetamol formulations. In one trial (Nadler 2002), participants took 1 g of paracetamol tablets four times per day for two days. In the PACE trial (Williams 2014), participants in the time‐contingent group took paracetamol tablets 4g per day in three divided doses, and those in the 'as required' group took up to 4 g per day; both groups were asked to take the paracetamol until recovery up to a maximum of four weeks. We included all three PACE trial groups in the meta‐analyses, following the recommendations of The Cochrane Collaboration (Higgins 2011).
Regarding the primary outcomes, pain intensity was measured on a 0 to 10 scale in one trial (Williams 2014), and a 0 to 5 scale in one trial (Nadler 2002). Disability was measured using the Roland Morris Disability Questionnaire (RMDQ) from 0 to 24 points in all included trials. Williams 2014 also measured quality of life with the 12‐Item Short Form Health Survey (SF‐12), and function using the Patient‐Specific Functional Scale from 0 to 10. For the secondary outcomes, both trials measured adverse events (Nadler 2002; Williams 2014), and one trial measured adherence to the treatment, use of rescue medication, global impression of recovery (Global Perceived Effect scale from ‐5 to +5), and quality of sleep (number of participants reporting poor sleep quality) (Williams 2014). The rescue medication provided in Williams 2014 was two days' supply of naproxen 250 mg (2 tablets initially, and then 1 tablet every 6 to 8 hours as required).
Excluded studies
We excluded a total of 42 full‐text articles assessed for eligibility. Twelve records did not have a placebo group (Cabane 1996; Childers 2005; Corts Giner 1989; Hackett 1988; Hingorani 1971; Jiang 2008; Kuntz 1996; Lee 2008; Madhusudhan 2013; McGuinness 1969; Muller 2005; Tervo 1976); eight used a combination of medications for the intervention group (Borenstein 2001; Codding 2008; Garcia Filho 2006; Gimbel 2001; Muller 1998; Peloso 2004; Ruoff 2003; Schiphorst Preuper 2014); six were not randomised controlled trials (De Almeida Coimbra 1980; Derby 2012; Gammaitoni 2003; Larsen 2012; Miller 2012; Moore 2010); four did not have a paracetamol group (Martinez‐Elizondo 1979; Matsushita 2012; Pallay 2004; Yarlas 2013); two were commentaries (Diener 2008; Diener 2008a); one did not include people with LBP (Temple 2007); and one trial has been retracted (Wetzel 2014). The search for ongoing or registered trials retrieved eight potentially eligible records that included paracetamol as an intervention. Seven records used a combination of paracetamol and other medications (NCT00210561; NCT00643383; NCT00736853; NCT01112267; NCT01587274; NCT01776515; NCT01843660), and one record did not have a placebo group (NCT01422291).
Risk of bias in included studies
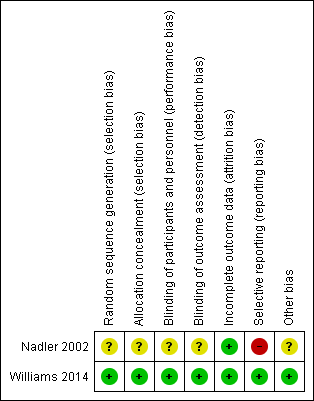
The results from the 'Risk of bias' assessment for the individual studies are summarised in Figure 2.

Risk of bias summary: review authors' judgements about each risk of bias item for each included study.
Allocation
Only one trial had low risk of bias for random sequence generation and allocation concealment (Williams 2014). We judged one trial as unclear for both criteria (Nadler 2002).
Blinding
One trial had low risk of bias for blinding for participants and personnel and outcome assessor (Williams 2014). We considered one trial unclear for both criteria, as it was not clear which investigator was blinded (personnel or assessor) (Nadler 2002).
Incomplete outcome data
Both trials successfully described complete outcome data and were rated as low risk of bias for this criterion. The follow‐up rate was over 90% for both trials.
Selective reporting
Only one trial had low risk of bias for selective reporting (Williams 2014), in which all outcomes of interest were reported. The other trial was rated as high risk of bias for this criterion. Nadler 2002 did not report data for the placebo group for any time point.
Other potential sources of bias
Both trials received funds from a company that produces paracetamol (Nadler 2002; Williams 2014). One trial was an investigator‐initiated trial that received supplementary funding from a pharmaceutical company and reported that the sponsor had no role in conducting the study or analysing the data (Williams 2014). Given this background and the negative trial outcome, this study appears to be free of other sources of bias and was rated as low risk of bias. Nadler 2002 did not report data for the placebo group, and was rated as unclear for other bias.
Effects of interventions
Acute LBP
Primary outcomes
One large trial with low risk of bias investigated the effect of paracetamol compared with placebo for acute LBP (Williams 2014). There is high‐quality evidence that there is no difference between paracetamol (4 g per day) and placebo for pain at 1 week (immediate term) (mean difference (MD) 1.49, 95% confidence interval (CI) ‐1.30 to 4.28), 2 weeks (MD 1.00, 95% CI ‐1.70 to 3.70), 4 weeks (MD 0.49, 95% CI ‐1.99 to 2.97), and 12 weeks (short term) (MD ‐0.50, 95% CI ‐2.92 to 1.92) (Analysis 1.1; Figure 3). There is high‐quality evidence that there is no difference between paracetamol and placebo for disability at 1 week (immediate term) (MD ‐0.45, 95% CI ‐1.15 to 0.25), 2 weeks (MD 0.00, 95% CI ‐0.65 to 0.65), 4 weeks (MD 0.05, 95% CI ‐0.50 to 0.60), and 12 weeks (short term) (MD 0.10, 95% CI ‐0.39 to 0.59) (Analysis 1.2; Figure 4).
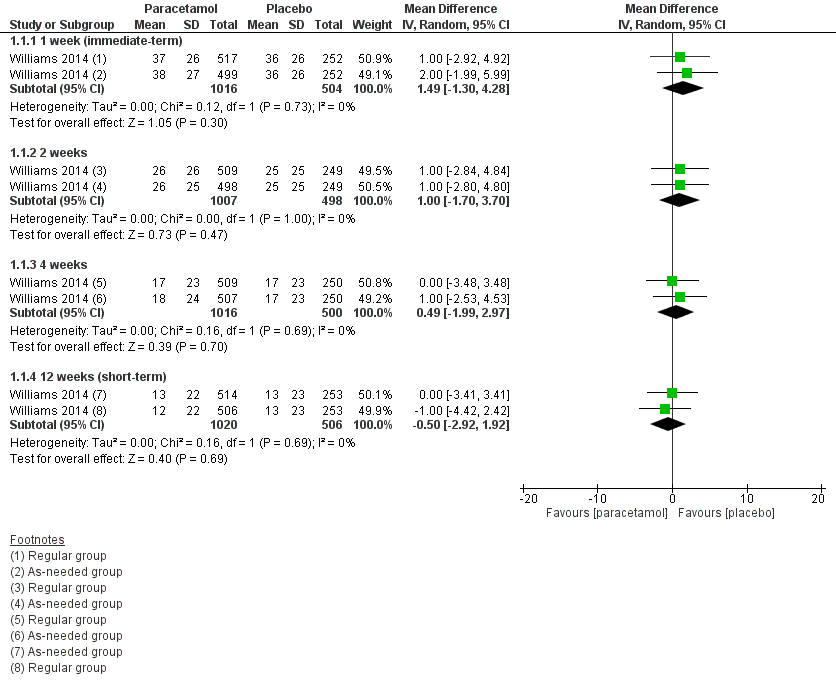
Forest plot of comparison: 1 Acute low back pain ‐ paracetamol versus placebo, outcome: 1.1 Pain.

Forest plot of comparison: 1 Acute low back pain ‐ paracetamol versus placebo, outcome: 1.2 Disability
Secondary outcomes
There is high‐quality evidence that paracetamol has no effect on the physical component of quality of life at 4 weeks (MD ‐0.79, 95% CI ‐1.94 to 0.36) and 12 weeks (short term) (MD 0.41, 95% CI ‐0.91 to 1.72) (Analysis 1.3), and the mental component of quality life at 4 weeks (MD ‐0.60, 95% CI ‐1.38 to 0.17). We found a statistically significant effect in favour to paracetamol at 12 weeks (short term) for the mental component of quality of life (MD 0.90, 95% CI 0.08 to 1.72; P = 0.03), however we did not consider this effect to be clinically important (Analysis 1.4).
There is high‐quality evidence that there is no significant difference between paracetamol and placebo for function at 1 week (immediate term) (MD ‐0.05, 95% CI ‐0.32 to 0.22), 2 weeks (MD ‐0.15, 95% CI ‐0.42 to 0.12), 4 weeks (MD ‐0.05, 95% CI ‐0.31 to 0.21), and 12 weeks (short term) (MD 0.00, 95% CI ‐0.23 to 0.23) (Analysis 1.5). There is also high‐quality evidence that there is no significant difference between paracetamol and placebo for global impression of recovery at 1 week (immediate term) (MD ‐0.05, 95% CI ‐0.28 to 0.18), 2 weeks (MD ‐0.05, 95% CI ‐0.28 to 0.18), 4 weeks (MD ‐0.10, 95% CI ‐0.33 to 0.13), and 12 weeks (short term) (MD ‐0.05, 95% CI ‐0.26 to 0.17) (Analysis 1.7).
Adverse events were reported by 296 (19%) participants, of which nine participants in the paracetamol group and five in the placebo group reported serious adverse events (that is any event causing hospitalisation or death). However, we observed no differences across groups for total adverse events (risk ratio (RR) 1.07, 95% CI 0.86 to 1.33) or serious adverse events (RR 0.90, 95% CI 0.30 to 2.67). The reported serious adverse events were unrelated to the study treatment (for example asthma attack, bleeding bowel, infection, hernia, severe back pain, or scheduled surgery) (Analysis 1.6).
We observed no significant differences in the number of participants reporting poor sleep quality at 1 week (immediate term) (RR 1.05, 95% CI 0.87 to 1.25), 2 weeks (RR 1.01, 95% CI 0.80 to 1.28), 4 weeks (RR 1.11, 95% CI 0.82 to 1.52), and 12 weeks (short term) (RR 1.26, 95% CI 0.90 to 1.76), with high‐quality evidence (Analysis 1.8). Finally, there were no significant differences between paracetamol and placebo for patient adherence (RR 1.08, 95% CI 0.96 to 1.22) (Analysis 1.9) or use of rescue medication (RR 0.50, 95% CI 0.16 to 1.55) (Analysis 1.10).
Subacute and chronic LBP
None of the included trials evaluated patients with subacute or chronic LBP.
Discussion
Summary of main results
There is high‐quality evidence that there is no difference between paracetamol and placebo for acute LBP on pain, disability, function, quality of life, and sleep quality outcomes at 1 week (immediate term), 2 weeks, 4 weeks, and 12 weeks (short term) follow‐ups. There is also no difference on global impression of recovery, patient adherence, and use of rescue medication. Some minor and serious adverse events were reported for either the paracetamol or placebo group, but we found no difference between groups. No trial provided results for long‐term follow‐up. The results are consistent across all outcome measures and time periods included in this review.
Although we found a statistically significant effect for the mental component of quality life at short term for acute LBP, this result was not clinically important as it was a difference of 0.90 points out of 100 points. This significant effect could also be found by chance due to the large number of analyses in this review.
Overall completeness and applicability of evidence
None of the trials followed participants for more than 12 weeks (intermediate‐ or long‐term follow‐ups); thus the results of this review are restricted to immediate‐ and short‐term follow‐ups, that is from 1 week to 12 weeks. Moreover, more than 90% of the participants analysed in this review are from one large trial (Williams 2014), which included middle‐aged Australian participants with acute LBP; thus care should be taken when generalising the findings of this review to other types of patients, such as those with chronic symptoms. In addition, we did not find any trial evaluating paracetamol for subacute or chronic LBP patients.
Quality of the evidence
The quality of evidence provided in this review was high for the use of paracetamol for acute LBP, which means that further research is very unlikely to change confidence in the estimate of effect. Regarding the risk of bias in the included studies, selective reporting was the only item considered as high risk of bias in one trial (Nadler 2002). However, the trial that accounted for the majority of participants in this review was rated as low risk of bias for all criteria (Williams 2014).
Potential biases in the review process
Both trials included in this review received funding from a pharmaceutical company (Nadler 2002; Williams 2014). However, in one trial the authors stated that the sponsor had no role in conducting the study or analysing the data, and given the negative outcome of the trial we considered this study to be free of any potential bias regarding conflicts of interest (Williams 2014).
Moreover, we limited our MEDLINE strategy to studies indexed with the MeSH term 'humans' using the limit function in the database. This could potentially exclude eligible studies not indexed with the MeSH term 'human'. We do not think this is an issue in this review as we searched a variety of sources and checked studies from other reviews on the topic.
Agreements and disagreements with other studies or reviews
The last review on the topic concluded that there was insufficient evidence to assess the efficacy of paracetamol in people with LBP (Davies 2008). The authors of that review could not identify any randomised controlled trial comparing paracetamol to a placebo. Clinical practice guidelines have been recommending paracetamol, especially for acute patients (Koes 2010), based on presumed efficacy for related pain conditions and the safety profile compared to non‐steroidal anti‐inflammatory drugs (van Tulder 2006). This systematic review provides high‐quality evidence that paracetamol is ineffective for acute LBP.
Although we found high‐quality evidence for acute LBP, which is unlikely to change with future research, we believe that more studies are needed to resolve the uncertainty about the efficacy of paracetamol for subacute and chronic LBP, before paracetamol is completely removed from the recommendations for the management of LBP.

Study flow diagram.
Risk of bias summary: review authors' judgements about each risk of bias item for each included study.

Forest plot of comparison: 1 Acute low back pain ‐ paracetamol versus placebo, outcome: 1.1 Pain.
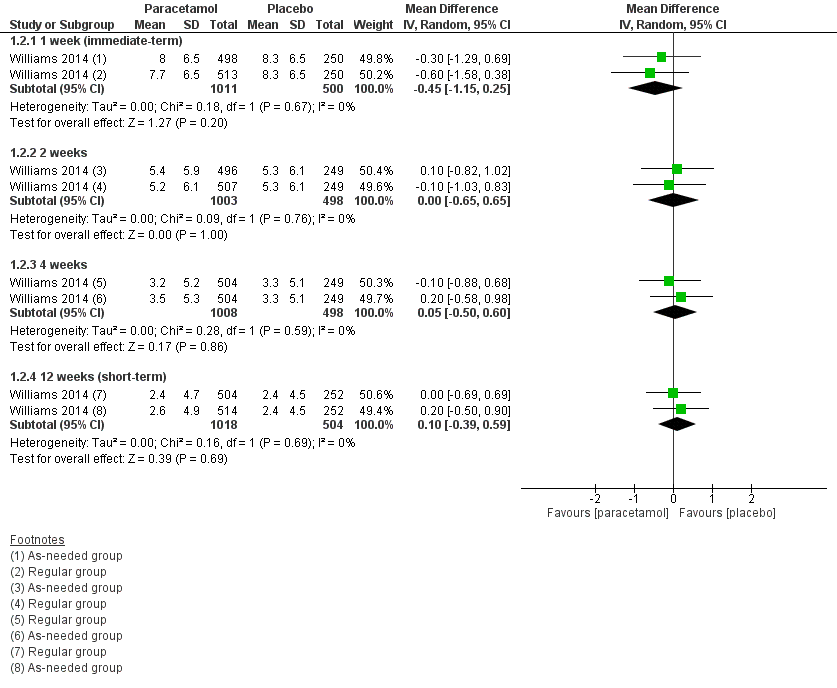
Forest plot of comparison: 1 Acute low back pain ‐ paracetamol versus placebo, outcome: 1.2 Disability
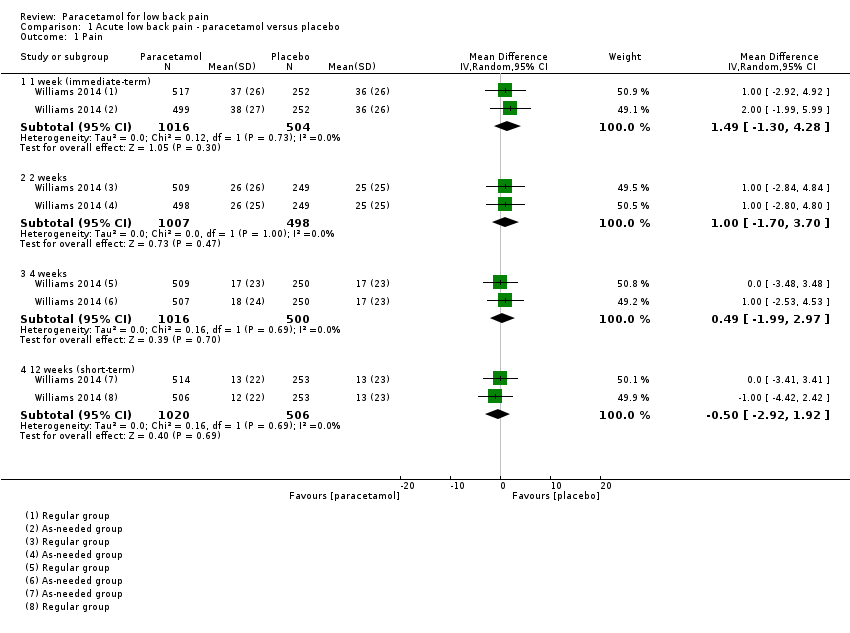
Comparison 1 Acute low back pain ‐ paracetamol versus placebo, Outcome 1 Pain.

Comparison 1 Acute low back pain ‐ paracetamol versus placebo, Outcome 2 Disability.

Comparison 1 Acute low back pain ‐ paracetamol versus placebo, Outcome 3 Quality of life, physical component.
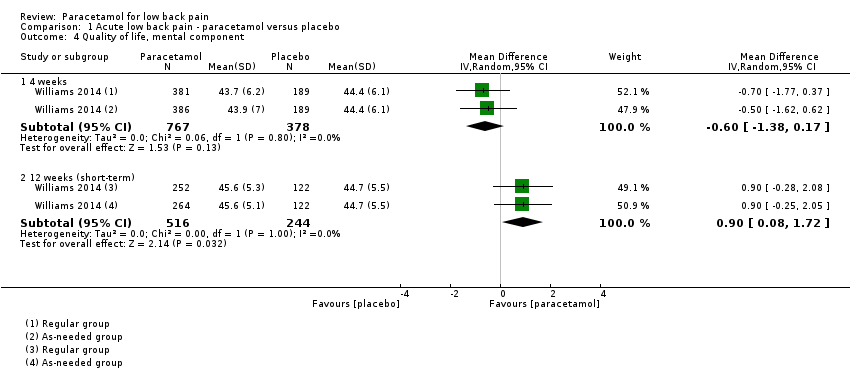
Comparison 1 Acute low back pain ‐ paracetamol versus placebo, Outcome 4 Quality of life, mental component.

Comparison 1 Acute low back pain ‐ paracetamol versus placebo, Outcome 5 Function.

Comparison 1 Acute low back pain ‐ paracetamol versus placebo, Outcome 6 Adverse events.

Comparison 1 Acute low back pain ‐ paracetamol versus placebo, Outcome 7 Global impression of recovery.

Comparison 1 Acute low back pain ‐ paracetamol versus placebo, Outcome 8 Poor sleep quality.

Comparison 1 Acute low back pain ‐ paracetamol versus placebo, Outcome 9 Patient adherence.

Comparison 1 Acute low back pain ‐ paracetamol versus placebo, Outcome 10 Use of rescue medication.
| Paracetamol compared with placebo for acute low back pain | ||||||
| Patient or population: People with acute low back pain Settings: Primary care Intervention: Paracetamol Comparison: Placebo | ||||||
| Outcomes | Illustrative comparative risks* (95% CI) | Relative effect | No of participants | Quality of the evidence | Comments | |
| Assumed risk | Corresponding risk | |||||
| Placebo | Paracetamol | |||||
| Pain 1 week (immediate term) (NRS 0 to 100) | The mean pain in the control group was 36 points | The mean pain in the intervention group was (1.30 lower to 4.28 higher) | ‐ | 1520 | ⊕⊕⊕⊕ | The difference is not statistically |
| Pain 12 weeks (short term) (NRS 0 to 100) | The mean pain in the control group was 13 points | The mean pain in the intervention group was (2.92 lower to 1.92 higher) | ‐ | 1526 | ⊕⊕⊕⊕ | The difference is not statistically |
| Disability 1 week (immediate term) (RMDQ 0 to 24) | The mean disability in the control group was 8.3 points | The mean disability in the intervention group was (1.15 lower to 0.25 higher) | ‐ | 1511 | ⊕⊕⊕⊕ | The difference is not statistically |
| Disability 12 weeks (short term) (RMDQ 0 to 24) | The mean disability in the control group was 2.4 points | The mean disability in the intervention group was (0.39 lower to 0.59 higher) | ‐ | 1522 | ⊕⊕⊕⊕ | The difference is not statistically |
| Any adverse events Up to 12 weeks' follow‐up | 107 per 1000 | 115 per 1000 | RR 1.07 (0.86 to 1.33) | 1624 | ⊕⊕⊕⊕ | The difference is not statistically |
| Serious adverse events Up to 12 weeks' follow‐up | 90 per 1000 | 81 per 1000 | RR 0.90 (0.30 to 2.67) | 1643 | ⊕⊕⊕ | The difference is not statistically |
| *The corresponding risk (and its 95% confidence interval) is based on the assumed risk in the comparison group and the relative effect of the intervention (and its 95% CI). | ||||||
| GRADE Working Group grades of evidence | ||||||
| 1. Downgraded for imprecision. | ||||||
| Outcome or subgroup title | No. of studies | No. of participants | Statistical method | Effect size |
| 1 Pain Show forest plot | 1 | Mean Difference (IV, Random, 95% CI) | Subtotals only | |
| 1.1 1 week (immediate‐term) | 1 | 1520 | Mean Difference (IV, Random, 95% CI) | 1.49 [‐1.30, 4.28] |
| 1.2 2 weeks | 1 | 1505 | Mean Difference (IV, Random, 95% CI) | 1.0 [‐1.70, 3.70] |
| 1.3 4 weeks | 1 | 1516 | Mean Difference (IV, Random, 95% CI) | 0.49 [‐1.99, 2.97] |
| 1.4 12 weeks (short‐term) | 1 | 1526 | Mean Difference (IV, Random, 95% CI) | ‐0.50 [‐2.92, 1.92] |
| 2 Disability Show forest plot | 1 | Mean Difference (IV, Random, 95% CI) | Subtotals only | |
| 2.1 1 week (immediate‐term) | 1 | 1511 | Mean Difference (IV, Random, 95% CI) | ‐0.45 [‐1.15, 0.25] |
| 2.2 2 weeks | 1 | 1501 | Mean Difference (IV, Random, 95% CI) | 0.00 [‐0.65, 0.65] |
| 2.3 4 weeks | 1 | 1506 | Mean Difference (IV, Random, 95% CI) | 0.05 [‐0.50, 0.60] |
| 2.4 12 weeks (short‐term) | 1 | 1522 | Mean Difference (IV, Random, 95% CI) | 0.10 [‐0.39, 0.59] |
| 3 Quality of life, physical component Show forest plot | 1 | Mean Difference (IV, Random, 95% CI) | Subtotals only | |
| 3.1 4 weeks | 1 | 1145 | Mean Difference (IV, Random, 95% CI) | ‐0.79 [‐1.94, 0.36] |
| 3.2 12 weeks (short‐term) | 1 | 760 | Mean Difference (IV, Random, 95% CI) | 0.41 [‐0.91, 1.72] |
| 4 Quality of life, mental component Show forest plot | 1 | Mean Difference (IV, Random, 95% CI) | Subtotals only | |
| 4.1 4 weeks | 1 | 1145 | Mean Difference (IV, Random, 95% CI) | ‐0.60 [‐1.38, 0.17] |
| 4.2 12 weeks (short‐term) | 1 | 760 | Mean Difference (IV, Random, 95% CI) | 0.90 [0.08, 1.72] |
| 5 Function Show forest plot | 1 | Mean Difference (IV, Random, 95% CI) | Subtotals only | |
| 5.1 1 week (immediate‐term) | 1 | 1511 | Mean Difference (IV, Random, 95% CI) | ‐0.05 [‐0.32, 0.22] |
| 5.2 2 weeks | 1 | 1499 | Mean Difference (IV, Random, 95% CI) | ‐0.15 [‐0.42, 0.12] |
| 5.3 4 weeks | 1 | 1502 | Mean Difference (IV, Random, 95% CI) | ‐0.05 [‐0.31, 0.21] |
| 5.4 12 weeks (short‐term) | 1 | 1518 | Mean Difference (IV, Random, 95% CI) | 0.0 [‐0.23, 0.23] |
| 6 Adverse events Show forest plot | 1 | Risk Ratio (M‐H, Random, 95% CI) | Subtotals only | |
| 6.1 Any adverse events (up to 12 weeks) | 1 | 1624 | Risk Ratio (M‐H, Random, 95% CI) | 1.07 [0.86, 1.33] |
| 6.2 Serious adverse events (up to 12 weeks) | 1 | 1643 | Risk Ratio (M‐H, Random, 95% CI) | 0.90 [0.30, 2.67] |
| 7 Global impression of recovery Show forest plot | 1 | Mean Difference (IV, Random, 95% CI) | Subtotals only | |
| 7.1 1 week (immediate‐term) | 1 | 1515 | Mean Difference (IV, Random, 95% CI) | ‐0.05 [‐0.28, 0.18] |
| 7.2 2 weeks | 1 | 1501 | Mean Difference (IV, Random, 95% CI) | ‐0.05 [‐0.28, 0.18] |
| 7.3 4 weeks | 1 | 1511 | Mean Difference (IV, Random, 95% CI) | ‐0.10 [‐0.33, 0.13] |
| 7.4 12 weeks (short‐term) | 1 | 1523 | Mean Difference (IV, Random, 95% CI) | ‐0.05 [‐0.26, 0.17] |
| 8 Poor sleep quality Show forest plot | 1 | Risk Ratio (M‐H, Random, 95% CI) | Subtotals only | |
| 8.1 1 week (immediate‐term) | 1 | 1511 | Risk Ratio (M‐H, Random, 95% CI) | 1.05 [0.87, 1.25] |
| 8.2 2 weeks | 1 | 1500 | Risk Ratio (M‐H, Random, 95% CI) | 1.01 [0.80, 1.28] |
| 8.3 4 weeks | 1 | 1510 | Risk Ratio (M‐H, Random, 95% CI) | 1.11 [0.82, 1.52] |
| 8.4 12 weeks (short‐term) | 1 | 1523 | Risk Ratio (M‐H, Random, 95% CI) | 1.26 [0.90, 1.76] |
| 9 Patient adherence Show forest plot | 1 | Risk Ratio (M‐H, Random, 95% CI) | Subtotals only | |
| 9.1 4 weeks | 1 | 1311 | Risk Ratio (M‐H, Random, 95% CI) | 1.08 [0.96, 1.22] |
| 10 Use of rescue medication Show forest plot | 1 | Risk Ratio (M‐H, Random, 95% CI) | Subtotals only | |
| 10.1 Up to 2 weeks | 1 | 1548 | Risk Ratio (M‐H, Random, 95% CI) | 0.50 [0.16, 1.55] |