Intervenciones para mejorar el cumplimiento con los corticosteroides inhalados para el asma
Información
- DOI:
- https://doi.org/10.1002/14651858.CD012226.pub2Copiar DOI

- Base de datos:
-
- Cochrane Database of Systematic Reviews
- Versión publicada:
-
- 18 abril 2017see what's new
- Tipo:
-
- Intervention
- Etapa:
-
- Review
- Grupo Editorial Cochrane:
-
Grupo Cochrane de Vías respiratorias
- Copyright:
-
- Copyright © 2017 The Cochrane Collaboration. Published by John Wiley & Sons, Ltd.
Cifras del artículo
Altmetric:
Citado por:
Autores
Contributions of authors
RN drafted the Background and Methods section according to the Cochrane Airways Group template, with input and revisions from KK and ES. ES ran the electronic searches. All three review authors contributed to sifting of search results, data extraction and assessment of risk of bias in duplicate. RN and KK ran the data analyses and graded the evidence. All review authors contributed to the write‐up.
Sources of support
Internal sources
-
Kayleigh Kew, UK.
St George's, University of London
-
Rebecca Normansell, UK.
St George's, University of London
-
Elizabeth Stovold, UK.
St George's, University of London
External sources
-
National Institute for Health Research, UK.
Evidence to guide care in adults and children with asthma, 13/89/14
This project was supported by the National Institute for Health Research (NIHR), via Cochrane Infrastructure, Cochrane Programme Grant or Cochrane Incentive funding to the Airways Group. The views and opinions expressed therein are those of the review authors and do not necessarily reflect those of the Systematic Reviews Programme, NIHR, the National Health Service (NHS) or the Department of Health
Declarations of interest
RN is the Deputy Co‐ordinating Editor of the Cochrane Airways Group and is a qualified general practitioner.
ES is the Information Specialist for the Cochrane Airways Group.
KK is a systematic review author who was employed by a Cochrane Airways Programme Grant at the time of writing of this review.
Acknowledgements
Julia Walters was the Editor for this review and commented critically on the review.
The Background and Methods sections of this review are based on a standard template used by the Cochrane Airways Group.
We would like to thank Juliet Foster and Wei Xuan for providing the intracluster correlation coefficient for Foster 2014.
Version history
| Published | Title | Stage | Authors | Version |
| 2017 Apr 18 | Interventions to improve adherence to inhaled steroids for asthma | Review | Rebecca Normansell, Kayleigh M Kew, Elizabeth Stovold | |
| 2016 Jun 06 | Interventions to improve adherence to inhaled steroids for asthma | Protocol | Kayleigh M Kew, Rebecca Normansell, Elizabeth Stovold | |
Differences between protocol and review
We did not use Covidence to extract data from the included studies because we found the process too time consuming, and we were unable to capture different types of data using the software. Instead, we used an Excel template commonly used by the Cochrane Airways Group to capture study characteristics, outcome data and risk of bias information.
In the protocol, we listed various factors that may alter the treatment effect; we intended to present these factors in an additional table. We anticipated that the factors listed (type, delivery, dose and schedule of ICS; whether treatment was given in a combination inhaler with a long‐acting beta‐agonist (LABA), baseline severity of asthma) would document differences between studies, but in practice, studies generally were not designed to assess adherence to a particular type of ICS, dose or regimen, with or without a LABA, so we did not design the table in this way. We have described these factors in the description of studies, and we have presented important clinical and intervention characteristics in Tables 1 to 3.
We had to define post hoc as what constituted an 'objective' measure of adherence. Studies used a variety of measures including self‐report scales, pharmacy refill data, canister weight and electronic monitors. We decided that only electronic monitors could be considered truly objective. In a post hoc change to our analysis plan, we presented studies using objective measures (i.e. electronic inhaler monitors) as the primary analysis for % adherence, as we deemed this a more useful analysis. An analysis including studies that used all measures then follows.
Keywords
MeSH
Medical Subject Headings (MeSH) Keywords
- *Medication Adherence;
- Administration, Inhalation;
- Adrenal Cortex Hormones [administration & dosage];
- Anti‐Asthmatic Agents [*administration & dosage];
- Asthma [*drug therapy];
- Directly Observed Therapy;
- Disease Progression;
- Health Services Needs and Demand [statistics & numerical data];
- Patient Education as Topic;
- Quality of Life;
- Randomized Controlled Trials as Topic;
- Reminder Systems;
- Steroids [*administration & dosage];
- Time Factors;
Medical Subject Headings Check Words
Adult; Child; Humans;
PICO
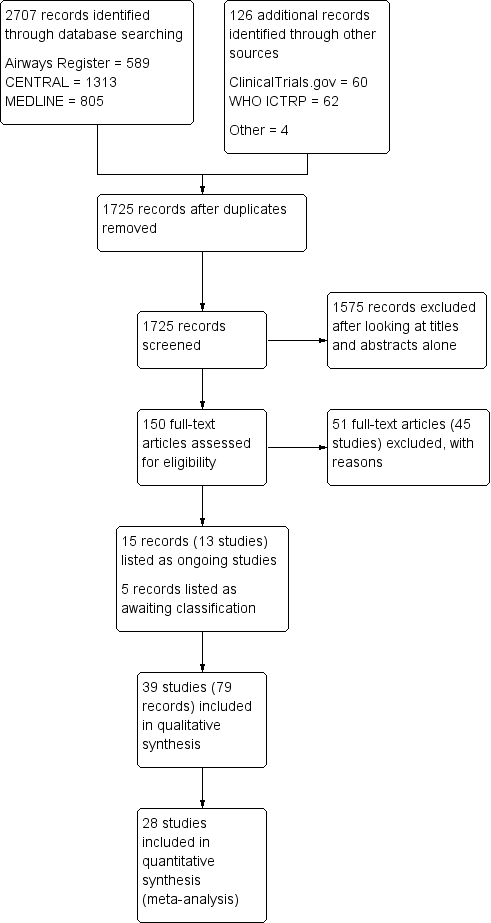
Study flow diagram.
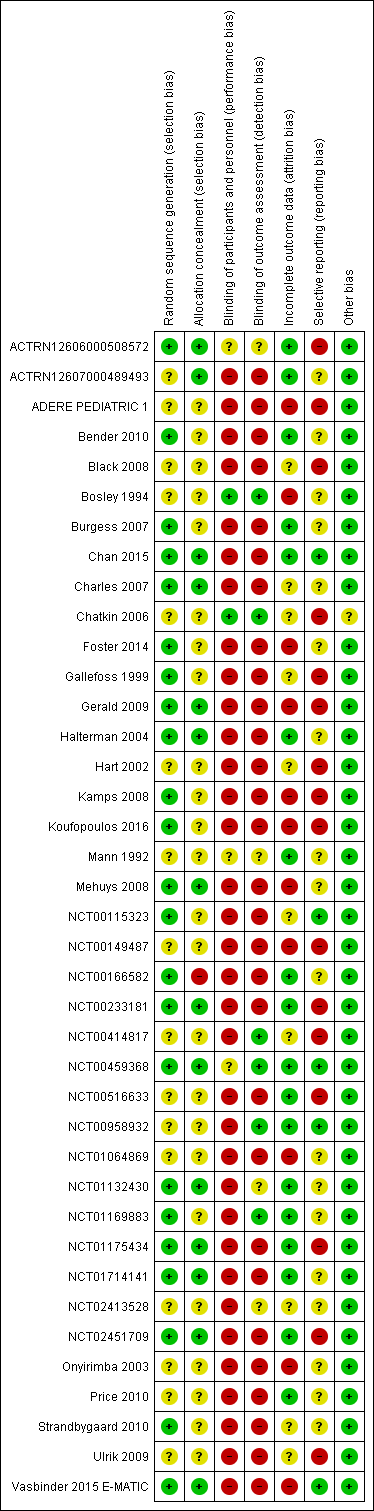
Risk of bias summary: review authors' judgements about each risk of bias item for each included study.
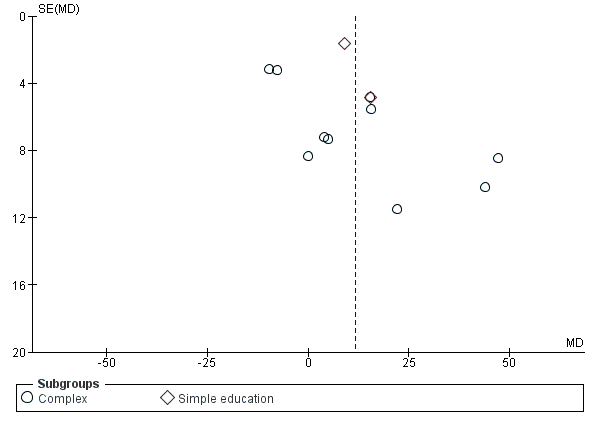
Funnel plot of comparison: 1 Adherence education vs controls, outcome: 1.2 % Adherence (all measures).

Comparison 1 Adherence education versus controls, Outcome 1 % Adherence (objective measures).

Comparison 1 Adherence education versus controls, Outcome 2 % Adherence (all measures).

Comparison 1 Adherence education versus controls, Outcome 3 > 85% adherence.

Comparison 1 Adherence education versus controls, Outcome 4 Exacerbations requiring OCS (people with 1 or more).

Comparison 1 Adherence education versus controls, Outcome 5 Asthma control.
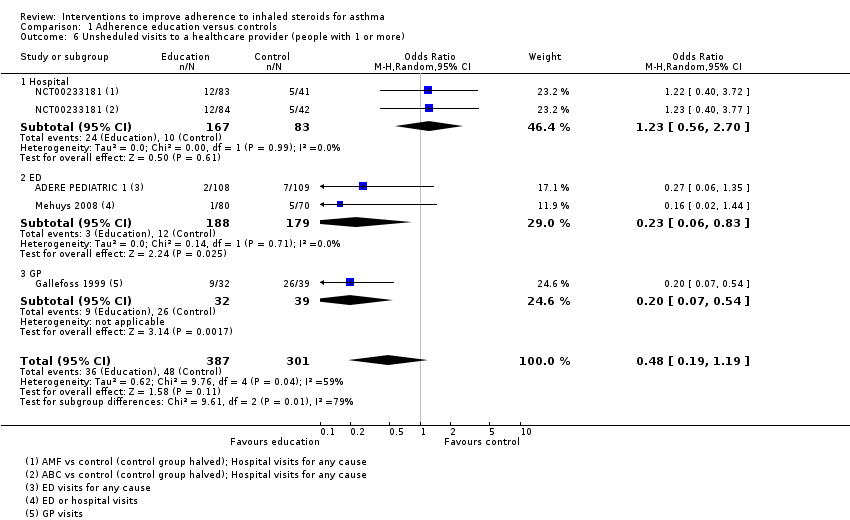
Comparison 1 Adherence education versus controls, Outcome 6 Unsheduled visits to a healthcare provider (people with 1 or more).
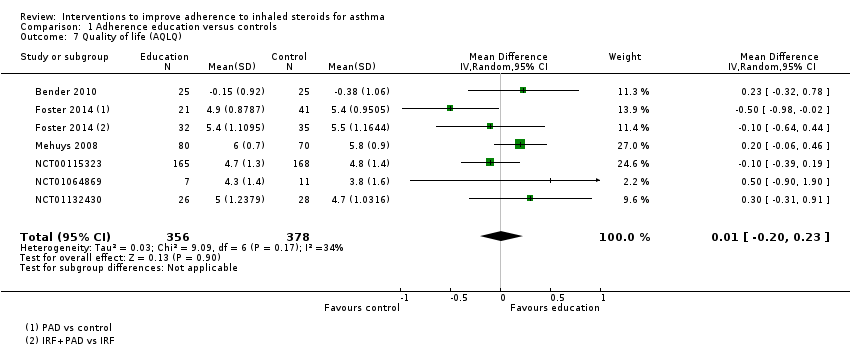
Comparison 1 Adherence education versus controls, Outcome 7 Quality of life (AQLQ).
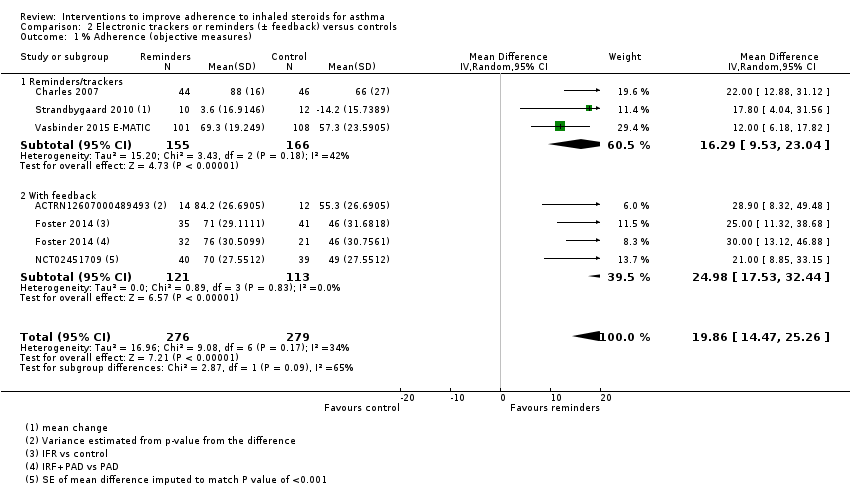
Comparison 2 Electronic trackers or reminders (± feedback) versus controls, Outcome 1 % Adherence (objective measures).
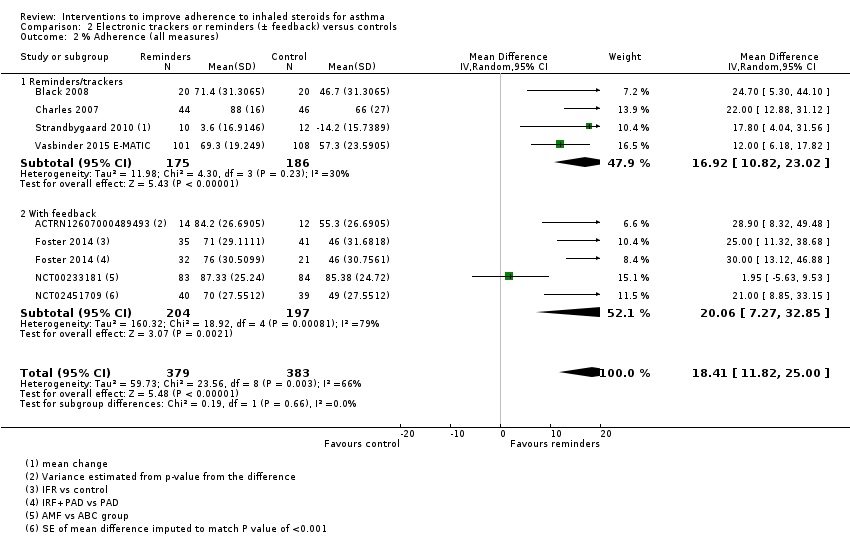
Comparison 2 Electronic trackers or reminders (± feedback) versus controls, Outcome 2 % Adherence (all measures).
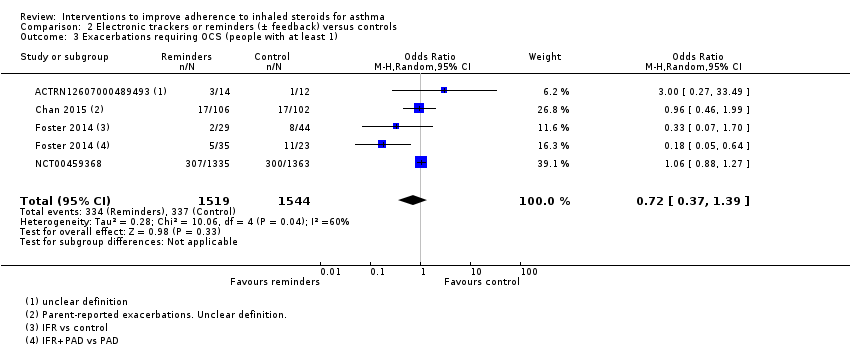
Comparison 2 Electronic trackers or reminders (± feedback) versus controls, Outcome 3 Exacerbations requiring OCS (people with at least 1).
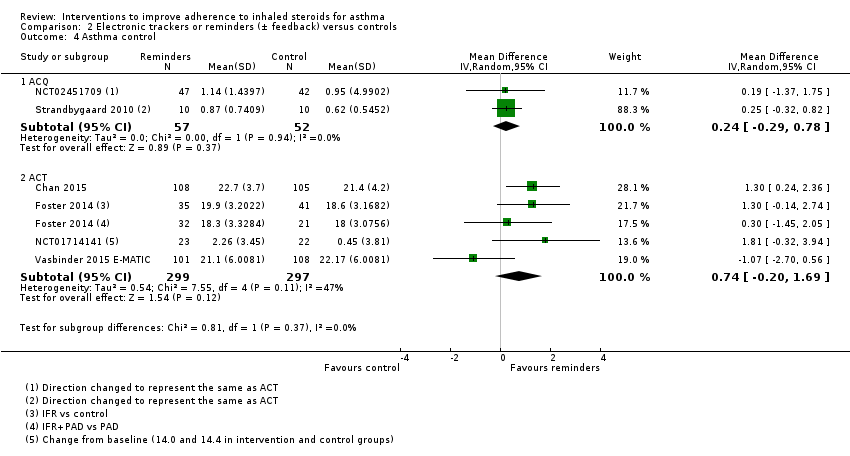
Comparison 2 Electronic trackers or reminders (± feedback) versus controls, Outcome 4 Asthma control.
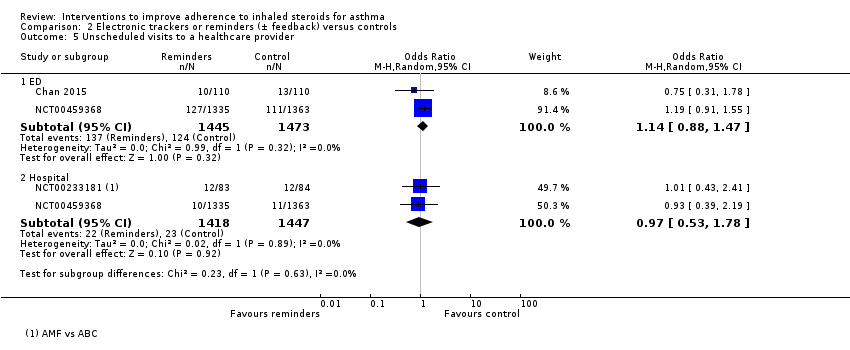
Comparison 2 Electronic trackers or reminders (± feedback) versus controls, Outcome 5 Unscheduled visits to a healthcare provider.

Comparison 2 Electronic trackers or reminders (± feedback) versus controls, Outcome 6 Unscheduled visits to a healthcare provider.

Comparison 2 Electronic trackers or reminders (± feedback) versus controls, Outcome 7 Absenteeism.

Comparison 2 Electronic trackers or reminders (± feedback) versus controls, Outcome 8 Absenteeism.
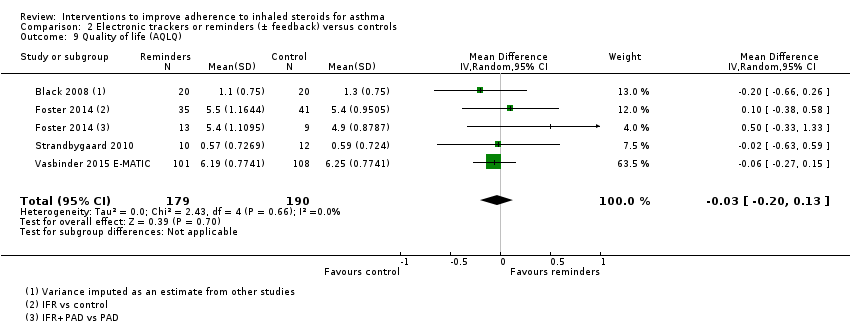
Comparison 2 Electronic trackers or reminders (± feedback) versus controls, Outcome 9 Quality of life (AQLQ).

Comparison 3 Simplified versus usual regimens, Outcome 1 % Adherence.

Comparison 3 Simplified versus usual regimens, Outcome 2 Exacerbations requiring OCS.

Comparison 3 Simplified versus usual regimens, Outcome 3 Asthma control (ACQ).

Comparison 3 Simplified versus usual regimens, Outcome 4 Unscheduled visits.

Comparison 3 Simplified versus usual regimens, Outcome 5 Absence from work/school.

Comparison 3 Simplified versus usual regimens, Outcome 6 Quality of life (ITG‐ASF % change from baseline).

Comparison 3 Simplified versus usual regimens, Outcome 7 All adverse events.

Comparison 4 School‐based ICS therapy versus controls, Outcome 1 Unscheduled visits (1 or more hospitalisations for any cause).
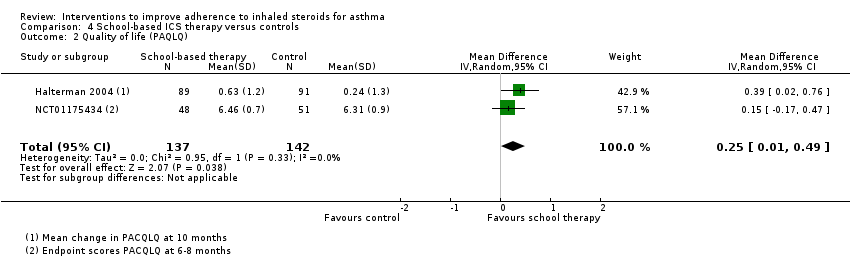
Comparison 4 School‐based ICS therapy versus controls, Outcome 2 Quality of life (PAQLQ).

Comparison 5 Subgroup analyses for % adherence, Outcome 1 Comparison 1. Children vs adults.
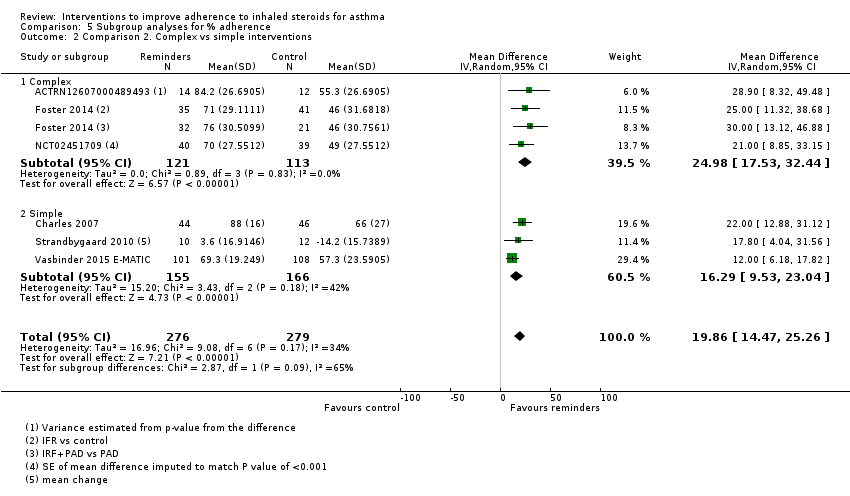
Comparison 5 Subgroup analyses for % adherence, Outcome 2 Comparison 2. Complex vs simple interventions.

Comparison 5 Subgroup analyses for % adherence, Outcome 3 Comparison 2. Children vs adults.
| Adherence education compared with controls for asthma | |||||||
| Patient or population: asthma | |||||||
| Outcomes | Anticipated absolute effects* (95% CI) | Relative effect | Number of participants | Quality of the evidence | Comments | ||
| Risk with controls | Risk with adherence education | ||||||
| % Adherence WMD of follow‐up 71.7 weeks (all studies) | Objective measures | Mean adherence in the control group was 46.7% | Mean adherence with adherence education was 20.13% higher (7.52 higher to 32.74 higher) | ‐ | 280 (5 RCTs) | ⊕⊕⊝⊝ | Only studies in which adherence was measured with an electronic monitor |
| All measures | Mean adherence in the control group was 57.1% | Mean adherence with adherence education was 11.59% higher (3.72 higher to 19.46 higher) | ‐ | 1693 | ⊕⊕⊝⊝ | ||
| Exacerbations requiring OCS (people with 1 or more) WMD of follow‐up 30.8 weeks | 149 per 1000 | 242 per 1000 (148 to 370) | OR 1.82 | 349 | ⊕⊕⊝⊝ | ||
| Asthma control (ACQ) WMD of follow‐up 28.5 weeks | Mean ACQ score was 1.52 | Mean score with adherence education was 0.03 better (0.49 better to 0.43 worse) | ‐ | 455 | ⊕⊕⊕⊝ | Lower score indicates better control. Scale 0 to 6. MCID 0.5 | |
| Asthma control (ACT) WMD of follow‐up 29.5 weeks | Mean ACT score was 18.88 | Mean score with adherence education was 0.30 better | ‐ | 333 | ⊕⊕⊕⊝ | Higher score indicates better control. Scale 5 to 25. MCID 3 | |
| Unsheduled visits to a healthcare provider (people with 1 or more) WMD of follow‐up 67.2 weeks | 159 per 1000 | 83 per 1000 | OR 0.48 | 688 | ⊕⊝⊝⊝ | Includes visits to ED, GP, hospital for any cause | |
| Absenteeism WMD of follow‐up 63.3 weeks | We did not perform an analysis of absences because the data were heavily skewed | ‐ | 109 | Not graded | |||
| Quality of life (AQLQ) WMD of follow‐up 27.4 weeks | Mean AQLQ score was 5 | Mean score with adherence education was 0.01 better (0.20 worse to 0.23 better) | ‐ | 734 | ⊕⊕⊕⊝ | Higher score indicates better QOL. Scale 1 to 7. MCID 0.5 | |
| *The risk in the intervention group (and its 95% confidence interval) is based on assumed risk in the comparison group and the relative effect of the intervention (and its 95% CI) | |||||||
| GRADE Working Group grades of evidence | |||||||
| aDowngraded once primarily owing to risk of bias from open‐label trials and some concerns regarding attrition bias, selective reporting and selection bias (‐1 risk of bias) bDowngraded once owing to inconsistency between study results (‐1 inconsistency) cFunnel plot examined; no clear evidence of publication bias (no downgrade for publication bias) dConfidence intervals include no difference and/or potential important harm or benefit of the intervention (‐1 imprecision) eConfidence intervals fall within the established MCID for this scale (no downgrade for imprecision) fStudies contributing to this analysis reported different types of unscheduled visits and some recorded visits for any cause rather than asthma alone (‐1 indirectness) gUnclear how absenteeism was defined or reported, and different participants may have different thresholds for missing work or school. One study was conducted in children and the other in adults. Combined, this makes the outcome hard to interpret | |||||||
| Electronic trackers or reminders (±feedback) compared with controls for asthma | |||||||
| Patient or population: asthma | |||||||
| Outcomes | Anticipated absolute effects* (95% CI) | Relative effect | Number of participants | Quality of the evidence | Comments | ||
| Risk with controls | Risk with electronic trackers or reminders (± feedback) | ||||||
| % Adherence WMD of follow‐up 47.6 weeks | Objective measures only | Mean adherence in the control group was 53.27% | Mean adherence was 19.86% higher (14.47 higher to 25.26 higher) | ‐ | 555 (6 RCTs) | ⊕⊕⊕⊝ | Only studies in which adherence was measured with an electronic monitor |
| All measures | Mean adherence in the control group was 56.06% | Mean adherence with trackers was 18.41% higher (11.82 higher to 25.00 higher) | ‐ | 762 (8 RCTs) | ⊕⊕⊝⊝ | ||
| Exacerbations requiring OCS (people with at least 1) WMD of follow‐up 48.6 weeks | 218 per 1000 | 169 per 1000 | OR 0.72 | 3063 | ⊕⊝⊝⊝ | ||
| Asthma control (ACQ) WMD of follow‐up 43.0 weeks | Mean ACQ score in the control group was 0.89 | Mean score with trackers or reminders was 0.24 better (0.29 worse to 0.78 better) | ‐ | 109 | ⊕⊕⊝⊝ | Lower score indicates better control. Scale 0 to 6. MCID 0.5 | |
| Asthma control (ACT) WMD of follow‐up 34.0 weeks | Mean ACT score in the control group was 20.04 | Mean score with trackers or reminders was 0.74 better (0.20 worse to 1.69 better) | ‐ | 596 | ⊕⊕⊝⊝ | Higher score indicates better control. Scale 5 to 25. MCID 3 | |
| Unscheduled healthcare visits to a healthcare provider (ED) WMD of follow‐up 50.0 weeks | 84 per 1000 | 95 per 1000 | OR 1.14 | 2918 | ⊕⊕⊕⊝ | Two studies (n = 2865) also reported hospitalisations. OR 0.97 (0.53 to 1.78) | |
| Absenteeism (people with at least 1 absence) Follow‐up 26 weeks | 327 per 1000 | 409 per 1000 | OR 1.42 | 220 | ⊕⊕⊝⊝ | ||
| Quality of life (AQLQ) WMD of follow‐up 36.8 weeks | Mean AQLQ score in the control group was 5.15 | Mean score with trackers or reminders was 0.03 worse (0.13 better to 0.20 worse) | ‐ | 369 | ⊕⊕⊕⊝ | Higher score indicated better QOL. Scale 1 to 7. MCID 0.5 | |
| *The risk in the intervention group (and its 95% confidence interval) is based on assumed risk in the comparison group and the relative effect of the intervention (and its 95% CI). | |||||||
| GRADE Working Group grades of evidence | |||||||
| aDowngraded once primarily owing to risk of bias from open‐label trials and some concerns regarding attrition bias, selective reporting and selection bias (‐1 risk of bias) bDowngraded once for inconsistency between study results (‐1 inconsistency) cConfidence intervals include no difference and potential important harm and benefit of the intervention (‐1 imprecision) dConfidence intervals fall within the MCID for this scale (no downgrade for imprecision) eDowngraded once owing to risk of performance and detection bias (‐1 risk of bias) | |||||||
| Simplified compared with usual regimens for asthma | ||||||
| Patient or population: asthma | ||||||
| Outcomes | Anticipated absolute effects* (95% CI) | Relative effect | Number of participants | Quality of the evidence | Comments | |
| Risk with usual regimens | Risk with simplified regimens | |||||
| % Adherence (objective measures) WMD of follow‐up 12.9 weeks | Mean adherence in the control group was 86.73% | Mean adherence with simplified regimens was 4.02% higher | ‐ | 1310 | ⊕⊕⊕⊝ | Only studies in which adherence was measured with an electronic monitor |
| Exacerbations requiring OCS People with 1 or more Follow‐up 12 weeks | 125 per 1000 | 250 per 1000 | OR 2.33 | 16 | ⊕⊕⊝⊝ | |
| Asthma control (ACQ) Follow‐up 24 weeks | Mean ACQ score in the control group was 0.89 | Mean score with simplified regimens was 0.03 better (0.34 better to 0.28 worse) | ‐ | 103 | ⊕⊕⊕⊝ | Lower score indicates better control. Scale 0 to 6. MCID 0.5 |
| Unscheduled visits Follow‐up 12 weeks | 63 per 1000 | 72 per 1000 | OR 1.17 | 1037 | ⊕⊕⊝⊝ | |
| Absence from work/school Follow‐up 12 weeks | 19 per 1000 | 18 per 1000 | OR 0.93 | 1037 | ⊕⊕⊝⊝ | |
| Change in quality of life (ITG‐ASF) Follow‐up 12 weeks | Mean change in quality of life in the control group was 14 | Mean change with simplified regimens was 6 points better | ‐ | 1037 | ⊕⊕⊝⊝ | Higher score indicates better QOL. Range 0 to 100. MCID not known |
| All adverse events Follow‐up 12 weeks | 175 per 1000 | 139 per 1000 | OR 0.76 | 1233 | ⊕⊕⊝⊝ | |
| *The risk in the intervention group (and its 95% confidence interval) is based on assumed risk in the comparison group and the relative effect of the intervention (and its 95% CI) | ||||||
| GRADE Working Group grades of evidence | ||||||
| aDowngraded once primarily owing to lack of blinding and some concerns regarding attrition bias, selective reporting and selection bias (‐1 risk of bias) bOne very small trial resulting in very wide confidence intervals (‐2 imprecision) cAlthough confidence intervals fall within the MCID, only one study contributed to this outcome (‐1 imprecision) dConfidence intervals include both important potential harm and benefit of the intervention (‐1 imprecision) eConfidence intervals do not exclude no difference (‐1 imprecision) fConfidence intervals range from no difference to an important benefit of simplified regimens (‐1 imprecision) | ||||||
| School‐based ICS therapy compared with home therapy for asthma | ||||||
| Patient or population: children with asthma Settings: school Intervention: ICS given at school Comparison: ICS given at home | ||||||
| Outcomes | Illustrative comparative risks* (95% CI) | Relative effect | Number of participants | Quality of the evidence | Comments | |
| Assumed risk | Corresponding risk | |||||
| Control | School‐based ICS therapy | |||||
| Unscheduled visits 1 or more hospitalisations for any cause WMD of follow‐up 35.8 weeks | 49 per 1000 | 29 per 1000 | OR 0.58 (0.16 to 2.05) | 279 | ⊕⊕⊝⊝ | |
| Quality of life (PACQLQ) 1 to 7; higher is better WMD of follow‐up 35.8 weeks | Mean PAQLQ score in the control group was 6.31 | Mean score in the intervention groups was | ‐ | 279 | ⊕⊕⊕⊝ MODERATEa | |
| Adverse events Follow‐up 30 weeks | No events observed in either arm | ‐ | 99 (1 RCT) | Not graded | ||
| *The basis for the assumed risk (e.g. median control group risk across studies) is provided in footnotes. The corresponding risk (and its 95% confidence interval) is based on assumed risk in the comparison group and the relative effect of the intervention (and its 95% CI) | ||||||
| GRADE Working Group grades of evidence | ||||||
| No data could be meta‐analysed for adherence, exacerbations requiring OCS, asthma control or absenteeism. Some data are presented narratively in the review aBoth contributing studies considered at high risk for performance and detection bias bConfidence intervals include both potential harm and benefit of the intervention | ||||||
| Study ID ("first received" date for clinical trials registries) | Total n | Duration of intervention/follow‐up | Age | Country | Intervention | Control | Adherence measure | Outcomes |
| (2005) | 333 | 13/26 weeks | Adults | USA | Problem‐solving intervention | Asthma education | Electronic inhaler monitor | Adherence, AQLQ, ACQ, LFTs, hospitalisation, ED visits, participant satisfaction |
| 50 | 10 weeks | Adults | USA | Interactive voice response intervention | Usual care | Electronic inhaler monitor or canister weight | Adherence, AQLQ, ACT, Beliefs about Medication Questionnaire | |
| (2009) | 1187 | 2 years | Children | USA | Telephone speech recognition intervention | Usual care | Total ICS supplied/total prescribed | Adherence, beta‐agonist use, OCS use, primary care, ED and out of hours visits, hospitalisations, participant satisfaction |
| 271 | 13 weeks | Adolescents and adults | Brazil | Telephone counselling | Ususal care | "Number of inhalations recorded on the disks" | Adherence | |
| (2005) | 141 | 17 weeks/1 year | Children | USA | Problem‐solving intervention | Family‐based intervention | Electronic inhaler monitor | Adherence, symptoms, use of healthcare services, reliever medication use |
| (2009) | 55 | 2 months | Children | USA | Team work intervention | Asthma education | Electronic inhaler monitor | Adherence, Parent‐Adolescent Conflict Questionnaire, Functional Severity Index, LFTs, Consumer Satisfaction Survey |
| 60 GPs, 143 patients | 6 months | Adolescents and adults | Australia | Personalised adherence discussion (PAD) PAD + inhaler reminder feedback (IRF) | Usual care | Electronic inhaler monitor | ACT, AQLQ, Hospital Anxiety and Depression Scale, Medication Adherence Report Scale, LFTs, exacerbations | |
| 78 | 1 year | Adults | Norway | Asthma education | Usual care | Prescribed doses/dispensed doses | Adherence, GP visits, absenteeism, days in hospital | |
| (2010) | 20 | 12 weeks/1 year | Not reported, but mean age suggests adults | Northern Ireland | Nurse‐led psychoeducation | Ususal care (difficult asthma service) | Percent of prescriptions refilled | Adherence, OCS, beta‐agonist use, hospital admissions, LFTs, ACQ, AQLQ, Hospital Anxiety and Despression Scale |
| (2008) | 298 | 90 weeks | Children | Brazil | Telephone follow‐up intervention | Usual care | Percentage of actual doses/number expected | Adherence, disease control, quality of life (SF‐36) |
| 83 | 13 weeks | Children | UK | Asthma education | Usual care | Electronic inhaler monitor | Adherence, beliefs and anxieties about adherence | |
| (2007) | 60 | 26 weeks/78 weeks | Children | Sweden | Group discussion plus basic education | Basic education | Diaries and canister weight | Adherence, views on adherence, days hospitalised, ED visits, exacerbations |
| 15 | 6 weeks/52 weeks | Children | USA | Specific adherence improvement strategies (education, monitoring, etc.) | Usual care plus education | Electronic inhaler monitor | Adherence, LFTs, PedsQL, healthcare costs | |
| (2010) | 54 | 6 weeks/52 weeks | Adults | Canada | Motivational interviewing | Usual care | Prescribed treatment days/number of days | Adherence, asthma control, quality of life, asthma‐related self‐efficacy |
| 201 | 6 months | Adults | Belgium | Adherence education | Usual care | Prescription refill rates, self‐reporting | ACT, diary card, rescue medication use, ED visits, hospitalisations, AQLQ, Knowledge of Asthma and Asthma Medicine Questionnaire, inhalation technique | |
| (2010) | 68 | 10 weeks | Adolescents | USA | Adherence messaging and group sessions | "Attention control" | Electronic inhaler monitor | Adherence, asthma knowledge, ICS knowledge, ICS self‐efficacy, social support, exacerbations |
| (2015) | 12 | 12 weeks | Adolescents | USA | Adherence monitoring and incentivisation via app and sensor | Usual care | Electronic inhaler monitor | Adherence, ACT NB: study terminated |
| 30 | 10 weeks | Adults | USA | Adherence monitoring and education | Monitoring without feedback | Electronic inhaler monitor | Adherence, rescue medication use, AQLQ, LFTs | |
| (2005) | 250 | 78 weeks | Children | USA | Adherence education | Usual care | Prescription refill rates, self‐reporting | Adherence, symptoms, night‐time awakenings, ED visits, hospitalisation, OCS courses |
| 274 | 12 weeks | Adults | Denmark and Switzerland | Adherence education and study medication | Study medication alone | Dose counting in returned investigational product | Adherence, asthma control, LFTs, symptoms, rescue medication use, night‐time awakenings, adverse events, AQLQ, asthma severity, adverse events, vital signs | |
| (2006) | 14,064 (6903 previous ICS users) | 78 weeks | Adults | USA | Telephone interactive voice recognition intervention | Usual care | Pharmacy‐based adherence measures | Adherence, use of healthcare services, economic evaluation |
| ACQ: Asthma Control Questionnaire; ACT: Asthma Control Test; AQLQ: Asthma Quality of Life Questionnaire; ED: emergency department; GP: general practitioner; ICS: inhaled corticosteroid; IRF: inhaler reminder feedback; LFTs: lung function tests; OCS: oral corticosteroid; PAD: personalised adherence discussion; PedsQL: Paediatric Quality of Life Inventory; SF‐36: Short‐Form Health Survey | ||||||||
| Study ID | Total n | Duration of intervention/follow‐up | Age | Country | Intervention | Control | Adherence measure | Outcomes |
| 40 | 2 months | Children | New Zealand | Inhaler alarm | Usual care | Electronic inhaler monitor | Adherence, AQLQ, LFTs, beta‐agonist use | |
| (2007) | 26 | 4 months | Children | Australia | Adherence feedback during consultations | Usual care | Electronic inhaler monitor | Adherence, symptoms, LFTs |
| 220 | 6 months | Children | New Zealand | Audiovisual inhaler reminder | Usual care | Electronic inhaler monitor | Adherence, school/work absences, ACT, Asthma Morbidity Score, exacerbations, unscheduled visits, beta‐agonist use, LFTs | |
| 110 | 24 weeks | Adolescents and adults | New Zealand | Audiovisual inhaler reminder | Usual care | Electronic inhaler monitor | Adherence, ACQ, LFTs | |
| 60 GPs, 143 patients | 6 months | Adolescents and adults | Australia | Inhaler reminder and feedback (IRF) | Usual care | Electronic inhaler monitor | ACT, AQLQ, Hospital Anxiety and Depression Scale, Medication Adherence Report Scale, LFTs, exacerbations | |
| (2012) | 49 | 13 weeks | Young adults | USA | Computer sessions and tailored text reminders | Asthma education | Self‐reported missed doses | Adherence, ACT, LFTs, participant satisfaction |
| (2015) | 90 | 1 year | Children | UK | Adherence monitoring with feedback | Adherence monitoring but no feedback | Electronic inhaler monitor | "Clinical outcomes", adherence, LFTs, exacerbations |
| (2005) | 250 | 78 weeks | Children | USA | Adherence monitoring and education | Adherence education | Prescription refill rates, self‐reporting | Adherence, symptoms, night‐time awakenings, ED visits, hospitalisation, OCS courses |
| 26 | 12 weeks | Adults | Denmark | SMS (text message) adherence reminders | Usual care | "Dose‐count" on the Seretide was diskus | Adherence, change in FeNO, LFTs, airway responsiveness | |
| 219 | 52 weeks | Children | The Netherlands | SMS (text message) adherence reminders | Usual care | Electronic inhaler monitor | Adherence, ACT, exacerbations, use of healthcare services, AQLQ, school/work absence, acceptance of e‐monitoring, economic evaluation | |
| (2007) | 2698 (34 clusters) | 52 weeks | Children and adults | USA | Adherence education with adherence feedback | Adherence education alone | Electronic prescribing data/refill rate | Adherence, ED visits, hospitalisation, OCS use |
| ACQ: Asthma Control Questionnaire; ACT: Asthma Control Test; AQLQ: Asthma Quality of Life Questionnaire; ED: emergency department; FeNO: fractional exhaled nitric oxide; ICS: inhaled corticosteroid; LFTs: lung function tests; OCS: oral corticosteroid | ||||||||
| Study ID | Total n | Duration of intervention/follow‐up | Age | Country | Intervention | Control | Adherence measure | Outcomes |
| 102 | 12 weeks | Adults | UK | Combined inhaler | Separate inhalers | Electronic inhaler monitor | Adherence, LFTs | |
| 16 | 6 weeks/12 weeks | Adults | USA | Twice‐daily dosing | Four‐times‐daily dosing | Electronic inhaler monitor | Adherence, LFTs, symptoms | |
| (2007) | 111 | 24 weeks | Children | New Zealand | Combined inhaler | Separate inhalers | Electronic inhaler monitor | Adherence, LFTs, ACQ, OCS, unscheduled visits |
| 1233 | 12 weeks | Adolescents and adults | UK | Once‐daily ICS | Twice‐daily ICS | "Device counter number" | Adherence, physician assessment of response, quality of life, use of healthcare services, days of school/work missed, adverse events, worsening asthma | |
| ACQ: Asthma Control Questionnaire; ICS: inhaled corticosteroid; LFTs: lung function tests; OCS: oral corticosteroid | ||||||||
| Study ID | Total n | Duration of intervention/follow‐up | Age | Country | Intervention | Control | Adherence measure | Outcomes |
| 290 | 65 weeks | Children | USA | Supervised ICS therapy at school | Usual care | N/A | Episodes of poor asthma control, school absences, rescue medication use at school | |
| 184 | 9 weeks | Children | USA | Supervised ICS therapy at school | Usual care | N/A | Symptom‐free days, daytime and night‐time symptoms, rescue medication use, school absences | |
| (2010) | 100 | 6 to 8 months | Children | USA | Supervised ICS therapy at school | Usual care | N/A | Feasibility, symptom‐free days, numbers of days and nights with symptoms, activity limitation, rescue medication use, school absenteeism, parent sleep interruption, change in family plans due to the child’s asthma, PAQLQ, utilisation of healthcare services, FeNO |
| FeNO: fractional exhaled nitric oxide; ICS: inhaled corticosteroid; PAQLQ: Pediatric Asthma Quality of Life Questionnaire | ||||||||
| Outcome or subgroup title | No. of studies | No. of participants | Statistical method | Effect size |
| 1 % Adherence (objective measures) Show forest plot | 5 | 280 | Mean Difference (IV, Random, 95% CI) | 20.13 [7.52, 32.74] |
| 1.1 Complex | 4 | 230 | Mean Difference (IV, Random, 95% CI) | 21.55 [4.71, 38.39] |
| 1.2 Simple education | 1 | 50 | Mean Difference (IV, Random, 95% CI) | 15.40 [5.98, 24.82] |
| 2 % Adherence (all measures) Show forest plot | 10 | 1693 | Mean Difference (IV, Random, 95% CI) | 11.59 [3.72, 19.46] |
| 2.1 Complex | 8 | 744 | Mean Difference (IV, Random, 95% CI) | 12.21 [1.26, 23.17] |
| 2.2 Simple education | 2 | 949 | Mean Difference (IV, Random, 95% CI) | 10.60 [5.17, 16.03] |
| 3 > 85% adherence Show forest plot | 1 | 271 | Odds Ratio (M‐H, Random, 95% CI) | 2.68 [1.61, 4.46] |
| 4 Exacerbations requiring OCS (people with 1 or more) Show forest plot | 3 | 349 | Odds Ratio (M‐H, Random, 95% CI) | 1.82 [0.99, 3.36] |
| 5 Asthma control Show forest plot | 6 | Mean Difference (IV, Random, 95% CI) | Subtotals only | |
| 5.1 ACQ | 4 | 455 | Mean Difference (IV, Random, 95% CI) | ‐0.03 [‐0.49, 0.43] |
| 5.2 ACT | 3 | 333 | Mean Difference (IV, Random, 95% CI) | 0.30 [‐0.82, 1.43] |
| 6 Unsheduled visits to a healthcare provider (people with 1 or more) Show forest plot | 4 | 688 | Odds Ratio (M‐H, Random, 95% CI) | 0.48 [0.19, 1.19] |
| 6.1 Hospital | 1 | 250 | Odds Ratio (M‐H, Random, 95% CI) | 1.23 [0.56, 2.70] |
| 6.2 ED | 2 | 367 | Odds Ratio (M‐H, Random, 95% CI) | 0.23 [0.06, 0.83] |
| 6.3 GP | 1 | 71 | Odds Ratio (M‐H, Random, 95% CI) | 0.20 [0.07, 0.54] |
| 7 Quality of life (AQLQ) Show forest plot | 6 | 734 | Mean Difference (IV, Random, 95% CI) | 0.01 [‐0.20, 0.23] |
| Outcome or subgroup title | No. of studies | No. of participants | Statistical method | Effect size |
| 1 % Adherence (objective measures) Show forest plot | 6 | 555 | Mean Difference (IV, Random, 95% CI) | 19.86 [14.47, 25.26] |
| 1.1 Reminders/trackers | 3 | 321 | Mean Difference (IV, Random, 95% CI) | 16.29 [9.53, 23.04] |
| 1.2 With feedback | 3 | 234 | Mean Difference (IV, Random, 95% CI) | 24.98 [17.53, 32.44] |
| 2 % Adherence (all measures) Show forest plot | 8 | 762 | Mean Difference (IV, Random, 95% CI) | 18.41 [11.82, 25.00] |
| 2.1 Reminders/trackers | 4 | 361 | Mean Difference (IV, Random, 95% CI) | 16.92 [10.82, 23.02] |
| 2.2 With feedback | 4 | 401 | Mean Difference (IV, Random, 95% CI) | 20.06 [7.27, 32.85] |
| 3 Exacerbations requiring OCS (people with at least 1) Show forest plot | 4 | 3063 | Odds Ratio (M‐H, Random, 95% CI) | 0.72 [0.37, 1.39] |
| 4 Asthma control Show forest plot | 6 | Mean Difference (IV, Random, 95% CI) | Subtotals only | |
| 4.1 ACQ | 2 | 109 | Mean Difference (IV, Random, 95% CI) | 0.24 [‐0.29, 0.78] |
| 4.2 ACT | 4 | 596 | Mean Difference (IV, Random, 95% CI) | 0.74 [‐0.20, 1.69] |
| 5 Unscheduled visits to a healthcare provider Show forest plot | 3 | Odds Ratio (M‐H, Random, 95% CI) | Subtotals only | |
| 5.1 ED | 2 | 2918 | Odds Ratio (M‐H, Random, 95% CI) | 1.14 [0.88, 1.47] |
| 5.2 Hospital | 2 | 2865 | Odds Ratio (M‐H, Random, 95% CI) | 0.97 [0.53, 1.78] |
| 6 Unscheduled visits to a healthcare provider Show forest plot | 1 | Rate Ratio (Random, 95% CI) | Totals not selected | |
| 6.1 GP/ED visits | 1 | Rate Ratio (Random, 95% CI) | 0.0 [0.0, 0.0] | |
| 6.2 Hospitalisations | 1 | Rate Ratio (Random, 95% CI) | 0.0 [0.0, 0.0] | |
| 7 Absenteeism Show forest plot | 1 | Odds Ratio (M‐H, Random, 95% CI) | Totals not selected | |
| 8 Absenteeism Show forest plot | 1 | Rate Ratio (Fixed, 95% CI) | Subtotals only | |
| 9 Quality of life (AQLQ) Show forest plot | 4 | 369 | Mean Difference (IV, Random, 95% CI) | ‐0.03 [‐0.20, 0.13] |
| Outcome or subgroup title | No. of studies | No. of participants | Statistical method | Effect size |
| 1 % Adherence Show forest plot | 3 | 1310 | Mean Difference (IV, Random, 95% CI) | 4.02 [1.88, 6.16] |
| 2 Exacerbations requiring OCS Show forest plot | 1 | Odds Ratio (M‐H, Random, 95% CI) | Totals not selected | |
| 3 Asthma control (ACQ) Show forest plot | 1 | Mean Difference (IV, Random, 95% CI) | Totals not selected | |
| 4 Unscheduled visits Show forest plot | 1 | Odds Ratio (M‐H, Random, 95% CI) | Totals not selected | |
| 5 Absence from work/school Show forest plot | 1 | Odds Ratio (M‐H, Random, 95% CI) | Totals not selected | |
| 6 Quality of life (ITG‐ASF % change from baseline) Show forest plot | 1 | Mean Difference (IV, Random, 95% CI) | Totals not selected | |
| 7 All adverse events Show forest plot | 1 | Odds Ratio (M‐H, Random, 95% CI) | Totals not selected | |
| Outcome or subgroup title | No. of studies | No. of participants | Statistical method | Effect size |
| 1 Unscheduled visits (1 or more hospitalisations for any cause) Show forest plot | 2 | 279 | Odds Ratio (M‐H, Random, 95% CI) | 0.58 [0.16, 2.05] |
| 2 Quality of life (PAQLQ) Show forest plot | 2 | 279 | Mean Difference (IV, Random, 95% CI) | 0.25 [0.01, 0.49] |
| Outcome or subgroup title | No. of studies | No. of participants | Statistical method | Effect size |
| 1 Comparison 1. Children vs adults Show forest plot | 10 | 1693 | Mean Difference (IV, Random, 95% CI) | 11.59 [3.72, 19.46] |
| 1.1 Children | 4 | 1241 | Mean Difference (IV, Random, 95% CI) | 8.01 [‐4.77, 20.79] |
| 1.2 Adults/adolescents and adults | 6 | 452 | Mean Difference (IV, Random, 95% CI) | 14.43 [5.49, 23.36] |
| 2 Comparison 2. Complex vs simple interventions Show forest plot | 6 | 555 | Mean Difference (IV, Random, 95% CI) | 19.86 [14.47, 25.26] |
| 2.1 Complex | 3 | 234 | Mean Difference (IV, Random, 95% CI) | 24.98 [17.53, 32.44] |
| 2.2 Simple | 3 | 321 | Mean Difference (IV, Random, 95% CI) | 16.29 [9.53, 23.04] |
| 3 Comparison 2. Children vs adults Show forest plot | 6 | 555 | Mean Difference (IV, Random, 95% CI) | 19.86 [14.47, 25.26] |
| 3.1 Children | 3 | 314 | Mean Difference (IV, Random, 95% CI) | 17.29 [8.32, 26.26] |
| 3.2 Adults/adolescents and adults | 3 | 241 | Mean Difference (IV, Random, 95% CI) | 22.84 [16.66, 29.02] |