Interventions visant à améliorer l’observance de la corticothérapie par inhalation dans l’asthme
Résumé scientifique
Contexte
Malgré leur efficacité prouvée pour améliorer les symptômes et réduire les exacerbations, de nombreux patients asthmatiques n’utilisent pas tout à fait correctement leurs corticoïdes en inhalateur. Cette observance sous‐optimale conduit à une dégradation des résultats cliniques et une augmentation de l’utilisation des services de santé, et a été identifiée comme un facteur contribuant à un tiers des décès dus à l’asthme au Royaume‐Uni. Les raisons de non‐observance varient et diverses interventions ont été proposées pour améliorer l’observance.
Objectifs
Évaluer l’efficacité et l’innocuité des interventions visant à améliorer l’observance de la corticothérapie inhalée chez les patients asthmatiques.
Stratégie de recherche documentaire
Nous avons identifié des essais dans le registre d’essais du Groupe Cochrane sur les voies respiratoires, qui contient des études identifiées lors de multiples recherches électroniques et de recherches manuelles dans d’autres sources. Nous avons également effectué des recherches dans des registres d’essais cliniques et les références bibliographiques des études primaires. Nous avons effectué les recherches les plus récentes le 18 novembre 2016.
Critères de sélection
Nous avons inclus les essais contrôlés randomisés en parallèle et en grappes de toute durée et menés dans tous les contextes. Nous avons inclus les études rapportées dans des articles complets, uniquement sous forme de résumé, ainsi que des données non publiées. Nous avons inclus les essais portant sur des adultes et enfants asthmatiques ayant une prescription de corticoïdes inhalés (en monothérapie ou en association avec un agoniste bêta‐2‐adrénergique d’action prolongée (BAAP)). Les essais éligibles comparaient une intervention visant principalement à améliorer l’adhésion à la corticothérapie par inhalation par rapport aux soins habituels ou à une autre intervention.
Recueil et analyse des données
Deux auteurs de la revue ont passé au crible les recherches, extrait les caractéristiques de l’étude et les données des résultats des études incluses et évalué le risque de biais. Les critères de jugement principaux étaient l’observance de la corticothérapie par inhalation, les exacerbations nécessitant au moins des corticoïdes oraux et le contrôle de l’asthme. Nous avons classé les résultats et les données probantes présentées dans des tableaux récapitulatifs des résultats pour chaque comparaison.
Nous avons analysé les données dichotomiques en tant que rapports des cotes et les données continues sous forme de différences moyennes ou de différences moyennes standardisées, toujours à l’aide d’un modèle à effets aléatoires. Nous avons décrit les données asymétriques de manière narrative. Nous n'avons fait aucune hypothèse a priori concernant la manière dont les essais pourraient être classés mais nous avons réalisé des méta‐analyses uniquement si les traitements, les participants et la question clinique sous‐jacente étaient suffisamment semblables pour que leur regroupement ait un sens.
Résultats principaux
Nous avons inclus 39 essais contrôlés randomisés (ECR) en parallèle portant sur des adultes et des enfants atteints d’asthme, dont 28 (n = 16 303) ont fourni des données pour au moins une méta‐analyse. La durée du suivi allait de deux mois à deux ans (médiane de six mois), et les essais ont été réalisés principalement dans les pays à revenu élevé. La plupart des études ont rapporté une certaine mesure de l’observance de la corticothérapie par inhalation ainsi que divers autres critères de jugement tels que la qualité de vie et le contrôle de l’asthme. Les études étaient généralement à risque faible ou incertain de biais de sélection et à risque élevé de biais associé à la mise en aveugle. Nous avons considéré qu’environ la moitié des études étaient à risque élevé de biais d’attrition et de notification sélective des résultats.
Nous avons classé les études en quatre comparaisons : éducation à l’observance par rapport à un groupe témoin (20 études), traqueurs ou rappels électroniques par rapport à un groupe témoin (11 études), simplification de la posologie par rapport aux schémas de traitement habituels (4 études), surveillance directe du traitement en milieu scolaire (3 études). Deux études sont décrites séparément.
Tous les résultats combinés pour l’éducation à l’observance, les traceurs ou rappels électroniques et les posologies simplifiées ont montré une meilleure observance que ceux des contrôles. Les analyses limitées aux études utilisant des mesures objectives ont révélé que l’éducation sur l’observance donnait un bénéfice de 20 points de pourcentage par rapport à un groupe témoin (intervalle de confiance (IC) à 95% de 7,52 à 32,74 ; cinq études ; données de mauvaise qualité), les traceurs ou rappels électroniques ont montré une observance améliorée de 19 points (IC à 95 % de 14,47 à 25,26 ; six études ; données de qualité moyenne) et la simplification de la posologie une amélioration de 4 points (IC à 95 % de 1,88 à 6,16 ; trois études ; données de qualité moyenne). Notre confiance dans les données probantes a été réduite par le risque de biais et le manque de cohérence.
Les améliorations de l’observance ne se sont pas systématiquement traduites par un bénéfice observable des critères de jugement cliniques dans nos analyses regroupées. Aucun des types d’intervention n’a montré un bénéfice clair pour nos principaux critères de jugement cliniques (exacerbations nécessitant des corticoïdes oraux (données de mauvaise à très mauvaise qualité) et contrôle de l’asthme (données de qualité mauvaise à moyenne)) ni pour nos critères de jugement secondaires (consultations non planifiées (données de qualité très mauvaise à moyenne) et qualité de vie (données de qualité mauvaise à moyenne)). Cependant, certains effets bénéfiques observés dans certaines études rapportaient des bénéfices observés pour l’utilisation des corticoïdes oraux et des services de santé. La plupart des données concernant les absences à l’école ou au travail étaient biaisées et difficiles à interpréter (données de mauvaise qualité, quand elles pouvaient être notées) et la plupart des études n’ont pas rendu compte ou mesuré spécifiquement les événements indésirables.
Les études examinant les bénéfices potentiels de l’administration de corticoïdes inhalés à l’école n’ont pas mesuré l’observance, les exacerbations nécessitant des corticoïdes oraux, le contrôle de l’asthme ni les événements indésirables. Une étude a montré une baisse du nombre de consultations non planifiées, et une autre n’a trouvé aucune différence ; les données n’ont pas pu être regroupées.
Conclusions des auteurs
Les résultats regroupés suggèrent que diverses interventions peuvent améliorer l’observance. La pertinence clinique de cette amélioration est moins évidente, comme l’indique un impact aussi incertain qu’incohérent sur les critères de jugement cliniques tels que la qualité de vie et le contrôle de l’asthme. Nous avons une confiance faible à moyenne dans ces résultats et nous inquiétons du risque de biais et du manque de cohérence. Il serait utile de définir à l’avance une « référence » de l’observance acceptable fondée sur les données probantes pour les études futures, et d’utiliser des mesures objectives d’observance ainsi que des outils et questionnaires validés. Lorsque cela sera possible, une surveillance discrète et une forme ou une autre de mise en aveugle ou de contrôle actif pourraient permettre de distinguer les effets de l’intervention de ceux de l’inclusion dans un essai d’observance.
PICO
Résumé simplifié
Les stratégies visant à aider les personnes asthmatiques à respecter leur prescription d’inhalations de corticoïdes.
Contexte de la question
Les corticoïdes en inhalateur améliorent les symptômes liés à l’asthme et réduisent les crises d’asthme lorsqu’ils sont pris régulièrement. Toutefois, de nombreux asthmatiques ne respectent pas leurs prescriptions de traitement. Il en résulte davantage de symptômes et de poussées, qui sont incriminés dans un tiers des décès causés par l’asthme au Royaume‐Uni.
L’oubli de doses est parfois appelé « non‐observance ». Ses raisons varient d’une personne à une autre. Par exemple, on peut oublier d’emporter son inhalateur ou avoir un rythme de vie très actif et imprévisible dans lequel le traitement est difficile à intégrer. Certaines personnes ne perçoivent pas la nécessité de faire les inhalations de la manière prescrite. D’autres choisissent de réduire ou d’interrompre la prise de corticoïdes pour diverses raisons, notamment à cause des effets secondaires, de la peur des effets secondaires ou de l’idée que les effets bénéfiques ne contrebalancent pas les inconvénients.
L’objectif de cette revue était de déterminer si les stratégies visant à aider les personnes asthmatiques à prendre leurs inhalations de corticoïdes fonctionnent réellement et si une amélioration de l’observance conduit à d’autres bénéfices.
Caractéristiques de l'étude
Nous avons trouvé 39 études totalisant plus de 16 000 adultes et enfants asthmatiques qui prenaient un corticoïde en inhalateur. La plupart des études ont recueilli les données à six mois, de sorte que nous ne pouvons réellement appliquer les messages de cette revue que sur une période de six mois et ne pouvons pas affirmer que ces méthodes sont efficaces sur quelques années, par exemple. Nous avons effectué des recherches dans de multiples sources pour trouver des études pertinentes. Cette revue est à jour à la date de novembre 2016.
Différentes études ont essayé différentes méthodes pour aider les patients à utiliser leur inhalateur plus régulièrement. Nous avons regroupé les études selon quatre méthodes : éducation à l’observance (20 études), surveillance électronique ou rappels des prises d’inhalations (11 études), amélioration de la facilité d’emploi du médicament (par ex. une fois au lieu de deux fois par jour, un inhalateur au lieu de deux) (quatre études) et remise de l’inhalateur pendant le temps scolaire (trois études).
Nous avons principalement cherché à déterminer si les stratégies aidaient les patients à prendre leurs inhalations de la manière prescrite et si les patients ont eu moins de crises d’asthme et mieux contrôlé leur asthme.
Principaux résultats
Les personnes qui ont bénéficié d’une intervention éducative prenaient mieux leurs inhalations que les témoins ; elles étaient 20 % de plus à prendre leur traitement (il pourrait y en avoir entre 8 % et 33 % de plus). Les patients équipés de traceurs ou recevant des rappels électroniques étaient 19 % plus à utiliser leur inhalateur que les témoins (14 % et 25 %). Les personnes dont le traitement a été facilité (par ex., un moins grand nombre d’inhalations par jour) ont été seulement 4 % de plus que ceux qui prenaient leur traitement de la manière habituelle (2 % et 6 %).
Malheureusement, ces mesures visant à aider les personnes à prendre leurs inhalations de la manière prescrite n’ont généralement pas apporté un bénéfice notable sur des aspects tels que le contrôle de l’asthme et le nombre de crises mais, dans la plupart des cas, nous n’avons pas pu déterminer s’il y avait un effet dans un sens ou dans l’autre. Nous n’avons pas non plus trouvé de différence au niveau de la qualité de vie ou du temps d’absence au travail ou à l’école nécessaire, mais les données probantes étaient souvent incertaines.
Les études portant sur l’éventuel bénéfice de la remise de l’inhalateur aux enfants pendant les horaires scolaires ne mesuraient pas réellement la fréquence des oublis de dose.
Qualité des données probantes
Il est difficile de dire si ces différentes stratégies ont de l’intérêt car les études étaient très différentes les unes des autres, de sorte que nous ne pouvons être sûrs de leur bénéfice réel, au‐delà d’une amélioration de l’observance. Nous avons parfois trouvé trop peu d’études pour déceler une différence entre les groupes. Le fait que la plupart des patients aient su à quel groupe ils étaient affectés a également diminué notre confiance dans les résultats car cela peut inciter les sujets à répondre de façon plus ou moins positive aux questionnaires. Nous avons trouvé préoccupant le nombre d’abandons dans environ la moitié des études, et nous ne savons pas si les études ont rendu compte de tout ce qu’elles mesuraient.
Principaux messages
Les études que nous avons trouvées suggèrent que diverses stratégies peuvent aider les personnes asthmatiques à mieux utiliser leur inhalateur par rapport au « contrôle » (par ex. aux soins habituels de l’asthme). Cependant, un grand nombre de ces études étaient très différentes les unes des autres et nous ne savons pas avec certitude si les sujets trouveraient que telle ou telle approche améliore leur asthme.
Authors' conclusions
Summary of findings
| Adherence education compared with controls for asthma | |||||||
| Patient or population: asthma | |||||||
| Outcomes | Anticipated absolute effects* (95% CI) | Relative effect | Number of participants | Quality of the evidence | Comments | ||
| Risk with controls | Risk with adherence education | ||||||
| % Adherence WMD of follow‐up 71.7 weeks (all studies) | Objective measures | Mean adherence in the control group was 46.7% | Mean adherence with adherence education was 20.13% higher (7.52 higher to 32.74 higher) | ‐ | 280 (5 RCTs) | ⊕⊕⊝⊝ | Only studies in which adherence was measured with an electronic monitor |
| All measures | Mean adherence in the control group was 57.1% | Mean adherence with adherence education was 11.59% higher (3.72 higher to 19.46 higher) | ‐ | 1693 | ⊕⊕⊝⊝ | ||
| Exacerbations requiring OCS (people with 1 or more) WMD of follow‐up 30.8 weeks | 149 per 1000 | 242 per 1000 (148 to 370) | OR 1.82 | 349 | ⊕⊕⊝⊝ | ||
| Asthma control (ACQ) WMD of follow‐up 28.5 weeks | Mean ACQ score was 1.52 | Mean score with adherence education was 0.03 better (0.49 better to 0.43 worse) | ‐ | 455 | ⊕⊕⊕⊝ | Lower score indicates better control. Scale 0 to 6. MCID 0.5 | |
| Asthma control (ACT) WMD of follow‐up 29.5 weeks | Mean ACT score was 18.88 | Mean score with adherence education was 0.30 better | ‐ | 333 | ⊕⊕⊕⊝ | Higher score indicates better control. Scale 5 to 25. MCID 3 | |
| Unsheduled visits to a healthcare provider (people with 1 or more) WMD of follow‐up 67.2 weeks | 159 per 1000 | 83 per 1000 | OR 0.48 | 688 | ⊕⊝⊝⊝ | Includes visits to ED, GP, hospital for any cause | |
| Absenteeism WMD of follow‐up 63.3 weeks | We did not perform an analysis of absences because the data were heavily skewed | ‐ | 109 | Not graded | |||
| Quality of life (AQLQ) WMD of follow‐up 27.4 weeks | Mean AQLQ score was 5 | Mean score with adherence education was 0.01 better (0.20 worse to 0.23 better) | ‐ | 734 | ⊕⊕⊕⊝ | Higher score indicates better QOL. Scale 1 to 7. MCID 0.5 | |
| *The risk in the intervention group (and its 95% confidence interval) is based on assumed risk in the comparison group and the relative effect of the intervention (and its 95% CI) | |||||||
| GRADE Working Group grades of evidence | |||||||
| aDowngraded once primarily owing to risk of bias from open‐label trials and some concerns regarding attrition bias, selective reporting and selection bias (‐1 risk of bias) bDowngraded once owing to inconsistency between study results (‐1 inconsistency) cFunnel plot examined; no clear evidence of publication bias (no downgrade for publication bias) dConfidence intervals include no difference and/or potential important harm or benefit of the intervention (‐1 imprecision) eConfidence intervals fall within the established MCID for this scale (no downgrade for imprecision) fStudies contributing to this analysis reported different types of unscheduled visits and some recorded visits for any cause rather than asthma alone (‐1 indirectness) gUnclear how absenteeism was defined or reported, and different participants may have different thresholds for missing work or school. One study was conducted in children and the other in adults. Combined, this makes the outcome hard to interpret | |||||||
| Electronic trackers or reminders (±feedback) compared with controls for asthma | |||||||
| Patient or population: asthma | |||||||
| Outcomes | Anticipated absolute effects* (95% CI) | Relative effect | Number of participants | Quality of the evidence | Comments | ||
| Risk with controls | Risk with electronic trackers or reminders (± feedback) | ||||||
| % Adherence WMD of follow‐up 47.6 weeks | Objective measures only | Mean adherence in the control group was 53.27% | Mean adherence was 19.86% higher (14.47 higher to 25.26 higher) | ‐ | 555 (6 RCTs) | ⊕⊕⊕⊝ | Only studies in which adherence was measured with an electronic monitor |
| All measures | Mean adherence in the control group was 56.06% | Mean adherence with trackers was 18.41% higher (11.82 higher to 25.00 higher) | ‐ | 762 (8 RCTs) | ⊕⊕⊝⊝ | ||
| Exacerbations requiring OCS (people with at least 1) WMD of follow‐up 48.6 weeks | 218 per 1000 | 169 per 1000 | OR 0.72 | 3063 | ⊕⊝⊝⊝ | ||
| Asthma control (ACQ) WMD of follow‐up 43.0 weeks | Mean ACQ score in the control group was 0.89 | Mean score with trackers or reminders was 0.24 better (0.29 worse to 0.78 better) | ‐ | 109 | ⊕⊕⊝⊝ | Lower score indicates better control. Scale 0 to 6. MCID 0.5 | |
| Asthma control (ACT) WMD of follow‐up 34.0 weeks | Mean ACT score in the control group was 20.04 | Mean score with trackers or reminders was 0.74 better (0.20 worse to 1.69 better) | ‐ | 596 | ⊕⊕⊝⊝ | Higher score indicates better control. Scale 5 to 25. MCID 3 | |
| Unscheduled healthcare visits to a healthcare provider (ED) WMD of follow‐up 50.0 weeks | 84 per 1000 | 95 per 1000 | OR 1.14 | 2918 | ⊕⊕⊕⊝ | Two studies (n = 2865) also reported hospitalisations. OR 0.97 (0.53 to 1.78) | |
| Absenteeism (people with at least 1 absence) Follow‐up 26 weeks | 327 per 1000 | 409 per 1000 | OR 1.42 | 220 | ⊕⊕⊝⊝ | ||
| Quality of life (AQLQ) WMD of follow‐up 36.8 weeks | Mean AQLQ score in the control group was 5.15 | Mean score with trackers or reminders was 0.03 worse (0.13 better to 0.20 worse) | ‐ | 369 | ⊕⊕⊕⊝ | Higher score indicated better QOL. Scale 1 to 7. MCID 0.5 | |
| *The risk in the intervention group (and its 95% confidence interval) is based on assumed risk in the comparison group and the relative effect of the intervention (and its 95% CI). | |||||||
| GRADE Working Group grades of evidence | |||||||
| aDowngraded once primarily owing to risk of bias from open‐label trials and some concerns regarding attrition bias, selective reporting and selection bias (‐1 risk of bias) bDowngraded once for inconsistency between study results (‐1 inconsistency) cConfidence intervals include no difference and potential important harm and benefit of the intervention (‐1 imprecision) dConfidence intervals fall within the MCID for this scale (no downgrade for imprecision) eDowngraded once owing to risk of performance and detection bias (‐1 risk of bias) | |||||||
| Simplified compared with usual regimens for asthma | ||||||
| Patient or population: asthma | ||||||
| Outcomes | Anticipated absolute effects* (95% CI) | Relative effect | Number of participants | Quality of the evidence | Comments | |
| Risk with usual regimens | Risk with simplified regimens | |||||
| % Adherence (objective measures) WMD of follow‐up 12.9 weeks | Mean adherence in the control group was 86.73% | Mean adherence with simplified regimens was 4.02% higher | ‐ | 1310 | ⊕⊕⊕⊝ | Only studies in which adherence was measured with an electronic monitor |
| Exacerbations requiring OCS People with 1 or more Follow‐up 12 weeks | 125 per 1000 | 250 per 1000 | OR 2.33 | 16 | ⊕⊕⊝⊝ | |
| Asthma control (ACQ) Follow‐up 24 weeks | Mean ACQ score in the control group was 0.89 | Mean score with simplified regimens was 0.03 better (0.34 better to 0.28 worse) | ‐ | 103 | ⊕⊕⊕⊝ | Lower score indicates better control. Scale 0 to 6. MCID 0.5 |
| Unscheduled visits Follow‐up 12 weeks | 63 per 1000 | 72 per 1000 | OR 1.17 | 1037 | ⊕⊕⊝⊝ | |
| Absence from work/school Follow‐up 12 weeks | 19 per 1000 | 18 per 1000 | OR 0.93 | 1037 | ⊕⊕⊝⊝ | |
| Change in quality of life (ITG‐ASF) Follow‐up 12 weeks | Mean change in quality of life in the control group was 14 | Mean change with simplified regimens was 6 points better | ‐ | 1037 | ⊕⊕⊝⊝ | Higher score indicates better QOL. Range 0 to 100. MCID not known |
| All adverse events Follow‐up 12 weeks | 175 per 1000 | 139 per 1000 | OR 0.76 | 1233 | ⊕⊕⊝⊝ | |
| *The risk in the intervention group (and its 95% confidence interval) is based on assumed risk in the comparison group and the relative effect of the intervention (and its 95% CI) | ||||||
| GRADE Working Group grades of evidence | ||||||
| aDowngraded once primarily owing to lack of blinding and some concerns regarding attrition bias, selective reporting and selection bias (‐1 risk of bias) bOne very small trial resulting in very wide confidence intervals (‐2 imprecision) cAlthough confidence intervals fall within the MCID, only one study contributed to this outcome (‐1 imprecision) dConfidence intervals include both important potential harm and benefit of the intervention (‐1 imprecision) eConfidence intervals do not exclude no difference (‐1 imprecision) fConfidence intervals range from no difference to an important benefit of simplified regimens (‐1 imprecision) | ||||||
| School‐based ICS therapy compared with home therapy for asthma | ||||||
| Patient or population: children with asthma Settings: school Intervention: ICS given at school Comparison: ICS given at home | ||||||
| Outcomes | Illustrative comparative risks* (95% CI) | Relative effect | Number of participants | Quality of the evidence | Comments | |
| Assumed risk | Corresponding risk | |||||
| Control | School‐based ICS therapy | |||||
| Unscheduled visits 1 or more hospitalisations for any cause WMD of follow‐up 35.8 weeks | 49 per 1000 | 29 per 1000 | OR 0.58 (0.16 to 2.05) | 279 | ⊕⊕⊝⊝ | |
| Quality of life (PACQLQ) 1 to 7; higher is better WMD of follow‐up 35.8 weeks | Mean PAQLQ score in the control group was 6.31 | Mean score in the intervention groups was | ‐ | 279 | ⊕⊕⊕⊝ MODERATEa | |
| Adverse events Follow‐up 30 weeks | No events observed in either arm | ‐ | 99 (1 RCT) | Not graded | ||
| *The basis for the assumed risk (e.g. median control group risk across studies) is provided in footnotes. The corresponding risk (and its 95% confidence interval) is based on assumed risk in the comparison group and the relative effect of the intervention (and its 95% CI) | ||||||
| GRADE Working Group grades of evidence | ||||||
| No data could be meta‐analysed for adherence, exacerbations requiring OCS, asthma control or absenteeism. Some data are presented narratively in the review aBoth contributing studies considered at high risk for performance and detection bias bConfidence intervals include both potential harm and benefit of the intervention | ||||||
Background
Description of the condition
Asthma is a chronic breathing condition that affects more than 300 million adults and children worldwide (Global Asthma Report 2014). Asthma can cause shortness of breath, chest tightness and cough and typically presents with wheezing. Many people with asthma experience intermittent worsening of their asthma symptoms, known as 'exacerbations', 'flare‐ups' or 'attacks' (GINA 2016). Approximately 20% of people with asthma have at some point been admitted to hospital or attended an emergency department for asthma treatment (Rodrigo 2004). Attacks can be triggered by common irritants and allergens such as pollution, tobacco smoke, pollen and house dust mites (CDC 2016). Asthma is under‐diagnosed and under‐treated worldwide. Most asthma‐related deaths occur in middle‐income and low‐income countries. Poorly controlled asthma places a huge burden on individuals, their families and society (WHO 2013).
The mainstay of asthma treatment for all but the mildest cases consists of inhaled corticosteroids (ICSs) (Barnes 1993), which are also known as 'preventer' or 'controller' medications (i.e. the intention is that they are used once or twice daily (depending on the preparation), even when well, to maintain control over symptoms). Inhaled corticosteroids, which are delivered directly to a patient’s airways via an inhaler or a nebuliser, work by suppressing the multiple inflammatory cascades that are activated in the airways of a person with asthma. Inflammation leads to increased mucus production and airway constriction, which in turn contribute to symptoms of asthma. Reduction in underlying inflammation through sustained use of an ICS can result in symptom improvement and reduced asthma‐related morbidity and mortality (Barnes 2003; Bårnes 2015).
Inhaled corticosteroids commonly used today include budesonide, beclomethasone, fluticasone (propionate and furoate), mometasone and ciclesonide. They can be given alone or in combination with other preventer medications such as long‐acting beta2‐agonists (LABAs) or leukotriene receptor antagonists (LTRAs) (BNF).
Description of the intervention
Despite its proven efficacy, many patients are not fully adherent to their prescribed ICS (Bårnes 2015). Adherence is described by the World Health Organization (WHO) as "the degree to which use of medication by the patient corresponds with the prescribed regimen"; WHO emphasises the "diversity and complexity of adherence behaviour". In addition, patients with asthma may be fully adherent to preventer medication when symptomatic but poorly adherent when well (WHO Report 2003). This may reflect the fact that, unlike rescue medication, which gives immediate relief of symptoms (i.e. a 'reliever' or 'rescue' inhaler containing a short‐acting beta2‐agonist (SABA) such as salbutamol), an ICS given for airway inflammation may take several weeks to provide maximal benefit.
Reasons for non‐adherence to asthma therapies, including ICSs, vary among individuals. Commonly cited reasons include complexity of the treatment regimen; cost; administration route; and patient beliefs about therapy, including safety, necessity and risk of dependence. Lower socioeconomic status, inclusion in a minority ethnic group and fewer years of education have also been associated with reduced adherence (Bårnes 2015; Bender 2005; Clark 1999; Cochrane 1999).
Understanding the underlying reasons for non‐adherence is essential for tackling the problem. The WHO Report 2003 has subcategorised these reasons as follows.
-
'Erratic non‐adherence' ‐ perhaps most common and largely the result of forgetfulness or a busy, unpredictable lifestyle.
-
'Unwitting non‐adherence' ‐ usually the result of failure to appreciate the specifics of regimens or the need for adherence.
-
'Intelligent non‐adherence' ‐ the result of a purposeful choice to reduce or discontinue ICS use for many reasons, including side effects, fear of side effects or a perception that the benefits do not outweigh the disadvantages.
Similarly, Horne 2002, which reported a cross‐sectional survey of people with asthma who completed validated questionnaires, identified that adherence was primarily associated with doubts about the necessity for the medication and concerns about the side effects of treatment. This study reported that a more negative perception of the consequences of illness is associated with poorer adherence to preventer medication. A possible explanation for this unexpected finding is that those who are already poorly adherent may be more likely to experience poorer asthma control and thus may rate the consequences of illness more negatively.
Interventions to improve adherence to ICS may take many forms, including audiovisual reminders (Charles 2007), electronic monitoring of dosing with clinician feedback (Onyirimba 2003), interactive voice response system via mobile phone (Mulvaney 2013), text message reminders (Johnson 2015) and more comprehensive patient or parent education (Bender 2002).
How the intervention might work
How the intervention works will be directly related to the type of non‐adherence targeted and the type of intervention offered. The simplest interventions proposed to tackle 'erratic non‐adherence' might work by providing a very basic prompt to patients to remember to use their inhaler. Multi‐faceted interventions that involve tackling 'unwitting' or 'intelligent' non‐adherence might comprise patient education and partnership building between healthcare professionals and patients and are likely to work through more complex psychological and behavioural pathways.
A recently updated Cochrane Review assessing the evidence for interventions to improve adherence across the whole spectrum of health care identified 109 randomised controlled trials (RCTs) for inclusion. Review authors concluded that a small number of trials, which implemented complex interventions, demonstrated improvement in adherence and clinical outcomes, suggesting that the more rudimentary interventions generally have little impact. This may reflect the likelihood that any individual under treatment for asthma will likely have a combination of reasons for non‐adherence, possibly both intentional and unintentional (Horne 2002). However, the highly complex nature of the interventions implemented in these 'successful' trials casts doubts on their feasibility in a real‐life setting (Nieuwlaat 2014).
Medication adherence is recognised to deteriorate often during adolescence (Dinwiddie 2002). Patients in this age group might be particularly receptive to newer technologies for assisting with adherence, for example, Internet‐based care and text message reminders. However, the authors of Nieuwlaat 2014 concluded that evidence is currently insufficient to show with certainty whether these newer methods of improving adherence are effective.
Lower levels of adherence in minority communities and among those from lower socioeconomic groups suggest that even when access to health care and prescription coverage is equal (Krishnan 2001), cultural tailoring of interventions may be required for successful treatment.
Why it is important to do this review
Suboptimal adherence leads to poorer clinical outcomes and increased health service utilisation. Although difficult to quantify, studies report that up to, and possibly in excess of, 50% of participants are non‐adherent to their prescribed ICS (Bårnes 2015; Bender 2004; Mahkinova 2015; Murphy 2012; Rand 1994; Williams 2003). Failure to take appropriate medication was found to be a potentially avoidable factor contributing to approximately one‐third of asthma deaths in the UK over the course of a year (NRAD 2014). Mahkinova 2015 demonstrated that patients who are adherent to their preventer medication make fewer claims for oral corticosteroid prescriptions, reflecting a lower rate of exacerbation. Williams 2003 identified an association between hospitalisations and emergency department visits and non‐adherence to ICS. Murphy 2012 found that non‐adherence was an independent predictor of the need for ventilation therapy in acute severe asthma, as well as lower forced expiratory volume in one second (FEV1) and higher sputum eosinophils, both of which are markers of poorly controlled asthma. A 2015 review of ICS adherence in asthma found that 24% of exacerbations and 60% of asthma‐related hospitalisations could be attributed to poor adherence (Bårnes 2015). In addition, it is well recognised that uncontrolled asthma places a greater financial burden on an economy than is incurred by controlled asthma (Barnes 1996; Global Asthma Report 2014).
Evidence shows that many people with asthma benefit greatly from regular use of an ICS. However, ways that healthcare professionals can best assist patients in maintaining adherence remain unclear. We are conducting this review to explore this topic.
Objectives
To assess the efficacy and safety of interventions intended to improve adherence to inhaled corticosteroids among people with asthma.
Methods
Criteria for considering studies for this review
Types of studies
We included parallel and cluster RCTs of any duration conducted in any setting. If we identified cross‐over trials, we included only data from the first part of the study because of the potential for carry‐over effects of the intervention.
We included studies reported as full‐text articles, those published as abstracts only and unpublished data.
Types of participants
We included adults and children of any age with a diagnosis of asthma, according to international or national guidelines or as diagnosed by a healthcare professional, and currently prescribed an ICS alone or in combination with a LABA. We excluded participants with other respiratory comorbidities such as chronic obstructive pulmonary disease (COPD) or bronchiectasis. If we identified trials in which only a subset of participants had received a diagnosis of asthma, we included these participants if we could obtain disaggregated data. If we identified trials targeting improved adherence to asthma therapies generally, and at least 80% of participants were using an ICS at baseline, we included these trials in the review. We also included trials in which the intervention was targeted at a healthcare professional (the trial "participant"), who in turn would deliver the adherence intervention to patients with asthma.
Types of interventions
We included trials that compared an intervention primarily aimed at improving adherence to ICS (± LABA) versus:
-
usual care/no additional intervention;
-
an alternative intervention that does not primarily aim to increase adherence; or
-
an alternative intervention of a different type or intensity, also aimed at improving adherence.
Interventions may range from simple automated reminders to more complex behavioural, psychological and motivational interventions. Interventions may be delivered to the participant or to the parent/career by any healthcare professional or trained peer. Interventions may also be delivered to a healthcare professional. We allowed other co‐interventions in the management of asthma provided they were provided in the same way for intervention and comparison groups, for example, a personalised asthma action plan (PAAP) + adherence prompt versus PAAP alone.
Types of outcome measures
Primary outcomes
-
Adherence to ICS (as reported by trialists; e.g. self‐report via diary or questionnaire, electronic monitoring, prescription monitoring/pharmacy claims data).
-
Exacerbations requiring at least oral corticosteroids.
-
Asthma control (ideally measured on a validated scale such as the Asthma Control Test (ACT)).
Secondary outcomes
-
Unscheduled visits to a healthcare provider.
-
Absenteeism from work/school.
-
Quality of life (ideally measured on a validated scale such as the Asthma Quality of Life Questionnaire (AQLQ)).
-
All adverse events*.
We chose adherence as a primary outcome, as studies will be aiming to improve this outcome. However, we believe it is important to assess whether improvement in adherence translates into improved clinical outcomes; thus, we have included exacerbations and asthma control as primary outcomes in the belief that these are important to patients. Outcomes of adverse events, absenteeism and quality of life are also important to patients. Unscheduled visits to a healthcare provider are important to patients as well and serve as a marker of usage of healthcare services.
If outcomes were reported at multiple time points, we extracted and included the latest reported time point. If studies reported post‐intervention follow‐up, we extracted this information and presented it narratively.
Reporting one or more of the outcomes listed here was not a criterion for inclusion of trials in this review.
*If we identified serious adverse events reported as 'asthma', we described these narratively, as they are likely to represent a severe exacerbation requiring at least hospitalisation.
Search methods for identification of studies
Electronic searches
We identified trials from the Cochrane Airways Trials Register, which is maintained by the Information Specialist for the Group. The Cochrane Airways Trials Register contains studies identified from several sources.
-
Monthly searches of the Cochrane Central Register of Controlled Trials (CENTRAL), through the Cochrane Register of Studies Online (crso.cochrane.org/).
-
Weekly searches of MEDLINE Ovid SP 1946 to date.
-
Weekly searches of Embase Ovid SP 1974 to date.
-
Monthly searches of PsycINFO Ovid SP.
-
Monthly searches of the Cumulative Index to Nursing and Allied Health Literature (CINAHL) EBSCO.
-
Monthly searches of the Allied and Complementary Medicine Database (AMED) EBSCO.
-
Handsearches of the proceedings of major respiratory conferences.
Studies contained in the Trials Register are identified through search strategies based on the scope of Cochrane Airways. Details of these strategies, as well as a list of handsearched conference proceedings, are provided in Appendix 1. See Appendix 2 for search terms used to identify studies for this review. We conducted the primary search on 20 May 2016, and updated the search on 18 November 2016.
We conducted additional searches of the Cochrane Central Register of Controlled Trials (CENTRAL) (all years to 18 November 2016) and MEDLINE Ovid (1946 to 18 November 2016) to identify adherence trials targeting mixed populations including people with asthma (Appendix 2).
We searched the following trials registries on 20 May 2016 and 18 November 2016.
-
US National Institutes of Health Ongoing Trials Register ClinicalTrials.gov (www.clinicaltrials.gov).
-
World Health Organization International Clinical Trials Registry Platform (apps.who.int/trialsearch/).
We did not apply any restrictions on the language of publication.
Searching other resources
We checked the reference lists of all primary studies and review articles for additional references. We searched relevant manufacturer websites for trial information.
We searched on 23 November 2016 for errata or retractions from included studies published in full text on PubMed (www.ncbi.nlm.nih.gov/pubmed).
Data collection and analysis
Selection of studies
We used the Rayyan Web app (Elmagarmid 2014) to independently screen titles and abstracts of all studies identified by the search for possible inclusion, and we coded each study as 'include' (eligible or potentially eligible/unclear) or 'exclude'. KK screened all titles and abstracts, and RN and ES each screened one‐half. We retrieved full‐text study reports/publications, and two review authors (RN and KK) independently screened them to identify studies for inclusion, and to identify and record reasons for exclusion of ineligible studies. We resolved disagreements through discussion, or, if required, we consulted the third review author (ES). We identified and excluded duplicates and collated multiple reports of the same study, so that each study rather than each report was the unit of interest in the review. We recorded the selection process in sufficient detail to complete a PRISMA (Preferred Reporting Items for Systematic Reviews and Meta‐Analyses) flow diagram and Characteristics of excluded studies table (Moher 2009).
Data extraction and management
We planned to use Covidence 2015 to extract study characteristics and outcome data, but we found it too time consuming and instead used an Excel data extraction form that we each piloted on at least one study. We planned that one review author (RN) would extract the following study characteristics from included studies, but instead we shared the studies equally between all three review authors (RN, ES and KK).
-
Methods: study design, total duration of study, details of any 'run‐in' period, number of study centres and locations, study setting, withdrawals and date of study.
-
Participants: N, mean age, age range, gender, severity of condition, diagnostic criteria, baseline lung function, smoking history, inclusion criteria and exclusion criteria.
-
Interventions: intervention, comparison, concomitant medications and excluded medications.
-
Outcomes: primary and secondary outcomes specified and collected and time points reported.
-
Notes: funding for trial and notable conflicts of interest of trial authors.
Each review author extracted outcome data independently from two‐thirds of the studies so that data from each study were extracted twice. We noted in the Characteristics of included studies table if outcome data were not reported in a useable way. We resolved disagreements by reaching consensus or by involving a third review author (RN, KK or ES). One review author (RN) transferred data to the Review Manager (RevMan 2014) file. We double‐checked that data had been entered correctly by comparing data presented in the systematic review against study reports. A second review author (KK or ES) spot‐checked study characteristics for accuracy against the trial report.
Assessment of risk of bias in included studies
As for numerical data extraction, each review author independently assessed risk of bias for two‐thirds of the included studies, so that each study was assessed twice. We used the criteria outlined in the Cochrane Handbook for Systematic Reviews of Interventions (Higgins 2011). We resolved disagreements by discussion or by consultation with the third review author who had not already assessed the study (RN, KK or ES). We assessed risk of bias according to the following domains.
-
Random sequence generation.
-
Allocation concealment.
-
Blinding of participants and personnel.
-
Blinding of outcome assessment.
-
Incomplete outcome data.
-
Selective outcome reporting.
-
Other bias.
We graded each potential source of bias as high, low or unclear and provided a quote from the study report together with a justification for our judgement in the 'Risk of bias' table. We summarised risk of bias judgements across different studies for each of the domains listed. We considered blinding separately for different key outcomes when necessary (e.g. for an unblinded outcome assessment, risk of bias for all‐cause mortality may be very different than for a patient‐reported pain scale). When information on risk of bias relates to unpublished data or correspondence with a trialist, we noted this in the 'Risk of bias' table.
When considering a treatment effect, we took into account the risk of bias for studies that contributed to that outcome.
Assesment of bias in conducting the systematic review
We conducted the review according to this published protocol and reported deviations from it in the Differences between protocol and review section of the systematic review.
Measures of treatment effect
We analysed dichotomous data using Mantel‐Haenzsel odds ratios (ORs) with a random‐effects model and 95% confidence intervals (CIs). When rare events were reported, we used Peto ORs. When data were reported as rates or times‐to‐events (e.g. exacerbations), we analysed them as time‐to‐event or rate ratios. We transformed reported rate ratios into log‐rate ratios and analysed them using a random‐effects model and generic inverse variance (GIV) in Review Manager 5 (RevMan 2014). We entered data presented as a scale with a consistent direction of effect.
We analysed continuous outcomes (e.g. ACT, AQLQ) as mean differences (MDs) or as standardised mean differences (SMDs) using a random‐effects model and 95% CIs. We used change from baseline scores when available.
We undertook meta‐analyses only when this was meaningful (i.e. if treatments, participants and the underlying clinical question were similar enough for pooling to make sense).
We narratively described skewed data reported as medians and interquartile ranges.
When multiple trial arms were reported in a single trial, we included only the relevant arms. If two comparisons (e.g. intervention A vs usual care, intervention B vs usual care) were combined in the same meta‐analysis, we halved the control group to avoid double‐counting.
If both change from baseline and endpoint scores were available for continuous data, we used change from baseline unless most studies reported endpoint scores. Similarly, we preferred adjusted data examined by analysis of variance (ANOVA) to account for baseline differences when available.
When both per‐protocol/completer and intention‐to‐treat (ITT) analyses were provided in a single report, we used the latter.
Unit of analysis issues
We analysed dichotomous data using participants (rather than events) as the unit of analysis. However, if exacerbations were reported as rate ratios, we analysed them on this basis. We meta‐analysed data from cluster RCTs only if available data had been, or could be, adjusted to account for clustering. We adjusted data from Foster 2014 for meta‐analysis using an intracluster correlation coefficient (ICC) of 0.037 (based on the ACT score, kindly supplied by the study author team). However, this adjustment had very little impact on the meta‐analyses, and so we have used the raw unadjusted data.
Dealing with missing data
We contacted investigators or study sponsors to verify key study characteristics and to request missing numerical outcome data when possible (e.g. when a study is identified as abstract only). When this was not possible, and missing data were thought to introduce serious bias, we considered this in the GRADE rating for the affected outcome.
Assessment of heterogeneity
We used the I² statistic to measure heterogeneity among the trials in each analysis. If we identified substantial heterogeneity, we reported this and explored possible causes through prespecified subgroup analyses.
Assessment of reporting biases
When we were able to pool more than 10 studies, we created and examined a funnel plot to explore possible small study and publication biases.
Data synthesis
We used a random‐effects model and performed a sensitivity analysis using a fixed‐effect model.
'Summary of findings' table
We created four 'Summary of findings' tables, one for each of the comparisons, using the following outcomes: adherence to ICS; exacerbations requiring at least an oral corticosteroid (OCS); asthma control; quality of life; unscheduled visits to a healthcare provider; absenteeism from work/school; and adverse events. We used the five GRADE (Grades of Recommendation, Assessment, Development and Evaluation Working Group) considerations (study limitations, consistency of effect, imprecision, indirectness and publication bias) to assess the quality of a body of evidence as it relates to studies that contributed data to the prespecified outcomes. We used methods and recommendations described in Section 8.5 and Chapter 12 of the Cochrane Handbook for Systematic Reviews of Interventions (Higgins 2011) and GRADEpro software (GRADEpro GDT). We justified all decisions to downgrade or upgrade the quality of studies by using footnotes, and we made comments to aid readers' understanding of the review when necessary.
Subgroup analysis and investigation of heterogeneity
We planned the following subgroup analyses.
-
Type of intervention: interventions meeting the definition of a complex intervention* versus simpler interventions.
-
Age of participants: adults versus adolescents versus children.
-
To whom the intervention is delivered: participant/parent/career versus healthcare professional.
We constructed an additional table to present other potential factors across studies that may alter the treatment effect (e.g. type, delivery, dose and schedule of ICS; whether treatment was given in a combination inhaler with a LABA; baseline severity of asthma).
We used the following outcomes in subgroup analyses.
-
Adherence to ICS.
-
Exacerbations requiring at least an OCS.
-
Asthma control.
We used the formal test for subgroup interactions provided in RevMan 2014.
*Complex interventions are conventionally described as those including 'several interacting components' (Campbell 2000). From a public health point of view, complex interventions, which are likely to involve a substantial educational element, and population‐based interventions, which may include cluster RCTs, are thought to have greater overall impact on patient behaviour. Simpler interventions, such as cue reminders, will not address the more complex issues of adherence, and effects may be less likely to persist beyond removal of the intervention. Thus, we considered this an important subgroup analysis for inclusion.
Sensitivity analysis
We planned the following sensitivity analyses.
-
Excluding unpublished data.
-
Excluding trials considered at high risk of selection bias.
-
Excluding trials in which not all participants were prescribed ICS at baseline.
-
Excluding trials in which adherence was measured via non‐objective methods (e.g. diary, self‐report). In a post hoc change to our analysis plan, we have presented studies using objective measures (i.e. electronic inhaler monitors) as the primary analysis for % adherence, as we deemed this to be a more useful analysis. An analysis including studies using all measures then follows.
Results
Description of studies
Results of the search
Through database searches, we retrieved 2707 references. Our searches of other resources, including trials registries, revealed 127 additional records. Once duplicates had been removed, we had a total of 1725 records left to screen. We excluded 1575 records on the basis of titles and abstracts. We obtained the full text of the remaining 150 records. We excluded 45 studies (51 references), added five studies to Studies awaiting classification and listed 13 studies as ongoing (15 records). We included 39 studies (79 references). For further details of our screening process, see the study flow diagram (Figure 1).
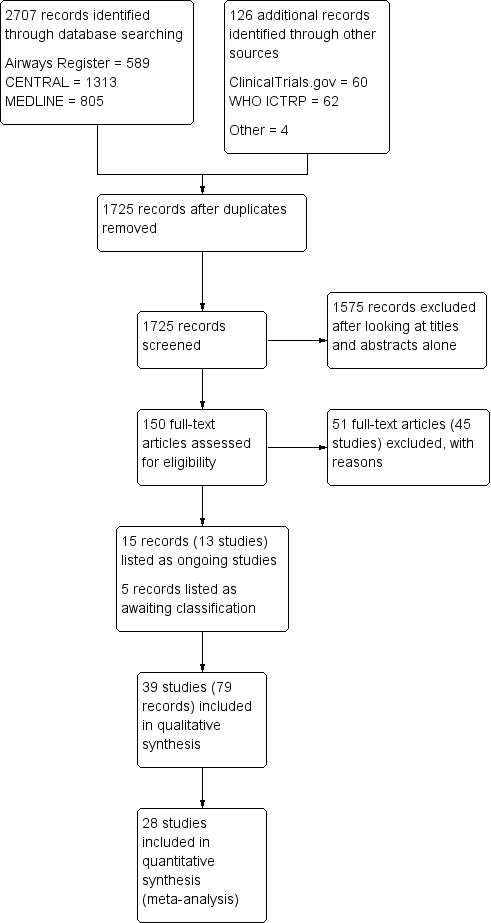
Study flow diagram.
Included studies
Thirty‐nine studies met our inclusion criteria, and 28 of these contributed data to at least one meta‐analysis. These studies included a total of 16,303 participants who were randomly assigned to comparisons of interest in this review. The largest study was a pragmatic trial that included 9603 pre‐existing users of ICS, and the smallest included 12. The median total number of participants was 102. Investigators reported three trials as conference abstracts only (Black 2008; Hart 2002; NCT02451709), one on the clinicaltrials.gov website (NCT02413528) and one as a pharmaceutical company report (ADERE PEDIATRIC 1). The remainder were full‐text peer‐reviewed journal articles. We present a summary of the characteristics of included studies in Table 1.
| Study ID ("first received" date for clinical trials registries) | Total n | Duration of intervention/follow‐up | Age | Country | Intervention | Control | Adherence measure | Outcomes |
| (2005) | 333 | 13/26 weeks | Adults | USA | Problem‐solving intervention | Asthma education | Electronic inhaler monitor | Adherence, AQLQ, ACQ, LFTs, hospitalisation, ED visits, participant satisfaction |
| 50 | 10 weeks | Adults | USA | Interactive voice response intervention | Usual care | Electronic inhaler monitor or canister weight | Adherence, AQLQ, ACT, Beliefs about Medication Questionnaire | |
| (2009) | 1187 | 2 years | Children | USA | Telephone speech recognition intervention | Usual care | Total ICS supplied/total prescribed | Adherence, beta‐agonist use, OCS use, primary care, ED and out of hours visits, hospitalisations, participant satisfaction |
| 271 | 13 weeks | Adolescents and adults | Brazil | Telephone counselling | Ususal care | "Number of inhalations recorded on the disks" | Adherence | |
| (2005) | 141 | 17 weeks/1 year | Children | USA | Problem‐solving intervention | Family‐based intervention | Electronic inhaler monitor | Adherence, symptoms, use of healthcare services, reliever medication use |
| (2009) | 55 | 2 months | Children | USA | Team work intervention | Asthma education | Electronic inhaler monitor | Adherence, Parent‐Adolescent Conflict Questionnaire, Functional Severity Index, LFTs, Consumer Satisfaction Survey |
| 60 GPs, 143 patients | 6 months | Adolescents and adults | Australia | Personalised adherence discussion (PAD) PAD + inhaler reminder feedback (IRF) | Usual care | Electronic inhaler monitor | ACT, AQLQ, Hospital Anxiety and Depression Scale, Medication Adherence Report Scale, LFTs, exacerbations | |
| 78 | 1 year | Adults | Norway | Asthma education | Usual care | Prescribed doses/dispensed doses | Adherence, GP visits, absenteeism, days in hospital | |
| (2010) | 20 | 12 weeks/1 year | Not reported, but mean age suggests adults | Northern Ireland | Nurse‐led psychoeducation | Ususal care (difficult asthma service) | Percent of prescriptions refilled | Adherence, OCS, beta‐agonist use, hospital admissions, LFTs, ACQ, AQLQ, Hospital Anxiety and Despression Scale |
| (2008) | 298 | 90 weeks | Children | Brazil | Telephone follow‐up intervention | Usual care | Percentage of actual doses/number expected | Adherence, disease control, quality of life (SF‐36) |
| 83 | 13 weeks | Children | UK | Asthma education | Usual care | Electronic inhaler monitor | Adherence, beliefs and anxieties about adherence | |
| (2007) | 60 | 26 weeks/78 weeks | Children | Sweden | Group discussion plus basic education | Basic education | Diaries and canister weight | Adherence, views on adherence, days hospitalised, ED visits, exacerbations |
| 15 | 6 weeks/52 weeks | Children | USA | Specific adherence improvement strategies (education, monitoring, etc.) | Usual care plus education | Electronic inhaler monitor | Adherence, LFTs, PedsQL, healthcare costs | |
| (2010) | 54 | 6 weeks/52 weeks | Adults | Canada | Motivational interviewing | Usual care | Prescribed treatment days/number of days | Adherence, asthma control, quality of life, asthma‐related self‐efficacy |
| 201 | 6 months | Adults | Belgium | Adherence education | Usual care | Prescription refill rates, self‐reporting | ACT, diary card, rescue medication use, ED visits, hospitalisations, AQLQ, Knowledge of Asthma and Asthma Medicine Questionnaire, inhalation technique | |
| (2010) | 68 | 10 weeks | Adolescents | USA | Adherence messaging and group sessions | "Attention control" | Electronic inhaler monitor | Adherence, asthma knowledge, ICS knowledge, ICS self‐efficacy, social support, exacerbations |
| (2015) | 12 | 12 weeks | Adolescents | USA | Adherence monitoring and incentivisation via app and sensor | Usual care | Electronic inhaler monitor | Adherence, ACT NB: study terminated |
| 30 | 10 weeks | Adults | USA | Adherence monitoring and education | Monitoring without feedback | Electronic inhaler monitor | Adherence, rescue medication use, AQLQ, LFTs | |
| (2005) | 250 | 78 weeks | Children | USA | Adherence education | Usual care | Prescription refill rates, self‐reporting | Adherence, symptoms, night‐time awakenings, ED visits, hospitalisation, OCS courses |
| 274 | 12 weeks | Adults | Denmark and Switzerland | Adherence education and study medication | Study medication alone | Dose counting in returned investigational product | Adherence, asthma control, LFTs, symptoms, rescue medication use, night‐time awakenings, adverse events, AQLQ, asthma severity, adverse events, vital signs | |
| (2006) | 14,064 (6903 previous ICS users) | 78 weeks | Adults | USA | Telephone interactive voice recognition intervention | Usual care | Pharmacy‐based adherence measures | Adherence, use of healthcare services, economic evaluation |
ACQ: Asthma Control Questionnaire; ACT: Asthma Control Test; AQLQ: Asthma Quality of Life Questionnaire; ED: emergency department; GP: general practitioner; ICS: inhaled corticosteroid; IRF: inhaler reminder feedback; LFTs: lung function tests; OCS: oral corticosteroid; PAD: personalised adherence discussion; PedsQL: Paediatric Quality of Life Inventory; SF‐36: Short‐Form Health Survey
Methods
As per our protocol, all included trials were RCTs with parallel design that compared an intervention to improve adherence to inhaled corticosteroids versus usual care or an alternative intervention not specifically designed to improve adherence, or of a lower intensity. Two studies used a cluster randomised design (Foster 2014; NCT00459368); the remainder were randomised at an individual participant level. One study included four relevant arms (personalised adherence discussion (PAD); inhaler reminders and feedback (IRF); PAD + IRF; and usual care; Foster 2014). Two studies included three relevant arms: NCT00233181 randomised participants to adherence monitoring and education, education or usual care; and NCT00166582 randomised participants to a team work intervention, an asthma education intervention (not deemed relevant to this review) or usual care. The remainder were two‐arm parallel‐group trials.
Intevention length varied, and follow‐up continued from two months to two years. The median duration of follow‐up was 24 weeks. Several studies reported a previous run‐in period during which participants were stabilised on an asthma treatment regimen. Outcome data were extracted at the last time point reported to assess enduring effects of the intervention. Trials were conducted in a variety of mainly high‐income countries worldwide. Most were carried out in the USA (Bender 2010; Gerald 2009; Halterman 2004; Kamps 2008; Mann 1992; NCT00115323; NCT00149487; NCT00166582; NCT00233181; NCT00414817; NCT00459368; NCT00958932; NCT01169883; NCT01175434; NCT01714141; NCT02413528; Onyirimba 2003), the UK (Bosley 1994; Hart 2002; Koufopoulos 2016; NCT01064869; NCT02451709; Price 2010), New Zealand (ACTRN12606000508572; Black 2008; Chan 2015; Charles 2007) and Australia (ACTRN12607000489493; Burgess 2007; Foster 2014). The remainder were carried out in Brazil (ADERE PEDIATRIC 1; Chatkin 2006), Norway (Gallefoss 1999), Sweden (NCT00516633), The Netherlands (Vasbinder 2015 E‐MATIC), Canada (NCT01132430), Belgium (Mehuys 2008), Denmark (Strandbygaard 2010) and Denmark and Switzerland (Ulrik 2009).
Participants
We included studies involving both children and adults. Eighteen studies included only children, 20 studies included adults and/or adolescents only and one study recruited both adults and children. Most studies did not specify the ethnicity of participants.
All studies included participants with a diagnosis of asthma. Almost all studies required participants to be using ICS at baseline, although in two studies (Strandbygaard 2010; Ulrik 2009), some participants were commenced on ICS during the run‐in period. Asthma severity at baseline was inconsistently reported, so it is not possible to characterise the population in this review as a whole. When available, we extracted information about baseline severity and reported this in the Characteristics of included studies tables.
Interventions
Studies included a variety of comparisons, which we classified into four broad groups. Some studies appear in more than one comparison, as they included three or more arms. Most studies did not specify which additional medications were allowed or disallowed, so we assume that most participants continued their usual asthma medication regimen. We have outlined below the four broad comparisons.
Adherence education versus control (Table 1)
We included the following studies in this group: Bender 2010; Chatkin 2006; Foster 2014; NCT00115323; NCT00149487; NCT00166582; NCT00958932 (PAD and PAD + IRF groups vs IRF and control groups); ADERE PEDIATRIC 1; Gallefoss 1999; Hart 2002; Kamps 2008; Mehuys 2008; NCT00233181 (adherence monitoring and education vs control and education alone vs control); NCT00516633; NCT01064869; NCT01132430; NCT01169883; Onyirimba 2003 (adherence education and usual care arms); and Ulrik 2009; and NCT00414817. As per our protocol, we further classified these studies into those delivering a complex intervention versus those not delivering a complex intervention. We performed subgroup analysis when possible according to this classification.
Included studies tested a wide range of educational interventions, including one‐to‐one and group face‐to‐face adherence education sessions; motivational interviewing; family‐based problem‐solving interventions; team work interventions; nurse‐led psychoeducation; telephone interventions; and interactive voice recognition systems. Full details can be found under Characteristics of included studies and are summarised in Table 1.
We classified most of the education interventions as complex (i.e. they involved multiple interacting components and were tailored to the individual). However, we classified as non‐complex three studies using voice recognition software to deliver adherence education and reminders (Bender 2010; NCT00414817; NCT00958932). Participants in Chatkin 2006 received a maximum 10‐minute phone call from a trained nursing student to promote adherence; we judged this intervention to be non‐complex, although we lacked detail about the contents of the call. Another study, which deviated from protocol and for which we do not have results, stated that participants received telephone 'medical guidance'; we classified this intervention as non‐complex (ADERE PEDIATRIC 1).
Electronic trackers or reminders versus control (Table 2)
Studies that used electronic adherence trackers plus feedback to participants included ACTRN12607000489493; Foster 2014 (IRF and IRF + PAD groups vs PAD and control groups); NCT00233181 (adherence education and monitoring vs education alone); NCT01714141; NCT02451709; and NCT00459368.
Studies that used electronic reminders alone, without an adherence feedback discussion, included Black 2008; Chan 2015; Charles 2007; Strandbygaard 2010; and Vasbinder 2015 E‐MATIC.
We classified studies in this group as non‐complex if they tested automated reminders such as text messages or an inhaler device with an audible or visual alarm system. However, if participants received tailored feedback from a healthcare professional based on adherence data acquired through electronic monitoring, we classified this intervention as complex (ACTRN12607000489493; Foster 2014; NCT00233181; NCT00459368; NCT02451709). Full details can be found under Characteristics of included studies and are summarised in Table 2.
| Study ID | Total n | Duration of intervention/follow‐up | Age | Country | Intervention | Control | Adherence measure | Outcomes |
| 40 | 2 months | Children | New Zealand | Inhaler alarm | Usual care | Electronic inhaler monitor | Adherence, AQLQ, LFTs, beta‐agonist use | |
| (2007) | 26 | 4 months | Children | Australia | Adherence feedback during consultations | Usual care | Electronic inhaler monitor | Adherence, symptoms, LFTs |
| 220 | 6 months | Children | New Zealand | Audiovisual inhaler reminder | Usual care | Electronic inhaler monitor | Adherence, school/work absences, ACT, Asthma Morbidity Score, exacerbations, unscheduled visits, beta‐agonist use, LFTs | |
| 110 | 24 weeks | Adolescents and adults | New Zealand | Audiovisual inhaler reminder | Usual care | Electronic inhaler monitor | Adherence, ACQ, LFTs | |
| 60 GPs, 143 patients | 6 months | Adolescents and adults | Australia | Inhaler reminder and feedback (IRF) | Usual care | Electronic inhaler monitor | ACT, AQLQ, Hospital Anxiety and Depression Scale, Medication Adherence Report Scale, LFTs, exacerbations | |
| (2012) | 49 | 13 weeks | Young adults | USA | Computer sessions and tailored text reminders | Asthma education | Self‐reported missed doses | Adherence, ACT, LFTs, participant satisfaction |
| (2015) | 90 | 1 year | Children | UK | Adherence monitoring with feedback | Adherence monitoring but no feedback | Electronic inhaler monitor | "Clinical outcomes", adherence, LFTs, exacerbations |
| (2005) | 250 | 78 weeks | Children | USA | Adherence monitoring and education | Adherence education | Prescription refill rates, self‐reporting | Adherence, symptoms, night‐time awakenings, ED visits, hospitalisation, OCS courses |
| 26 | 12 weeks | Adults | Denmark | SMS (text message) adherence reminders | Usual care | "Dose‐count" on the Seretide was diskus | Adherence, change in FeNO, LFTs, airway responsiveness | |
| 219 | 52 weeks | Children | The Netherlands | SMS (text message) adherence reminders | Usual care | Electronic inhaler monitor | Adherence, ACT, exacerbations, use of healthcare services, AQLQ, school/work absence, acceptance of e‐monitoring, economic evaluation | |
| (2007) | 2698 (34 clusters) | 52 weeks | Children and adults | USA | Adherence education with adherence feedback | Adherence education alone | Electronic prescribing data/refill rate | Adherence, ED visits, hospitalisation, OCS use |
ACQ: Asthma Control Questionnaire; ACT: Asthma Control Test; AQLQ: Asthma Quality of Life Questionnaire; ED: emergency department; FeNO: fractional exhaled nitric oxide; ICS: inhaled corticosteroid; LFTs: lung function tests; OCS: oral corticosteroid
Simplified drug regimen versus usual drug regimen (Table 3)
Studies that aimed to improve adherence by randomising participants to a simplified therapeutic regimen included ACTRN12606000508572; Bosley 1994; Mann 1992; and Price 2010. We classified all four studies as providing a non‐complex intervention.Full details can be found under Characteristics of included studies and are summarised in Table 3.
| Study ID | Total n | Duration of intervention/follow‐up | Age | Country | Intervention | Control | Adherence measure | Outcomes |
| 102 | 12 weeks | Adults | UK | Combined inhaler | Separate inhalers | Electronic inhaler monitor | Adherence, LFTs | |
| 16 | 6 weeks/12 weeks | Adults | USA | Twice‐daily dosing | Four‐times‐daily dosing | Electronic inhaler monitor | Adherence, LFTs, symptoms | |
| (2007) | 111 | 24 weeks | Children | New Zealand | Combined inhaler | Separate inhalers | Electronic inhaler monitor | Adherence, LFTs, ACQ, OCS, unscheduled visits |
| 1233 | 12 weeks | Adolescents and adults | UK | Once‐daily ICS | Twice‐daily ICS | "Device counter number" | Adherence, physician assessment of response, quality of life, use of healthcare services, days of school/work missed, adverse events, worsening asthma |
ACQ: Asthma Control Questionnaire; ICS: inhaled corticosteroid; LFTs: lung function tests; OCS: oral corticosteroid
School‐based directly observed therapy (Table 4)
Gerald 2009, Halterman 2004 and NCT01175434 randomised children to receive their ICS at school or usual care. Gerald 2009 and Halterman 2004 were classified as non‐complex, as the intervention was largely limited to providing school‐based ICS therapy. NCT01175434 was classified as complex, as participants also underwent web‐based screening to assess children’s asthma, which generated a report that was sent to their primary care provider and was used to adjust the medication regimen. Full details can be found under Characteristics of included studies and are summarised in Table 4.
| Study ID | Total n | Duration of intervention/follow‐up | Age | Country | Intervention | Control | Adherence measure | Outcomes |
| 290 | 65 weeks | Children | USA | Supervised ICS therapy at school | Usual care | N/A | Episodes of poor asthma control, school absences, rescue medication use at school | |
| 184 | 9 weeks | Children | USA | Supervised ICS therapy at school | Usual care | N/A | Symptom‐free days, daytime and night‐time symptoms, rescue medication use, school absences | |
| (2010) | 100 | 6 to 8 months | Children | USA | Supervised ICS therapy at school | Usual care | N/A | Feasibility, symptom‐free days, numbers of days and nights with symptoms, activity limitation, rescue medication use, school absenteeism, parent sleep interruption, change in family plans due to the child’s asthma, PAQLQ, utilisation of healthcare services, FeNO |
FeNO: fractional exhaled nitric oxide; ICS: inhaled corticosteroid; PAQLQ: Pediatric Asthma Quality of Life Questionnaire
Finally, we were unable to classify several studies according to the above categories. Burgess 2007 used an "incentive" inhaler device (the "Funhaler") to encourage children to adhere to their inhaled medication. Koufopoulos 2016 trialled use on an online community of people with asthma ("AsthmaVillage") to improve adherence.
We have provided additional details of these studies under Characteristics of included studies.
Outcomes
Outcomes reported were not consistent across reviews, and investigators did not always use validated scales. Almost all included studies reported some measure of adherence, usually as a percentage, with 100% showing complete adherence, but the way in which this was captured and calculated varied between studies. When possible, we extracted and presented this information in Characteristics of included studies and Table 1. The three studies in which the intervention consisted of supervised ICS therapy at school did not report adherence as an outcome (Gerald 2009; Halterman 2004; NCT01175434).
Many included studies used an objective measure of adherence; this was often an electronic inhaler monitoring device. Named devices used included the "SmartInhaler" (ACTRN12606000508572; Burgess 2007; Charles 2007; NCT02451709); the "SmartTrack" device (Chan 2015; Foster 2014); the "MDILog or MDILog‐II (Bender 2010; Kamps 2008; NCT00149487; NCT00166582); the "Doser Clinical Trials" (Doser‐CT) device (Bender 2010; NCT01169883); the "E‐haler/Adhaler" (Vasbinder 2015 E‐MATIC); the "Tubuhaler Inhalation Computer (TIC)" (Bosley 1994); the "Diskus Adherence Monitor" (Bender 2010); the "MDI Chorololog" (Onyirimba 2003); and the "Nebuliser Chronolog" (Mann 1992). Hart 2002 and NCT00115323 report using dose‐counting devices but do not name the specific product used. ADERE PEDIATRIC 1, Chatkin 2006, Price 2010, Strandbygaard 2010 and Ulrik 2009 report counting the doses actuated/remaining on the returned inhaler but do not describe use of a monitoring device.
With the exception of the MDILog‐II, these devices record the time and date of inhaler actuation, and most disregard multiple actuations in a short space of time ("dose‐dumping"). The MDI‐Log‐II also includes a measure of whether the drug was inhaled via a "temperature sensitive thermistor". Data can be uploaded onto a computer (for review and discussion in some studies) but in most cases were not visible to the participant day‐to‐day. In Vasbinder 2015 E‐MATIC, the device sent data back to the study database via the mobile phone network, which allowed real‐time tailoring of adherence reminder text messages for participants. Some of the devices described above (e.g. the SmartInhaler) are capable of producing audiovisual inhaler reminders; studies investigating this as an intervention disabled this function in control groups (see comparison 2).
Remaining studies used canister weight (Bender 2010; NCT00516633) or a combination of pharmacy data and self‐report (Gallefoss 1999; Mehuys 2008; NCT00233181; NCT00414817; NCT00459368; NCT00958932; NCT01064869; NCT01132430). Two studies relied on self‐report (Koufopoulos 2016; NCT01714141).
The three studies that investigated school‐based therapy (Gerald 2009; Halterman 2004; NCT01175434) did not measure or report adherence.
Included studies reported the following outcomes: lung function (e.g. FEV1, peak expiratory flow rate (PEFR)) (n = 15); quality of life (e.g. AQLQ) (n = 13); rescue medication use (n = 11); asthma control (e.g. ACT, Asthma Control Questionnaire (ACQ)) (n = 10); hospitalisations (n = 9); exacerbations (n = 8); asthma symptoms (n = 8); absences from school/work (n = 7); emergency department (ED) visits (n = 7); OCS use (n = 4); participant satisfaction (n = 4); use of healthcare services (n = 5); beliefs about medication (n = 3); costs (n = 3); primary care/general practitioner (GP) visits (n = 3); adverse events (n = 3); unscheduled visits to a healthcare provider (n = 3); self‐efficacy (n = 2); anxiety and depression (e.g. Hospital Anxiety and Depression Scale (HADS)) (n = 2); asthma knowledge (n = 2); fractional exhaled nitrous oxide (n = 2); asthma morbidity (n = 1); parent and adolescent conflict (n = 1); functional severity index (n = 1); episodes of poor asthma control (n = 1); inhaler technique (n = 1); feasibility (n = 1); activity limitation (n = 1); parent sleep interruption (n = 1); and change in family plans due to the child's asthma (n = 1).
We extracted and reported only our prespecified outcomes of interest.
Excluded studies
After full‐text review, we excluded 52 records, which were related to 45 unique studies. The most common reason for exclusion (n = 20) was that adherence to ICS was not the primary focus of the intervention, for example, the study involved multi‐faceted asthma education or shared decision making. The second most common reason (n = 12) was that the study was a trial of different ICS types, regimens or inhaler devices, in which adherence was observed and reported but improved adherence was not the main intention of the intervention. Nine studies were not of appropriate design for inclusion, one study recruited a mixed disease population, one recruited participants among whom less than 50% were using ICS and one study aimed to improve treatment adherence generally in asthma, rather than ICS specifically, and did not report the proportion using ICS. A final study aimed to investigate if Symbicort Maintenance and Reliever Therapy (SMART) could improve adherence, but our outcomes of interested would have been confounded by the different drugs and doses used in each arm; therefore, we excluded this study.
Risk of bias in included studies
As planned, we assessed each trial according to the Cochrane 'Risk of bias' tool (Figure 2). In some cases, we assessed blinding, or lack or blinding, as associated with a different level of risk, depending on the outcome in question. We have noted in the Characteristics of included studies tables when this was the case, and we factored this into our GRADE decisions for these outcomes (e.g. a study at high risk of detection bias for patient‐reported outcomes, such as quality of life, might be at lower risk for other, more objective outcomes, such as electronically monitored adherence).

Risk of bias summary: review authors' judgements about each risk of bias item for each included study.
Allocation
We considered all included studies to be at low (n = 23) or unclear (n = 16) risk of bias for the random sequence generation domain. We considered the following studies to be at low risk because study authors described an accepted method of generating a random sequence (e.g. using a computer‐generated random sequence): ACTRN12606000508572; Bender 2010; Burgess 2007; Chan 2015; Foster 2014; Gallefoss 1999; Gerald 2009; Halterman 2004; Kamps 2008; Koufopoulos 2016; Mehuys 2008; NCT00115323; NCT00166582; NCT00233181; NCT00459368; NCT01132430; NCT01169883; NCT01175434; NCT01714141; NCT02451709; Strandbygaard 2010; Vasbinder 2015 E‐MATIC. We were unable to make a judgement on the following studies considered at unclear risk because investigators described them as 'randomised' but provided no other details: ACTRN12607000489493; ADERE PEDIATRIC 1; Black 2008; Bosley 1994; Chatkin 2006; Hart 2002; Mann 1992; NCT00149487; NCT00414817; NCT00516633; NCT00958932; NCT01064869; NCT02413528; Onyirimba 2003; Price 2010; Ulrik 2009.
Only 14 included studies (ACTRN12606000508572; ACTRN12607000489493; Chan 2015; Charles 2007; Gerald 2009; Halterman 2004; Mehuys 2008; NCT00233181; NCT00459368; NCT01132430; NCT01175434; NCT01714141; NCT02451709; Vasbinder 2015 E‐MATIC) described the method of allocation concealment adequately to be considered at low risk of bias in this domain. Accepted methods included use of sequentially numbered, sealed, opaque envelopes. We considered one study (NCT00166582) to be at high risk because the sequence was available to the research assistant who recruited participants. We judged the remaining 24 studies to be at unclear risk, as investigators did not describe methods used to conceal allocation (ADERE PEDIATRIC 1; Bender 2010; Black 2008; Bosley 1994; Burgess 2007; Chatkin 2006; Foster 2014; Gallefoss 1999; Hart 2002; Kamps 2008; Koufopoulos 2016; Mann 1992; NCT00115323; NCT00149487; NCT00414817; NCT00516633; NCT00958932; NCT01064869; NCT01169883; NCT02413528; Onyirimba 2003; Price 2010; Strandbygaard 2010; Ulrik 2009).
Blinding
Owing to the nature of the intervention, blinding of participants and personnel was not possible in most trials, and we judged 34 of the 39 included studies to be to be at overall high risk of performance bias. We judged two studies (Bosley 1994; Chatkin 2006) to be at low risk of performance bias. Bosley 1994 measured only outcomes of lung function and electronically monitored adherence, which are more objective outcomes and therefore are less likely to be susceptible to performance bias. In addition, participants were unaware that they were being monitored. Similarly, Chatkin 2006 did not describe blinding but reported only the outcome of electronically monitored adherence. We assessed three studies (ACTRN12606000508572; Mann 1992; NCT00459368) to be at unclear risk of performance bias. Mann 1992 did not describe procedures used to mask participants or personnel, and although some outcomes were more objective and were less prone to bias, others, including asthma symptoms, were more at risk. Therefore, we judged this study to be at unclear risk overall. Similarly, for ACTRN12606000508572, participants were unaware that the main outcome of interest was adherence and they were monitored covertly, but other outcomes, such as ACQ, were at greater risk of bias. Finally, NCT00459368 randomised healthcare practitioners rather than individuals. Practitioners were aware of their group allocation, and it is unclear how this knowledge may have influenced adherence of their patients in ways unintended by the intervention itself.
Many of the outcomes of interest in this review are patient reported (e.g. asthma control, quality of life), and the unblinded participant is often the outcome assessor. We therefore judged 29 of the included studies to be at high risk of bias in the outcome assessment domain. We judged six studies to be at low risk (Bosley 1994; Chatkin 2006; NCT00414817; NCT00459368; NCT00958932; NCT01169883). We made this judgement because the outcomes measured were objective and were unlikely to be influenced by outcome assessors' knowledge of group allocation (e.g. usage of healthcare services from medical records, data from electronic monitoring devices), and for some specific measures, studies described masking outcome assessors to group allocation. We judged the remaining four studies (ACTRN12606000508572; Mann 1992; NCT01132430; NCT02413528) to be at unclear risk of bias. NCT01132430 included a mixture of outcomes objectively assessed by a blinded outcome assessor and patient‐reported outcomes, so overall we judged this study to be at unclear risk. Similarly, Mann 1992 and ACTRN12606000508572 included a mix of objective outcomes and patient‐reported outcomes. NCT02413528 reported very minimal details, so we could not make a judgement.
Incomplete outcome data
We judged 18 studies to be at low risk of attrition bias; drop‐out was low and balanced, and withdrawn participants were adequately described (ACTRN12606000508572; ACTRN12607000489493; Bender 2010; Burgess 2007; Chan 2015; Halterman 2004; Mann 1992; NCT00166582; NCT00233181; NCT00459368; NCT00516633; NCT00958932; NCT01132430; NCT01169883; NCT01175434; NCT01714141; NCT02451709; Price 2010). We judged 11 studies to be at high risk, usually owing to high and/or unbalanced drop‐out from study arms (ADERE PEDIATRIC 1; Bosley 1994; Foster 2014; Gerald 2009; Kamps 2008; Koufopoulos 2016; Mehuys 2008; NCT00149487; NCT01064869; Onyirimba 2003; Vasbinder 2015 E‐MATIC). We judged another 10 studies to be at unclear risk, usually because drop‐outs were not adequately described to allow a judgement (Black 2008; Charles 2007; Chatkin 2006; Gallefoss 1999; Hart 2002; NCT00115323; NCT00414817; NCT02413528; Strandbygaard 2010; Ulrik 2009).
Selective reporting
We judged five trials to be at low risk of reporting bias. We were able to identify a prepublished protocol or prospective trial registration and found that all stated outcomes of interest were appropriately reported (Chan 2015; NCT00115323; NCT00459368; NCT00958932; Vasbinder 2015 E‐MATIC). We judged 15 studies to be at high risk of selective reporting. Reasons included that the study was identified only as a conference abstract with minimal details, that key outcomes were reported only narratively or in a way that prevented meta‐analysis or that we noted an important deviation between protocol/registration and published results (ACTRN12606000508572; ADERE PEDIATRIC 1; Black 2008; Chatkin 2006; Gallefoss 1999; Gerald 2009; Hart 2002; Kamps 2008; Koufopoulos 2016; NCT00149487; NCT00233181; NCT00414817; NCT00516633; NCT02451709; Ulrik 2009). We judged the remaining 18 studies to be at unclear risk, primarily because we were unable to identify a prepublished protocol or prospective trial registration.
Other potential sources of bias
We did not note any additional potential sources of bias in any included studies.
Effects of interventions
See: Summary of findings for the main comparison Adherence education compared with controls for asthma; Summary of findings 2 Electronic trackers or reminders (± feedback) compared with controls for asthma; Summary of findings 3 Simplified compared with usual regimens for asthma; Summary of findings 4 School‐based ICS therapy compared with home therapy for asthma
Comparison 1. Adherence education versus controls
Adherence
Our primary analysis of adherence included only studies that used an objective electronic monitor to measure adherence. Mean adherence for those receiving adherence education was 20% better than for those in the control group (Analysis 1.1; mean difference (MD) 20.13, 95% confidence interval (CI) 7.52 to 32.74; 280 participants; five studies; low‐quality evidence). A benefit favouring adherence education is seen when studies using both objective and subjective measures are included, but the effect is attenuated (Analysis 1.2; MD 11.59, 95% CI 3.72 to 19.46; 1693 participants; 10 studies; low‐quality evidence).
We noted great variation between individual study results in both analyses (I2 = 81% and 88%, respectively), and concerns about effects of performance bias and selection bias reduced our confidence in the results. We created a funnel plot to look for evidence of publication bias (Figure 3) and found none.

Funnel plot of comparison: 1 Adherence education vs controls, outcome: 1.2 % Adherence (all measures).
One larger study (Chatkin 2006) dichotomised participants into those who achieved greater than 85% adherence and those who did not; results showed benefit of the educational intervention (Analysis 1.3; odds ratio (OR) 2.68, 95% CI 1.61 to 4.46; 271 participants; one study).
A test for subgroup differences between interventions judged to be 'complex' (i.e. multi‐faceted) and interventions offering simpler forms of education detected no differences between the two types of interventions (I2 = 0%), but it should be noted that we classified as 'simple' only one study using objective measures. Testing suggested no important differences between studies of adults, studies of adults and adolescents and studies of children (Analysis 5.1) when all measures of adherence were considered. If the same subgroup analysis is performed only on studies using objective measures, only one study in the child subgroup remains; although this analysis suggests that the intervention is more effective in children, we interpret this finding with extreme caution. We planned a subgroup analysis based on the recipient of the intervention, but this was not necessary, as all interventions were delivered to adults or children with asthma or their parents.
Exacerbations requiring OCS
It was not possible to discern with certainly whether education had an effect on the odds that a patient would need oral steroids for an exacerbation (OR 1.82, 95% CI 0.99 to 3.36; 349 participants; three studies; I2 = 10%; low‐quality evidence). The point estimate lay in favour of control, but confidence intervals around the pooled estimate showed no differences between groups (Analysis 1.4). We downgraded the evidence for risk of bias and for imprecision. We did not perform subgroup analyses on this primary outcome because we identified too few studies and we did not observe significant heterogeneity in the analysis.
Three other studies (NCT00233181; NCT00958932; NCT01064869) reported the mean number of exacerbations per person over six or 12 months, but the data were skewed so we did not pool the results. NCT00233181 reported a significant reduction in OCS use (incident rate ratio 0.83; 95% CI 0.73 to 0.95; P = 0.008) when both intervention groups were compared with the control group. Conversely, NCT00958932 reported increased oral steroid use in the intervention group over the 24 months of the study (mean (standard error (SE)) oral steroid bursts per person per year 0.21 (0.18) in the control group and 0.27 (0.23) in the intervention group; P = 0.05). NCT01064869 reported a small reduction in courses of oral steroids at 12‐month follow‐up in the intervention group compared with the control group, but this finding was not significant (mean (standard deviation (SD)) 1.7 (1.1) in the intervention group and 2.0 (1.4) in the control group; P = 0.41).
Asthma control
Studies used the Asthma Control Questionnaire (Bender 2010; NCT00115323; NCT01064869; NCT01132430) and the Asthma Control Test (Foster 2014; Mehuys 2008; NCT01132430) as validated measures of asthma control (Analysis 1.5) and reported no differences between adherence education and control on the ACQ (MD ‐0.03, 95% CI ‐0.49 to 0.43; 455 participants; four studies; I2 = 38%; moderate‐quality evidence) nor on the ACT (MD 0.30, 95% CI ‐0.82 to 1.43; 333 participants; three studies; I2 = 40%; moderate‐quality evidence). We noted some variation in study results, but our confidence in these results was mainly reduced by risk of performance and detection bias. Upper and lower confidence limits for both estimates fell within the minimal clinically important differences (MCIDs) for the scales (0.5 point for the ACQ and 3 points for the ACT), so we did not consider the evidence imprecise. It was not possible to perform subgroup analyses on this primary outcome because we identified too few studies and we did not observe substantial heterogeneity in the analysis.
Unscheduled visits
Studies reported unscheduled visits inconsistently as hospital visits, ED visits or GP visits, and this made the estimate difficult to interpret (Analysis 1.6). The pooled estimate lay predominantly in favour of adherence education, but the effect was imprecise and the upper confidence limit crossed the line of no difference (OR 0.48, 95% CI 0.19 to 1.19; 688 participants; four studies; I2 = 59%). We considered evidence for this outcome to be of very low quality owing to risk of bias, inconsistency between study results, imprecision and variation in the way unscheduled visits were defined. Also, effects presented separately suggest possible benefit of adherence education for ED and GP visits, but we did not set out to assess these outcomes separately, so this must be interpreted with caution.
Three other studies (Gallefoss 1999; NCT00233181; NCT00958932) reported the mean number of unscheduled visits per person, but the data were skewed so we have not presented a mean difference. Gallefoss 1999 reported a reduction in the mean (SD) number of GP consultations in the intervention group compared with the control group: 0.7 (2.0) versus 2.6 (3.6); P < 0.001. NCT00233181 also reported a significant reduction in the number of ED visits in the intervention group (incident rate ratio 0.88; 95% CI 0.78 to 0.99; P = 0.03), NCT00958932 reported ED and after‐hours visits but did not detect a significant between‐group difference for either outcome (P = 0.23 and P = 0.12, respectively).
Absence from work/school
Two studies reported rates of absenteeism per person over 12 months (Gallefoss 1999) or 18 months (NCT00516633). The mean number of absence days per person in Gallefoss 1999 was eight in the adherence education group (n = 25) and 26 in the control group (n = 24), but standard deviations were 32 and 70 days, respectively, suggesting that the data were heavily skewed. Consequently, we did not consider it appropriate or useful to analyse the data for a mean difference. The other study reporting this outcome (NCT00516633) observed a mean of 2.1 days in the adherence education group (n = 32) and 3.9 days in the control group (n = 28); the P value for this difference as reported in the paper was 0.08.
Quality of life
Results showed no difference between adherence education and control on the Asthma Quality of Life Questionnaire (Analysis 1.7; MD 0.01, 95% CI ‐0.20 to 0.23; 734 participants; six studies; I2 = 34%; moderate‐quality). Upper and lower confidence limits fell within the 0.5 MCID for the scale, so we did not downgrade for imprecision. We had concerns regarding performance and detection bias because the scale is self‐rated.
All adverse events
No studies measured or reported adverse events other than the need for oral steroids or unscheduled visits, which have already been considered.
Comparison 1 sensitivity analyses
No unpublished data were included in the analyses, so we found that this sensitivity analysis was not necessary.
Only one study in the objective % adherence outcome was rated at high risk for either of the selection bias domains, and results without this study showed a slightly smaller pooled effect than was evident in the main analysis (MD 16.23, 95% CI 3.86 to 28.60). No studies in the 'Exacerbation requiring OCS' or 'Asthma control' analyses were at high risk in either of the selection bias domains.
Mehuys 2008 and Gallefoss 1999 were the only Comparison 1 studies in which not all participants were taking an ICS at baseline (although proportions were between 89.5% and 97% in each group). Mehuys 2008 did not contribute to the objective % adherence outcome, as researchers did not measure adherence using an electronic monitor. Both studies contributed to 'Exacerbations requiring OCS' and their exclusion left just the two Foster 2014 comparisons (PAD vs control and IRF + PAD vs IRF) in the analysis. The point estimate favours control over education (OR 3.44, 95% CI 1.35 to 8.81; 131 participants; one study), but results were reported by a single small study and should be interpreted with caution. Mehuys 2008 contributed to the ACT analysis, but our conclusions did not change when we excluded this study (MD 0.72, 95% CI ‐0.58 to 2.02).
As described previously, instead of excluding studies that did not measure adherence objectively in a sensitivity analysis, we have presented this as our main analysis (Analysis 1.1).
Comparison 2. Electronic trackers or reminders versus controls
Adherence
As for Comparison 1, our primary analysis of adherence included only studies that used an objective electronic monitor to measure adherence. Mean adherence of those using electronic trackers or reminders was 20% better than mean adherence of those in the control group (Analysis 2.1; MD 19.86, 95% CI 14.47 to 25.26; 555 participants; six studies; I2 = 34%; moderate‐quality evidence). As with Comparison 1, our confidence in the estimate was reduced by possible performance and selection bias. Pooling studies using any measure of adherence had little impact on the estimate, but greater inconsistency was evident (MD 18.41, 95% CI 11.82 to 25.00; 762 participants; eight studies; I2 = 66%; low‐quality evidence).
Subgroup analyses for the objectively measured adherence outcome provides weak evidence that inhaler reminders combined with individual feedback may be more effective than inhaler reminders alone (test for subgroup difference: I2= 65.2%; P = 0.09; Analysis 2.1). The test for subgroup differences between interventions judged to be 'complex' (i.e. multi‐faceted) and simpler interventions also provides weak evidence that complex interventions may be more effective, but this effect was seen only when the analysis was limited to studies using objective measures of adherence (I2 = 65.2%; P = 0.09; Analysis 5.2). Testing also suggested no important differences between studies of adults (or adults and adolescents) and children (I2 = 0%; Analysis 5.3). As with Comparison 1, the subgroup analysis based on the recipient of the intervention was not necessary, as all interventions were delivered to adults or children with asthma or their parents.
Three other studies reported data about adherence that could not be pooled with data from studies reporting % adherence. Data from Chan 2015 were skewed and were reported as medians; this study showed large benefit of an audiovisual inhaler reminder, with an intervention median adherence of 84% (10th to 90th percentile 54 to 96; N = 110) compared with a control median adherence of 30% (10th to 90th percentile 8 to 68; N = 110). NCT00459368, a large cluster study, reported adherence as a refill rate and showed similar results between groups (21.3 in the feedback group (SE 2.5), 23.2 in the control group (SE 2,2)). NCT01714141 collected adherence data in several ways from a self‐report questionnaire, none of which were comparable with those of other studies; scores generally favoured the treatment group.
Exacerbations requiring OCS
It was not possible to say with certainty whether electronic trackers or reminders improved the odds of needing oral steroids for an exacerbation (OR 0.72, 95% CI 0.37 to 1.39; 3063 participants; four studies; I2 = 60%; very low‐quality evidence). Confidence limits included important benefit in one direction and important harm in the other (Analysis 2.3). We downgraded the evidence further for risk of bias and inconsistency.
Again, as with the first comparison, we did not perform subgroup analyses on this primary outcome because we identified too few studies. Similarly, some studies (NCT00233181; NCT00459368; NCT02451709; Vasbinder 2015 E‐MATIC) reported the mean number of exacerbations per person over a period of time and the data were skewed, so we did not consider a mean difference to be a valid measure for comparison. NCT00233181 reported no difference between the adherence monitoring with feedback group and the asthma education group for oral steroid use (P = 0.32). Similarly, NCT00459368 reported oral steroid use and found no clear benefit of adherence feedback over usual care (P = 0.277). Vasbinder 2015 E‐MATIC reported exacerbations as requiring OCS, an ED visit or hospitalisation and reported no advantage of the text messaging intervention over control (P = 0.432). Finally, NCT02451709 adjusted the analysis to account for the skew and found that children receiving adherence feedback had fewer exacerbations per 100 days compared with controls (rate ratio 0.23, 95% CI 0.08 to 0.64).
Asthma control
Studies used the Asthma Control Questionnaire (NCT02451709; Strandbygaard 2010) or the Asthma Control Test (Chan 2015; Foster 2014; NCT01714141; Vasbinder 2015 E‐MATIC) as validated measures of asthma control (Analysis 2.4). Results did not show an important difference between reminders/trackers and controls on the ACQ (MD 0.24, 95% CI ‐0.29 to 0.78; 109 participants; two studies; I2 = 0%; low‐quality evidence) nor on the ACT (MD 0.74, 95% CI ‐0.20 to 1.69; 596 participants; four studies; I2 = 47%; low‐quality evidence). The upper limit for the ACQ estimate includes the MCID for the scale (0.5), so trackers and reminders could have an important effect on this measure of asthma control; we downgraded the evidence for imprecision for this reason. We noted some variation between ACT results, but confidence limits fell below the 3 point MCID for the scale, so we did not consider the estimate imprecise.
It was not possible to perform subgroup analyses on this primary outcome because we identified too few studies and we did not observe significant heterogeneity in the analysis.
Unscheduled visits
Some studies reported unscheduled visits as ED visits and some as hospital visits (Analysis 2.5); we did not pool the two because NCT00459368 reported both. It was not possible to say with certainly whether electronic trackers or reminders reduced the odds of unscheduled visits to the ED (OR 1.14, 95% CI 0.88 to 1.47; 2918 participants; two studies; I2 = 0%; moderate‐quality evidence) or to the hospital (OR 0.97, 95% CI 0.53 to 1.78; 2865 participants; two studies; I2 = 0%; not graded), as the estimates were imprecise.
NCT02451709 reported data that could be analysed as rate ratios (Analysis 2.6) and showed a reduction in hospital visits (rate ratio 4.38, 95% CI 1.46 to 13.14) but not in GP or ED visits (rate ratio 1.15, 95% CI 0.83 to 1.59).
Absence from work/school
Chan 2015 reported that the number of parents taking at least one absence favoured controls but results were imprecise (Analysis 2.7; OR 1.42, 95% CI 0.82 to 2.47; low‐quality evidence). We considered evidence for the outcome to be of low quality owing to imprecision and risk of bias. NCT02451709 reported absences per 100 child days that favoured reminders, but results were imprecise (Analysis 2.8; rate ratio 1.16, 95% CI 0.97 to 1.39; evidence quality not graded).
Quality of life
Studies reported no difference between electronic trackers or reminders and controls on the Asthma Quality of Life Questionnaire (MD ‐0.03, 95% CI ‐0.20 to 0.13; 369 participants; four studies; I2 = 0%; moderate‐quality evidence). Upper and lower confidence limits lay well within the 0.5 point MCID for the scale, so we did not consider the effect imprecise, although we had the usual concerns related to risk of bias.
All adverse events
Only Vasbinder 2015 E‐MATIC measured and reported adverse events; this study reported serious adverse events of any cause and observed none in either group.
Comparison 2 sensitivity analyses
No unpublished data contributed to any of the three primary outcomes, so this sensitivity analysis was not necessary. Similarly, we rated no contributing studies at high risk of selection bias, so this was also not necessary.
Before the study commenced, not all participants in Strandbygaard 2010 were taking an ICS (59%), but all were taking an ICS at the start of the study. Excluding this study made little difference in the objective % adherence analysis (MD 20.62, 95% CI 14.30 to 26.95) but greatly decreased the precision of the ACQ analysis (MD 0.19, 95% CI ‐1.37 to 1.75). This study did not contribute to exacerbations requiring oral steroids.
As for Comparison 1, instead of excluding studies that did not measure adherence objectively in a sensitivity analysis, we have presented this as our main analysis (Analysis 2.1).
Comparison 3. Simplified versus usual drug regimens
Adherence
All three studies contributing to this outcome assessed adherence using an objective measure. Adherence was 4% better with simplified drug regimens than with usual drug regimens (Analysis 1.1; MD 4.02, 95% CI 1.88 to 6.16; 1310 participants; three studies; I2 = 0%). We downgraded the evidence only for risk of bias and rated it as moderate quality. The effect is difficult to interpret as two studies compared combined versus separate inhalers (Bosley 1994; ACTRN12606000508572), and one study compared once‐daily versus twice‐daily dosing (Price 2010).
Adherence data in Mann 1992 could not be combined with those from other studies. Twice‐daily and four‐times‐daily groups in Mann 1992 took a similar mean number of correct daily inhalations. Data from the same study showing the percentage of days with missed inhalations favoured twice daily but were skewed (twice daily 36.8%, SD 48.3; four times daily 57.1%, SD 49.6).
Exacerbations requiring OCS
It was not possible to tell whether simplifying drug regimens had an effect on exacerbations, as only one study of 16 people reported this outcome (Analysis 3.2; OR 2.33, 95% CI 0.17 to 32.58; low‐quality evidence). This study compared twice‐daily treatment versus treatment given four times daily (Mann 1992).
Asthma control
One study (ACTRN12606000508572) comparing combined inhalers (simplified regimen) versus separate inhalers showed no difference between regimens on the ACQ (MD ‐0.03, 95% CI ‐0.34 to 0.28; 103 participants; one study). Both confidence limits fell within the 0.5 MCID for the ACQ, so we did not downgrade for imprecision. We had the usual concerns regarding risk of bias through lack of blinding, so we rated the evidence as moderate quality.
Unscheduled visits
Price 2010 did not show benefit of once‐daily dosing (simplified regimen) versus twice‐daily dosing for unscheduled visits (Analysis 3.4; OR 1.17, 95% CI 0.72 to 1.90; 1037 participants; one study; low‐quality evidence). The effect lay close to no difference, and confidence limits showed important benefit in one direction and important harm in the other; we downgraded the evidence for this imprecision and for risk of bias.
Absence from work/school
On the basis of data from one study (Price 2010), it was, again, not possible to tell whether once‐daily dosing (simplified regimen) showed benefit for this outcome compared with twice‐daily dosing; only one study reported this, and confidence intervals included important benefit and harm (Analysis 3.5; OR 0.93, 95% CI 0.37 to 2.30; low‐quality evidence).
Quality of life
One study comparing once‐daily dosing (simplified) versus twice‐daily dosing (Price 2010) reported quality of life on the Therapeutics Group Asthma Short Form (Analysis 3.6); the lower confidence limit crossed the line of no effect, so we were not confident in the estimate (MD 6.00, 95% CI ‐0.76 to 12.76; 1037 participants; low‐quality evidence). The scale ranges from 1 to 100, and we could find no information on an agreed MCID.
All adverse events
Price 2010 reported adverse events and observed fewer in the simplified regimens group (once‐daily dose) than in the control group (twice‐daily dose), but confidence intervals included no difference (OR 0.76, 95% CI 0.56 to 1.04; low‐quality evidence). We downgraded the evidence for imprecision and for risk of performance bias.
Comparison 3 subgroup and sensitivity analyses
We did not perform any subgroup analyses for this comparison as we included no more than three studies in any single analysis. None of the sensitivity analyses were necessary because we located no unpublished data, no contributing studies were at high risk of selection bias and all used objective measures of adherence.
Comparison 4. School‐based ICS therapy versus control
The three studies performing this comparison provided no data for adherence, exacerbations requiring OCS, asthma control or adverse events. Gerald 2009 reported a composite measure of episodes of poor asthma control (EPAC), which we could not combine with any other measures. We identified too few studies to consider any of the planned subgroup or sensitivity analyses, but we have presented below data that could be analysed.
Unscheduled visits
Two studies reported unscheduled visits, but the data could not be combined. Halterman 2004 reported that 18 of 89 children in the intervention group and 26 of 91 in the control group had three or more visits over 10 months. NCT01175434 reported that 9 of 48 children in the intervention group and 11 51 in the control group had one or more unscheduled visits over six to eight months.
Both studies reported the number of people who had one or more hospitalisations for any cause during the study; confidence intervals showed an important benefit in either direction, so it was not possible to say whether school‐based ICS has a beneficial effect (OR 0.58, 95% CI 0.16 to 2.05; 279 participants; two studies; I2 = 0%; low‐quality evidence).
Absence from work/school
Halterman 2004 reported mean absences per child over the 10‐month study: 6.8 absences (SD 9.5) for the intervention group and 8.8 days (SD 8.8) for the control group. NCT01175434 reported a mean of 0.37 absences (SD 0.7) in the intervention group over two weeks and 0.85 (SD 1.3) in the control group. Both sets of data were skewed and were not suitable for combination in a mean difference analysis.
Quality of life
The same two studies reported results of the Paediatric Asthma Quality of Life Questionnaire (PAQLQ). A statistically significant effect favoured giving ICS at school, but the upper end of the confidence limit lay under the 0.5 MCID for the scale, so the difference is unlikely to be clinically important (MD 0.25, 95% CI 0.01 to 0.49; 279 participants; two studies; I2 = 0%; moderate‐quality evidence).
Adverse events
NCT01175434 reported that no one in the intervention group (n = 48) and no one in the control group (n = 51) had any adverse events.
Unclassified studies
We were unable to classify Koufopoulos 2016 and Burgess 2007, as both tested interventions that did not fit into any of our four main categories.
Burgess 2007 reported that a novel spacer device, the 'Funhaler', did not improve adherence to ICS in children over the 12‐week study period. End of follow‐up median adherence (range) was 46% (2% to 100%) in the intervention group and 53% (0 to 100%) in the control (Aerochamber) group. Investigators measured adherence with a SmartInhaler. Study authors reported the number of children experiencing an exacerbation requiring an OCS: 11 of 24 in the intervention group and 6 of 20 in the control group.
Koufopoulos 2016 investigated whether an online asthma community ("AsthmaVillage") can improve self‐reported adherence, measured on the Simplified Medication Adherence Questionnaire (SMAQ). Results show that the control group reported better adherence to ICS during the study period and control group participants were more likely to use the online diary than those in the AsthmaVillage group.
Discussion
Summary of main results
This review found 39 eligible parallel randomised controlled trials (RCTs), 28 of which (n = 16,303) contributed data to at least one meta‐analysis. Eighteen studies included only children, 20 included adults and/or adolescents and one recruited individuals of all ages; all participants had asthma and a vast majority were using an inhaled corticosteroid (ICS) at baseline. Follow‐up of analysed studies ranged from two months to two years (median six months). Trials were conducted mainly in high‐income countries. Outcomes reported were not consistent across reviews, and investigators did not always use validated scales. Almost all included studies reported some measure of adherence, usually as a percentage, but the way in which this information was captured and calculated varied between studies. Studies were generally at low or unclear risk of selection bias and at high risk of bias associated with blinding (although this varied by outcome). Review authors considered around half of these studies to be at high risk for attrition bias and selective outcome reporting.
Studies were classified into four comparisons by consensus: adherence education versus control (20 studies); electronic trackers or reminders versus control (11 studies); simplified drug regimens versus usual drug regimens (four studies); and school‐based directly observed therapy (three studies). Two multi‐arm studies appeared in two comparisons (Foster 2014; NCT00233181), and two studies were described separately (Burgess 2007; Koufopoulos 2016).
All pooled results for adherence education, electronic trackers or reminders and simplified regimens led to better adherence than for controls, both when adherence was measured objectively and when all measures were considered. However, our confidence in the evidence was reduced by risk of bias and inconsistency. When measured objectively (e.g. using a dose counter), adherence education showed 20% benefit over controls (95% confidence interval (CI) 7.52 to 32.74; five studies; low‐quality evidence), and the effect was attenuated to 12% when all measures were considered. Electronic trackers or reminders led to 20% (18% if all measures were included) better adherence than for controls (95% CI 14.47 to 25.26; six studies; low‐quality evidence). Simplified regimens led to 4% better adherence than usual care (95% CI 1.88 to 6.16; three studies; moderate‐quality evidence), but the effect is difficult to interpret, as two studies compared combined versus separate inhalers (ACTRN12606000508572; Bosley 1994) and one study compared once‐daily versus twice‐daily dosing (Price 2010). When we were able to conduct subgroup analyses, we found that 'complex' or multi‐faceted educational interventions were not statistically better than simpler interventions, but weak evidence suggested that complex interventions involving adherence reminders and feedback may be more effective than simpler interventions within this comparison. Similarly, weak evidence from subgroup analysis suggested that combining reminders with feedback is more effective than using reminders alone. Overall, results for adults and children were similar.
Improvements in adherence were inconsistently translated into observable benefit for clinical outcomes, with some studies reporting a reduction in usage of healthcare services or courses of oral steroids favouring the intervention, and other studies reporting the opposite, or no difference. None of the pooled analyses showed clear benefit for exacerbations requiring an oral corticosteroid (OCS) (evidence of low quality), unscheduled visits (evidence of very low to moderate quality), asthma control or quality of life (evidence for both of low to moderate quality). School or work absence data were mostly skewed and were difficult to interpret (evidence of low quality, when graded), and most studies did not report adverse events.
Studies investigating the possible benefit of administering an ICS at school did not measure adherence, exacerbations requiring OCS, asthma control or adverse events. One study showed fewer unscheduled visits, and another found no difference; data could not be combined.
Overall completeness and applicability of evidence
The findings of this review appear to support the premise that interventions specifically intended to improve adherence to ICS are effective in improving percent adherence in both adults and children. However, a wide range of interventions have been used in the included studies, and even within the four comparisons, interventions are variable. We cannot be sure to what extent improvement in adherence was a result of the intervention itself, rather than a result of participation in a trial in which the stated aim was to improve adherence (the "Hawthorne effect" (McCambridge 2014)). Indeed, in many trials all participants showed improvement in several outcomes, irrespective of the group to which they were assigned. In some included trials, participants' adherence was covertly monitored to minimise the impact of performance bias, but participants would likely have been aware of the overall aims of the trial nonetheless. In addition, many of the interventions, especially in Comparison 1, would require considerable investment of resources and in a budget‐constrained healthcare system would be unlikely to be widely adopted. All three considerations limit the applicability of review findings to a real‐world setting.
Although all three of the comparisons that measured percentage adherence demonstrated improvement (albeit with low to moderate confidence), it is not always clear whether this was a clinically meaningful improvement, with no established minimal clinically important difference for this outcome. Studies have suggested that median ICS adherence to maintain asthma control is in excess of 80% (Lasmar 2009). It may have been helpful for interpretation if more trialists had prespecified what they considered to be 'acceptable' adherence, for example, greater than 80%, and had dichotomised participants into those achieving this level of adherence and those not achieving it. The clinical applicability and usefulness of observed improvements in percent adherence could be further disputed by observation of an inconsistent impact on clinical outcomes such as asthma control, quality of life or exacerbations. Most participants, despite improvements in percent adherence, may not have reached the 'threshold' necessary for discernible clinical improvement (Comparisons 1 and 2), or baseline/control group adherence was already at a high level (Comparison 3), thus allowing little room for discernible improvement (summary of findings Table for the main comparison; summary of findings Table 2; summary of findings Table 3). It must be noted that very few studies specifically measured or reported adverse events beyond asthma‐related events such as exacerbations. Therefore, we cannot comment on the safety of the interventions studied.
Objectvely measured adherence would generally be considered more reliable than patient‐reported measures or pharmacy data. In a post hoc decision, we presented objectively measured adherence as our main adherence analysis. It came as a surprise that in Comparison 1, limiting the analysis to objectively measured adherence resulted in a greater effect size. One possible explanation for this is that when participants were asked to self‐report and had received an educational intervention, they were able to make a more realistic assessment of their adherence than were participants in the control group, who may have consciously or unconsciously inflated their adherences rates. This could have resulted in an underestimation of the effect of the intervention.
Our protocol clearly stated that we would include only studies for which adherence to ICS was the main aim of the trial. This resulted in the exclusion of many studies for which adherence education was just one component of a broader asthma education or self‐management education intervention. This may have led to the exclusion of potentially informative studies; however, their inclusion would have further hampered interpretation, as it would be almost impossible to be sure which element of the intervention had led to observed clinical benefit. Mann 1992 included a comparison (four‐times‐daily dosing) that is not relevant in current practice, but we did not state that we would exclude 'historical' comparisons, and this study was not combined with any other study in a meta‐analysis.
Some included studies specifically targeted people with poorly controlled asthma, those known to have suboptimal adherence levels or those in especially high‐risk groups, such as adolescents. We did not plan to analyse such trials separately from those that recruited a more general asthma population. It may have been illuminating to do so, as it is conceivable that these groups would benefit most from a potentially resource‐consuming intervention and could be therefore be targeted in a real‐world setting.
We were not able to carry out all of our planned subgroup analyses, and our subgrouping by complexity may have imposed some limitations. This was inevitably a subjective judgement, although we involved all three review authors in the assessment and revised three of our classifications after peer review. Some of the included studies provided only a brief description of the intervention, which also hampered our confidence in our classification. Although subgroup analysis did not provide strong evidence that more complex interventions are more effective than less complex interventions, a different classification process may have led to different conclusions.
Quality of the evidence
Studies were generally at low or unclear risk of selection bias, but we downgraded many of the analyses for inherent risk of bias associated with studies of behavioural interventions that cannot be blinded. To some extent, performance and detection biases varied by outcome, and by the nature of interventions within a given comparison, but we agreed that performance biases can be present even for more objective outcomes (such as unscheduled visits or exacerbations) because people who know they are receiving the intervention, or know they are not, might be more or less likely to visit their doctor or report a negative outcome. Lack of blinding was a problem especially for self‐rated outcomes such as asthma control and quality of life and may have affected how participants, study investigators and healthcare professionals behaved in each group, producing a more indirect effect on other, more objective outcomes, including adherence itself. Thus, our confidence in many of the outcomes was reduced by risk of bias, especially when we had additional concerns about attrition or uncertainties about the selection process.
Inconsistency between study results tended to be more of an issue for adherence, and this may be explained at least in part by methodological differences such as measurements used and length of the study, or by differences in the underlying populations. Subgroup analyses generally did not help to explain observed heterogeneity. Most studies showed better adherence in the intervention group, but some outliers showed an effect close to no difference or in the opposite direction, which reduced our confidence in the findings.
Dichotomous analyses of fairly rare events such as exacerbations and unscheduled visits tended to be limited by imprecision. For these outcomes, confidence intervals stretched from an important benefit of the intervention to a possible benefit of controls, which prevented firm conclusions.
Indirectness of evidence was less of an issue in this evidence base, as we applied eligibility criteria stringently. In only a couple of instances, indirectness in the measurement of an outcome reduced our confidence in the effect (absences and unscheduled visits in Comparison 1). Similarly, we did not detect or strongly suspect publication bias for any outcomes.
Potential biases in the review process
As much as possible, we carried out this review as presented in the published protocol (Kew 2016) and recorded deviations from it under Differences between protocol and review. We could not perform planned subgroup or sensitivity analyses on some outcomes because studies were too few or fell into a single subgroup.
We did not attempt to contact study authors for additional outcome data or risk of bias clarification owing to the number of studies identified. Therefore, we may have overstated the uncertainty in risk of bias, particularly as related to allocation concealment. Published reports may not have provided unpublished data that were not included in the meta‐analyses. However, it is unlikely that eligible studies were missed by the searches conducted because they covered multiple sources and were sifted in duplicate.
We could not anticipate all the ways in which intervention groups and control groups would differ across studies; as a result, our post hoc classification of studies into four comparisons could have introduced bias. It is conceivable that a different classification system may have yielded different results.
Agreements and disagreements with other studies or reviews
Several recent reviews have investigated adherence interventions in people with chronic diseases, such as asthma. Both Ershad 2016 and Yasmin 2016 examined the effectiveness of text messaging interventions for people with chronic disease. Ershad 2016 presented a narrative review that included six asthma studies. In keeping with our review, these review authors found that text messaging was effective in promoting adherence among different patient populations, although three of the asthma studies showed no differences between groups in adherence to treatment. Yasmin 2016 included two asthma studies of text message and voice call interactions. These review authors concluded that people with chronic disease showed improvement in adherence, but review authors did not see a significant impact on clinical outcomes, which is consistent with our findings. In addition, these review authors found variation in types of interventions provided and outcome measurements assessed, which made it difficult to draw firm conclusions, and cost‐effectiveness remains questionable. Anglada‐Martinez 2014 reviewed m‐health interventions proposed to increase medication adherence and concluded that studies provided mixed evidence of the benefits of these interventions, probably because of variation in study methods. We also encountered problems with between‐study heterogeneity.
Hall 2014 considered effects of medical device dose memory functions on medication adherence and included one study on asthma medication adherence. These review authors found evidence of benefit for these device functions in terms of medication adherence and patient confidence in managing their condition. We did not attempt to extract outcomes related to participant confidence or self‐efficacy. Wu 2014 reviewed adherence interventions delivered by healthcare providers and included 23 studies of people with asthma, most of whom were children. Review authors found that interventions delivered by a healthcare provider improved adherence and recommended that future reviews should focus on particular patient populations and adherence behaviours. They planned to perform subgroup analyses based on the identified recipient of the intervention but were unable to do so, as all interventions were delivered directly to study participants.
Recent reviews of adherence interventions among asthma populations show a similar picture. Dibello 2014 brought together trials of text messaging services aimed at adults 18 to 45 years of age. Review authors found that adherence improved and noted some impact on control and lung function. However, they were not able to perform a meta‐analysis because of heterogeneity. Tran 2014 reviewed studies of patient reminder systems. These review authors were not able to pool the data but concluded, "All studies in our analysis suggest that reminder systems increase patient medication adherence, but none documented improved clinical outcomes".
Bårnes 2015 provides a wide‐ranging review of adherence in asthma and includes studies on adherence levels and effects of poor adherence, as well as studies of interventions aimed at improving adherence. In the intervention studies, review authors found mixed results, with most studies showing improved adherence, although this did not always translate to improvement in other outcomes.
The results of our review of interventions to improve adherence in asthma are consistent with the findings of other reviews examining asthma populations and the broader category of chronic disease, as described. We found that adherence rates increased, but that the impact on clinical outcomes was unclear, and our conclusions must be considered in the light of variation across studies. Our review differs in that we have drawn different types of interventions together into a single review that focuses on people with asthma rather than on a broader category of chronic disease, and, when appropriate, we have been able to pool study results.

Study flow diagram.
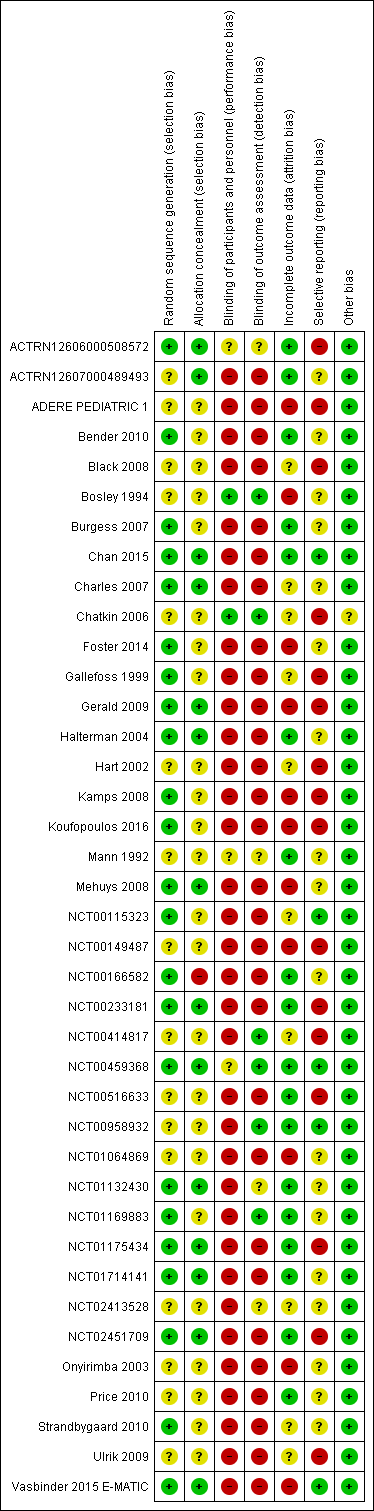
Risk of bias summary: review authors' judgements about each risk of bias item for each included study.
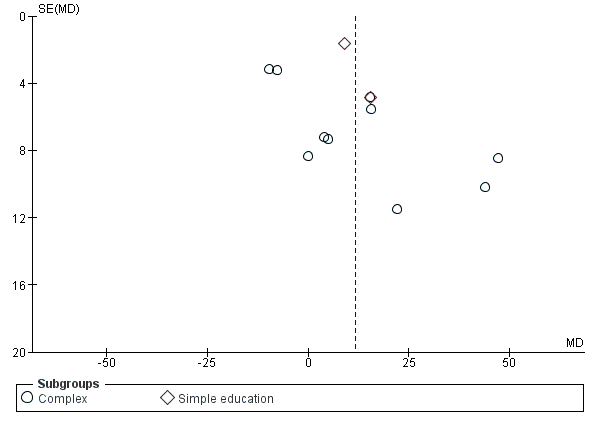
Funnel plot of comparison: 1 Adherence education vs controls, outcome: 1.2 % Adherence (all measures).

Comparison 1 Adherence education versus controls, Outcome 1 % Adherence (objective measures).

Comparison 1 Adherence education versus controls, Outcome 2 % Adherence (all measures).

Comparison 1 Adherence education versus controls, Outcome 3 > 85% adherence.

Comparison 1 Adherence education versus controls, Outcome 4 Exacerbations requiring OCS (people with 1 or more).

Comparison 1 Adherence education versus controls, Outcome 5 Asthma control.
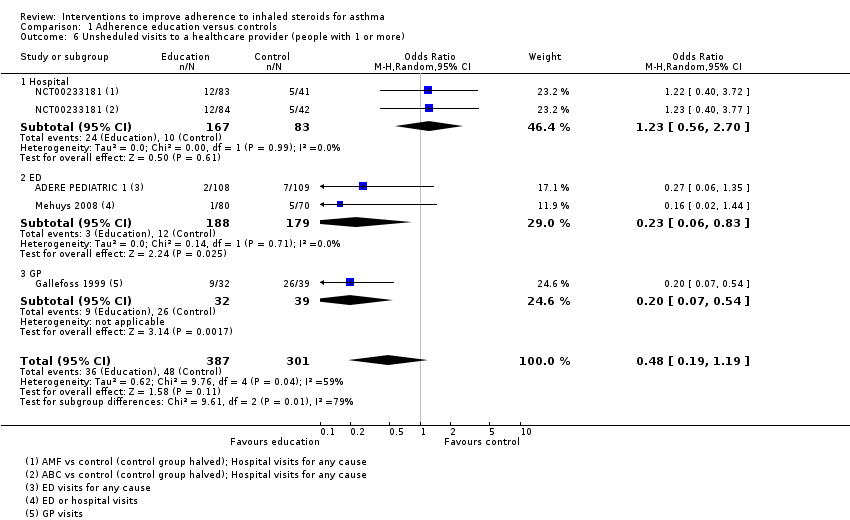
Comparison 1 Adherence education versus controls, Outcome 6 Unsheduled visits to a healthcare provider (people with 1 or more).
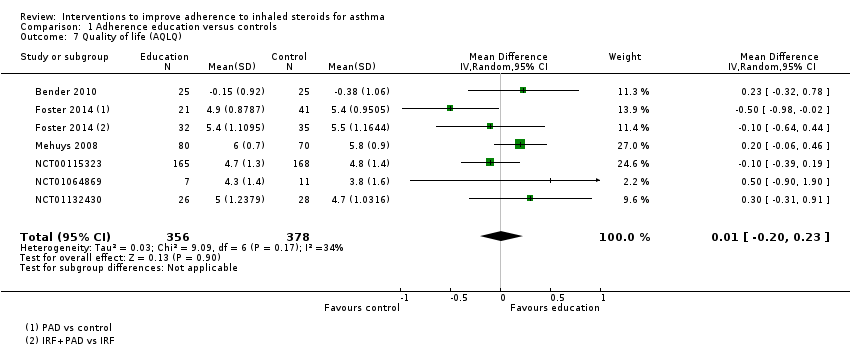
Comparison 1 Adherence education versus controls, Outcome 7 Quality of life (AQLQ).
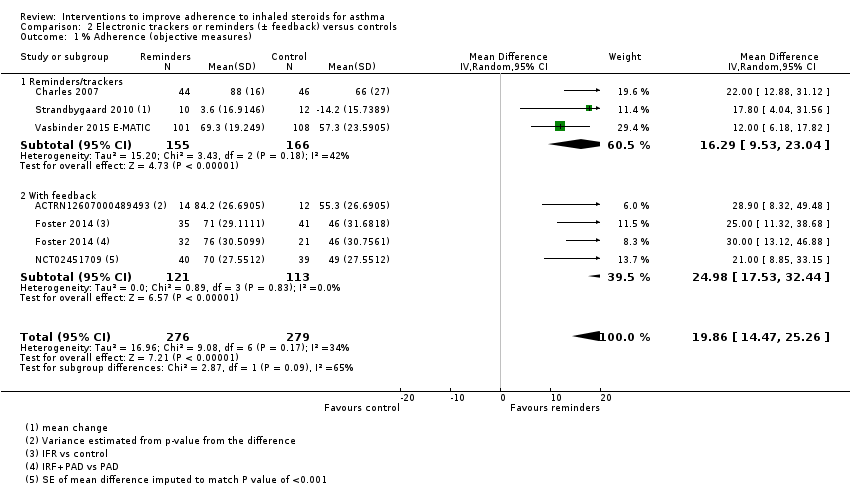
Comparison 2 Electronic trackers or reminders (± feedback) versus controls, Outcome 1 % Adherence (objective measures).
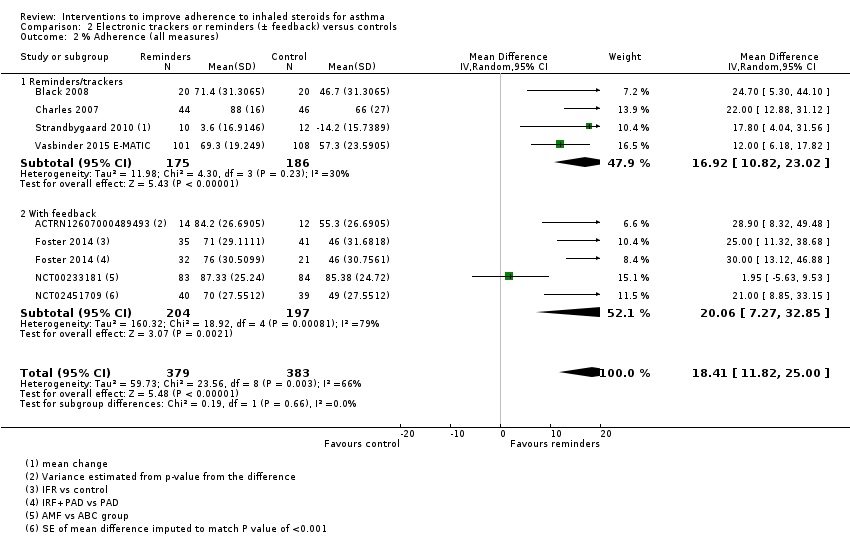
Comparison 2 Electronic trackers or reminders (± feedback) versus controls, Outcome 2 % Adherence (all measures).
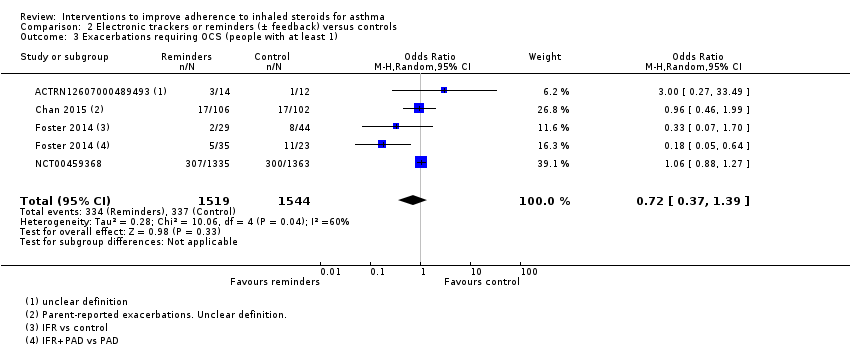
Comparison 2 Electronic trackers or reminders (± feedback) versus controls, Outcome 3 Exacerbations requiring OCS (people with at least 1).
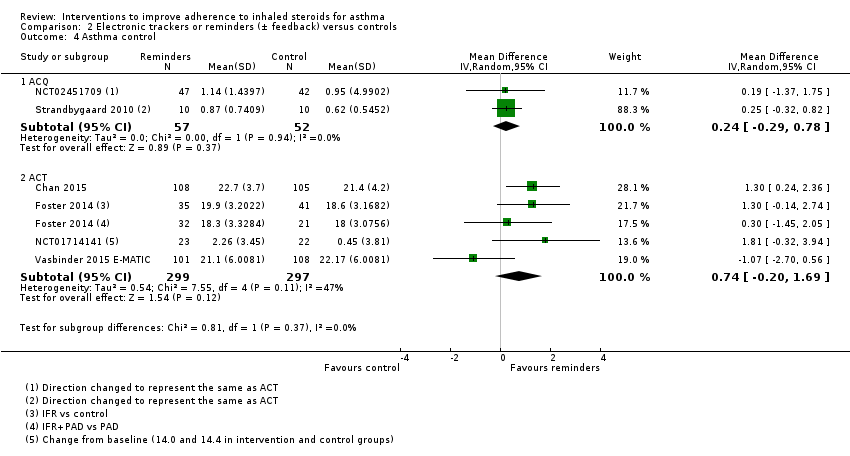
Comparison 2 Electronic trackers or reminders (± feedback) versus controls, Outcome 4 Asthma control.
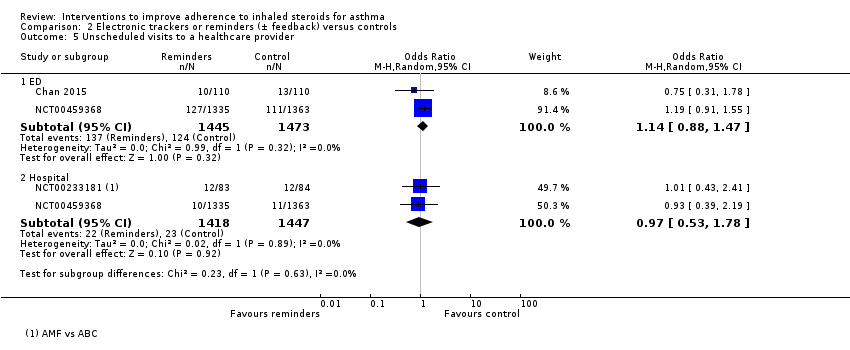
Comparison 2 Electronic trackers or reminders (± feedback) versus controls, Outcome 5 Unscheduled visits to a healthcare provider.

Comparison 2 Electronic trackers or reminders (± feedback) versus controls, Outcome 6 Unscheduled visits to a healthcare provider.

Comparison 2 Electronic trackers or reminders (± feedback) versus controls, Outcome 7 Absenteeism.

Comparison 2 Electronic trackers or reminders (± feedback) versus controls, Outcome 8 Absenteeism.
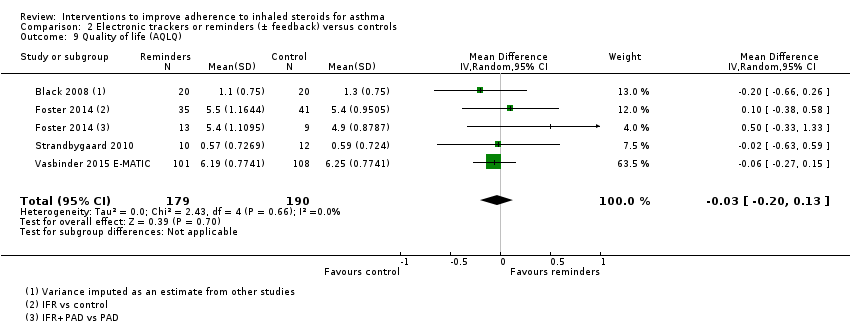
Comparison 2 Electronic trackers or reminders (± feedback) versus controls, Outcome 9 Quality of life (AQLQ).

Comparison 3 Simplified versus usual regimens, Outcome 1 % Adherence.

Comparison 3 Simplified versus usual regimens, Outcome 2 Exacerbations requiring OCS.

Comparison 3 Simplified versus usual regimens, Outcome 3 Asthma control (ACQ).

Comparison 3 Simplified versus usual regimens, Outcome 4 Unscheduled visits.

Comparison 3 Simplified versus usual regimens, Outcome 5 Absence from work/school.

Comparison 3 Simplified versus usual regimens, Outcome 6 Quality of life (ITG‐ASF % change from baseline).

Comparison 3 Simplified versus usual regimens, Outcome 7 All adverse events.

Comparison 4 School‐based ICS therapy versus controls, Outcome 1 Unscheduled visits (1 or more hospitalisations for any cause).
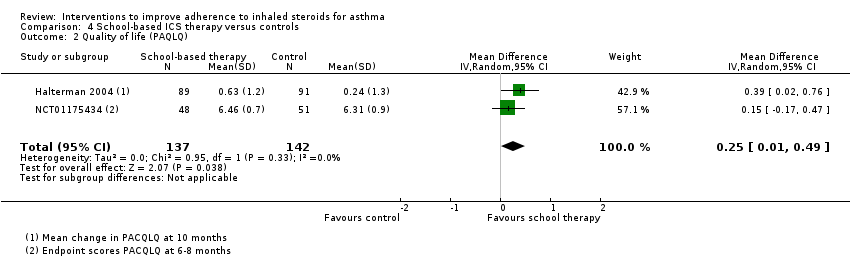
Comparison 4 School‐based ICS therapy versus controls, Outcome 2 Quality of life (PAQLQ).

Comparison 5 Subgroup analyses for % adherence, Outcome 1 Comparison 1. Children vs adults.
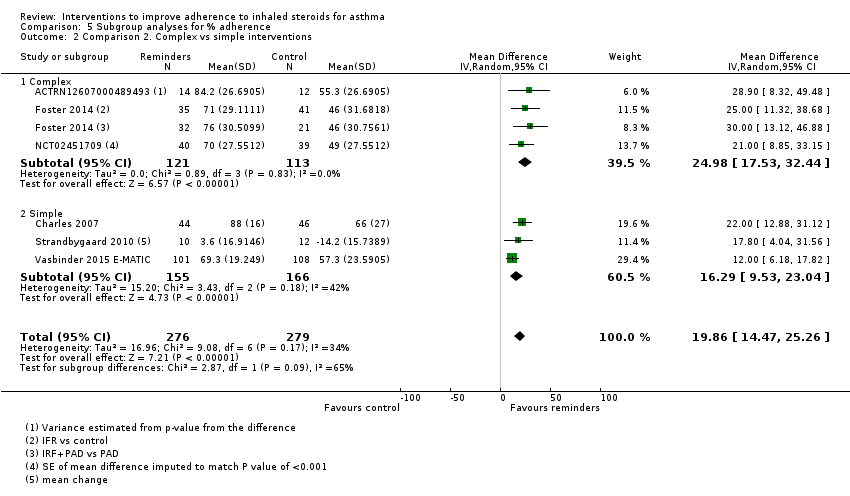
Comparison 5 Subgroup analyses for % adherence, Outcome 2 Comparison 2. Complex vs simple interventions.

Comparison 5 Subgroup analyses for % adherence, Outcome 3 Comparison 2. Children vs adults.
| Adherence education compared with controls for asthma | |||||||
| Patient or population: asthma | |||||||
| Outcomes | Anticipated absolute effects* (95% CI) | Relative effect | Number of participants | Quality of the evidence | Comments | ||
| Risk with controls | Risk with adherence education | ||||||
| % Adherence WMD of follow‐up 71.7 weeks (all studies) | Objective measures | Mean adherence in the control group was 46.7% | Mean adherence with adherence education was 20.13% higher (7.52 higher to 32.74 higher) | ‐ | 280 (5 RCTs) | ⊕⊕⊝⊝ | Only studies in which adherence was measured with an electronic monitor |
| All measures | Mean adherence in the control group was 57.1% | Mean adherence with adherence education was 11.59% higher (3.72 higher to 19.46 higher) | ‐ | 1693 | ⊕⊕⊝⊝ | ||
| Exacerbations requiring OCS (people with 1 or more) WMD of follow‐up 30.8 weeks | 149 per 1000 | 242 per 1000 (148 to 370) | OR 1.82 | 349 | ⊕⊕⊝⊝ | ||
| Asthma control (ACQ) WMD of follow‐up 28.5 weeks | Mean ACQ score was 1.52 | Mean score with adherence education was 0.03 better (0.49 better to 0.43 worse) | ‐ | 455 | ⊕⊕⊕⊝ | Lower score indicates better control. Scale 0 to 6. MCID 0.5 | |
| Asthma control (ACT) WMD of follow‐up 29.5 weeks | Mean ACT score was 18.88 | Mean score with adherence education was 0.30 better | ‐ | 333 | ⊕⊕⊕⊝ | Higher score indicates better control. Scale 5 to 25. MCID 3 | |
| Unsheduled visits to a healthcare provider (people with 1 or more) WMD of follow‐up 67.2 weeks | 159 per 1000 | 83 per 1000 | OR 0.48 | 688 | ⊕⊝⊝⊝ | Includes visits to ED, GP, hospital for any cause | |
| Absenteeism WMD of follow‐up 63.3 weeks | We did not perform an analysis of absences because the data were heavily skewed | ‐ | 109 | Not graded | |||
| Quality of life (AQLQ) WMD of follow‐up 27.4 weeks | Mean AQLQ score was 5 | Mean score with adherence education was 0.01 better (0.20 worse to 0.23 better) | ‐ | 734 | ⊕⊕⊕⊝ | Higher score indicates better QOL. Scale 1 to 7. MCID 0.5 | |
| *The risk in the intervention group (and its 95% confidence interval) is based on assumed risk in the comparison group and the relative effect of the intervention (and its 95% CI) | |||||||
| GRADE Working Group grades of evidence | |||||||
| aDowngraded once primarily owing to risk of bias from open‐label trials and some concerns regarding attrition bias, selective reporting and selection bias (‐1 risk of bias) bDowngraded once owing to inconsistency between study results (‐1 inconsistency) cFunnel plot examined; no clear evidence of publication bias (no downgrade for publication bias) dConfidence intervals include no difference and/or potential important harm or benefit of the intervention (‐1 imprecision) eConfidence intervals fall within the established MCID for this scale (no downgrade for imprecision) fStudies contributing to this analysis reported different types of unscheduled visits and some recorded visits for any cause rather than asthma alone (‐1 indirectness) gUnclear how absenteeism was defined or reported, and different participants may have different thresholds for missing work or school. One study was conducted in children and the other in adults. Combined, this makes the outcome hard to interpret | |||||||
| Electronic trackers or reminders (±feedback) compared with controls for asthma | |||||||
| Patient or population: asthma | |||||||
| Outcomes | Anticipated absolute effects* (95% CI) | Relative effect | Number of participants | Quality of the evidence | Comments | ||
| Risk with controls | Risk with electronic trackers or reminders (± feedback) | ||||||
| % Adherence WMD of follow‐up 47.6 weeks | Objective measures only | Mean adherence in the control group was 53.27% | Mean adherence was 19.86% higher (14.47 higher to 25.26 higher) | ‐ | 555 (6 RCTs) | ⊕⊕⊕⊝ | Only studies in which adherence was measured with an electronic monitor |
| All measures | Mean adherence in the control group was 56.06% | Mean adherence with trackers was 18.41% higher (11.82 higher to 25.00 higher) | ‐ | 762 (8 RCTs) | ⊕⊕⊝⊝ | ||
| Exacerbations requiring OCS (people with at least 1) WMD of follow‐up 48.6 weeks | 218 per 1000 | 169 per 1000 | OR 0.72 | 3063 | ⊕⊝⊝⊝ | ||
| Asthma control (ACQ) WMD of follow‐up 43.0 weeks | Mean ACQ score in the control group was 0.89 | Mean score with trackers or reminders was 0.24 better (0.29 worse to 0.78 better) | ‐ | 109 | ⊕⊕⊝⊝ | Lower score indicates better control. Scale 0 to 6. MCID 0.5 | |
| Asthma control (ACT) WMD of follow‐up 34.0 weeks | Mean ACT score in the control group was 20.04 | Mean score with trackers or reminders was 0.74 better (0.20 worse to 1.69 better) | ‐ | 596 | ⊕⊕⊝⊝ | Higher score indicates better control. Scale 5 to 25. MCID 3 | |
| Unscheduled healthcare visits to a healthcare provider (ED) WMD of follow‐up 50.0 weeks | 84 per 1000 | 95 per 1000 | OR 1.14 | 2918 | ⊕⊕⊕⊝ | Two studies (n = 2865) also reported hospitalisations. OR 0.97 (0.53 to 1.78) | |
| Absenteeism (people with at least 1 absence) Follow‐up 26 weeks | 327 per 1000 | 409 per 1000 | OR 1.42 | 220 | ⊕⊕⊝⊝ | ||
| Quality of life (AQLQ) WMD of follow‐up 36.8 weeks | Mean AQLQ score in the control group was 5.15 | Mean score with trackers or reminders was 0.03 worse (0.13 better to 0.20 worse) | ‐ | 369 | ⊕⊕⊕⊝ | Higher score indicated better QOL. Scale 1 to 7. MCID 0.5 | |
| *The risk in the intervention group (and its 95% confidence interval) is based on assumed risk in the comparison group and the relative effect of the intervention (and its 95% CI). | |||||||
| GRADE Working Group grades of evidence | |||||||
| aDowngraded once primarily owing to risk of bias from open‐label trials and some concerns regarding attrition bias, selective reporting and selection bias (‐1 risk of bias) bDowngraded once for inconsistency between study results (‐1 inconsistency) cConfidence intervals include no difference and potential important harm and benefit of the intervention (‐1 imprecision) dConfidence intervals fall within the MCID for this scale (no downgrade for imprecision) eDowngraded once owing to risk of performance and detection bias (‐1 risk of bias) | |||||||
| Simplified compared with usual regimens for asthma | ||||||
| Patient or population: asthma | ||||||
| Outcomes | Anticipated absolute effects* (95% CI) | Relative effect | Number of participants | Quality of the evidence | Comments | |
| Risk with usual regimens | Risk with simplified regimens | |||||
| % Adherence (objective measures) WMD of follow‐up 12.9 weeks | Mean adherence in the control group was 86.73% | Mean adherence with simplified regimens was 4.02% higher | ‐ | 1310 | ⊕⊕⊕⊝ | Only studies in which adherence was measured with an electronic monitor |
| Exacerbations requiring OCS People with 1 or more Follow‐up 12 weeks | 125 per 1000 | 250 per 1000 | OR 2.33 | 16 | ⊕⊕⊝⊝ | |
| Asthma control (ACQ) Follow‐up 24 weeks | Mean ACQ score in the control group was 0.89 | Mean score with simplified regimens was 0.03 better (0.34 better to 0.28 worse) | ‐ | 103 | ⊕⊕⊕⊝ | Lower score indicates better control. Scale 0 to 6. MCID 0.5 |
| Unscheduled visits Follow‐up 12 weeks | 63 per 1000 | 72 per 1000 | OR 1.17 | 1037 | ⊕⊕⊝⊝ | |
| Absence from work/school Follow‐up 12 weeks | 19 per 1000 | 18 per 1000 | OR 0.93 | 1037 | ⊕⊕⊝⊝ | |
| Change in quality of life (ITG‐ASF) Follow‐up 12 weeks | Mean change in quality of life in the control group was 14 | Mean change with simplified regimens was 6 points better | ‐ | 1037 | ⊕⊕⊝⊝ | Higher score indicates better QOL. Range 0 to 100. MCID not known |
| All adverse events Follow‐up 12 weeks | 175 per 1000 | 139 per 1000 | OR 0.76 | 1233 | ⊕⊕⊝⊝ | |
| *The risk in the intervention group (and its 95% confidence interval) is based on assumed risk in the comparison group and the relative effect of the intervention (and its 95% CI) | ||||||
| GRADE Working Group grades of evidence | ||||||
| aDowngraded once primarily owing to lack of blinding and some concerns regarding attrition bias, selective reporting and selection bias (‐1 risk of bias) bOne very small trial resulting in very wide confidence intervals (‐2 imprecision) cAlthough confidence intervals fall within the MCID, only one study contributed to this outcome (‐1 imprecision) dConfidence intervals include both important potential harm and benefit of the intervention (‐1 imprecision) eConfidence intervals do not exclude no difference (‐1 imprecision) fConfidence intervals range from no difference to an important benefit of simplified regimens (‐1 imprecision) | ||||||
| School‐based ICS therapy compared with home therapy for asthma | ||||||
| Patient or population: children with asthma Settings: school Intervention: ICS given at school Comparison: ICS given at home | ||||||
| Outcomes | Illustrative comparative risks* (95% CI) | Relative effect | Number of participants | Quality of the evidence | Comments | |
| Assumed risk | Corresponding risk | |||||
| Control | School‐based ICS therapy | |||||
| Unscheduled visits 1 or more hospitalisations for any cause WMD of follow‐up 35.8 weeks | 49 per 1000 | 29 per 1000 | OR 0.58 (0.16 to 2.05) | 279 | ⊕⊕⊝⊝ | |
| Quality of life (PACQLQ) 1 to 7; higher is better WMD of follow‐up 35.8 weeks | Mean PAQLQ score in the control group was 6.31 | Mean score in the intervention groups was | ‐ | 279 | ⊕⊕⊕⊝ MODERATEa | |
| Adverse events Follow‐up 30 weeks | No events observed in either arm | ‐ | 99 (1 RCT) | Not graded | ||
| *The basis for the assumed risk (e.g. median control group risk across studies) is provided in footnotes. The corresponding risk (and its 95% confidence interval) is based on assumed risk in the comparison group and the relative effect of the intervention (and its 95% CI) | ||||||
| GRADE Working Group grades of evidence | ||||||
| No data could be meta‐analysed for adherence, exacerbations requiring OCS, asthma control or absenteeism. Some data are presented narratively in the review aBoth contributing studies considered at high risk for performance and detection bias bConfidence intervals include both potential harm and benefit of the intervention | ||||||
| Study ID ("first received" date for clinical trials registries) | Total n | Duration of intervention/follow‐up | Age | Country | Intervention | Control | Adherence measure | Outcomes |
| (2005) | 333 | 13/26 weeks | Adults | USA | Problem‐solving intervention | Asthma education | Electronic inhaler monitor | Adherence, AQLQ, ACQ, LFTs, hospitalisation, ED visits, participant satisfaction |
| 50 | 10 weeks | Adults | USA | Interactive voice response intervention | Usual care | Electronic inhaler monitor or canister weight | Adherence, AQLQ, ACT, Beliefs about Medication Questionnaire | |
| (2009) | 1187 | 2 years | Children | USA | Telephone speech recognition intervention | Usual care | Total ICS supplied/total prescribed | Adherence, beta‐agonist use, OCS use, primary care, ED and out of hours visits, hospitalisations, participant satisfaction |
| 271 | 13 weeks | Adolescents and adults | Brazil | Telephone counselling | Ususal care | "Number of inhalations recorded on the disks" | Adherence | |
| (2005) | 141 | 17 weeks/1 year | Children | USA | Problem‐solving intervention | Family‐based intervention | Electronic inhaler monitor | Adherence, symptoms, use of healthcare services, reliever medication use |
| (2009) | 55 | 2 months | Children | USA | Team work intervention | Asthma education | Electronic inhaler monitor | Adherence, Parent‐Adolescent Conflict Questionnaire, Functional Severity Index, LFTs, Consumer Satisfaction Survey |
| 60 GPs, 143 patients | 6 months | Adolescents and adults | Australia | Personalised adherence discussion (PAD) PAD + inhaler reminder feedback (IRF) | Usual care | Electronic inhaler monitor | ACT, AQLQ, Hospital Anxiety and Depression Scale, Medication Adherence Report Scale, LFTs, exacerbations | |
| 78 | 1 year | Adults | Norway | Asthma education | Usual care | Prescribed doses/dispensed doses | Adherence, GP visits, absenteeism, days in hospital | |
| (2010) | 20 | 12 weeks/1 year | Not reported, but mean age suggests adults | Northern Ireland | Nurse‐led psychoeducation | Ususal care (difficult asthma service) | Percent of prescriptions refilled | Adherence, OCS, beta‐agonist use, hospital admissions, LFTs, ACQ, AQLQ, Hospital Anxiety and Despression Scale |
| (2008) | 298 | 90 weeks | Children | Brazil | Telephone follow‐up intervention | Usual care | Percentage of actual doses/number expected | Adherence, disease control, quality of life (SF‐36) |
| 83 | 13 weeks | Children | UK | Asthma education | Usual care | Electronic inhaler monitor | Adherence, beliefs and anxieties about adherence | |
| (2007) | 60 | 26 weeks/78 weeks | Children | Sweden | Group discussion plus basic education | Basic education | Diaries and canister weight | Adherence, views on adherence, days hospitalised, ED visits, exacerbations |
| 15 | 6 weeks/52 weeks | Children | USA | Specific adherence improvement strategies (education, monitoring, etc.) | Usual care plus education | Electronic inhaler monitor | Adherence, LFTs, PedsQL, healthcare costs | |
| (2010) | 54 | 6 weeks/52 weeks | Adults | Canada | Motivational interviewing | Usual care | Prescribed treatment days/number of days | Adherence, asthma control, quality of life, asthma‐related self‐efficacy |
| 201 | 6 months | Adults | Belgium | Adherence education | Usual care | Prescription refill rates, self‐reporting | ACT, diary card, rescue medication use, ED visits, hospitalisations, AQLQ, Knowledge of Asthma and Asthma Medicine Questionnaire, inhalation technique | |
| (2010) | 68 | 10 weeks | Adolescents | USA | Adherence messaging and group sessions | "Attention control" | Electronic inhaler monitor | Adherence, asthma knowledge, ICS knowledge, ICS self‐efficacy, social support, exacerbations |
| (2015) | 12 | 12 weeks | Adolescents | USA | Adherence monitoring and incentivisation via app and sensor | Usual care | Electronic inhaler monitor | Adherence, ACT NB: study terminated |
| 30 | 10 weeks | Adults | USA | Adherence monitoring and education | Monitoring without feedback | Electronic inhaler monitor | Adherence, rescue medication use, AQLQ, LFTs | |
| (2005) | 250 | 78 weeks | Children | USA | Adherence education | Usual care | Prescription refill rates, self‐reporting | Adherence, symptoms, night‐time awakenings, ED visits, hospitalisation, OCS courses |
| 274 | 12 weeks | Adults | Denmark and Switzerland | Adherence education and study medication | Study medication alone | Dose counting in returned investigational product | Adherence, asthma control, LFTs, symptoms, rescue medication use, night‐time awakenings, adverse events, AQLQ, asthma severity, adverse events, vital signs | |
| (2006) | 14,064 (6903 previous ICS users) | 78 weeks | Adults | USA | Telephone interactive voice recognition intervention | Usual care | Pharmacy‐based adherence measures | Adherence, use of healthcare services, economic evaluation |
| ACQ: Asthma Control Questionnaire; ACT: Asthma Control Test; AQLQ: Asthma Quality of Life Questionnaire; ED: emergency department; GP: general practitioner; ICS: inhaled corticosteroid; IRF: inhaler reminder feedback; LFTs: lung function tests; OCS: oral corticosteroid; PAD: personalised adherence discussion; PedsQL: Paediatric Quality of Life Inventory; SF‐36: Short‐Form Health Survey | ||||||||
| Study ID | Total n | Duration of intervention/follow‐up | Age | Country | Intervention | Control | Adherence measure | Outcomes |
| 40 | 2 months | Children | New Zealand | Inhaler alarm | Usual care | Electronic inhaler monitor | Adherence, AQLQ, LFTs, beta‐agonist use | |
| (2007) | 26 | 4 months | Children | Australia | Adherence feedback during consultations | Usual care | Electronic inhaler monitor | Adherence, symptoms, LFTs |
| 220 | 6 months | Children | New Zealand | Audiovisual inhaler reminder | Usual care | Electronic inhaler monitor | Adherence, school/work absences, ACT, Asthma Morbidity Score, exacerbations, unscheduled visits, beta‐agonist use, LFTs | |
| 110 | 24 weeks | Adolescents and adults | New Zealand | Audiovisual inhaler reminder | Usual care | Electronic inhaler monitor | Adherence, ACQ, LFTs | |
| 60 GPs, 143 patients | 6 months | Adolescents and adults | Australia | Inhaler reminder and feedback (IRF) | Usual care | Electronic inhaler monitor | ACT, AQLQ, Hospital Anxiety and Depression Scale, Medication Adherence Report Scale, LFTs, exacerbations | |
| (2012) | 49 | 13 weeks | Young adults | USA | Computer sessions and tailored text reminders | Asthma education | Self‐reported missed doses | Adherence, ACT, LFTs, participant satisfaction |
| (2015) | 90 | 1 year | Children | UK | Adherence monitoring with feedback | Adherence monitoring but no feedback | Electronic inhaler monitor | "Clinical outcomes", adherence, LFTs, exacerbations |
| (2005) | 250 | 78 weeks | Children | USA | Adherence monitoring and education | Adherence education | Prescription refill rates, self‐reporting | Adherence, symptoms, night‐time awakenings, ED visits, hospitalisation, OCS courses |
| 26 | 12 weeks | Adults | Denmark | SMS (text message) adherence reminders | Usual care | "Dose‐count" on the Seretide was diskus | Adherence, change in FeNO, LFTs, airway responsiveness | |
| 219 | 52 weeks | Children | The Netherlands | SMS (text message) adherence reminders | Usual care | Electronic inhaler monitor | Adherence, ACT, exacerbations, use of healthcare services, AQLQ, school/work absence, acceptance of e‐monitoring, economic evaluation | |
| (2007) | 2698 (34 clusters) | 52 weeks | Children and adults | USA | Adherence education with adherence feedback | Adherence education alone | Electronic prescribing data/refill rate | Adherence, ED visits, hospitalisation, OCS use |
| ACQ: Asthma Control Questionnaire; ACT: Asthma Control Test; AQLQ: Asthma Quality of Life Questionnaire; ED: emergency department; FeNO: fractional exhaled nitric oxide; ICS: inhaled corticosteroid; LFTs: lung function tests; OCS: oral corticosteroid | ||||||||
| Study ID | Total n | Duration of intervention/follow‐up | Age | Country | Intervention | Control | Adherence measure | Outcomes |
| 102 | 12 weeks | Adults | UK | Combined inhaler | Separate inhalers | Electronic inhaler monitor | Adherence, LFTs | |
| 16 | 6 weeks/12 weeks | Adults | USA | Twice‐daily dosing | Four‐times‐daily dosing | Electronic inhaler monitor | Adherence, LFTs, symptoms | |
| (2007) | 111 | 24 weeks | Children | New Zealand | Combined inhaler | Separate inhalers | Electronic inhaler monitor | Adherence, LFTs, ACQ, OCS, unscheduled visits |
| 1233 | 12 weeks | Adolescents and adults | UK | Once‐daily ICS | Twice‐daily ICS | "Device counter number" | Adherence, physician assessment of response, quality of life, use of healthcare services, days of school/work missed, adverse events, worsening asthma | |
| ACQ: Asthma Control Questionnaire; ICS: inhaled corticosteroid; LFTs: lung function tests; OCS: oral corticosteroid | ||||||||
| Study ID | Total n | Duration of intervention/follow‐up | Age | Country | Intervention | Control | Adherence measure | Outcomes |
| 290 | 65 weeks | Children | USA | Supervised ICS therapy at school | Usual care | N/A | Episodes of poor asthma control, school absences, rescue medication use at school | |
| 184 | 9 weeks | Children | USA | Supervised ICS therapy at school | Usual care | N/A | Symptom‐free days, daytime and night‐time symptoms, rescue medication use, school absences | |
| (2010) | 100 | 6 to 8 months | Children | USA | Supervised ICS therapy at school | Usual care | N/A | Feasibility, symptom‐free days, numbers of days and nights with symptoms, activity limitation, rescue medication use, school absenteeism, parent sleep interruption, change in family plans due to the child’s asthma, PAQLQ, utilisation of healthcare services, FeNO |
| FeNO: fractional exhaled nitric oxide; ICS: inhaled corticosteroid; PAQLQ: Pediatric Asthma Quality of Life Questionnaire | ||||||||
| Outcome or subgroup title | No. of studies | No. of participants | Statistical method | Effect size |
| 1 % Adherence (objective measures) Show forest plot | 5 | 280 | Mean Difference (IV, Random, 95% CI) | 20.13 [7.52, 32.74] |
| 1.1 Complex | 4 | 230 | Mean Difference (IV, Random, 95% CI) | 21.55 [4.71, 38.39] |
| 1.2 Simple education | 1 | 50 | Mean Difference (IV, Random, 95% CI) | 15.40 [5.98, 24.82] |
| 2 % Adherence (all measures) Show forest plot | 10 | 1693 | Mean Difference (IV, Random, 95% CI) | 11.59 [3.72, 19.46] |
| 2.1 Complex | 8 | 744 | Mean Difference (IV, Random, 95% CI) | 12.21 [1.26, 23.17] |
| 2.2 Simple education | 2 | 949 | Mean Difference (IV, Random, 95% CI) | 10.60 [5.17, 16.03] |
| 3 > 85% adherence Show forest plot | 1 | 271 | Odds Ratio (M‐H, Random, 95% CI) | 2.68 [1.61, 4.46] |
| 4 Exacerbations requiring OCS (people with 1 or more) Show forest plot | 3 | 349 | Odds Ratio (M‐H, Random, 95% CI) | 1.82 [0.99, 3.36] |
| 5 Asthma control Show forest plot | 6 | Mean Difference (IV, Random, 95% CI) | Subtotals only | |
| 5.1 ACQ | 4 | 455 | Mean Difference (IV, Random, 95% CI) | ‐0.03 [‐0.49, 0.43] |
| 5.2 ACT | 3 | 333 | Mean Difference (IV, Random, 95% CI) | 0.30 [‐0.82, 1.43] |
| 6 Unsheduled visits to a healthcare provider (people with 1 or more) Show forest plot | 4 | 688 | Odds Ratio (M‐H, Random, 95% CI) | 0.48 [0.19, 1.19] |
| 6.1 Hospital | 1 | 250 | Odds Ratio (M‐H, Random, 95% CI) | 1.23 [0.56, 2.70] |
| 6.2 ED | 2 | 367 | Odds Ratio (M‐H, Random, 95% CI) | 0.23 [0.06, 0.83] |
| 6.3 GP | 1 | 71 | Odds Ratio (M‐H, Random, 95% CI) | 0.20 [0.07, 0.54] |
| 7 Quality of life (AQLQ) Show forest plot | 6 | 734 | Mean Difference (IV, Random, 95% CI) | 0.01 [‐0.20, 0.23] |
| Outcome or subgroup title | No. of studies | No. of participants | Statistical method | Effect size |
| 1 % Adherence (objective measures) Show forest plot | 6 | 555 | Mean Difference (IV, Random, 95% CI) | 19.86 [14.47, 25.26] |
| 1.1 Reminders/trackers | 3 | 321 | Mean Difference (IV, Random, 95% CI) | 16.29 [9.53, 23.04] |
| 1.2 With feedback | 3 | 234 | Mean Difference (IV, Random, 95% CI) | 24.98 [17.53, 32.44] |
| 2 % Adherence (all measures) Show forest plot | 8 | 762 | Mean Difference (IV, Random, 95% CI) | 18.41 [11.82, 25.00] |
| 2.1 Reminders/trackers | 4 | 361 | Mean Difference (IV, Random, 95% CI) | 16.92 [10.82, 23.02] |
| 2.2 With feedback | 4 | 401 | Mean Difference (IV, Random, 95% CI) | 20.06 [7.27, 32.85] |
| 3 Exacerbations requiring OCS (people with at least 1) Show forest plot | 4 | 3063 | Odds Ratio (M‐H, Random, 95% CI) | 0.72 [0.37, 1.39] |
| 4 Asthma control Show forest plot | 6 | Mean Difference (IV, Random, 95% CI) | Subtotals only | |
| 4.1 ACQ | 2 | 109 | Mean Difference (IV, Random, 95% CI) | 0.24 [‐0.29, 0.78] |
| 4.2 ACT | 4 | 596 | Mean Difference (IV, Random, 95% CI) | 0.74 [‐0.20, 1.69] |
| 5 Unscheduled visits to a healthcare provider Show forest plot | 3 | Odds Ratio (M‐H, Random, 95% CI) | Subtotals only | |
| 5.1 ED | 2 | 2918 | Odds Ratio (M‐H, Random, 95% CI) | 1.14 [0.88, 1.47] |
| 5.2 Hospital | 2 | 2865 | Odds Ratio (M‐H, Random, 95% CI) | 0.97 [0.53, 1.78] |
| 6 Unscheduled visits to a healthcare provider Show forest plot | 1 | Rate Ratio (Random, 95% CI) | Totals not selected | |
| 6.1 GP/ED visits | 1 | Rate Ratio (Random, 95% CI) | 0.0 [0.0, 0.0] | |
| 6.2 Hospitalisations | 1 | Rate Ratio (Random, 95% CI) | 0.0 [0.0, 0.0] | |
| 7 Absenteeism Show forest plot | 1 | Odds Ratio (M‐H, Random, 95% CI) | Totals not selected | |
| 8 Absenteeism Show forest plot | 1 | Rate Ratio (Fixed, 95% CI) | Subtotals only | |
| 9 Quality of life (AQLQ) Show forest plot | 4 | 369 | Mean Difference (IV, Random, 95% CI) | ‐0.03 [‐0.20, 0.13] |
| Outcome or subgroup title | No. of studies | No. of participants | Statistical method | Effect size |
| 1 % Adherence Show forest plot | 3 | 1310 | Mean Difference (IV, Random, 95% CI) | 4.02 [1.88, 6.16] |
| 2 Exacerbations requiring OCS Show forest plot | 1 | Odds Ratio (M‐H, Random, 95% CI) | Totals not selected | |
| 3 Asthma control (ACQ) Show forest plot | 1 | Mean Difference (IV, Random, 95% CI) | Totals not selected | |
| 4 Unscheduled visits Show forest plot | 1 | Odds Ratio (M‐H, Random, 95% CI) | Totals not selected | |
| 5 Absence from work/school Show forest plot | 1 | Odds Ratio (M‐H, Random, 95% CI) | Totals not selected | |
| 6 Quality of life (ITG‐ASF % change from baseline) Show forest plot | 1 | Mean Difference (IV, Random, 95% CI) | Totals not selected | |
| 7 All adverse events Show forest plot | 1 | Odds Ratio (M‐H, Random, 95% CI) | Totals not selected | |
| Outcome or subgroup title | No. of studies | No. of participants | Statistical method | Effect size |
| 1 Unscheduled visits (1 or more hospitalisations for any cause) Show forest plot | 2 | 279 | Odds Ratio (M‐H, Random, 95% CI) | 0.58 [0.16, 2.05] |
| 2 Quality of life (PAQLQ) Show forest plot | 2 | 279 | Mean Difference (IV, Random, 95% CI) | 0.25 [0.01, 0.49] |
| Outcome or subgroup title | No. of studies | No. of participants | Statistical method | Effect size |
| 1 Comparison 1. Children vs adults Show forest plot | 10 | 1693 | Mean Difference (IV, Random, 95% CI) | 11.59 [3.72, 19.46] |
| 1.1 Children | 4 | 1241 | Mean Difference (IV, Random, 95% CI) | 8.01 [‐4.77, 20.79] |
| 1.2 Adults/adolescents and adults | 6 | 452 | Mean Difference (IV, Random, 95% CI) | 14.43 [5.49, 23.36] |
| 2 Comparison 2. Complex vs simple interventions Show forest plot | 6 | 555 | Mean Difference (IV, Random, 95% CI) | 19.86 [14.47, 25.26] |
| 2.1 Complex | 3 | 234 | Mean Difference (IV, Random, 95% CI) | 24.98 [17.53, 32.44] |
| 2.2 Simple | 3 | 321 | Mean Difference (IV, Random, 95% CI) | 16.29 [9.53, 23.04] |
| 3 Comparison 2. Children vs adults Show forest plot | 6 | 555 | Mean Difference (IV, Random, 95% CI) | 19.86 [14.47, 25.26] |
| 3.1 Children | 3 | 314 | Mean Difference (IV, Random, 95% CI) | 17.29 [8.32, 26.26] |
| 3.2 Adults/adolescents and adults | 3 | 241 | Mean Difference (IV, Random, 95% CI) | 22.84 [16.66, 29.02] |