استفاده از F18 PET با فلوربتاپیر برای تشخیص زودهنگام دمانس بیماری آلزایمر و سایر دمانسها در افراد مبتلا به اختلال شناختی خفیف (MCI)
چکیده
پیشینه
جذب اف‐18 با فلوربتاپیر (18F‐florbetapir) توسط بافت مغزی که توسط توموگرافی با گسیل پوزیترون (positron emission tomography; PET) اندازهگیری میشود، توسط سازمانهای نظارتی مانند سازمان غذا و داروی آمریکا (FDA) و آژانس دارویی اروپا (EMA) برای ارزیابی بار آمیلوئید در افراد مبتلا به دمانس پذیرفته شد. مقدار افزوده آن، عمدتا با حذف پاتولوژی آلزایمر در تشخیص دمانس پایدار نشان داده میشود. با این حال، موسسه ملی انجمن پیری و آلزایمر (National Institute on Aging and Alzheimer's Association; NIA‐AA) معیارهای تشخیصی بیماری آلزایمر و اطمینان به تشخیص اختلال شناختی خفیف (mild cognitive impairment; MCI) را به علت بیماری آلزایمر که ممکن است در هنگام استفاده از تستهای بیومارکرهای آمیلوئید مانند اف‐18 با فلوربتاپیر افزایش یایند، مورد تجدید نظر قرار داد. این کارآزماییها، که به معیارهای بالینی هسته MCI اضافه شدند، ممکن است دقت تست تشخیصی (diagnostic test accuracy; DTA) استراتژی کارآزمایی را افزایش دهند. با این حال، DTA اف‐18 با فلوربتاپیر برای پیشبینی پیشرفت از MCI به دمانس بیماری آلزایمر (ADD) یا دمانسهای دیگر هنوز بهطور سیستماتیک ارزیابی نشده است.
اهداف
تعیین DTA پت اسکن اف‐18 با فلوربتاپیر برای تشخیص افراد مبتلا به MCI در زمان انجام تست که از نظر بالینی به ADD، سایر انواع دمانس (non‐ADD)، یا هر نوع دمانس در پیگیری مبتلا شدهاند.
روشهای جستوجو
این مرور تا می 2017 بهروز است. MEDLINE (OvidSP)؛ Embase (OvidSP)؛ PsycINFO (OvidSP)؛ BIOSIS Citation Index (Thomson Reuters Web of Science)؛ Web of Science Core Collection شامل Science Citation Index (Thomson Reuters Web of Science) و نمایهنامه استنادی مقالات کنفرانسها (Thomson Reuters Web of Science؛ LILACS (BIREME)؛ CINAHL (EBSCOhost)؛ ClinicalTrials.gov (https://clinicaltrials.gov)، و پلتفرم بینالمللی پایگاه ثبت کارآزماییهای بالینی سازمان جهانی بهداشت (WHO ICTRP) (http://www.who.int/ictrp/search/en/) را جستوجو کردیم. همچنین ALOIS، پایگاه ثبت تخصصی مطالعات دمانس گروه دمانس و بهبود شناختی در کاکرین (http://www.medicine.ox.ac.uk/alois/) را جستوجو کردیم. فهرست منابع مطالعات مرتبط و مرورهای سیستماتیک را کنترل کردیم و پیگیری استنادات را با استفاده از Science Citation Index برای شناسایی هر مطالعه مرتبط اضافی انجام دادیم. هیچ محدودیتی از نظر زبان و تاریخ انتشار در جستوجوهای الکترونیکی اعمال نشد.
معیارهای انتخاب
مطالعاتی را وارد کردیم که مطالعات کوهورت آیندهنگر را با استفاده از هرگونه تعریف قابل قبول از MCI هنگام انجام تست و با استفاده از اسکن اف‐18 با فلوربتاپیر برای ارزیابی DTA پیشرفت از MCI به ADD یا سایر انواع دمانس تعریف کردند. علاوه بر این، فقط مطالعاتی را انتخاب کردیم که استاندارد مرجع را برای تشخیص دمانس آلزایمر مورد استفاده قرار دادند، برای مثال، موسسه ملی اختلالات روانشناختی و ارتباطی و استروک و انجمن اختلالات مربوط به بیماریهای آلزایمر و اختلالات مرتبط (NINCDS‐ADRDA) یا نسخه چهارم راهنمای تشخیصی و آماری اختلالات روانی (DSM‐IV).
گردآوری و تجزیهوتحلیل دادهها
تمام عناوین و چکیدههای مقالات شناسایی شده را در جستوجوی بانک اطلاعاتی الکترونیکی غربال کردیم. دو نویسنده مرور بهطور مستقل از هم مطالعات را برای ورود انتخاب کرده و دادهها را برای ایجاد جداول دو در دو استخراج کردند، که نتایج تست باینری را در برابر مرجع استاندارد باینری نشان دادند. از این دادهها برای محاسبه حساسیتها، ویژگیها، و 95% فواصل اطمینان آنها استفاده کردیم. دو ارزیاب مستقل، ارزیابی کیفیت را با استفاده از ابزار QUADAS‐2 به همراه بعضی از موارد اضافی برای ارزیابی کیفیت روششناسی مطالعات وارد شده انجام دادند.
نتایج اصلی
ما سه مطالعه را وارد کردیم، دو مطالعه پیشرفت از MCI به ADD، و یک مطالعه پیشرفت از MCI به هر نوع دمانس را ارزیابی کردند.
پیشرفت از MCI به ADD در 448 شرکتکننده بررسی شد. مطالعات دادههای مربوط به 401 شرکتکننده را با پیگیری 1.6 سال و در 47 شرکتکننده با پیگیری سه سال گزارش کردند. شصتویک شرکتکننده (15.2%) 1.6 سال پیگیری شدند؛ نه شرکتکننده (19.1%) سه سال پیگیری شدند.
پیشرفت از MCI به سمت هر گونه دمانس در پنج شرکتکننده با 1.5 سال پیگیری، و سه شرکتکننده (60%) تبدیل شده به هرگونه دمانس بررسی شدند.
در هر سه مطالعه نگرانی در مورد قابلیت کاربرد استاندارد مرجع وجود داشت. با توجه به حوزه پیگیری و زمانبندی، دو مطالعه در معرض خطر بالای سوگیری (bias) قرار داشتند.
MCI به ADD؛
پیشرفت از MCI به ADD در افرادی با پیگیری بین دو تا کمتر از چهار سال با استفاده از ارزیابی بصری (47 = n؛ 1 مطالعه) دارای حساسیت 67%؛ (95% CI؛ 30 تا 93) و ویژگی 71%؛ (95% CI؛ 54 تا 85) بود.
پیشرفت از MCI به ADD در افرادی که بین یک تا کمتر از دو سال پیگیری شدند، با استفاده از ارزیابی بصری دارای حساسیت 89%؛ (95% CI؛ 78 تا 95) و ویژگی 58%؛ (95% CI؛ 53 تا 64) و با استفاده از ارزیابی کمی بر اساس نسبت مقدار جذب استاندارد شده (SUVR)؛ (401 = n؛ 1 مطالعه) دارای حساسیت 87%؛ (95% CI؛ 76 تا 94) و ویژگی 51%؛ (95% CI؛ 45 تا 56) بود.
MCI به هر نوع دمانس؛
پیشرفت از MCI به هر نوع دمانس در افراد با پیگیری بین یک تا کمتر از دو سال با استفاده از ارزیابی بصری دارای حساسیت 67%؛ (95% CI؛9 تا 99) و ویژگی 50%؛ (95% CI؛ 1 تا 99) (5 = n؛ 1 مطالعه) بود.
MCI به هر نوع دیگری از دمانس (غیر از ADD)؛
هیچ اطلاعاتی در مورد پیشرفت از MCI به هر نوع دیگر از دمانس (غیر از ADD) وجود نداشت.
نتیجهگیریهای نویسندگان
اگرچه حساسیت در یک مطالعه وارد شده خوب بود؛ با توجه به ویژگی ضعیف و دادههای محدود موجود در منابع علمی، ما نمیتوانیم استفاده روتین از پت اف‐18 با فلوربتاپیر را در عمل بالینی برای پیشبینی پیشرفت از MCI به ADD توصیه کنیم.
با توجه به حساسیت و ویژگی ضعیف، تعداد محدود شرکتکنندگان، و دادههای محدود موجود در منابع علمی، نمیتوانیم استفاده روتین از آن را در عمل بالینی برای پیشبینی پیشرفت از MCI به هر نوع دمانس توصیه کنیم.
با توجه به هزینههای بالای مالی اف‐18 با فلوربتاپیر، نشان دادن واضح DTA و استانداردسازی روند این روش قبل از استفاده وسیع از آن مهم است.
خلاصه به زبان ساده
پت اسکن اف‐18 با فلوربتاپیر برای تشخیص زودهنگام دمانس بیماری آلزایمر و سایر دمانسها در افراد مبتلا به اختلال شناختی خفیف
سوال مطالعه مروری آیا استفاده از پت اسکن اف‐18با فلوربتاپیر (18F PET scan with florbetapir) پیشرفت دمانس بیماری آلزایمر (Alzheimer's disease dementia; ADD) و سایر دمانسها را در افراد مبتلا به اختلال شناختی خفیف (mild cognitive impairment; MCI) پیشبینی میکند؟
پیشینه
با توجه به پیری جهانی، انتظار میرود تعداد افراد مبتلا به دمانس در چند دهه آینده بهطور چشمگیری افزایش یابد. تشخیص دمانس در مرحله اولیه مطلوب است؛ اما توافق گستردهای در مورد بهترین رویکرد برای این امر وجود ندارد. طیف وسیعی از تستهای قلم و کاغذ ساده که توسط متخصصان مراقبت سلامت استفاده میشوند، میتوانند افراد دارای حافظه ضعیف یا اختلال شناختی را ارزیابی کنند. یا استفاده یا عدم استفاده از پت اسکنهای ویژه که آمیلوئید ‐ یکی از نشانههای بیماری آلزایمر ‐ را تشخیص میدهند، توانایی ما را برای پیشبینی پیشرفت از MCI به ADD یا سایر انواع دمانس که هنوز نامشخص است بهبود میبخشد. از آنجایی که این تستها گران هستند، مهم است که مزایای بیشتری داشته باشند.
هدف
هدف ما ارزیابی دقت پت اسکن اف‐18 با فلوربتاپیر در شناسایی آن دسته از افراد مبتلا به MCI است که از لحاظ بالینی تا ADD، و سایر انواع دمانس، یا هر نوع دمانس طی یک دوره زمانی پیشرفت میکنند.
ویژگیهای مطالعه
شواهد تا می 2017 بهروز است. سه مطالعه را یافتیم که 453 شرکتکننده مبتلا به MCI را وارد کردند. دو مطالعه پیشرفت از MCI به ADD و یک مطالعه پیشرفت از MCI به هر نوع دمانس را ارزیابی کردند.
با توجه به دو مطالعهای که به ارزیابی پیشرفت از MCI به ADD پرداختند، یک مطالعه با 401 شرکتکننده با پیگیری 1.6 سال داشت و میانگین سنی 72 سال بود. مطالعه دیگر 47 شرکتکننده با پیگیری سه سال داشت، و میانگین سنی 72 سال بود.
مطالعه دیگری که انواع دیگر دمانس را بررسی کرد، 5 شرکتکننده بالای 90 سال را وارد کرد.
دو مطالعه از این مطالعات، توسط تولید کننده تست، از نظر مالی حمایت شد.
کیفیت شواهد
محدودیت اصلی این مرور این بود که یافتههای ما فقط بر مبنای سه مطالعه بود، و جزئیات کافی در مورد چگونگی انتخاب افراد وجود نداشت، اطلاعات به دست آمده از اسکن جدا از تشخیص نهایی ارزیابی شد. به دلیل تضاد بالقوه مناسب شناسایی شده، این مطالعات در معرض خطر سوگیری (bias) بالا در نظر گرفته شدند.
یافتههای کلیدی
در این مرور، بر اساس سه مطالعه، نتایج زیر را یافتیم.
در پیگیری 1.6 ساله، با استفاده از ارزیابی بصری، اسکن، 89% از شرکتکنندگانی را که به ADD پیشرفت داشتند، به درستی طبقهبندی کرد و فقط 58% از شرکتکنندگانی را که تا ADD پیشرفت نداشتند به درستی طبقهبندی کرد. این بدان معنی است که در گروهی از 100 فرد مبتلا به MCI، از 15% از افرادی که به سمت ADD خواهند رفت، ما انتظار داریم 13 نفر از 15 شرکتکننده نتیجه مثبت داشته باشند و 2 شرکتکننده دیگر منفی کاذب خواهند بود. همچنین 49 فردی که به ADD مبتلا نشدند، نتیجه منفی خواهند داشت، اما 36 فرد که به ADD مبتلا نشدند، نتیجه مثبت خواهند داشت (مثبت کاذب).
در این مطالعه که افراد را به مدت سه سال پیگیری و از ارزیابی بصری استفاده کرد، اسکن، 67% از افرادی را که تا ADD پیشرفت کردند و 71% از افرادی را که تا ADD پیشرفت نکردند، به درستی طبقهبندی کرد. این بدان معنی است که در گروهی از 100 شرکتکننده مبتلا به MCI؛ ADD در 19 شرکتکننده توسعه خواهد یافت، ما انتظار داریم 13 شرکتکننده نتیجه مثبت اسکن و 6 شرکتکننده نتیجه منفی کاذب خواهند داشت. علاوه بر این، 58 نفر از 81 شرکتکننده که به ADD پیشرفت نکردند، نتیجه منفی خواهند داشت، اما 23 شرکتکننده که به سمت ADD نخواهند رفت، نتیجه مثبت (مثبت کاذب) خواهند داشت. تعداد کم شرکتکنندگانی که در سه سال ارزیابی شدند، اطمینان ما را به دقت این تخمینها کاهش دادند.
با توجه به پیشرفت به سمت هرگونه دمانس، تعداد بسیار کم شرکتکنندگان به این معنی است که قادر به ارائه تخمینهای معنیداری از دقت کارآزماییها نیستیم.
ما نتیجه گرفتیم که اسکن اف‐18 با فلوربتاپیر نمیتواند برای استفاده روتین در عمل بالینی برای پیشبینی پیشرفت از MCI تا ADD یا هر نوع دمانس دیگر بر اساس دادههای موجود فعلی توصیه شود. مطالعات بیشتری برای تعیین سودمندی آن مورد نیاز است.
Authors' conclusions
Summary of findings
| What is the diagnostic accuracy of 18F‐florbetapir PET amyloid biomarker for predict progression to ADD, any other form of dementia (non‐ADD) or any form of dementia in people with MCI? | |||||||
| Descriptive | |||||||
| Patient population | Participants diagnosed with MCI at time of performing the test using any of the Petersen criteria or Winblad criteria or CDR = 0.5 or any 16 definitions included by Matthews (Matthews 2008). | ||||||
| Sources of referral | Not reported (n = 2) Mixed (memory clinics, newspaper ads, radio, and other public media campaigns) (n = 1) | ||||||
| MCI criteria | ADNI criteria, CDR 0.5 criterion was included (n = 2) CIND (cognitive impairment not dementia) (Matthews 2008) (n = 1) | ||||||
| Sampling procedure | Unclear (n = 3) | ||||||
| Prior testing | The only testing prior to performing the 18F‐florbetapir PET amyloid biomarker was the application of diagnostic criteria for identifying participants with MCI | ||||||
| Settings | Community and institutionalised (n = 1) Not reported (n = 2) | ||||||
| Index test | 18F‐florbetapir PET | ||||||
| Threshold prespecified at baseline | Yes (n = 3) | ||||||
| Threshold interpretation | Visual (n = 3) Quantitative (n = 1) | ||||||
| Threshold | Visual:
SUVR (Standardised Uptake Volume ratio):
| ||||||
| 18F‐florbetapir retention region | Global cortex (n = 1) | ||||||
| Reference Standard | Alzheimer’s disease dementia: NINCDS‐ADRDA (n = 1) Unclear (n = 1) Any form of dementia: DSM‐IV criteria for dementia (n = 1) | ||||||
| Target condition | Progression from MCI to Alzheimer’s disease dementia or any other forms of dementia (non‐ADD) or any form of dementia | ||||||
| Included studies | Prospectively well‐defined cohorts with any accepted definition of MCI (as above). Three studies (N = 458 participants) were included. Number of participants included in analysis: 453. | ||||||
| Quality concerns | The participant selection and reference standard QUADAS‐2 domain: unclear risk of bias. The index test domain: low risk of bias in all three included studies. The flow and timing domain: high risk of bias in the two included studies. Unclear concerns about applicability in the reference standard domain in all three included studies. | ||||||
| Limitations | Limited investigation of heterogeneity and sensitivity analysis due to insufficient number of studies. We were unable to evaluate progression from MCI to any other form of dementia (non‐ADD) due to lack of included studies. | ||||||
| Test | Studies | Cases/Participants | Sensitivity | Specificity | Consequences in a cohort of 100 | ||
| Proportion converting1 | Missed cases2 | Overdiagnosed2 | |||||
| Alzheimer's disease dementia | |||||||
| 18F‐florbetapir by visual assessment from one to less than two years of follow‐up | 1 | 61/401 | 89% (95% CI 78% to 95%) | 58% (95% CI 53% to 64%) | 15 | 2 | 36 |
| 18F‐florbetapir by quantitative assessment from one to less than two years of follow‐up | 1 | 61/401 | 87% (95% CI 76% to 94%) | 51% (95% CI 45% to 56%) | 15 | 2 | 42 |
| 18F‐florbetapir by visual assessment from two to less than four years of follow‐up | 1 | 9/47 | 67% (95% CI 30% to 93%) | 71% (95% CI 54% to 85%) | 19 | 6 | 23 |
| Any form of dementia | |||||||
| 18F‐florbetapir by visual assessment from one to less than two years of follow‐up | 1 | 3/5 | 67% (95% CI 9% to 99%) | 50% (95% CI 1% to 99%) | 60 | 20 | 20 |
| Investigation of heterogeneity and sensitivity analysis: The planned investigations were not possible due to the limited number of studies available for each analysis. | |||||||
| Conclusions:18F‐florbetapir PET scan is not an accurate test for detecting progression from MCI to Alzheimer’s disease dementia or any form of dementia. The strength of the evidence was weak because of considerable variation in study methods, unclear methodological quality due to poor reporting, and high risk of bias due to possible conflict of interest. There is a need for conducting studies using standardised 18F‐florbetapir PET scan methodology in larger populations. | |||||||
| 1. Proportion converting to ADD or any form of dementia in each included study. 2. Missed and overdiagnosed numbers were computed using the proportion converting to the target condition. | |||||||
Background
Dementia is a syndrome due to a brain disease — usually of a chronic or progressive nature — in which there is disturbance of multiple higher cortical functions, including memory, thinking, orientation, comprehension, calculation, learning capacity, language, and judgement. However, consciousness remains unaffected. See the glossary in Appendix 1. The impairments of cognitive function are commonly accompanied, and occasionally preceded, by a deterioration in emotional control, social behaviour, motivation, and the impairment is sufficient to interfere with everyday activities. Dementia is a collection of different subtypes distinguished by the underlying pathology. Alzheimer's disease dementia (ADD) is the most common form of dementia and other important pathologies associated with dementia are vascular disease, Lewy bodies, and frontotemporal pathology (WHO 2012).
Dementia is a serious worldwide public health problem, with a prevalence of 4.7% in adults older than 60 years (6.2% and 6.5% in Europe and the Americas, respectively). Due to its prevalence in older people, it is expected that the number of people with dementia will increase dramatically. Consequently, in the year 2050, an expected number of 115 million people will have dementia. This will result in a considerable economic burden, which currently stands at 1% of the world's Gross National Product (GNP) in direct and indirect costs (WHO 2012). These financial costs are in addition to the devastating personal and social consequences of the condition.
The definition of MCI applies to people without evidence of significant deterioration in activities of daily living, but with subjective memory complaints and cognitive impairment detected by standardised tests. MCI often precedes clinical dementia, but there is no consensus regarding how to operationalise the MCI diagnosis. There are several clinical criteria to define which people have MCI, including the Petersen criteria or Petersen Revised Criteria (Petersen 1999; Petersen 2004; Winblad 2004), Clinical Dementia Rating Scale (CDR = 0.5) (Morris 1993), or 16 other different classifications of MCI (Matthews 2008).
A diagnosis of MCI reputedly allows testing of preventive interventions that would slow the progression of MCI to dementia. If the progression of MCI to dementia could be deferred by five years, the prevalence of dementia would decrease by 43% in 2050 (Alzheimer's Association 2010). MCI has an annual progression rate to ADD from 5% to 15%. However, not every person with MCI develops dementia, and a significant number of people recover or stabilise. Therefore, future research should try to clarify which people with MCI develop dementia in order to be able to focus specifically on people who are at high risk of developing dementia. This may possibly explain the failure of therapy to alter the progression to dementia in people with MCI. Other aspects that may contribute to this failure are the disparity in diagnostic criteria and different settings of the studied participants: community, primary, secondary, and research centres (Bruscoli 2004; Mattsson 2009; Petersen 1999; Petersen 2009).
The definition of Alzheimer's disease pathology is over 100 years old. This pathology includes neuritic plaques that contain deposits of amyloid beta (Aβ) and neurofibrillary tangles (Goedert 2006). This pathology is present in approximately 84% of all people with dementia (Schneider 2007). Furthermore, Alzheimer's disease pathology is found in 88% of people diagnosed with probable ADD (Schneider 2009). Despite this, Alzheimer's disease pathology may be found concomitantly at autopsy in people thought to have other forms of dementia, such as vascular dementia, Lewy body dementia, or frontotemporal dementia (FTD) (Jellinger 2006). Furthermore, at least five common pathologies have been found in the brains of people who died and were thought to have ADD prior to death (White 2009). Also, Alzheimer's disease pathology was found in 42% of community‐dwelling older people without dementia (Schneider 2007). This has generated controversy about the importance of the presence of Alzheimer's disease pathology. The pathology can be associated with ageing per se, and, for older people, the relationship between amyloid plaque burden and cognitive impairment diminishes as age progresses (Savva 2009). Thus, this pathology could be an epiphenomenon associated with the presence of dementia, e.g. a by‐product of repair mechanisms for vascular damage (De la Torre 2004; Garcia‐Alloza 2011). On the other hand, this controversy could be because our clinical diagnostic criteria have not enough accuracy to diagnose Alzheimer's disease that is detected by histopathology in postmortem studies (Hyman 2012). In addition, other researchers think that there is no real controversy about the amyloid hypothesis, because the amyloid cascade and the Aβ deposition have a primary role in Alzheimer's disease (Selkoe 2016).
More recently, the development of Aβ pathology biomarkers in vivo has been suggested as an important advance as a diagnostic tool in the field of Alzheimer's disease, and has promoted the creation of new diagnostic criteria for people without symptoms (preclinical stages), people with MCI, and people with ADD, based on the presence of biomarkers of Alzheimer's disease. These have included Aβ tracers by positron emission tomography (PET) (Albert 2011; Dubois 2014; McKhann 2011; Sperling 2011). However, uncertainties regarding the usability of biomarkers in the diagnosis of dementia still exist, mainly due to variation between biomarker types, criteria for positivity, and differences in methodology (Noel‐Storr 2013). This prompted an important initiative, the Standards for Reporting of Diagnostic Accuracy Studies in dementia studies (STARDdem) statement (Noel‐Storr 2014). Consequently, clinical properties of dementia biomarkers should not be assumed, and formal systematic evaluations of sensitivity, specificity, and other properties of biomarkers should be performed (Davis 2013).
PET is an imaging technique using compounds labelled with short‐lived positron‐emitting radionuclides. The use of Aβ ligands permits the in vivo detection of amyloid deposition in the brain. 18F‐florbetapir is a stilbene derivative and demonstrates a high binding affinity to Aβ aggregates. 18F‐florbetapir has good uptake by brain tissue and washout kinetics in mice and monkeys (Choi 2009) and in vitro binding of Aβ plaques in postmortem ADD brain samples (Choi 2009; Lin 2010). In 2010, it was evaluated for the first time in people with ADD and healthy people without ADD (Lin 2010; Wong 2010). 18F‐florbetapir could eventually be used to differentiate between different dementia types, specifically between FTD and ADD (Kobylecki 2015).
The Food and Drug Administration (FDA) and the European Medicines Agency (EMA) approved 18F‐florbetapir for Aβ binding. These agencies have stated that a negative scan indicates sparse or no plaques, which is inconsistent with a diagnosis of ADD, thus effectively excluding this diagnosis. A positive 18F‐florbetapir scan indicates moderate to frequent or amyloid neuritic plaques. However, this might also occur in people with other neurological conditions (e.g. Lewy body dementia, Parkinson’s disease dementia) and in older adults with normal cognition. Therefore, a positive result of an 18F‐florbetapir scan does not establish the diagnosis of ADD or any other cognitive disorder definitely, and it should be combined with other diagnostic evaluations or instruments. Additionally, the effectiveness and safety of the tests have not been established by predicting development of dementia or other neurological conditions, or by monitoring responses to therapies (EMA 2013; FDA 2013).
Despite not being approved for this purpose by the regulatory agencies, research has been conducted in people with MCI to determine whether biomarkers, such as 18F‐florbetapir for Aβ, increase the risk of developing dementia over time. The evidence for this is uncertain. For this and other reasons, the National Institute on Aging‐Alzheimer's Association (NIA‐AA) in the USA established two different criteria for MCI. Firstly, they established the Core Clinical Criteria for use in all clinical settings, without use of biomarkers, and characterised by concerns regarding a change in cognition with impairment in one or more cognitive domains with preservation of independence in functional abilities, therefore no dementia. Secondly, they established the Clinical Research Criteria, which incorporate the use of biomarkers, such as PET amyloid scans, intended for use exclusively in research settings, including academic centres and clinical trials. This will help determine whether positive scans increase the likelihood of progression from MCI to clinical dementia (Albert 2011). Lastly, it is hoped that people with MCI and positive scans will 'enrich' clinical trials, and more people who will progress to dementia in a shorter time will be included to allow more efficient studies of treatments and prevention strategies of ADD (CMS 2013).
An assumption for some researchers, and one on which this systematic review (SR) is predicated, is that if a person has both MCI and the pathology of Alzheimer's disease and develops clinical ADD subsequently, then the cause of the initial MCI and of the ADD was the Alzheimer’s pathology. Our approach is an example of assessing diagnostic test accuracy (DTA) using delayed verification of diagnosis. Instead of the reference standard being based on pathology, it is based on a clinical standard and the progression from MCI to ADD or any other form of non‐ADD or any dementia. Although, for the reasons stated above, a degree of unreliability has been introduced, defining progression has the advantage of being based on what matters most to people with MCI, their families, and clinicians involved in their care.
The 18F‐florbetapir PET scan is considered the diagnostic marker of interest and, in this SR, we assessed the DTA of 18F‐florbetapir Aβ binding in the brain and progression of the following:
-
From MCI to ADD.
-
From MCI to any other form of non‐ADD.
-
From MCI to any form of dementia
This SR belongs to a series of SRs regarding PET biomarkers for amyloid β, including 18F‐florbetaben and 18F‐flutemetamol (Martínez 2016).
Target condition being diagnosed
This SR assessed the following three target conditions.
-
ADD (progression from MCI to ADD).
-
Any other form of dementia (progression from MCI to any other form of non‐ADD).
-
Any form of dementia (progression from MCI to any form of dementia).
We compared the index test results obtained at baseline with the results of the reference standards obtained at follow‐up (delayed verification).
Index test(s)
The 18F‐florbetapir scan is an index test for the detection of Aβ deposition in the brain region of interest (ROI). The ROI is a selected brain area that physicians create for further study in various anatomical areas of the brain. 18F‐florbetapir is a molecular biomarker, described as (E)‐4‐(2‐(6‐(2‐(2‐(2[18F]fluoroethoxy)ethoxy)ethoxy)pyridine‐3‐yl)vinyl)‐N‐methylbenzamine and also referred to as 18F‐AV‐45 (Choi 2009).
Image Interpretation
Both the FDA and EMA have described the criteria for 18F‐florbetapir for Aβ positivity (EMA 2013; FDA 2013).
18F‐florbetapir diagnosis is by PET image assessment and is designated as either positive or negative by comparison of the radioactivity in cortical grey matter with activity in the adjacent white matter. This determination is made only in the cerebral cortex; the signal uptake in the cerebellum does not contribute to the scan interpretation (e.g. a positive scan may show retained cerebellar grey‐white contrast even when the cortical grey‐white contrast is lost). Specifically, a positive scan exhibited one of the following.
-
Two or more brain areas (each larger than a single cortical gyrus) in which there is reduced or absent grey‐white contrast. This is the most common appearance of a positive scan.
-
One or more areas in which grey matter radioactivity is intense and clearly exceeds radioactivity in adjacent white matter.
Readers trained in PET images with 18F‐florbetapir, should interpret the Aβ PET image made with this ligand (EMA 2013; FDA 2013).
Before the FDA and EMA described the criteria for 18F‐florbetapir PET scan positivity, the diagnosis of dementia was made using different thresholds. Therefore, we planned to use the FDA or EMA criteria applied in each included study to classify participants as either test‐positive or test‐negative, or alternatively if 18F‐florbetapir Aβ uptake and retention exceeded a certain threshold.
We considered the measurement of the 18F‐florbetapir retention (retention ratio): distribution volume ratio (DVR), standardised uptake value ratio (SUVR), or other ratios. DVR refers to the ratio of the 18F‐florbetapir distribution volume in the selected area (ROI) to the distribution volume in the reference area. SUVR is the ratio of the 18F‐florbetapir ligand standardised uptake value in the selected area (ROI) to the standardised uptake value in the reference area.
The unit of analysis of our SR was the participant. We did not include studies that analysed multiple ROIs per person.
Image analysis: not prespecified (e.g. Statistical Parametric Mapping (SPM) or other image analysis techniques).
Administration Instructions and Recommended Dosing
-
Time between 18F‐florbetapir injection and PET acquisition: images should be acquired in 10 minutes starting from 30 to 50 minutes after intravenous administration (EMA 2013; FDA 2013).
-
Injection dose: the recommended dose for 18F‐florbetapir Aβ PET is 370 MBq (10 mCi) as a single intravenous bolus in a total volume of 10 mL or less (EMA 2013; FDA 2013).
Although it is inevitable that included studies have used different imaging protocols, readers' expertise, and varied parameters, the amyloid PET data in these included studies should be technically adequate and acquired at a fully qualified and certified facility.
Clinical pathway
At this time, the clinical evaluation often has similarities between different countries (Cordella 2013; NICE 2006). It often starts with people experiencing memory complaints detected by themselves or their relatives. Frequently, general practitioners or family physicians are consulted, and they often conduct a medical evaluation using a screening test for cognitive impairment. Whenever this screening test is positive, they complete an assessment with a clinical evaluation conducted with laboratory studies that can rule out a secondary cause of cognitive impairment (e.g. hypothyroidism, renal failure, liver failure, vitamin B12 or folate deficiency, and others). In addition, these people are then referred to medical specialists in cognitive disorders (preferably a geriatrician, psychiatrist, or neurologist) in a secondary centre or directly to memory clinics where further clinical assessment, laboratory studies, and cerebral image studies are conducted to confirm the dementia diagnosis.
People with dementia, or their relatives, often directly consult these specialists or specialised memory clinics in the study of cognitive disorders. Therefore, the performance of the diagnostic tests will probably vary according to whether it is a primary consultation or a referral from primary to specialist care, or if the people have different clinical stages of the disease (MCI, mild, moderate, or severe dementia). Due to these differing pathways, the use of 18F‐florbetapir PET ligand for Aβ will be mainly used in specialist consultations and memory clinics as an addition to clinical evaluation or other tests, helping in a clinical setting to discard a diagnosis of Alzheimer's dementia with a negative scan in a person with clinical dementia and doubts about the aetiology (e.g. FTD versus ADD). Otherwise, it might be used solely in the research field in people with MCI for the enrichment of clinical trials. For example, enrolling people with MCI and a positive PET scan to study preventive interventions before people develop dementia.
However, in some memory clinics, the 18F‐florbetapir PET is used for clinical purposes in people with persistent or progressive unexplained MCI adopting the Johnson criteria (Johnson 2013), criteria without sufficient evidence. Therefore, if the 18F‐florbetapir PET is positive in a person with MCI, this positivity is considered as one of the core histopathological findings of Alzheimer's disease. The person will thus be catalogued as a patient with prodromal Alzheimer's disease or MCI due to Alzheimer's disease.
Alternative test(s)
Currently there are no standard practice tests available for the clinical diagnosis of Alzheimer's disease dementia. Below, we have listed the alternative tests that we have excluded from this SR. The Cochrane Dementia and Cognitive Improvement Group is in the process of conducting a series of DTA SRs of biomarkers and scales (see list below).
-
18F PET ligands for Aβ (18F‐florbetaben, 18F‐flutemetamol) (Martínez 2016).
-
18F‐FDG‐PET (PET F‐fluorodeoxyglucose) (Smailagic 2015).
-
11C‐PIB‐PET (PET‐Pittsburgh compound B) (Zhang 2014).
-
Cerebrospinal fluid (CSF) analysis of Aβ and tau (Kokkinou 2014; Ritchie 2013; Ritchie 2014).
-
Structural magnetic resonance imaging (sMRI) (Filippini 2012).
-
Neuropsychological tests (Mini‐Mental State Examination (MMSE); MiniCOG; Montreal Cognitive Assessment (MoCA) (Arevalo‐Rodriguez 2015; Chan 2014; Creavin 2016; Davis 2015; Fage 2015; Seitz 2014).
-
Informant interviews (Informant Questionnaire on Cognitive Decline in the Elderly (IQCODE); AD8) (Harrison 2014; Hendry 2014; Lees 2014; Harrison 2015; Quinn 2014).
-
APOE‐ϵ4 (Elias‐Sonnenschein 2014a; Elias‐Sonnenschein 2014b; Elias‐Sonnenschein 2014c).
-
Single‐photon emission computed tomography (SPECT) brain imaging (Archer 2015; McCleery 2015).
Rationale
Accurate and early diagnosis of Alzheimer's disease is crucial for planning healthcare systems, because the costs of dementia are currently at least 1% of the world's GNP (WHO 2012).
18F‐florbetapir is approved for use in the clinical field mainly in people who are diagnosed clinically with dementia of uncertain aetiology, in which case diagnosis of ADD can be discarded if the test is negative. Even though 18F‐florbetapir is not approved for this purpose, this biomarker test is currently being used in the research field to search for the accurate identification of people with MCI who would progress to Alzheimer’s disease or other forms of dementia. Amyloid β tracers by PET have been included in newly diagnostic criteria in the study of people with MCI (Albert 2011; Dubois 2014). However, some uncertainties exist about the generalisability of the DTA results in clinical settings, especially in older people (Richard 2012).
It is currently believed that if the health system can identify which people are at high risk of progressing from MCI to dementia, it can focus on improving opportunities for appropriate contingency planning for them. Proper recognition of the disease may also help prevent inappropriate and potentially harmful admissions to hospital or institutional care (NAO 2007), and enable the development of new treatments designed to delay or prevent progression to more debilitating stages of the disease. Additionally, this may demonstrate a real clinical benefit for people and caregivers, and will reduce health system costs.
This SR assessed the DTA of 18F‐florbetapir Aβ PET in people with MCI.
Objectives
To determine the diagnostic test accuracy (DTA) of 18F‐florbetapir as the index test for detecting participants with mild cognitive impairment (MCI) at time of performing the test who would clinically progress to Alzheimer's disease dementia (ADD), or other forms of non‐ADD, or any form of dementia at follow‐up.
Secondary objectives
To investigate the heterogeneity of the DTA in the included studies, by evaluating the spectrum of people, referral centres, clinical criteria of MCI, 18F‐florbetapir techniques, reference standards used, duration of follow‐up, aspects of study quality, and conflicts of interest.
Methods
Criteria for considering studies for this review
Types of studies
We included longitudinal studies that had prospectively defined cohorts with any accepted definition of mild cognitive impairment (MCI), as outlined below, at time of performing the 18F‐florbetapir Aβ scan and a reference standard (see Index tests and Reference standards below). We obtained the results at the follow‐up of the studies. These studies had to employ delayed verification of progression to dementia and were sometimes labelled as 'delayed verification cross‐sectional studies' (Bossuyt 2008; Knottnerus 2002). We included case‐control studies when they incorporated a delayed verification design. This occurred in the context of a cohort study, so these studies were invariably diagnostic‐nested case‐control studies.
Participants
Participants recruited and clinically classified as having MCI at time of performing the test were eligible for inclusion. We established the diagnosis of MCI using the Petersen criteria or revised Petersen criteria (Petersen 1999; Petersen 2004; Winblad 2004), the criteria included in the Matthews study (Matthews 2008), CDR = 0.5 (CDR structured interviews collects information from both the collateral source and the subject regarding memory, orientation, judgment and problem solving, community affairs, home and hobbies, and personal care, where the range of possible scores varies from none = 0 point to severe = 3 points) (Morris 1993), the National Institute on Aging‐Alzheimer's Association (NIA‐AA) core clinical criteria (Albert 2011), or a combination.
We excluded studies that included people with MCI possibly caused by any of the following:
-
Current or a history of alcohol or drug abuse.
-
Central nervous system (CNS) trauma (e.g. subdural hematoma), tumour, or infection.
-
Other neurological conditions (e.g. Parkinson’s or Huntington’s diseases). Regarding Parkinson's disease, many of the studies specifically excluded Parkison's disease patients from the group with mild cognitive impairment. This specific group of patients is complex in both regards to defining neuropathology and in determination of functional decline. For these reasons, this group of patients needs to be addressed in specific studies.
Index tests
The index test of this SR was the 18F‐florbetapir biomarker test. We used the criteria and cut‐off values for test positivity as reported in the included studies. We considered positivity for 18F‐florbetapir Aβ scan uptake and retention exceeding a certain threshold.
Target conditions
There were three target conditions in this SR:
-
Alzheimer’s disease dementia (ADD) (progression from MCI to ADD).
-
Any other forms of dementia (progression from MCI to any other forms of non‐ADD).
-
Any form of dementia (progression from MCI to any form of dementia).
Reference standards
The reference standard was the progression to the target conditions evaluated by a physician with expertise in the dementia field (preferably, a geriatrician, psychiatrist, or neurologist). For the purpose of this SR, we accepted several definitions of ADD. We included studies that applied the National Institute of Neurological and Communicative Disorders and Stroke and the Alzheimer’s Disease and Related Disorders Association (NINCDS‐ADRDA) criteria (McKhann 1984), the Diagnostic and Statistical Manual of Mental Disorders (DSM) criteria (APA 1987; APA 1994), and the International Classification of Diseases (ICD) (ICD‐10) criteria for ADD. Notably, different iterations of these standards may not be directly comparable over time (e.g. APA 1987 versus APA 1994). Moreover, the validity of the diagnoses may vary with the degree or manner in which the criteria have been operationalised (e.g. individual clinician versus algorithm versus consensus determination). We considered all these issues when we interpreted the results.
Similarly, we accepted differing clinical definitions of other dementias. For Lewy body dementia, the reference standard is the McKeith criteria (McKeith 1996; McKeith 2005); for frontotemporal dementia, the Lund criteria (Boxer 2005; Brun 1994; Neary 1998), the DSM criteria (APA 1987; APA 1994), the ICD criteria (ICD‐10), or the International Behavioural Variant FTD Criteria Consortium (Rascovsky 2011); and for vascular dementia, the National Institute of Neurological Disorders and Stroke and Association Internationale pour la Recherché et l'Enseignement en Neurosciences (NINDS‐AIREN) criteria (Román 1993), the DSM criteria (APA 1987; APA 1994), or the ICD criteria (ICD‐10).
The time interval over which progression from MCI to ADD (or other forms of dementia) occurs is very important. We used one year as the minimum period of delay in the verification of the diagnosis (the time between the assessment at which a diagnosis of MCI is made and the assessment at which the diagnosis of dementia is made).
Search methods for identification of studies
Electronic searches
We searched MEDLINE (Ovid SP) from 1946 to May 2017; Embase (Ovid SP) from 1974 to May 2017; PsycINFO (Ovid SP) from 1806 to May 2017; BIOSIS Citation Index (Thomson Reuters Web of Science) from 1922 to May 2017; Web of Science Core Collection, including the Science Citation Index (Thomson Reuters Web of Science) and the Conference Proceedings Citation Index (Thomson Reuters Web of Science) from 1946 to May 2017; LILACS (Bireme); CINAHL (EBSCOhost) from 1980 to May 2017; ClinicalTrials.gov (https://clinicaltrials.gov); and the World Health Organization International Clinical Trials Registry Platform (WHO ICTRP) (http://www.who.int/ictrp/search/en/). We also searched ALOIS, the Cochrane Dementia & Cognitive Improvement Group’s specialized register of dementia studies (http://www.medicine.ox.ac.uk/alois/).
We used two approaches in designing the search. One focused solely on the specifically named index test (including a range of synonyms); the second, run in parallel, covered a more general search, linking broader terms for the index test, focused by terms describing its diagnostic use to terms for the target condition to try to capture the more difficult to locate studies of a more general nature, where these particular radioligands were included in diagnostic accuracy research but not named specifically in the parts of the electronic bibliographic record that are searchable and therefore would be missed.
See Appendix 2 for details of the sources and search strategies that we used. No language or date restrictions were applied to the electronic searches.
Searching other resources
We examined the reference lists of all relevant studies for additional studies. We also searched the Database of Abstracts of Reviews of Effects (DARE) via the Cochrane Library: www.cochranelibrary.com), the National Institute for Health Research ‐ Health Technology Assessment Database (NIHR‐HTA) (via the Cochrane Library: www.cochranelibrary.com), the Aggressive Research Intelligence Facility (ARIF) database (www.arif.bham.ac.uk) for other related systematic diagnostic accuracy reviews, and the International Federation of Clinical Chemistry and Laboratory Medicine Committee for Evidence‐based Laboratory Medicine database (C‐EBLM) (http://www.ifcc.org/ifcc‐education‐division/emd‐committees/c‐eblm/evidence‐based‐laboratory‐medicine‐c‐eblm‐base).
We checked the reference lists of any relevant studies and systematic reviews, and performed citation tracking using the Science Citation Index to identify any additional relevant studies.
Data collection and analysis
Selection of studies
Two review authors (GM, RV) independently screened the retrieved titles and abstracts for potentially eligible studies. A third review author (PF) resolved any disagreements between the two review authors. The two review authors (GM, RV) then independently assessed the full‐text articles of the selected studies with the inclusion criteria. They resolved any disagreements through discussion or, where necessary, consulted a third review author (PF) who acted as an arbitrator. When a study did not present all relevant data for creating a 2 × 2 table, we contacted the study authors directly to request further information. When more than one article presented data on the same population, we included the primary article, which was the article with the largest number of people or with the most informative data (e.g. longest time of follow‐up in the primary outcome).
Data extraction and management
We planned to extract the following data regarding the study characteristics.
-
Bibliographic details of primary paper:
-
author, title of study, year, and journal.
-
-
Basic clinical and demographic details:
-
number of participants;
-
clinical diagnosis;
-
MCI clinical criteria;
-
age;
-
gender;
-
sources of referral;
-
participant recruitment;
-
sampling procedures.
-
-
Details of the index test:
-
method of the 18F‐florbetapir test administration, including those who administered the test;
-
thresholds used to define positive and negative tests;
-
other technical aspects as seemed relevant to the review, e.g. brain areas.
-
-
Details of the reference standard:
-
definition of ADD and other dementias used in the reference standard;
-
duration of follow‐up from time of index test performed to defining ADD and other dementias by the reference standard: one year to less than two years; two years to less than four years; and more than four years. If participants had been followed for varied amounts of time, we recorded a mean follow‐up period for each included study. If possible, we grouped those data into minimum, maximum, and median follow‐up periods, which could then become the subject of subgroup analyses;
-
prevalence or proportion of population developing ADD and other dementias, with severity, if described.
-
We created 2 × 2 tables (cross‐relating index test results of the reference standards) as shown in Appendix 3. For each included study, we recorded the number of people lost to follow‐up. We also extracted data necessary for the assessment of quality, as defined below. Two review authors (GM, RV) independently performed data extraction. We resolved any disagreements regarding data extraction by discussion, or by consulting a third review author (PF).
Assessment of methodological quality
We assessed the methodological quality of each included study using the Quality Assessment of Diagnostic Accuracy Studies 2 tool (QUADAS‐2) (Whiting 2011), as recommended by Cochrane (Davis 2013). This tool is comprised of four domains: participant selection, index test, reference standard, and participant flow.
Two review authors (GM, RV), who were blinded to each other’s scores, independently performed the QUADAS‐2 assessment. We resolved any disagreements by discussion or, if necessary, consulted a third review author (PF) who acted as an arbitrator. We assessed each domain in terms of risk of bias, and also considered the first three domains in terms of applicability concerns. In Appendix 4, we have detailed the components of each of these domains and provided a rubric that shows how we made judgements concerning risk of bias. Key areas important to quality assessment are participant selection, blinding, and missing data.
We included three additional signalling questions on our checklist.
-
Was the PET scan interpretation done by a trained reader physician? (We included this under the ’Index test’ domain).
-
Was there a clear definition of a positive result? (We included this under the ’Index test’ domain).
-
Was the study free of commercial funding? (We included this under the ’flow and timing’ domain).
We included the item pertaining to the PET scan interpretation and the definition of positive results to take into account the subjective nature of 18F‐florbetapir Aβ scan image interpretation, which may be based on a variety of different criteria, such as extensive clinical experience, different standardised uptake values (SUV), different morphological features, or a combination of the aforementioned. We included the third additional item in order to record any potential bias resulting from commercial interest in the results due to the potential risk by the manufacturing company leading to more favourable results and conclusions than sponsorship by other sources (Lundh 2017).
We did not use QUADAS‐2 data to form a summary quality score. We produced a narrative summary that described the numbers of included studies that were at high, low, or unclear risk of bias as well as concerns regarding applicability, which we have described in Appendix 5.
Statistical analysis and data synthesis
We applied the DTA framework for the analysis of a single test and extracted the data from each included study into a 2 × 2 table, showing the binary test results cross‐classified with the binary reference standard, and we ignored any censoring that might have occurred. We acknowledge that such a reduction in the data may represent a significant oversimplification.
We used data from the 2 × 2 tables abstracted from the included studies: true positive (TP), false negative (FN), false positive (FP), true negative (TN), and entered these into Review Manager 5 (RevMan 5) (Review Manager 2014) to calculate the sensitivities, specificities, and their 95% confidence intervals. We also presented individual study results graphically by plotting estimates of sensitivities and specificities in both a forest plot and a receiver operating characteristic (ROC) space. If an individual included study published more than one threshold, we presented the graphical findings for all reported thresholds.
We planned to segment analyses into separate follow‐up mean periods for the delay in verification: one year to less than two years; two to less than four years; and greater than four years. We planned to clearly note where the same included studies contributed to the analysis for more than one reference standard follow‐up interval.
However, due to lack of data, we conducted no meta‐analyses, but we prepared a 'Summary of findings' table regardless.
Investigations of heterogeneity
We were able to include only three studies, therefore issues of heterogeneity did not arise.
Sensitivity analyses
We found insufficient data to conduct any sensitivity analyses.
Assessment of reporting bias
We did not investigate reporting bias.
Results
Results of the search
The total number of records identified for this SR was 2502. The PRISMA diagram (Figure 1) shows the selection of records through the screening and selection processes. In total, we assessed 312 studies (74 full text papers, 81 conference publications, 86 registered studies in clinicaltrials.gov, and 71 registered studies in WHO ICTRP) for eligibility in the full‐text screening. We excluded 299 studies. 115 studies were multiple publications or duplicates and 33 studies did not have extractable data for constructing 2 x 2 tables, and we received no reply when we contacted the authors. One study used an MCI definition not accepted in our protocol, and we excluded five studies with available data to extract due to duplication of participants or at high risk of duplication with the included studies (Characteristics of excluded studies). We excluded the remaining studies because they did not meet the inclusion criteria: i) not a longitudinal study (n = 44); ii) no MCI participants at time of performing the test (n = 35); iii) index test not a 18F‐florbetapir PET scan (n = 3); iv) discussion or review paper (n = 20); v) wrong design (n= 43). We included three studies and identified ten references as ongoing studies (Characteristics of ongoing studies).

Study flow diagram.
Included studies
See Characteristics of included studies.
Doraiswamy 2014 refers to one study reported previously with ADD, MCI, and healthy control (HC) participants and a longitudinal extension at 36 months follow‐up of this cross‐sectional study with the MCI participants. Participants were recruited from 21 sites in the United States of America as part of a cross‐sectional study to determine the efficacy using both visual interpretation and quantitative interpretation to assess brain amyloid burden by 18F‐florbetapir PET scan to differentiate healthy controls (n = 79) from subjects with a clinical diagnosis of ADD (n = 45) or MCI (n = 60) study participants. The interim analysis of the longitudinal extension at 18 months reported baseline data of 51 MCI participants and the efficacy analysis included 46 participants. On the other hand, the baseline data described in Doraiswamy 2014 is of 47 MCI participants with at least one post‐baseline measurement; however, there were 52 participants at baseline planned for efficacy participants.
MCI participants had a CDR score of 0.5; complaint of memory or cognitive decline corroborated by an informant; objective evidence of cognitive impairment or marginally normal cognition with a documented history of high cognitive performance; no obvious medical cause for the impairment; subject not demented and criteria for ADD not satisfied; normal score on the Alzheimer’s Disease Clinical Studies Consortium Activities of Daily Living (ADCS ADL), 25 of 47 were female; participants with Aβ (+) by 18F‐florbetapir PET scan had a mean age of 74.47 + 7.72 years old, with 14.47 + 2.18 mean years of education, their mean MMSE was 27.29 + 2.14 points and 11 participants were APOE ϵ4 carrier positive, respectively. In those participants with Aβ (‐) by 18F‐ florbetapir PET scan, they had a mean age of 70.40 + 10.72 years old, with 15.27 + 2.42 mean years of education and their mean MMSE was 27.53 + 1.63 points. Four participants were APOE ϵ4 carrier positive, respectively. Of the 47 participants, 9 (19.1%) developed Alzheimer’s dementia. 5 participants (9.6%) had no post‐baseline measurement, therefore they were excluded from the analysis, and in those 47 with at least one post‐baseline measurement, 37 completed the study at 36 months. The Reference standard at follow‐up was not explicitly stated, although NINCDS‐ADRDA criteria for ADD (McKhann 1984) were baseline diagnostic criteria.
Potential conflicts of interest were noted. The manufacturer of 18F‐florbetapir tracer provided financial support for the study and six authors were employees.
Kawas 2013 refers to a study with participants who were 90 years old or older who either lived at home or in institutions, evaluated in the United States of America. Those included were participants of a longitudinal, population‐based study (90+ Study) and were also invited to participate in this study which was part of research to examine the relationship between measurements of brain amyloid and levels of amyloid burden measured by postmortem histopathological assessment (Clark 2011). Participants had normal cognition or cognitive or functional impairment resulting from cognition not severe enough to meet DSM‐IV diagnostic criteria and they were classified as cognitively impaired, not demented (CIND). They agreed to postmortem brain donation. The purpose of the study was to examine cross‐sectional and longitudinal associations between cognitive performance and beta amyloid load in non‐demented oldest‐old. Baseline characteristics was based on 13 non‐demented oldest‐old participants, eight were normal controls and five of them were classified as MCI at time of performing the test according to our MCI definitions (Matthews 2008), three MCI were considered as Aβ (+), and two MCI were considered as Aβ (‐). In the total group (13 participants), the mean age was 94.1 years (range 90 to 99); for those considered as Aβ (+), the mean age was 94.4 years (range 93 to 96) and 94.1 years (range 90 to 99) years old for those with Aβ (‐). Nine participants were women, two of whom were Aβ (+), and two of four men were Aβ (+) at baseline. Seven participants were reported as having been educated beyond high school age, two of them were Aβ (+) and five were Aβ (‐), and for those six having been educated up to or less than high school age, two were Aβ (+) and four were Aβ (‐), respectively. The mean MMSE was 28 (range 24 to 30); for those considered as Aβ (+), the mean MMSE was 26.5 (range 24 to 29) and 28 (range 25 to 30) for those in the Aβ (‐) group; and no data regarding APOE ϵ4 carrier were reported.
All participants were followed for a mean period of 1.5 years; three of 13 participants developed dementia during follow‐up, one in the Aβ (‐) group and two in the Aβ (+) group, and it seemed that none of the participants were lost to follow‐up. The reference standard used to classify participants at follow‐up as dementia or not was DSM‐IV (APA 1994).
Partial financial support was provided by and three authors were employees of the manufacturer of 18F‐florbetapir tracer.
Schreiber 2015 is a study with data from Alzheimer's Disease Neuroimaging Initiative (ADNI), a multicentre study, supported by the National Institute of Health, private companies, and non‐profit organisations. This ADNI database recruited participants from nearly 50 different sites. All participants were aged between 55 and 90 years, had completed at least 6 years of education, and MCI participants were single‐domain or multidomain amnestic, had subjective memory problems, had a MMSE score between 24 and 30, and had a CDR of 0.5.
The main objectives of this study were to investigate the concordance between visual and quantitative Aβ PET with the 18F‐florbetapir PET scan and if these assessments agreed or not with CSF Aβ1‐42 in MCI participants, and also to examine the prediction of progression at follow‐up according to their visual and quantitative categorization as Aβ positive or negative at baseline with the 18F‐florbetapir PET scan (ADNI‐GO; ADNI2).
The threshold used was a SUVR > 1.11 determined at baseline (Landau 2012, Landau 2013).
The study had 401 MCI participants. The mean age at baseline was 71.6 years (+ 7.5). There were 182 female participants, and 198 participants were APOE ϵ4 carrier positive. The MMSE mean was 28.1 (+ 1.7) and the mean years of education was 16.2 (+ 2.7).
No potential conflicts of interest were noted.
Excluded studies
120 studies were excluded since they did not meet the inclusion criteria for participants, index test, or target condition and 76 studies were duplicated or multiple publications. Additionally, 33 studies did not have data to create a 2 by 2 table, and three studies with data to create the 2 by 2 table were not included due to shared or high risk of shared participants with one included study (Characteristics of excluded studies).
Methodological quality of included studies
We assessed methodological quality using the QUADAS‐2 tool (Whiting 2011). Review authors’ judgements about each methodological quality item for each included study are presented in the Characteristics of included studies table and Figure 2. The overall methodological quality of the studies is summarised in Figure 2.

Risk of bias and applicability concerns summary: review authors' judgements about each domain for each included study
In the participant selection domain, we considered all studies (Doraiswamy 2014; Kawas 2013; Schreiber 2015) to be at unclear risk of bias due to lack of reporting on sampling procedures and exclusion criteria. We stated that the included studies avoided a case‐control design because we only considered data on performance of the index test to discriminate between people with MCI who converted to dementia and those who remained stable.
In the index test domain, we considered all three studies to have a low risk of bias (Doraiswamy 2014; Kawas 2013; Schreiber 2015). The three studies had low risk of bias because the visual assessment used in all three studies was established, the SUVR used in the Schreiber study was described previously as a SUVR > 1.11 (Landau 2012), and in all three studies, the interpretation was made blinded to the clinical data. In our two additional signalling questions, there was low risk regarding whether the index test was interpreted by a trained reader physician in all three included studies, and the positivity criteria was clearly established in two studies and, in one, it was considered as unclear.
In the reference standard domain, we considered the three studies as at unclear risk of bias (Doraiswamy 2014; Kawas 2013; Schreiber 2015). The Doraiswamy study had an unclear risk of bias because we were not able to obtain the information about which reference standard was used. Regarding the Kawas and Schreiber studies, we considered the studies as unclear risk of bias because, despite the use of DSM‐IV criteria for any form of dementia (APA 1994) and NINCDS‐ADRDA criteria (McKhann 1984) as reference standards, respectively, it was unclear if the clinician was blinded to the results of the 18F‐florbetapir PET scan to establish the dementia diagnosis.
In the flow and timing domain, we judged the Doraiswamy study to have a high risk of bias because it was unclear if it used the same criterion to diagnose the ADD at follow‐up. In our additional signalling question, there were potential conflicts of interest due to the financial support for the study and the fact that six authors were employees of the manufacturer of 18F‐Flobetapir tracer. Regarding the Kawas study, a high risk of bias was considered due to possible conflict of interest because of partial financial support and three authors were employees of the company producing 18F‐florbetapir.
For assessment of applicability, there was no concern that the included participants and setting, and the conduct and interpretation of the index test, did not match the review question. However, the target condition (as defined by the reference standard) was unclear due to lack to information about which reference standard(s) was applied (Doraiswamy 2014) and if the clinician was blinded or not to the 18F‐florbetapir PET scan result to establish the diagnosis (Kawas 2013; Schreiber 2015).
Findings
The results of the included studies are summarised in Data table 1 and Data table 2. Additionally, the summary of main results for the included studies are presented in the 'Summary of findings' table.
18F‐florbetapir to predict progression from MCI to Alzheimer’s disease dementia (ADD)
Visual Assessment
Doraiswamy 2014 included data on 47 of the 52 eligible participants with MCI diagnosed with CDR = 0.5, and complaint of memory or cognitive decline corroborated by an informant; objective evidence of cognitive impairment or marginally normal cognition with a documented history of high cognitive performance; no obvious medical cause for the impairment; subject not demented and criteria for ADD not satisfied; normal score on the Alzheimer’s Disease Clinical Studies Consortium Activities of Daily Living (ADCS ADL), using a nonspecified reference standard, probably NINCDS‐ADRDA (McKhann 1984). They reported a sensitivity of 67% (95% CI 30 to 93) and a specificity of 71% (95% CI 54 to 85) to predict the progression from MCI to ADD at three years of follow up. Of the 52 participants who were given an initial clinical diagnosis of MCI, the study had data on 47 of them at the follow‐up; 6 were true positive, 11 were false positives, 3 were false negative and 27 were true negative (Figure 3).

Forest plot of tests: 1 MCI to ADD by visual assessment from 2 to less than 4 years of follow‐up, 2 MCI to ADD by visual assessment from 1 to less than 2 years follow‐up, 3 MCI to ADD by SUVR at 1 to less than 2 years follow‐up, 4 MCI to any form of dementia.
Schreiber 2015 included data on 401 participants with MCI defined as cases with single‐domain or multidomain amnestic; having subjective memory concerns; MMSE score between 24 and 30 (inclusive); CDR = 0.5; Memory Box score had to be at least 0.5, and general cognition and functional performance sufficiently preserved such that a diagnosis of Alzheimer’s disease could not be made at the screening visit. They reported a sensitivity of 89% (95% CI 78 to 95) and a specificity of 58% (95% CI 53 to 64) to predict the progression from MCI to ADD at 1.6 years of follow‐up. Of the 401 participants who were given an initial clinical diagnosis of MCI, the study had data of all at follow‐up; 54 were true positive, 142 were false positives, 7 were false negative, and 198 were true negative (Figure 3).
Quantitative Assessment by SUVR > 1.1
Schreiber 2015 included data on 401 participants with MCI defined as above and reported a sensitivity of 87% (95% CI 76 to 94) and a specificity of 51% (95% CI 45 to 56) to predict the progression from MCI to ADD at 1.6 years of follow up. Of 401 participants who were given an initial clinical diagnosis of MCI, the study had data of all at follow‐up; 53 were true positive, 168 were false positives, 8 were false negative, and 172 were true negative (Figure 3).
18F‐florbetapir to predict progression from MCI to any form of dementia
Visual Assessment
Kawas 2013 included data on five participants with MCI, defined as participants with a condition known as 'cognitive impairment non‐demented (CIND)', where participants had either cognitive or functional impairment resulting from cognition not severe enough to meet DSM‐IV criteria, and it was included in Matthews 2008 MCI definitions. This study had a sensitivity of 67% (95% CI 9 to 99) and a specificity of 50% (95% CI 1 to 99) to predict the progression from MCI to any form of dementia at 1.5 years of follow‐up. Of five participants who were given an initial clinical diagnosis of MCI, the study had data on five of them at the follow‐up; two were true positive, one was false positive, one was false negative and one was true negative (Figure 3).
No data were available regarding the other target condition in this Cochrane review; progression from MCI to another form of non‐ADD.
Investigation of heterogeneity
The planned investigations were not possible due to the limited number of studies available for the analysis.
Sensitivity analyses
There were insufficient studies identified to permit any sensitivity analysis.
Discussion
Summary of main results
The volume and quality of evidence regarding the DTA of 18F‐florbetapir for early diagnosis of ADD and other dementias in participants with MCI was limited. We identified three studies in this SR. However, we were not able to construct a meta‐analysis because we planned to perform an analysis according to their follow‐up mean periods for the delay in verification: one year to less than two years; two to less than four years; and greater than four years. Neither of the two studies with the same target condition, progression from MCI to ADD, had the same follow‐up period. We did not perform sensitivity analyses and were not able to analyse heterogeneity.
Two included studies (Doraiswamy 2014; Schreiber 2015) addressed the DTA of 18F‐florbetapir analysed by visual assessment for the prediction of progression from MCI to ADD at follow‐up, and one also evaluated the progression from MCI to ADD at follow‐up analysed quantitatively with a threshold of SUVR > 1.1 (Schreiber 2015). One study addressed the DTA of 18F‐florbetapir analysed by visual assessment for the prediction of progression from MCI to any form of dementia at follow‐up (Kawas 2013). The results are summarised in the 'Summary of findings' table (summary of findings Table). Two studies were evaluated as at high risk of bias, mainly due to the potential conflict of interest regarding financial support by the company who manufactured the 18F‐florbetapir tracer (Doraiswamy 2014; Kawas 2013). No other study had information about the progression to any other form of dementia (non‐ADD).
Regarding the objectives of our SR, to determine the DTA of the 18F‐florbetapir PET scan for detecting participants with MCI at time of performing the test who would clinically progress to ADD, or to other forms of dementia or any form of dementia at follow‐up, the results were as follows:
18F‐florbetapir PET scan for Alzheimer’s disease dementia (ADD)
Progression from MCI to ADD in those with a follow‐up between two to less than four years had a sensitivity of 67% (95% CI 30 to 93) and a specificity of 71% (95% CI 54 to 85) by visual assessment (Figure 3).
Progression from MCI to ADD in those with a follow‐up between one to less than two years had a sensitivity of 89% (95% CI 78 to 95) and a specificity of 58% (95% CI 53 to 64) by visual assessment and a sensitivity of 87% (95% CI 76 to 94) and a specificity of 51% (95% CI 45 to 56) by quantitative assessment by SUVR (Figure 3).
The DTA of18F‐florbetapir included a wide range of low‐to‐moderate and good sensitivity and low‐to‐moderate specificity for predicting progression to ADD through visual or SUVR assessment evaluation at different follow‐up. In other words, the low‐to‐moderate or good sensitivity could be affected by a high false negative rate. One hypothesis that could explain false negatives is that some people with probable ADD diagnosis may have different and multiple brain pathologies, the most common being Alzheimer's disease pathology combined with microscopic infarcts or neocortical Lewy body disease. These heterogeneous pathological findings are similar in those with MCI (Schneider 2007; Schneider 2009). In addition, the soluble Aβ oligomers are not detected by 18F‐florbetapir, and they have been playing a central role in Alzheimer's pathogenesis in the amyloid hypothesis (Heyden 2013), with the possibility of producing false negatives. Indeed, a study found two of 11 participants with an autopsy performed > one year after the 18F‐florbetapir PET scan as having a positive neuropathological diagnosis (probable or definite Alzheimer's disease), and they had a negative 18F‐florbetapir PET scan (Clark 2012).
Moreover, the presence of neurofibrillary tangles (NFTs), the other histopathologic core of Alzheimer's disease, is not detected by amyloid tracers. For example, the data from cohort studies indicated that plaques and tangles independently contributed to cognitive impairment in Alzheimer's disease pathology without any other primary neuropathologic diagnosis (Serrano‐Pozo 2013). Furthermore, NFT formation might be either unrelated to amyloid plaques formation or a temporally distinct process, or both (Royall 2014).
In addition, the low‐to moderate specificity could be affected by a high false positive rate. A positive 18F‐florbetapir PET scan for Aβ, has been found in other neurological conditions. It was positive in seven of 11 cases of dementia with Lewy bodies, in one of five Parkinson's disease participants (Siderowf 2014), and in six of eight FTD participants evaluated with a SUVR > 1.11 (Kobylecki 2015). The latter could be explained due to the presence of mixed pathology in the same participant, however, in one study with a pathology diagnosis, in three cases with non‐ADD by histopathology, the 18F‐florbetapir PET had a low likelihood of Alzheimer's disease by NIA/Reagan Institute criteria in all of them (Clark 2011). On the other hand, the false positive rate could be explained because it has affinity to amyloid in vessel walls, in particular, to cerebral amyloid angiopathy as this was shown in patients with intracerebral haemorrhage due to cerebral amyloid angiopathy (CAA)(Gurol 2016). The latter would indicate that some MCI participants have vascular MCI due to CAA. The other important option for a high false positive rate is that in many people without cognitive impairment, it is possible to find Aβ deposits at autopsy (Gelber 2012) generating doubt about the pathophysiological relevance of the Aβ hypothesis in Alzheimer's disease.
Duration of follow‐up is also important in predicting the progression of MCI to ADD, because the reported progression rate of MCI to ADD is between 8% and 16% per year (Mitchell 2009). We took it for granted that, given a long follow‐up period, a high percentage of people with MCI at time of performing the test would progress to Alzheimer’s disease, thus affecting the predictive accuracy of the 18F‐florbetapir PET scan. This was found in a systematic review with PiB PET where the data were separated into short follow‐up and longer than two years of follow‐up (Ma 2014). The authors included five studies with 102 participants in total with a variable specificity between 58% to 100%. However, in this SR, the progression rate in both included studies was relatively similar despite the follow‐up in one study being almost double the other (15.2% at 1.6 years and 19.1% at three years of follow‐up). This difference is probably explained by the setting of recruitment or other characteristics of the MCI participants and other underlying factors affecting these progression rates (Doraiswamy 2014; Schreiber 2015). In consequence, due to the lack of data, we were not able to investigate the effect of the follow‐up on the progression rate from MCI to ADD or any form of dementia.
The MCI subtypes have been studied regarding their relationship with the progression to ADD. In the largest longitudinal study to our knowledge, results from the follow‐up of 550 MCI participants indicated that the MCI subtype, presence of storage memory impairment, multiple domain condition, and presence of APOE ϵ4 allele increased the risk of progression to dementia. Multivariate survival and Kaplan‐Meier analyses showed that amnestic MCI with storage memory impairment had the most and closest risk of progression to dementia (Espinosa 2013). In our review, one study included only amnestic MCI, and this could explain the decrease in false negative rate with an increase in sensitivity. This may explain why the sensitivity was higher in this study (Schreiber 2015) than the study which included any type of MCI (Doraiswamy 2014). In addition, some ’high risk factors’ such as positive family history of dementia, presence of Abeta and tau protein in cerebrospinal fluid, and the APOE ϵ4 allele may also contribute to a faster progression rate to dementia. To support this, the Schreiber study showed different Cox proportional hazards regression models, where visual analysis adjusted by age, sex, and educational level had a higher hazard ratio to predict the progression than when analyses added APOE ϵ4 allele or 18F‐FDG‐PET as covariates (Schreiber 2015). Another study using a multimodal approach to predict the progression including MRI, 18F‐florbetapir PET, and 18F‐FDG‐PET had better predictive accuracy than the single modality (Xu 2016). In conclusion, further studies should include high‐quality research with more detailed data about the characteristics of MCI, not only to explore the underlying mechanisms but also to elucidate the causal pathways that link 18F‐florbetapir PET scan positivity to diverse MCI subtypes and disease progression.
18F‐florbetapir PET scan for any other forms of dementia (non‐Alzheimer’s disease dementia (non‐ADD))
Data for any other forms of dementia (non‐Alzheimer's disease dementia) were limited in this SR. Although 18F‐florbetapir retention is a poor predictor of subsequent progression to Alzheimer’s disease, the current available data suggested that 18F‐florbetapir may not play a role in any other forms of dementia (non‐ADD).
18F‐florbetapir PET scan for any form of dementia
Progression from MCI to any form of dementia in those with a follow‐up between one to less than two years had a sensitivity of 67% (95% CI 9 to 99) and a specificity of 50% (95% CI 1 to 99) by visual assessment (Figure 3).
Kawas 2013 had poor sensitivity and specificity to predict any form of dementia (Kawas 2013). This could be explained by the reasons stated before, specifically due to the small sample of the oldest‐old participants of this study, and the high prevalence of Alzheimer's pathology in older people without a stated dementia (Savva 2009; Gelber 2012). The DTA may be different in those studies with a younger population.
Strengths and weaknesses of the review
We conducted an extensive, comprehensive, and sensitive literature search, using eleven different electronic databases without any limitation to language. However, we were able to include only three studies with 453 eligible participants, therefore our DTA estimates were relatively imprecise. This paucity of evidence reflected the very significant challenges inherent in conducting long‐term prospective studies of well‐characterised participants, followed up to the point of progression of clinical dementia. The methodological quality assessment and data syntheses were based on the recommended methods (Davis 2013). To increase the reliability of our findings, we included only studies that fulfilled delayed verification of progression from MCI to ADD or other form of dementia (non‐ADD) or any form of dementia at follow‐up.
The included studies did have significant methodological limitations that weakened confidence in the results of this SR. First, considerable uncertainty remained concerning the clinical diagnosis of ADD; the histopathological diagnosis would be the better way to define the diagnosis, but this is not a realistic option for a clinical trial. Second, the three studies lacked information regarding the selection of participants. It was not clear if the reference standard interpretation was made without knowledge of the 18F‐florbetapir PET scan results in two studies, and a major problem in two of the studies was a potential conflict of interest with the company that produced the tracer.
The selection of participants with MCI in these studies could be another weakness, because we did not have all the necessary baseline data to perform risk stratification to detect the MCI subgroup who would progress to ADD. However, this selection of participants such as type of MCI, age, presence of APOE ϵ4 allele, structural abnormality at MRI, hypometabolism at FDG‐PET scan, and alteration in cerebrospinal fluid could help determine different subgroups of people at higher risk of developing dementia at follow‐up, and could enable stratification that could help avoid biases, and develop more efficient studies in the future (Hampel 2012, Caroli 2015, Wolz 2016). In this way, Xu 2016 described a multimodal approach with a 18F‐florbetapir PET scan and 18F‐FDG‐ PET scan, Pascoal 2017 described the combination of p‐tau levels in cerebrospinal fluid with 18F‐florbetapir PET scan status, and in Schreiber 2015, age, sex, educational level, ADAS‐cog at baseline, APOE ϵ4 allele, and 18F‐FDG‐PET scan status were included in the Cox regression model.
Finally, an important weakness of this SR was the nonresponse from the majority of the authors about their studies. This has resulted in a lack of data for analysis in this review.
Applicability of findings to the review question
Regarding the question of this SR:
Could the 18F‐florbetapir PET scan identify those MCI participants who would progress to a clinical dementia at follow up?
There were concerns regarding the applicability of the included participants and setting and in the index test domain in all three studies. In addition, in all three studies, there were concerns regarding the applicability of the reference standard due to the lack of information about the knowledge or not of the index test result to make the diagnosis. There was also lack of information regarding which reference standard was used. In two studies, there were concerns regarding applicability because of potential conflicts of interest. Therefore, due to the limited number of included studies and levels of heterogeneity with respect to the domains mentioned above, it was difficult to determine to what extent the findings from this systematic review could be applied to clinical practice.
The DTA of the 18F‐florbetapir PET scan for identifying Alzheimer’s disease pathology and identifying those people with MCI who would convert to ADD or any form of dementia could be affected by a number of factors that have not been determined so far. The most important, is the lack of a large study to evaluate this question; we included only three studies, two that addressed the progression from MCI to ADD with 448 participants and one that addressed the progression from MCI to any form of dementia with only five participants.
We have to wait for new longer‐term longitudinal studies. The 18F‐florbetapir test is expensive, therefore, we believe it is important to clearly determine its DTA prior to recommending its adoption in clinical practice, because the actual sensitivity and especially the specificity are too low to have enough accuracy to be used in clinical practice to predict the progression from MCI to ADD.

Study flow diagram.
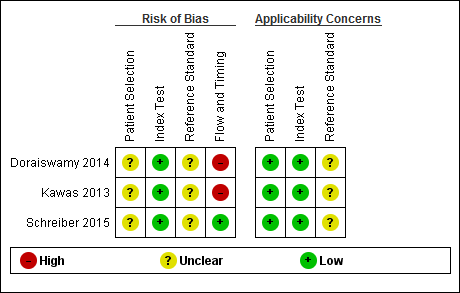
Risk of bias and applicability concerns summary: review authors' judgements about each domain for each included study
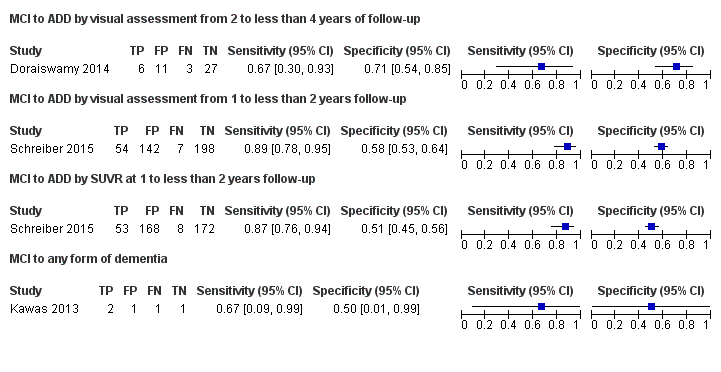
Forest plot of tests: 1 MCI to ADD by visual assessment from 2 to less than 4 years of follow‐up, 2 MCI to ADD by visual assessment from 1 to less than 2 years follow‐up, 3 MCI to ADD by SUVR at 1 to less than 2 years follow‐up, 4 MCI to any form of dementia.

MCI to ADD by visual assessment from 2 to less than 4 years of follow‐up.

MCI to ADD by visual assessment from 1 to less than 2 years follow‐up.

MCI to ADD by SUVR at 1 to less than 2 years follow‐up.

MCI to any form of dementia.
| What is the diagnostic accuracy of 18F‐florbetapir PET amyloid biomarker for predict progression to ADD, any other form of dementia (non‐ADD) or any form of dementia in people with MCI? | |||||||
| Descriptive | |||||||
| Patient population | Participants diagnosed with MCI at time of performing the test using any of the Petersen criteria or Winblad criteria or CDR = 0.5 or any 16 definitions included by Matthews (Matthews 2008). | ||||||
| Sources of referral | Not reported (n = 2) Mixed (memory clinics, newspaper ads, radio, and other public media campaigns) (n = 1) | ||||||
| MCI criteria | ADNI criteria, CDR 0.5 criterion was included (n = 2) CIND (cognitive impairment not dementia) (Matthews 2008) (n = 1) | ||||||
| Sampling procedure | Unclear (n = 3) | ||||||
| Prior testing | The only testing prior to performing the 18F‐florbetapir PET amyloid biomarker was the application of diagnostic criteria for identifying participants with MCI | ||||||
| Settings | Community and institutionalised (n = 1) Not reported (n = 2) | ||||||
| Index test | 18F‐florbetapir PET | ||||||
| Threshold prespecified at baseline | Yes (n = 3) | ||||||
| Threshold interpretation | Visual (n = 3) Quantitative (n = 1) | ||||||
| Threshold | Visual:
SUVR (Standardised Uptake Volume ratio):
| ||||||
| 18F‐florbetapir retention region | Global cortex (n = 1) | ||||||
| Reference Standard | Alzheimer’s disease dementia: NINCDS‐ADRDA (n = 1) Unclear (n = 1) Any form of dementia: DSM‐IV criteria for dementia (n = 1) | ||||||
| Target condition | Progression from MCI to Alzheimer’s disease dementia or any other forms of dementia (non‐ADD) or any form of dementia | ||||||
| Included studies | Prospectively well‐defined cohorts with any accepted definition of MCI (as above). Three studies (N = 458 participants) were included. Number of participants included in analysis: 453. | ||||||
| Quality concerns | The participant selection and reference standard QUADAS‐2 domain: unclear risk of bias. The index test domain: low risk of bias in all three included studies. The flow and timing domain: high risk of bias in the two included studies. Unclear concerns about applicability in the reference standard domain in all three included studies. | ||||||
| Limitations | Limited investigation of heterogeneity and sensitivity analysis due to insufficient number of studies. We were unable to evaluate progression from MCI to any other form of dementia (non‐ADD) due to lack of included studies. | ||||||
| Test | Studies | Cases/Participants | Sensitivity | Specificity | Consequences in a cohort of 100 | ||
| Proportion converting1 | Missed cases2 | Overdiagnosed2 | |||||
| Alzheimer's disease dementia | |||||||
| 18F‐florbetapir by visual assessment from one to less than two years of follow‐up | 1 | 61/401 | 89% (95% CI 78% to 95%) | 58% (95% CI 53% to 64%) | 15 | 2 | 36 |
| 18F‐florbetapir by quantitative assessment from one to less than two years of follow‐up | 1 | 61/401 | 87% (95% CI 76% to 94%) | 51% (95% CI 45% to 56%) | 15 | 2 | 42 |
| 18F‐florbetapir by visual assessment from two to less than four years of follow‐up | 1 | 9/47 | 67% (95% CI 30% to 93%) | 71% (95% CI 54% to 85%) | 19 | 6 | 23 |
| Any form of dementia | |||||||
| 18F‐florbetapir by visual assessment from one to less than two years of follow‐up | 1 | 3/5 | 67% (95% CI 9% to 99%) | 50% (95% CI 1% to 99%) | 60 | 20 | 20 |
| Investigation of heterogeneity and sensitivity analysis: The planned investigations were not possible due to the limited number of studies available for each analysis. | |||||||
| Conclusions:18F‐florbetapir PET scan is not an accurate test for detecting progression from MCI to Alzheimer’s disease dementia or any form of dementia. The strength of the evidence was weak because of considerable variation in study methods, unclear methodological quality due to poor reporting, and high risk of bias due to possible conflict of interest. There is a need for conducting studies using standardised 18F‐florbetapir PET scan methodology in larger populations. | |||||||
| 1. Proportion converting to ADD or any form of dementia in each included study. 2. Missed and overdiagnosed numbers were computed using the proportion converting to the target condition. | |||||||
| Test | No. of studies | No. of participants |
| 1 MCI to ADD by visual assessment from 2 to less than 4 years of follow‐up Show forest plot | 1 | 47 |
| 2 MCI to ADD by visual assessment from 1 to less than 2 years follow‐up Show forest plot | 1 | 401 |
| 3 MCI to ADD by SUVR at 1 to less than 2 years follow‐up Show forest plot | 1 | 401 |
| 4 MCI to any form of dementia Show forest plot | 1 | 5 |